fidelity of implementation in three sequential curricular
TRANSCRIPT
Songer and Gotwals April 3, 2005
1
Fidelity of Implementation in Three Sequential Curricular Units
Nancy Butler Songer and Amelia Wenk GotwalsSchool of Education
The University of [email protected]
Paper presented at the Annual Meeting of the American Education Research Association,Montreal, Canada
In 56.021 Fidelity of Implementation in Quasi-Experimental Designs: Four Studies ofScience Curriculum Materials and Diversity
This work is funded in part by the National Science Foundation 0089283 and 0129331.The views and opinions expressed do not necessarily represent the Foundation. Many thanks
to Michelle Astolfi, Phil Meyers and the entire BioKIDS Research Group.

Songer and Gotwals April 3, 2005
2
Songer and Gotwals April 3, 2005
3
Introduction:Recently many influential publications including National Science Education
Standards (National Research Council, 1995) and Benchmarks for Science Literacy(American Association for the Advancement of Science, 1993) have strongly endorsedinquiry-based science teaching and learning. These publications have laid outguidelines to successfully implement the changes that they suggest will improvestudents’ understandings of science. In keeping with these suggestions, several researchgroups have created, piloted, and implemented curricular programs in schools in thehopes of increasing students’ science content understanding as well as their complexreasoning skills (e.g. BioKIDS: Kids Inquiry of Diverse Species and KGS: Kids asGlobal Scientists). However, even when these programs are adopted by schoolssystems the implementation of the curricula looks very different from classroom toclassroom. Accounting for and measuring these differences is very important whenexamining student learning. In this paper, we will define how we measure the fidelityof implementation of our curricular units in Detroit Public Schools and howdifferences of fidelity to the curriculum influence student learning.
Theoretical Framework:Importance of Inquiry
Before examining fidelity to inquiry-based curricular programs, it is importantunderstand the phenomenon of inquiry itself and why it is important in scienceeducation.
Scientific inquiry refers to the diverse ways in which scientists study thenatural world and propose explanations based on the evidence derived fromtheir work. Inquiry also refers to the activities of students in which theydevelop knowledge and understanding of how scientists study the naturalworld. (National Research Council, 1995)
The process of inquiry is modeled on the scientist's method of discovery. This viewrepresents science as a constructed set of theories and ideas based on the physicalworld, rather than as a collection of irrefutable, disconnected facts. It focuses onasking questions, exploring these questions, considering alternative explanations, andweighing evidence. Part of why inquiry is important is because it can provide studentswith “real” science experiences, e.g. experiences with many important features ofscience as practiced by professional scientists (Brown, Collins, & Duguid, 1989).
Inquiry learning often emphasizes experiences with fundamental scientificphenomena through direct experience with materials; by consulting books, resources,and experts; and debate among participants (National Research Council, 2000).Inquiry-based learning goals emphasize high expectations including understandingbeyond simple recall of information. Students are expected to reason with scientificknowledge through activities such as formulating explanations, creating hypotheses,
Songer and Gotwals April 3, 2005
4
making predictions, and interpreting data. Various inquiry methods have been shownto encourage the inclusion of all students in science classrooms and to promote greaterstudent achievement gains in both scientific content and inquiry knowledge (Krajcik etal., 1998; Mistler-Jackson & Songer, 2000; Songer, Lee, & McDonald, 2003; White &Frederiksen, 1998). In inquiry-based science programs, students do not just memorizescientific facts; they are exposed to the whats, hows, and whys of science. For thesereasons and others, the National Science Education Standards state that, “Inquiry intoauthentic questions generated from student experiences is the central strategy forteaching science.” (National Research Council, p. 31)
Fidelity of ImplementationAll curricular units are created with theories of learning, teaching and assessing
in mind, and our inquiry-based curricula are no exception. However, even when giventhe same exact curriculum, the way in which teachers enact the curriculum will bevastly different depending on many criteria including among others the resources theyhave and their personal teaching style. Examining the extent to which teachers enactthe curriculum in line with how the curriculum was meant to be enacted is importantfor both program evaluation as well as evaluation of student learning. “Fidelity maybe defined as the extent to which delivery of an intervention adheres to the protocol orprogram model originally developed” (Mowbray, Holter, Teague, & Bybee, 2003). Inorder to examine fidelity of implementation, there are three main categories toexamine in discussing fidelity of implementation: structure (adherence to the unit,exposure, and program differentiation), process (quality of delivery), and self-perceivedeffects by participants (Lynch, 2005).
Structure refers to the underlying theories used to create the unit. In order tomeasure structure we can examine three main criteria. First, we can examine ateacher’s adherence to the unit – whether the unit was delivered consistently with howit was designed or written. Secondly, we can examine exposure to the unit – thenumber of lessons implemented, the length of time given to each lesson, and types ofskills emphasized in each lesson. Finally, in measuring structure, we can examineprogram differentiation – the extent to which the innovative program differs from thetraditional or standard program (Lynch, 2005). For our curricula, we focus on themeasurement of structure in our definition of fidelity. In particular, we documenthow many lessons and student worksheets associated with these lessons teachers enactin their classrooms. These lessons are inquiry-based, often involve the use ofinnovative technology, and have students working with data that they collect. Theselessons are very different from the standard curriculum that other teachers in thisdistrict use, which tend to focus on reading the textbook and having students doworksheets that involve filling in the blanks and/or doing activities like crosswordpuzzles or word searches. While we do not directly measure teachers’ adherence to theunit, the structure of the lessons and associated worksheets lends themselves to acertain type of learning that is very different from the traditional curriculum and thuswe believe that we can use worksheet implementation as a good measure of fidelity tothe curriculum.

Songer and Gotwals April 3, 2005
5
Process refers to the quality of delivery of the program, compared with theintended delivery. In order to measure process, the method in which the teacherimplements the unit must be observed and studied. For our curricular units, graduatestudents visit classrooms on a weekly basis and work with teachers in implementingthe curricula in the way in which they were intended. Again, we do not have a directmeasure of “process;” however, we believe that the weekly classroom support that theteachers get along with the regular professional development associated with theprograms leads the teachers to implementing the curriculum in a relatively faithfulway. Finally, fidelity can be measured by examining the self-perceived effects by theparticipants/students. This shows the extent to which students are given a sense ofagency in their own learning and the extent to which the teacher does or does notassume a transmission model of teaching (Lynch, 2005). This can be measured thoughlooking at the extent of student engagement. The way in which our worksheets andlessons are structured leads students to take a large part in their own learning. In thebiodiversity curriculum, students are responsible for gathering data about a specificpart of their schoolyard. If they do not do a good job in collecting their data, then thewhole class will have a hard time answering one of the driving questions, “What areaof my schoolyard has the most biodiversity?” If teachers are implementing the lessonsusing the associated worksheets, then students will be given the opportunity to collectdata, use data as evidence in creating explanations of phenomena, and discussing andsharing these explanations with their teacher and peers. Thus, we believe thatworksheet implementation is a good measure of fidelity to the curricular units that weare working with.
While our measure of fidelity does not directly measure all three characteristicsspecified, it does give us a good working definition with which to examine our dataand look at how fidelity of implementation influences student learning. “Theappropriate use of fidelity criteria can assist program evaluation designs, with orwithout RCTs (Randomized Clinical Trials), to contribute to establishing theevidence-base for any program” (Mowbray et al., 2003).
Study Design:The Three Curricular Programs
BioKIDS: Kids’ Inquiry of Diverse Species (Songer, 2000) is an IERI-fundedproject whose goals include the study of the longitudinal development of students’content and inquiry knowledge acquisition as they participate in several inquiry-basedcurricular units. In particular, we have developed a series of three sixth grade inquiry-based science curricular units. Each of the curricular units is designed to be eightweeks long and comes with a teacher guide, student worksheets, and classroomsupport throughout the year. In addition to classroom support, teachers are given theopportunity to attend a weeklong summer workshop as well as monthly professionaldevelopment training sessions. The initial eight-week curriculum focuses onbiodiversity content, the second unit focuses on weather content and the third focuseson simple machines. In each of these curricula, particular inquiry thinking skills are

Songer and Gotwals April 3, 2005
6
fostered through carefully scaffolded activity sequences (Huber, Songer, & Lee, 2003).In particular, the curricula focus on scaffolding students’ development of scientificexplanations using evidence. Lee (2002) found that although scaffolds are meant tofade, fifth grade students who had constant scaffolding of explanation buildingperformed better than their peers who had fading scaffolds – suggesting that at this age,inquiry skills are still difficult enough that students need to have support in this aspectof inquiry. For many students, the biodiversity curriculum will be their first forayinto inquiry-based science learning. Therefore, we maintained constant scaffoldsthroughout the year. In addition, as we expect that the development of complexreasoning takes time, we worked with assessment specialists on the PADI (PrincipledAssessment Designs for Inquiry) team to create an assessment system that could assessbeginning, intermediate, and complex levels of reasoning tasks (Songer & Wenk, 2003).We wanted to be able to see students’ progression through both a single curricular unitas well as across curricular units and determine their level of reasoning ability at eachstage. The specifics of this system are summarized below and discussed at length inour other papers (i.e. Gotwals & Songer, 2004; Songer & Wenk, 2003).
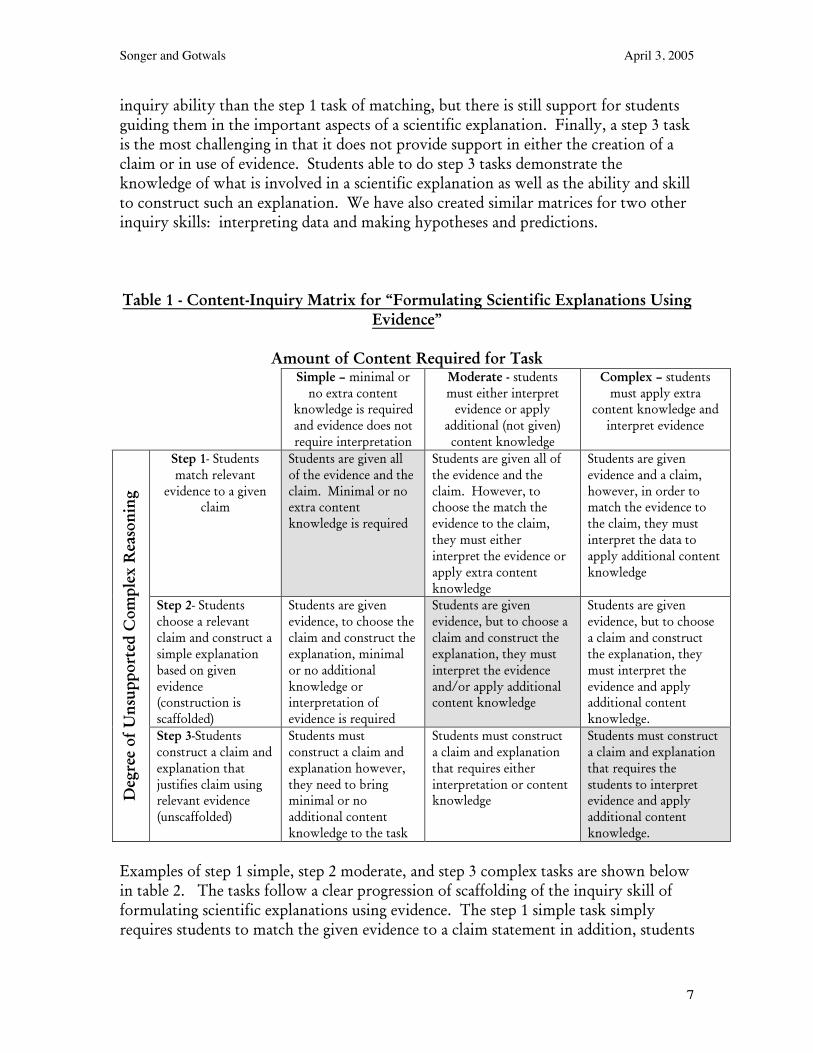
Content-Inquiry MatrixAs inquiry in the classroom can take various forms and can occur at many
different levels (Songer et al., 2003), it is important to develop tasks specificallyoriented to different levels of complexity to accurately evaluate students’ developingabilities over time. In our project, we conceptualize the difficulty of science inquiryassessment tasks as having two dimensions: the difficulty of the science content and thedifficulty of the science inquiry. To address both of these aspects of task difficulty, wecreated a matrix that lays out three possible levels for each dimension (see table 1).First we classified science content knowledge into: simple – meaning that most contentis provided by the task; moderate – meaning that students need a solid understandingof the underlying scientific concepts; and complex – meaning that students need notonly an understanding of concepts, but also be able to link different concepts together.
Secondly, we focused on three separate inquiry skills that are fostered in allthree curricular units: formulating scientific explanations, interpreting data, andmaking hypotheses and predictions. Once we examined these inquiry skills, weseparated inquiry into three levels: step1, step 2, and step 3. While the content aspectof the matrix can remain the same or very similar for all aspects of inquiry, the levelsof inquiry will vary due to the inherently different nature of the three aspects ofinquiry being targeted. For the skill of formulating scientific explanations, weborrowed from our curricular units and created degrees of inquiry tasks based on theamount of support or scaffolding the task provides for explanation formation. Step 1tasks provide evidence and a claim, and students simply need to match the appropriateevidence to the claim (or vise versa). While this only measures a low level of inquiry,specifically the ability to match relevant evidence to a claim (or a claim to givenevidence), this is still an important step in students’ development process. A step 2task involves a scaffold that provides students with a choice of claims, and thenprompts them to provide evidence to back up their choice. This involves more
Songer and Gotwals April 3, 2005
7
inquiry ability than the step 1 task of matching, but there is still support for studentsguiding them in the important aspects of a scientific explanation. Finally, a step 3 taskis the most challenging in that it does not provide support in either the creation of aclaim or in use of evidence. Students able to do step 3 tasks demonstrate theknowledge of what is involved in a scientific explanation as well as the ability and skillto construct such an explanation. We have also created similar matrices for two otherinquiry skills: interpreting data and making hypotheses and predictions.
Table 1 - Content-Inquiry Matrix for “Formulating Scientific Explanations UsingEvidence”
Amount of Content Required for TaskSimple – minimal or
no extra contentknowledge is requiredand evidence does notrequire interpretation
Moderate - studentsmust either interpret
evidence or applyadditional (not given)content knowledge
Complex – studentsmust apply extra
content knowledge andinterpret evidence
Step 1- Studentsmatch relevant
evidence to a givenclaim
Students are given allof the evidence and theclaim. Minimal or noextra contentknowledge is required
Students are given all ofthe evidence and theclaim. However, tochoose the match theevidence to the claim,they must eitherinterpret the evidence orapply extra contentknowledge
Students are givenevidence and a claim,however, in order tomatch the evidence tothe claim, they mustinterpret the data toapply additional contentknowledge
Step 2- Studentschoose a relevantclaim and construct asimple explanationbased on givenevidence(construction isscaffolded)
Students are givenevidence, to choose theclaim and construct theexplanation, minimalor no additionalknowledge orinterpretation ofevidence is required
Students are givenevidence, but to choose aclaim and construct theexplanation, they mustinterpret the evidenceand/or apply additionalcontent knowledge
Students are givenevidence, but to choosea claim and constructthe explanation, theymust interpret theevidence and applyadditional contentknowledge.
Deg
ree
of U
nsup
port
ed C
ompl
ex R
easo
ning
Step 3-Studentsconstruct a claim andexplanation thatjustifies claim usingrelevant evidence(unscaffolded)
Students mustconstruct a claim andexplanation however,they need to bringminimal or noadditional contentknowledge to the task
Students must constructa claim and explanationthat requires eitherinterpretation or contentknowledge
Students must constructa claim and explanationthat requires thestudents to interpretevidence and applyadditional contentknowledge.
Examples of step 1 simple, step 2 moderate, and step 3 complex tasks are shown belowin table 2. The tasks follow a clear progression of scaffolding of the inquiry skill offormulating scientific explanations using evidence. The step 1 simple task simplyrequires students to match the given evidence to a claim statement in addition, students

Songer and Gotwals April 3, 2005
8
are not required to bring any content knowledge to the question, all of thisinformation is provided. The step 2 moderate task guides students in choosing a claimand then prompts them to provide evidence to back up their claim.
Table 2: BioKIDS Questions Mapped to the Level of the “Formulating ScientificExplanations Using Evidence” Design Pattern
Question Step and ComplexityLevel
A biologist studying birds made the following observations about thebirds. She concluded the birds would not compete for food.
Bird Food Feeding Where they feedBird 1 berries dawn/dusk trees, middleBird 2 berries dawn/dusk trees, lowerBird 3 berries dawn/dusk trees, upper
What evidence supports her conclusion?a. Insects are plentifulb. They feed at different timesc. They feed in different parts of the treesd. They lay eggs at different times
Step 1, Simple
Shan and Niki collected four animals from their schoolyard. They dividedthe animals into Group A and Group B based on their appearance asshown below:Group A: Group B:
They want to place this fly in either Group A or Group B.Where should this fly be placed?
A fly should be in Group A /Group B Circle one
Name two physical characteristics that you used when you decided toplace the fly in this group:(a)(b)
Step 2, Moderate

Songer and Gotwals April 3, 2005
9
10. …If all of the small fish in the pond system died one year from a diseasethat killed only the small fish, what would happen to the algae in the pond?Explain why you think so.
11. What would happen to the large fish? Explain why you think so.(From NAEP assessment)
Step 3, Complex
PopulationAs a part of the LeTUS group (Learning Technologies in Urban Schools), we
work closely with the Detroit Public School system in helping to implement reform-based science curricula in the middle schools. Detroit Public Schools is a large districtwith a high percentage of ethnic minorities (~98%) and a high percentage of studentsfrom low-income households (over 70% of district students qualify for free or reducedlunch). As a large urban district, Detroit contains a range of school culture andpopulations that represent various challenges to curricular reform (Songer, Lee, &Kam, 2002). In Fall 2003, about 2,000 sixth grade students from sixteen Detroit publicschools participated in the BioKIDS curricula. Twenty-three teachers with a range ofexperience and expertise taught the students. Students took both a pre and posttest foreach curricula made up of questions ranging in complexity of content as well asinquiry. In addition, graduate student researchers kept track of how much of thecurriculum teachers completed.
Methods:In each curricular unit, there was a range in the amount of student worksheets
teachers implemented. There were a number of teachers in each curricular unit whoimplemented almost the entire curriculum, a few who implemented about half of theof the given curriculum and other teachers who implemented a smaller portion of thedifferent curricula. In order to see the influence of amount of curricularimplementation on student learning, we first examined the distribution of teachers

Songer and Gotwals April 3, 2005
10
along this measure of fidelity of implementation. Not surprisingly, the distributionwas highly negatively skewed in each of the curricula, with most teachersimplementing a large number of worksheets. We attempted to transform the variable,however, no transformations yielded a normal distribution. Therefore we could notuse percent implementation as a continuous variable in any analysis, so we created twogroups of teachers for each curricular unit – a high fidelity group (high amount ofimplementation of student worksheets) and a low fidelity group (low amount ofimplementation of student worksheets). Then we examined the differences in thepercent of implementation of curricular worksheets to ensure that there weresignificant differences between the two groups in both percent implementation as wellas in posttest scores. Table 3, below, shows the demographics of each group ofstudents. It is clear to see that the two populations in each of the three curricula arevery similar, with the greatest discrepancies being that the high fidelity group tends tohave more students who speak a language other than English at home.
Table 3: Descriptive Characteristics of Students in High and Low Fidelity ofImplementation Groups
Female Minority Language other thanEnglish spoken at home
Biodiversity highFidelity
52% 94% 21%
Biodiversity lowfidelity
50% 94% 17%
Weather highfidelity
50% 94% 42%
Weather lowfidelity
51% 94% 17%
Simple Machineshigh fidelity
46% 96% 25%
Simple Machineslow fidelity
52% 94% 19%
Then, to examine the effects of implementation on student learning, weconducted several multiple regressions. Multiple regression analysis is a method forstudying the relation between a dependent variable (in our case posttest scores) andtwo or more independent variables (Shavelson, 1996). Multiple regression allows us topredict the dependent variable from a set of predictor variables or show how certaincriteria influence the dependent variable. In our case, we are interested in seeingwhether fidelity of implementation influences students’ scores on the posttest, holdingthe pretest as constant (covariate).
Songer and Gotwals April 3, 2005
11
We conducted four series of regressions. Each series contained threeregressions, using the three different curricular unit posttest measures as dependentvariables and pretest scores and fidelity (high or low) as predictors. In the first series,we used the whole posttest score (standardized) as the dependent measure and thewhole pretest score (standardized) as one of the predictors. In the following threeseries, we split the test items up by their complexity levels (step 1, step 2, and step 3),and ran regressions using the complexity posttest measure (standardized) as thedependent variable and used the complexity level pretest measure (standardized) as oneof the predictors. In all regressions we also used the dummy fidelity variables aspredictors.
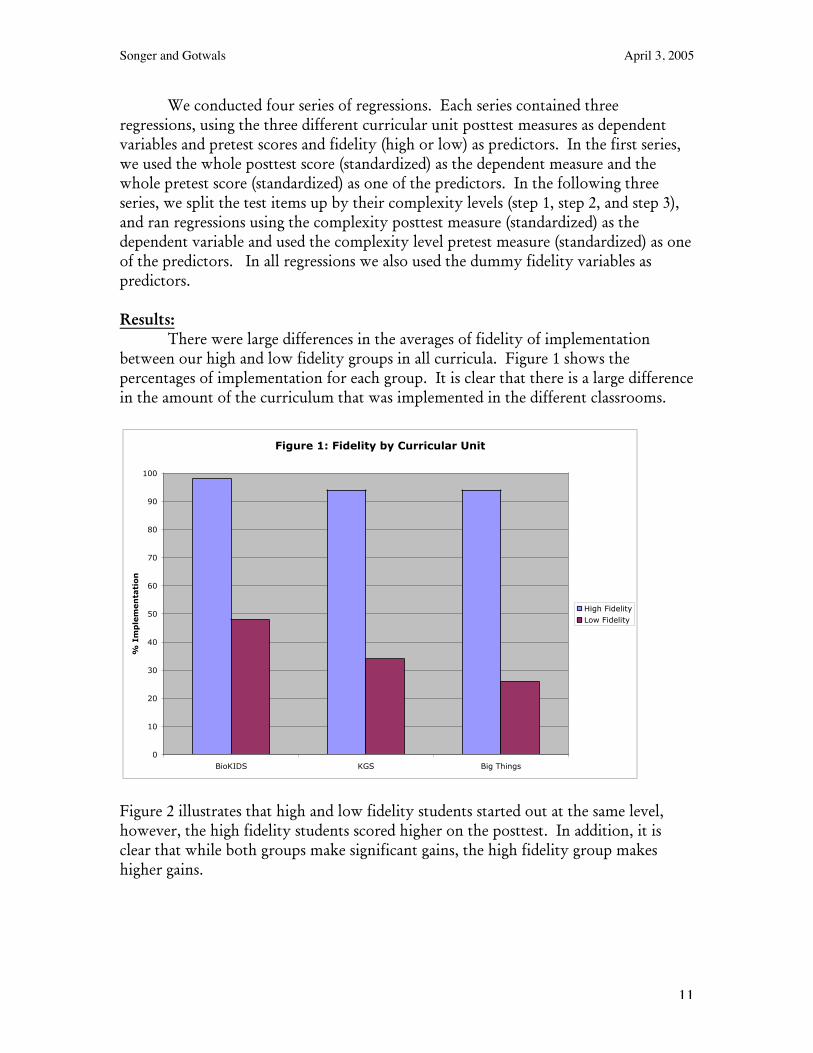
Results:There were large differences in the averages of fidelity of implementation
between our high and low fidelity groups in all curricula. Figure 1 shows thepercentages of implementation for each group. It is clear that there is a large differencein the amount of the curriculum that was implemented in the different classrooms.
Figure 1: Fidelity by Curricular Unit
0
10
20
30
40
50
60
70
80
90
100
BioKIDS KGS Big Things
% I
mp
lem
en
tati
on
High FidelityLow Fidelity
Figure 2 illustrates that high and low fidelity students started out at the same level,however, the high fidelity students scored higher on the posttest. In addition, it isclear that while both groups make significant gains, the high fidelity group makeshigher gains.

Songer and Gotwals April 3, 2005
12
Figure 2: Comparison of High and Low Fidelity Students on Biodiversity pre/posttest
0
10
20
30
40
50
60
Pretest Posttest
Nu
mb
er
Co
rrect
High Fidelity Low Fidelity
Figure 3 separates out how students did by complexity levels. Again, all students makesignificant gains from pre to posttest, but that students in high fidelity classroomsmake the highest gains. In addition, these gains are more pronounced at the step 3level where unscaffolded complex reasoning is involved.
Figure 3: Comparison of High and Low Fidelity Students by Complexity Level
0
10
20
30
40
50
60
70
80
90
Step 1Simple
(pretest)
Step 1Simple
(posttest)
Step 2Moderate(pretest)
Step 2moderate(posttest)
Step 3Complex(pretest)
Step 3Complex(posttest)
% C
orr
ect
High Fidelity
Low Fidelity
Regression Analyses:Table 4 shows the first series of regressions using each curricular full test as the
dependent variable. Regression 1 in this series examines the effect of implementationon learning in the biodiversity curriculum. Not surprisingly, the pretest is the greatest

Songer and Gotwals April 3, 2005
13
predictor of posttest score (p<0.001). This is the case in all of our regressions.Students who tend to score well on the pretest also tend to score high on the posttest.This result basically says that students at the top of the class at the pretest also tend tobe at the top of the class at the posttest and similarly for students at the low end. Sincethis result stays the same throughout our entire analysis and because it is not animportant finding for this particular paper, we will not discuss it further. Of moreinterest for this paper is that students in classes with a high fidelity of implementationscore higher on the posttest than students in low fidelity classrooms (p<0.01).Because we have accounted for the pretest in this regression model, we can say thatstudents in high fidelity classrooms learned more than their counterparts in lowfidelity classrooms, as measured by our test. R2 provides an index of the proportion ofvariation in the dependent variable that can be accounted for by the set of predictors(Shavelson, 1996). This model accounts for about 68% of the total variation in theposttest variable. This is a good proportion of variance for a model with only twopredictors. Clearly the pretest accounts for a large portion of that variance, but thefidelity of implementation also plays a large role in determining how well studentsscore on the posttest.
The second regression in this series examines the effects of the weather pretest,weather curriculum fidelity, and biodiversity curriculum fidelity on the weatherposttest. In this model, again the pretest is a good predictor of posttest score(p<0.001). Not entirely surprising in this model, fidelity of implementation of thebiodiversity unit is a not a good predictor of student learning in the weather unit.However, students in classes with a high fidelity of implementation of the weathercurriculum learned more in the weather unit than students who were in low fidelityclassrooms (p<0.05). In the third regression of this series, an interesting result occurs.Not surprisingly, again the pretest is a good predictor of the posttest score (p<0.001)and students in classes with a high fidelity of implementation of the simple machinesunit tend to learn more than students in classes with a low fidelity of implementation(p<0.05). However, what is very interesting is that students in classes with a highfidelity of implementation of the biodiversity curriculum learned more in the simplemachines unit than those students who had a low implementation of the biodiversityunit (p<0.01). As will be discussed in the conclusions, this shows a lasting effect ofthe learning that occurred in the biodiversity curriculum on the simple machinesposttest. In both of these last models, the amount of variance accounted for is between42% and 46%, which is less than the first model, but is still an impressive amount ofvariance only taking into account pretest and implementation fidelity.
Table 4: First Regression Series – Results of Learning Using the Full Test as theDependent Variable
IndependentVariable
Regression 1:Biodiversity
(N=1850)
Regression 2:Weather(N=1151)
Regression 3:Simple Machines
(N=804)
Songer and Gotwals April 3, 2005
14
Curricular Pretest 0.664*** 0.649*** 0.615***Full BiodiversityImplementation (ascompared to partialimplementation)
0.107** 0.051NS 0.103**
Full WeatherImplementation (ascompared to partialimplementation)
0.083* 0.02 NS
Full SimpleMachinesImplementation (ascompared to partialimplementation)
0.075*
R2 Value 0.684 0.460 0.422NS Not significant*p<0.05**p<0.01*** p<0.001
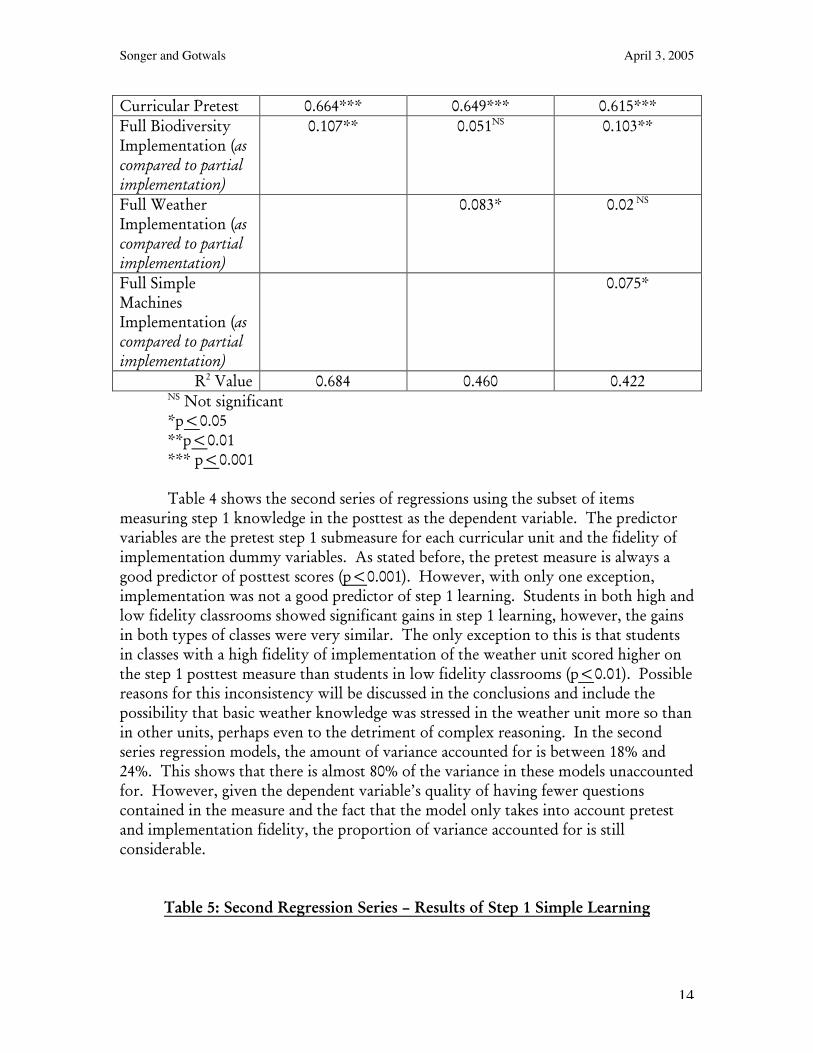
Table 4 shows the second series of regressions using the subset of itemsmeasuring step 1 knowledge in the posttest as the dependent variable. The predictorvariables are the pretest step 1 submeasure for each curricular unit and the fidelity ofimplementation dummy variables. As stated before, the pretest measure is always agood predictor of posttest scores (p<0.001). However, with only one exception,implementation was not a good predictor of step 1 learning. Students in both high andlow fidelity classrooms showed significant gains in step 1 learning, however, the gainsin both types of classes were very similar. The only exception to this is that studentsin classes with a high fidelity of implementation of the weather unit scored higher onthe step 1 posttest measure than students in low fidelity classrooms (p<0.01). Possiblereasons for this inconsistency will be discussed in the conclusions and include thepossibility that basic weather knowledge was stressed in the weather unit more so thanin other units, perhaps even to the detriment of complex reasoning. In the secondseries regression models, the amount of variance accounted for is between 18% and24%. This shows that there is almost 80% of the variance in these models unaccountedfor. However, given the dependent variable’s quality of having fewer questionscontained in the measure and the fact that the model only takes into account pretestand implementation fidelity, the proportion of variance accounted for is stillconsiderable.
Table 5: Second Regression Series – Results of Step 1 Simple Learning

Songer and Gotwals April 3, 2005
15
IndependentVariable
Regression 1:Biodiversity
(N=1850)
Regression 2:Weather(N=1151)
Regression 3:Simple Machines
(N=804)Curricular Pretest –step 1 submeasure
0.463*** 0.395*** 0.457***
Full BiodiversityImplementation (ascompared to partialimplementation)
0.003 NS 0.062NS 0.063 NS
Full WeatherImplementation (ascompared to partialimplementation)
0.125** 0.050 NS
Full SimpleMachinesImplementation (ascompared to partialimplementation)
0.037 NS
R2 Value 0.214 0.185 0.235NS Not significant**p<0.01*** p<0.001
Table 6 shows the third series of regressions using the subset of posttest itemsmeasuring step 2 knowledge as the dependent variable. The predictor variables are thepretest step 2 submeasure and the fidelity of implementation variables. As statedbefore, the pretest measure is always a good predictor of posttest scores (p<0.001).Interestingly in these models, students in classrooms with a high fidelity ofimplementation in the biodiversity unit, score significantly higher on step 2 posttestmeasures in all curricula than their counterparts (biodiversity: p<0.05; weatherp<0.01; simple machines p<0.001), showing the lasting effect of this curriculum thatwas present in the whole test regression analysis. However, the fidelity ofimplementation in the weather unit is not a good predictor of posttest scores in theweather unit or the simple machines unit and fidelity of implementation in the simplemachines unit is not a good predictor of posttest scores in the simple machines unit.Possible reasons for these trends will be further analyzed in the conclusion. In thethird series regression models, the amount of variance accounted for is between 22%and 53%. The amount of variance accounted for in these models varies widely.However, as stated above, given the fact that the model only takes into account pretestand implementation fidelity, the proportion of variance accounted for is stillsubstantial.
Table 6: Third Regression Series – Results of Step 2 Moderate Learning

Songer and Gotwals April 3, 2005
16
IndependentVariable
Regression 1:Biodiversity
(N=1850)
Regression 2:Weather(N=1151)
Regression 3:Simple Machines
(N=804)Curricular Pretest–step 2 submeasure
0.631*** 0.423*** 0.463***
Full BiodiversityImplementation (ascompared to partialimplementation)
0.084* 0.132** 0.155***
Full WeatherImplementation (ascompared to partialimplementation)
0.004 NS 0.015 NS
Full SimpleMachinesImplementation (ascompared to partialimplementation)
0.01 NS
R2 Value 0.414 0.221 0.524NS Not significant*p<0.05**p<0.01*** p<0.001
Table 7 shows the fourth series of regressions using the subset of posttest itemsmeasuring step 3 knowledge as the dependent variable. The predictor variables are thepretest step 3 submeasure and the fidelity of implementation dummy variables. Onceagain, the pretest measure is a good predictor of posttest scores (p<0.001). Aninteresting pattern emerges with the step 3 data. Classes who had a high fidelity ofimplementation of biodiversity unit tended to score higher on step 3 aspects of allcurricular posttest measures than students who were in low fidelity biodiversityclassrooms (biodiversity: p<0.001; weather p<0.07; simple machines p<0.001).Students in classes with a high fidelity of implementation in the weather unit did nothave any advantage over students in low fidelity classrooms on either the step 3weather knowledge items or the step 3 simple machines knowledge items. Studentswho were in high fidelity of implementation classrooms for the simple machines unitscored higher on the simple machines step 3 posttest measure than those students inlow fidelity classrooms (p<0.07). Possible reasons for these results are discussed in theconclusions and include the possibility that both the first and third curricular unitsfostered complex reasoning well, whereas the weather unit may have emphasized basiccontent knowledge. The models in the fourth regression series account for between26% and 46% of the variance in the dependent variable. As before, there is still a large

Songer and Gotwals April 3, 2005
17
amount of variance unaccounted for, but these models show that fidelity ofimplementation still plays a role in determining posttest measures in many cases.
Table 7: Fourth Regression Series – Results of Step 3 Complex Learning
IndependentVariable
Regression 1:Biodiversity
(N=1850)
Regression 2:Weather(N=1151)
Regression 3:Simple Machines
(N=804)Curricular Pretest–step 3 submeasure
0.647*** 0.538*** 0.456***
Full BiodiversityImplementation (ascompared to partialimplementation)
0.119*** 0.072 ~ 0.149***
Full WeatherImplementation (ascompared to partialimplementation)
0.045NS 0.011NS
Full SimpleMachinesImplementation (ascompared to partialimplementation)
0.079 ~
R2 Value 0.454 0.313 0.267NS Not significant*** p<0.001~ p<0.07
Sample Explanations
Conclusions:Clearly how much and in what way teachers implement curricular units plays a
large role in the learning that takes place. Using our measure of fidelity as the amountof student worksheets implemented, it is clear that students in high fidelity classroomsmake larger gains from pre to posttest than their peers in low fidelity classrooms.However, fidelity to the curriculum impacts different levels of learning in differentways. In particular, the fidelity of implementation of our inquiry-based curricula isnot a good predictor of step 1, “lower level.” learning. Students in both the high andlow fidelity classrooms make similar gains from pre to posttest, showing that whetherstudents are exposed to our inquiry-based curricula or if they are taught the materialusing the traditional curriculum (generally through reading a textbook) does not makea large difference in learning basic science concepts. The one exception to this is theweather unit where fidelity of implementation does make a large difference and
Songer and Gotwals April 3, 2005
18
students in high fidelity classrooms show larger gains from pre to posttest. Possiblereasons for this are that the way in which student worksheets were implemented mayhave stressed basic conceptual knowledge and thus high fidelity students have a bettergrasp of the basics than students in low fidelity classrooms.
This explanation for the weather unit’s “discrepancies” seems even more likelywhen we examine the gains in step 3 learning. While everyone improves in step 3learning, students in high fidelity classrooms make larger gains from pre to posttestthan students in low fidelity classrooms. This shows that students in high fidelityclassrooms not only learn the basic science concepts, but also learn how to reason withthese concepts in complex scientific situations. The exception to this again is theweather unit. Although students in high fidelity classrooms were exposed to a largenumber of worksheets, the material may have been presented in a manner such thatbasic science conceptual knowledge was stressed rather than more complex reasoningwith this knowledge. In addition, students’ learning in the weather unit wasinterrupted by two school vacations and teachers were rushed to finish this unit so thatthey could move on to the simple machines unit. Thus while some teachers may havegiven students the worksheets, they may not have taken the time to implement themproperly and so been almost “artificially” placed in the high fidelity group.
Finally, a very interesting pattern emerges with respect to the “lasting effect” ofhigh fidelity of implementation to the first curricular unit on biodiversity on futurelearning. Fidelity of implementation to the biodiversity unit influences some form offuture learning in both subsequent curricular units. There are many reasons why thismay be the case. The biodiversity unit is very well constructed and has strongscaffolds to support students’ developing complex reasoning. It is possible thatstudents who are in high fidelity classrooms are able to gain a very strong base ofknowledge and skill in complex reasoning tasks such as building explanations thatcarries over to the following units. Although more research needs to be done toconfirm a “carry-over effect,” if it is the case, then it shows the extreme importance ofmaking students’ first foray into science inquiry learning a strong experience. Inaddition, it makes it clear that units need to be constructed well and teachers need tobe given the support that they need in order to implement these units with the highestfidelity possible so that students can develop a base on which to build future sciencecomplex learning.

Songer and Gotwals April 3, 2005
19
Works Cited:American Association for the Advancement of Science. (1993). Benchmarks for Science
Literacy. New York: Oxford University Press.Brown, J. S., Collins, A., & Duguid, P. (1989). Situated cognition and the culture of
learning. Educational Researcher, 18(1), 32-41.Gotwals, A. W., & Songer, N. B. (2004). A Systematic Scheme for Measuring Inquiry
Skills across Curricular Units. Paper presented at the Paper presented at theAmerican Educational Research Association (AERA) annual meeting, SanDiego, CA.
Huber, A. E., Songer, N. B., & Lee, S.-Y. (2003, April). A Curricular Approach toTeaching Biodiversity through Inquiry in Technology-Rich Environments. Paperpresented at the Annual meeting of the National Association of Research inScience Teaching (NARST), Philadelphia.
Krajcik, J., Blumenfeld, P., Marx, R., Bass, K. M., Fredericks, J., & Soloway, E. (1998).Middle School Students' Initial Attempts at Inquiry in Project-Based ScienceClassroom. The Journal of the Learning Sciences, 7(3 & 4), 313-350.
Lynch, S. (2005). Fidelity of implementation in implementation and scale-up researchdesigns: Applications from 4 studies of innovative curriculum materials and diversepopulations. Paper presented at the American Educational Research Association(AERA), Montreal, CA.
Mistler-Jackson, M., & Songer, N. B. (2000). Student motivation and internettechnology: Are students empowered to learn science? Journal of Research inScience Teaching, 37(5), 459-479.
Mowbray, C. T., Holter, M. C., Teague, G. B., & Bybee, D. (2003). Fidelity Criteria:Development, Measurement, and Validation. American Journal of Evaluation,24(3), 315-340.
National Research Council. (1995). National Science Education Standards. Washington,DC: National Research Council.
National Research Council. (2000). Inquiry and the National Science EducationStandards: A Guide for Teaching and Learning. Washington, D.C.: NationalResearch Council.
Shavelson, R. J. (1996). Statistical Reasoning for the Behavioral Sciences (third edition).Boston, MA: Allyn and Bacon.
Songer, N. B., Lee, H.-S., & Kam, R. (2002). Technology-rich inquiry science in urbanclassrooms: What are the barriers to inquiry pedagogy? Journal of Research inScience Teaching, 39(2), 128-150.
Songer, N. B., Lee, H.-S., & McDonald, S. (2003). Research Towards an ExpandedUnderstanding of Inquiry Science Beyond One Idealized Standard. ScienceEducation, 87(4), 490-516.
Songer, N. B., & Wenk, A. (2003, April 25, 2003). Measuring the Development ofComplex Reasoning in Science. Paper presented at the AERA (AmericanEducation Research Association), Chicago, IL.
White, B., & Frederiksen, J. R. (1998). Inquiry, Modeling, and Metacognition: MakingScience Accessible to All Students. Cognition and Instruction, 16(1), 3-118.

Songer and Gotwals April 3, 2005
20