field procedures manual - montana deq€¦ · water quality planning bureau field procedures manual...
TRANSCRIPT

WQPBWQM-020 Version 3.2
Water Quality Planning Bureau Field Procedures Manual for Water Quality Assessment Monitoring
North Fork Little Boulder River, Beaverhead-Deerlodge National Forest (Photo taken by Kathryn Makarowski, Montana DEQ, 2010)
February 2012 Prepared by: Water Quality Planning Bureau, Monitoring and Assessment Section Montana Department of Environmental Quality Water Quality Planning Bureau 1520 E. Sixth Avenue P.O. Box 200901 Helena, MT 59620-0901

Suggested citation: Montana Department of Environmental Quality. 2012. Water Quality Planning Bureau Field Procedures Manual For Water Quality Assessment Monitoring Version 3.0. Helena, MT: Montana Dept. of Environmental Quality.
VERSION HISTORY
Version No.
Date Modified By Sections Modified
Description of Changes
2 4/21/05 R. Sada, M. Bostrom
All The Field Procedures Manual was developed to describe the procedures that correlated with the DEQ Quality Assurance Project Plan (QAPP) for Sampling and Water Quality Assessment of Streams and Rivers in Montana, 2005.
3 2/27/12 K. Makarowski
All This major revision was an update to reflect the most current procedures and update the biological procedures.
3.1 7/5/12 K. Makarowski
Section 5.2.3
This section was revised to describe the low level Hg sampling and the use of pre-preserved bottles for sample collection. The version number did not change because it was a minor update and all of the current SAPs/QAPPs reference Version 3.
3.2 5/21/13 M. McCarthy
Attachment B
The required reporting limits for some metals were revised to reflect the 2012 updates to DEQ-7.

Water Quality Planning Bureau Field Procedures Manual For Water Quality Assessment Monitoring – Table of Contents
2/27/12 i
TABLE OF CONTENTS
Acronyms ..................................................................................................................................................... iv 1.0 Goals and Objectives ............................................................................................................................... 1 2.0 Summary of Water Quality Assessment Monitoring Event .................................................................... 1
2.1 Pre-Monitoring Preparation................................................................................................................ 1 2.2 General Sampling Sequence ............................................................................................................... 2
3.0 Field Readiness Review ........................................................................................................................... 3 3.1 Field Supply List ................................................................................................................................... 3 3.2 Site Location, Ownership, and Access................................................................................................. 3 3.3 Safety .................................................................................................................................................. 3
4.0 Sampling Site Selection and Documentation .......................................................................................... 4 4.1 Spatial Hierarchy ................................................................................................................................. 4
4.1.1 Considerations for Determining Sampling Locations ................................................................... 4 4.2 Selecting and Recording Initial Site (EMAP “F” site) ........................................................................... 5
4.2.1 Pre-season planning ..................................................................................................................... 5 4.2.2 Site reconnaissance ...................................................................................................................... 5 4.2.3 Establishing the “F” site ............................................................................................................... 5
4.3 Geo-Locate “F” Site Using GPS and Initiate Site Visit Form ................................................................ 6 5.0 Set-up and Collection of Chemical Samples ............................................................................................ 6
5.1 Calibration and Use of Field Meter(s) ................................................................................................. 6 5.1.1 Pre-deployment maintenance and calibration (one-time and continuous field measurement instruments) .......................................................................................................................................... 7 5.1.2 Use and deployment of continuous field measurement instruments (temperature dataloggers, YSI 6600 V2-4, TruTracks, MiniDOTs and others) ................................................................................. 7 5.1.3 Use and in situ calibration of one-time field measurement instruments.................................... 7
5.2 Collection of Chemistry Samples ........................................................................................................ 8 5.2.1 Water samples for total recoverable parameters, TSS/TDS, and common ions ....................... 10 5.2.2 Water samples for dissolved fractions ....................................................................................... 11 5.2.3 Water samples for low-level total mercury ............................................................................... 11 5.2.4 Sediment samples for metals parameters ................................................................................. 14
5.3 Recording the Chemistry Sampling Event on the Site Visit Form/Chain of Custody Form ............... 14 5.3.1 Water chemistry samples .......................................................................................................... 14 5.3.2 Sediment metals samples .......................................................................................................... 15
5.4 Quality Assurance and Quality Control – Field Blanks ...................................................................... 15 5.4.1 Description ................................................................................................................................. 15 5.4.2 Preparation, Transport, and Submittal ...................................................................................... 15
5.5 Quality Assurance and Quality Control – Field Duplicates ............................................................... 16 5.5.1 Description ................................................................................................................................. 16 5.5.2 Sample Collection and Submittal ............................................................................................... 16
6.0 Set-up and Collection of Biological Samples ......................................................................................... 16 6.1 Site Layout ......................................................................................................................................... 17
6.1.1 Total site length and transect length determination ................................................................. 17 6.1.2 Site layout diagram .................................................................................................................... 17 6.1.3 Flagging transects (A K) .......................................................................................................... 18 6.1.4 Single biological parameter sampling scheme ........................................................................... 18 6.1.5 Multiple biological parameter sampling scheme ....................................................................... 18

Water Quality Planning Bureau Field Procedures Manual For Water Quality Assessment Monitoring – Table of Contents
2/27/12 ii
6.1.6 Adjusting for obstructions at transect sampling locations ........................................................ 18 6.2 Chlorophyll-a ..................................................................................................................................... 19
6.2.1 Benthic chlorophyll-a (reach-wide method) .............................................................................. 19 6.2.2 Phytoplankton (chlorophyll-a in water column) ........................................................................ 25 6.2.3 Recording the chlorophyll-a sampling event(s) on the Site Visit Form ..................................... 26 6.2.4 Quality Control – field duplicates............................................................................................... 26
6.3 Periphyton (Reach-Wide Composite Sampling Method) .................................................................. 26 6.3.1 Sample collection ....................................................................................................................... 27 6.3.2 Sample preservation and storage .............................................................................................. 28 6.3.3 Recording the periphyton sampling event on the Site Visit Form ............................................. 29 6.3.4 Quality control – field duplicates ............................................................................................... 29
6.4 Benthic Macroinvertebrates ............................................................................................................. 29 6.4.1 Sample collection ....................................................................................................................... 29 6.4.2 Sample transfer, preservation, and storage .............................................................................. 30 6.4.3 Recording the macroinvertebrate sampling event on the Site Visit Form ................................ 31 6.4.4 Quality Control – field duplicates............................................................................................... 31
7.0 Set-up and Collection of Physical and Habitat Information .................................................................. 32 7.1 Total Discharge (Flow)....................................................................................................................... 32
7.1.1 Flow Meter Method (quantitative) ............................................................................................ 32 7.1.2 Float Method (semi-quantitative) .............................................................................................. 33 7.1.3 Estimated Flow ........................................................................................................................... 34 7.1.4 Recording Flow Measurements on the Site Visit Form.............................................................. 34
7.2 Channel Cross-Sections ..................................................................................................................... 35 7.2.1 Laser Level Cross-Section Method ............................................................................................. 35 7.2.2 Laser Level Water Surface Slope Measurements ...................................................................... 37 7.2.3 Non-Laser Level Cross-Section Method ..................................................................................... 38 7.2.4 Recording Cross-Section Measurements on the Site Visit Form ............................................... 38
7.3 Site Documentation .......................................................................................................................... 38 7.3.1 Digital Photographs .................................................................................................................... 38
8.0 Wrap-Up ................................................................................................................................................ 39 9.0 References ............................................................................................................................................ 39 Attachment A – Field Supply List .............................................................................................................. A-1
A1.0 Physical Attributes ........................................................................................................................ A-1 A2.0 Water Column Samples ................................................................................................................ A-1 A3.0 Metals Sediment Samples ............................................................................................................ A-1 A4.0 Low-Level Mercury Samples ......................................................................................................... A-2
A5.0 Chlorophyll-a Samples ...................................................................................................................... A-2 A5.1 Benthic chlorophyll-a .................................................................................................................... A-2 A5.2 Phytoplankton (chlorophyll-a in water column) ........................................................................... A-3 A5.3 Periphyton Samples ...................................................................................................................... A-3 A5.4 Macroinvertebrate Samples ......................................................................................................... A-3 A5.5 Field Forms and Labels ................................................................................................................. A-4 A5.6 Other ............................................................................................................................................. A-4
Attachment B – DEQ Monitoring Parameter Suite .................................................................................... B-1 Attachment C – Site Visit Form/Chain of Custody and Instructions .......................................................... C-1 Attachment D – Guidance on Sample Labels and Site Visit Forms/Chain of Custody .............................. D-1 Attachment E – Examples of Conditions for Hoop, Core, and Template Methods of Sampling Benthic Chlorophyll-a .............................................................................................................................................. E-1

Water Quality Planning Bureau Field Procedures Manual For Water Quality Assessment Monitoring – Table of Contents
2/27/12 iii
Attachment F – Benthic Chlorophyll a Sampling Method Diagrams ......................................................... F-1 Attachment G – Guidance for Completing the Aquatic Plant Tracking Form ........................................... G-1 Attachment H – Guidance for Completing the Aquatic Plant Visual Assessment Form ........................... H-1 Attachment I – Diagram of 10 Meter Transect for Site Information .......................................................... I-1 Attachment J – Laser Level Channel Cross-Section Diagram ..................................................................... J-1 Attachment K - Aquatic Plant Visual Assessment Form ............................................................................. K-1
LIST OF TABLES
Table 5-1. Basic Monitoring Suite ................................................................................................................. 9
LIST OF FIGURES
Figure 6-1. Site Layout Diagram .................................................................................................................. 17 Figure 7-1. Cross-section survey set-up ...................................................................................................... 35

Water Quality Planning Bureau Field Procedures Manual For Water Quality Assessment Monitoring – Acronyms
2/27/12 iv
ACRONYMS
Acronym Definition ADB Assessment database AFDW Ash Free Dry Weight ASAP As Soon As Possible BLM Bureau of Land Management (federal) BOD Biochemical Oxygen Demand CBOD Carbonaceous Biochemical Oxygen Demand CFS Cubic Feet per Second CNP Carbon Nitrogen Phosphorus COC Chain of Custody DEG. DDDD decimal degrees DEQ Department of Environmental Quality (Montana) DI Deionized DO Dissolved Oxygen DOC Dissolved Organic Carbon EDD Electronic Data Deliverable EMAP Environmental Monitoring and Assessment Program EPA Environmental Protection Agency (US) EtOH Ethanol FPA Fixed Point Average GF/F Glass Fiber Filter GIS Geographic Information System GPS Global Positioning System HDPE High Density Polyethylene HT Holding Time HUC Hydrologic Unit Code LBF Left Bankfull LWE Left Water’s Edge MPN Most Probable Number NRCS National Resources Conservation Service NRIS Natural Resource Information System (Montana) NTU Nephelometric Turbidity Units PTD Percent Taxonomic Difference QA Quality Assurance QAPP Quality Assurance Project Plan QC Quality Control RBF Right Bankfull RWE Right Water’s Edge SAP Sampling and Analysis Plan SAR Sodium Absorption Ratio SC Specific Conductivity SED Sediment SOP Standard Operating Procedures SVF/COC Site Visit Form/Chain of Custody TDS Total Dissolved Solids

Water Quality Planning Bureau Field Procedures Manual For Water Quality Assessment Monitoring – Acronyms
2/27/12 v
Acronym Definition THL Thalweg TMDL Total Maximum Daily Load TN Total Nitrogen TOC Total Organic Carbon TP Total Phosphorus TPN Total Persulfate Nitrogen TR Total Recoverable TSS Total Suspended Solids USFS United States Forest Service USGS United States Geological Survey VSS Volatile Suspended Solids WQPB Water Quality Planning Bureau (DEQ)

Water Quality Planning Bureau Field Procedures Manual For Water Quality Assessment Monitoring
2/27/12 1
1.0 GOALS AND OBJECTIVES
The goal of the Montana Department of Environmental Quality Field Procedures Manual is to describe the requisite sample collection techniques used by or for DEQ in water quality investigations. These investigations may include beneficial use support determinations, verification of previous 303(d) listed causes of impairment, pollutant and pollution source assessments, model development, pollutant load calculation and allocation, and TMDL effectiveness monitoring. The techniques in this document are presented separately from any particular sampling design, which must be provided in a project’s Quality Assurance Project Plan (QAPP) or Sampling and Analysis Plan (SAP). The objective of this field procedures manual is to provide field personnel with reproducible methods for the collection of field samples and consistent documentation procedures to facilitate management of the information collected. These methods are intended for water quality monitoring in wadeable streams. Each method presented is intended to provide sufficient detail to conform data collections (including meta-data) so the representativeness of chemical, biological and physical samples are applicable for a wide range of data uses. Field monitoring activities should be conducted in accordance with current DEQ assessment methods (Montana Department of Environmental Quality, 2011) and take into careful consideration the guidance on sampling location, frequency and duration outlined therein if the data is to be used for water quality assessments. DEQ is required by state and federal law to assemble and evaluate all existing and readily available data for assessing the surface water quality in Montana. If data is to be used for beneficial use support decision-making activities, it must be of documented quality and must be submitted to MT-eWQX in a specific format using the Electronic Data Deliverable (EDD) submittal process. At a minimum, all data (chemical, biological, and physical/habitat) must establish the project and monitoring locations where the data was collected, and attach associated quality documentation (i.e., QAPP, SAP). Both the data deliverable process and data standards are explained in the program’s Call for Data Guidance Manual (Montana Department of Environmental Quality, 2010b). Effort should also be made to coordinate with Conservation Districts and landowners to obtain permission to access private property and to gather additional data (including anecdotal information) that reflects historic and present water quality. The format of this manual is to provide a summary of a typical sampling event in the field, followed in the same sequence with the details of each step.
2.0 SUMMARY OF WATER QUALITY ASSESSMENT MONITORING EVENT
This section outlines steps to take when preparing for a water quality data collection event and the general sequence in which to complete the data collection.
2.1 PRE-MONITORING PREPARATION
Specific sampling design details of each project must be included in the project plan (QAPP or SAP), including proposed stream segment(s), reach(es) and site(s) to be sampled (Section 4.1). This project plan must be approved prior to field data collection and must describe data collections planned for each particular sampling event. If adjustments are made (e.g., fewer or more samples collected), changes must be described and justified in the project plan or a post-field season report.

Water Quality Planning Bureau Field Procedures Manual For Water Quality Assessment Monitoring
2/27/12 2
During project planning, DEQ water quality assessment methods (per pollutant) must be carefully referenced (Montana Department of Environmental Quality, 2011), with special attention paid to minimum sample size requirements and measures to ensure sample independence such as spatial and temporal considerations for sampling location and timeframes. When possible, site reconnaissance should be conducted to “ground truth” preliminary stream reach breaks and site locations identified during pre-sampling planning. Field personnel should also complete a field readiness review to ensure they are adequately prepared to perform data collection upon arrival in the field (Section 3.0). Pre-deployment calibration may be required for some instruments (i.e., YSI 6600 sonde, Tru-Track, temperature dataloggers, YSI 85, pH and turbidity meters); refer to instrument operation manuals for instructions on calibration and maintenance (Section 5.1).
2.2 GENERAL SAMPLING SEQUENCE
Once in the field, a particular sequence of field procedures must be followed to avoid biasing results of each successive sample. Some water quality parameters are sensitive to disturbance of the water column and substrate that occurs during data collection. Therefore, samples are collected in the sequence of most- to least- sensitive to disturbance, beginning with chemical sampling, then biological, then physical. Selected sites (and transects) must be sampled from downstream to upstream to avoid contaminating successive samples. Record all samples collected and related information on pertinent field forms, and ensure that samples are labeled and preserved according to this field manual and specific project and laboratory requirements. The following sequence illustrates the steps that apply if all collections described in this manual are performed:
1. Select and record initial site (EMAP “F” site) (Section 4.0) a. Locate stream reach b. Identify and “ground truth” representative sampling site(s) within the reach c. Initiate all required field forms for each sampling event d. Identify sampling site using a GPS receiver and record the latitude/longitude on Site Visit
Form. Always use the GPS coordinate system datum NAD 1983 and record coordinates in decimal degrees, to at least the third decimal.
e. Hang brightly colored flagging labeled “F” at the site
2. Set-up and collection of chemical samples (Section 5.0) a. Turn on and perform in situ calibration of dissolved oxygen for YSI 85 meter b. Collect in situ chemistry measurements (i.e., pH, DO, SC, temperature) at “F” site c. Collect water chemistry grab samples at “F” site d. Collect sediment metals samples
3. Layout of EMAP transects (Section 6.1 and Figure 6-1)
a. Calculate mean wetted width b. Calculate sampling reach length (40 x mean wetted width) c. Calculate distance between transects (sample reach length / 10) d. Flag 11 transects (A K), from downstream to upstream, with “F” site in center

Water Quality Planning Bureau Field Procedures Manual For Water Quality Assessment Monitoring
2/27/12 3
4. Set-up and collection of biological samples (Section 6.2-4)
a. Determine relevant chlorophyll-a collection procedure(s) (hoop, core, template, and/or phytoplankton) and collect sample(s)
b. Collect periphyton sample(s) c. Collect macroinvertebrate sample(s)
5. Set-up and collection of physical and habitat information (Section 7.0)
a. Measure or estimate total discharge (cfs) b. Measure channel cross-section c. Document site with digital photographs
6. Wrap-up (Section 8.0)
a. Verify that all pertinent field forms are completed for all samples collected prior to leaving the site
b. Return to vehicle, preserve samples and place on ice, as needed (Attachment B) c. Deliver samples to lab(s) for analysis and sign site visit/chain of custody form(s); take note of
sample holding times (Attachment B)
3.0 FIELD READINESS REVIEW
This section outlines considerations to be taken prior to departure for the field to ensure that field personnel are adequately prepared to commence monitoring in the field.
3.1 FIELD SUPPLY LIST
Supplies and equipment necessary to perform the data collections described in this field manual should be verified against a readiness checklist prior to departure for the field (Attachment A). Field personnel should plan in advance to ensure that all equipment needed for a sampling event is available and in proper operating condition.
3.2 SITE LOCATION, OWNERSHIP, AND ACCESS
Field personnel should identify the best site access routes to proposed sites and include maps and driving directions with field equipment. Land ownership (public, private) should be verified during pre-monitoring planning and private landowner contact information provided for reference. Site access on (or through) private property must be obtained from landowners prior to the first site visit.
3.3 SAFETY
Adequate safety precautions should be taken prior to entering the field as fast moving water, unstable banks, and adverse weather conditions present a hazard that could result in serious injury or death. Wildlife such as grizzly and black bears, mountain lions, rattlesnakes, ants, and bees could also be encountered in the field. Prepare field safety equipment for potential encounters with wildlife, including bear spray, snakebite and bee sting kits. Personal floatation devices must be worn whenever boats or other watercraft are used. Rubber gloves should also be worn when in direct contact with sample preservatives. All vehicles must have a First Aid emergency kit.

Water Quality Planning Bureau Field Procedures Manual For Water Quality Assessment Monitoring
2/27/12 4
4.0 SAMPLING SITE SELECTION AND DOCUMENTATION
This section describes the applicability of the methods described in this field procedure manual and contains procedural guidance for establishing monitoring sites.
4.1 SPATIAL HIERARCHY
DEQ uses a spatial hierarchy of segment, reach, and monitoring site to describe waterbodies at incrementally smaller scales. A general definition of these terms follows (Water Quality Planning Bureau, Montana Department of Environmental Quality, 2005), although individual assessment methods should be referenced during project planning to identify appropriate project-specific definitions of these hierarchical scales. The Sampling and Analysis Plan (SAP) will indicate the segments, reaches, and monitoring sites where sampling will occur for a given project: 1. Segment is the waterbody as defined in the DEQ assessment database (ADB). The segment is
identified by a unique segment ID [e.g., MT41I006_200], segment name, and description [e.g., McClellan Creek, headwaters to mouth (Prickly Pear Creek)]. This is the smallest unit for which an impairment determination is made.
2. Reach is a subdivision of a segment that represents a homogeneous portion of the segment based on geomorphology or land use. Segments may be homogenous throughout their entire length and could be considered to have only a single reach.
3. Monitoring Sites are locations selected within the reach for making shorter spatial scale measurements that will be compared to the same measurements taken at other monitoring sites within the same reach or in other reaches of the same segment.
4.1.1 Considerations for Determining Sampling Locations Significant land use changes, adits, and tributaries may warrant further stratification resulting in
additional reaches. If, for example, a relatively un-impacted upstream reach of a segment can be isolated and its condition is substantially different from other downstream parts of the segment, sub-segmenting into multiple reaches may be justified. Each additional reach will have the same general data requirements as the ‘parent reach’ would have had if it hadn’t been divided and thus may require additional sites. Consider time, resource, and site access constraints before adding additional reach breaks, and refer to pertinent assessment methods for further guidance. As a rule of thumb, it is better to lump than split reaches to avoid excessive sub-segmentation and the consequential increase in administrative and sampling requirements (Suplee and Sada de Suplee, 2011a).
The aggregate of samples collected from monitoring sites should provide good overall representation of the reach and segment. Individual sites that have known or suspected pollution problems (“hotspots”) should be sampled equitably along with sites where pollution problems are not suspected or are minimal or less pronounced (Suplee and Sada de Suplee, 2011a).
Refer to the assessment method for each of the pollutant groups for specifications of core indicators, minimum sample size, data independence, index period and other information summarized in the assessment method SOP (Montana Department of Environmental Quality, 2011).

Water Quality Planning Bureau Field Procedures Manual For Water Quality Assessment Monitoring
2/27/12 5
4.2 SELECTING AND RECORDING INITIAL SITE (EMAP “F” SITE)
4.2.1 Pre-season planning Training on the field procedures described in this field manual (and associated SOPs) should be
obtained annually, as feasible, from DEQ staff.
All field instruments must undergo annual inspection and maintenance according to manufacturer’s specifications. Inspection and calibration must be completed sufficiently in advance of the field season to allow ample time for repair or replacement (see Section 5.1). Expiration dates of stock reagents, chemicals and preservatives should also be reviewed.
DEQ water quality assessment methods (per pollutant) should be carefully referenced during project plan development (Montana Department of Environmental Quality, 2011). Sampling requirements and spatial and temporal limitations of the methods contained in this field manual vary from pollutant to pollutant and attention should be paid to guidance measures to ensure sample independence, including minimum sample size, sample location and sampling timeframes.
Prior to sampling, the proposed stream segment(s), reach(es) and site(s) must be documented in the project plan (SAP/QAPP). Maps, including USGS topographic Digital Ortho Quads (available from the Montana State Library (NRIS) website), BLM and USFS maps, and GIS land cover and ownership layers are used to determine preliminary reach breaks and potential monitoring site locations within the segment. If available, aerial photography and LandSAT images should also be referenced. Evaluation of potential pollutant sources, current 303(d) listings, and project objectives can inform sampling design and can help determine relevant sampling parameters.
Prior to formal site establishment, proposed sampling location(s) should be generally described in the project plan such that an individual could drive or walk to the site(s) but might be unsure as to the exact place to collect samples (O'Ney, 2009).
4.2.2 Site reconnaissance When possible, site reconnaissance should be conducted to “ground truth” proposed sampling
locations and reach breaks identified during pre-season planning. This will provide field personnel with an ‘on the ground’ view of site representativeness, preliminary source assessment, and confirmation of site access.
Appropriateness of reach breaks should be confirmed, when possible, by visual observation of the transitioning of the waterbody through landforms, land uses, and through the influence of major tributaries. Professional judgment will dictate if additional reach breaks are needed to adequately characterize the stream.
4.2.3 Establishing the “F” site Navigate to proposed monitoring site locations using GPS coordinates (latitude, longitude), maps,
and site descriptions. Once at the proposed site, field personnel should select a specific location for sampling (an “F” site) that is representative of the condition of the reach being sampled. The following guidelines should be considered when establishing an “F” site (Water Quality Planning Bureau, Montana Department of Environmental Quality, 2005; O'Ney, 2009): Locate sample collection sites in relatively straight channel reach where flow is uniform.

Water Quality Planning Bureau Field Procedures Manual For Water Quality Assessment Monitoring
2/27/12 6
There are two major stream gradients that assessment methods are designed to characterize: high gradient (primarily riffles/runs) and low gradient (primarily glides/pools). Generally, the “F” site should be located in a riffle in a high gradient reach and in a glide or pool in a low gradient reach.
Avoid sampling directly in ponded or sluggish water (unless specified by a particular protocol). Avoid sampling directly downstream from bridges, culverts and dams as sites can be
contaminated by the structures, road surface runoff, or altered hydrologic conditions. Avoid sampling directly up- or downstream of confluences to minimize problems caused by
backwater effects or poorly mixed flows. Typically, a distance of 5 stream widths below the influence of a tributary is adequate to ensure mixing; this distance is dependent upon field conditions and may need to be ≥ 5 stream widths; professional judgment is required.
Complete vertical and lateral mixing within the cross section is generally desirable and presence of point or nonpoint discharges of contaminants should be considered.
Monitoring of turbulent streams or during peak flows can be a safety concern; choose monitoring sites that allow sampling at peak flow with minimal risk to field personnel.
When biological sampling is to be conducted, a channel length of 40 channel widths (40 x mean wetted width) around the “F” site is needed (Figure 6-1). Field personnel should investigate stream condition upstream and downstream from the “F” site to ensure adequate stream length and access.
IMPORTANT: During site establishment, carefully avoid disturbing the stream’s water column and substrate prior to sampling chemical and biological parameters.
Once the “F” site is chosen, hang two pieces of brightly colored flagging labeled “F” at the site so it is identifiable during current and subsequent site visits.
4.3 GEO-LOCATE “F” SITE USING GPS AND INITIATE SITE VISIT FORM
Upon “F” site establishment, initiate the GPS receiver to allow ample time for it to acquire adequate satellites (four satellites are ideal). Always use Datum NAD83 and set the coordinate system to decimal degrees (DEG.DDDD). Refer to the GPS receiver operation manual for instrument-specific instructions (i.e., power on/off, datum and coordinate system settings, waypoints).
Refer to Attachments C and D, lines 1-6.
5.0 SET-UP AND COLLECTION OF CHEMICAL SAMPLES
This section contains instructions for conducting chemical sampling, including in situ measurements using field instruments and collection of water and sediment chemistry samples.
5.1 CALIBRATION AND USE OF FIELD METER(S)
DEQ uses several models of one-time and continuous field instruments for measuring parameters including dissolved oxygen, pH, specific conductivity, water temperature, turbidity, and stage height.

Water Quality Planning Bureau Field Procedures Manual For Water Quality Assessment Monitoring
2/27/12 7
Calibration logs for recording annual and daily calibrations and maintenance, and instrument-specific operations manuals, must remain with the instruments for quality assurance and quick reference (i.e., maintenance, storage, calibration, use, and troubleshooting).
5.1.1 Pre-deployment maintenance and calibration (one-time and continuous field measurement instruments) Most field instruments require pre-deployment calibration. For example, continuous temperature data loggers are calibrated in the laboratory and have their recording interval set according the needs of the project. Other field measurement instruments requiring calibration include YSI 85 and 6600 sondes and TruTrack digital stage recorders.
Perform all calibrations in accordance with instrument-specific acceptance criteria, operations manuals, and QAPPs and SOPs.
For all instruments and parameters being measured, record in the instrument logbook the following information on pre-deployment calibration and maintenance: Unique name or code of instrument Method used to calibrate (cite manual section, annual/periodic, # of points) Date and time of calibration Standards used (including concentration, units, expiration date, lot #) Resulting meter response (including units) Indication of pass/fail (refer to SAP/QAPP, if applicable, or operations manual) Corrective actions taken Signature of analyst performing calibration Recording interval (for continuous field measurement instruments only)
5.1.2 Use and deployment of continuous field measurement instruments (temperature dataloggers, YSI 6600 V2-4, TruTracks, MiniDOTs and others) Refer to instrument-specific operations manuals and DEQ SOPs for instructions on use and
deployment.
When using MiniDOT DO loggers in streams, it is recommended that data collected only over the first five days from initial deployment be used. These data should be sufficiently accurate to calculate DO delta values for assessment purposes. Data for longer periods can be used, but only if the MiniDOT probe face is thoroughly cleaned of algal growth about every 5 days (Suplee and Sada de Suplee, 2011b).
5.1.3 Use and in situ calibration of one-time field measurement instruments Some one-time field measurement instruments, particularly hand-held pH and YSI 85 dissolved oxygen meters, require in situ field calibration at the time of use in addition to pre-deployment calibration. For all DO field calibrations, record in the instrument logbook the date, time, site location and elevation, and the initials of the analyst performing the calibrations.
Refer to instrument-specific operations manuals for instructions on use and calibration.

Water Quality Planning Bureau Field Procedures Manual For Water Quality Assessment Monitoring
2/27/12 8
Dissolved oxygen, specific conductivity, and water temperature
Immediately upon arrival at the “F” site, turn the YSI 85 (or similar model) instrument on, open the case and allow it to remain undisturbed for ≥15 minutes in a shaded location.
Perform field calibration of dissolved oxygen, using the calibration values appendix in the operations manual to verify measurement accuracy.
At the “F” site, submerge the probe in the water, shake vigorously to remove any air bubbles trapped near the probe, and position it facing upstream into the flow. Ensure that there are no obstructions in front of the probe (i.e., rocks, macrophytes, debris). If the water is not flowing, gently move the probe from side to side to circulate the water around the probe.
Allow a few moments for measurements to stabilize and record dissolved oxygen (mg/L), specific conductivity (µS), and water temperature (oC) (Attachments C and D, lines 26-29).
pH
At the “F” site, submerge the probe in the water. Allow a few moments for instrument measurements to stabilize and record pH (Attachments C and D, lines 26-29).
While in the field at the end of each day of sampling, perform a two-point calibration check to verify performance of the meter.
Air temperature
Place the thermometer in a location with adequate shade and air circulation and allow it to stabilize for several moments. Record temperature (oC) (Attachments C and D, lines 26-29).
Turbidity
At the “F” site, submerge the probe in the water and position it facing upstream into the flow. Ensure that there are no obstructions in front of the probe (i.e., rocks, macrophytes, debris), be cautious not to disturb the substrate around the probe, and allow it to stabilize for several moments. Record turbidity (NTU) measurement results on the Summary Form, and note that turbidity measurements were taken on the Site Visit Form (Attachments C and D, lines 34-35).
5.2 COLLECTION OF CHEMISTRY SAMPLES
Water samples are collected at the “F” site for nutrients, common ions, TSS/TDS, and total recoverable and dissolved metals fractions. Sediment samples are collected for total recoverable metals analysis to evaluate the potential for heavy metals to become suspended in the waterbody during high flows.
Attachment B lists for all chemical water quality parameters the preferred and alternate methods of analysis, required reporting limit, holding time (days), size and type of bottle used for sample collection, and preservation specifications.
Table 5-1 shows the basic monitoring suite applicable to most monitoring projects. If sampling for low-level mercury, refer to Section 5.2.3 or the DEQ low-level mercury SOP for further instruction (Montana Department of Environmental Quality, 2010a).

Water Quality Planning Bureau Field Procedures Manual For Water Quality Assessment Monitoring
2/27/12 9
IMPORTANT: The monitoring suite and collection/preservation methods sometimes vary depending on project objectives and requirements. Always refer to project plans (SAP/QAPP) for project-specific parameter suites and chemical monitoring specifications. Table 5-1. Basic Monitoring Suite
Parameter Preferred Method
Alternate Method
Req. Report
Limit ug/L
Holding Time Days
Bottle Preservative
Water Samples - Physical Parameters
Total Suspended Solids (TSS)
A2540 D
4000 7 1000 ml HDPE/ 500 ml HDPE
≤6oC
Total Dissolved Solids (TDS) A2540 C
Water Samples - Nutrients
Total Persulfate Nitrogen (TPN)
A 4500-N C A4500-N B 40
28 250ml HDPE
≤6oC (7 d
HT), Freeze (28d HT)
Total Phosphorus as P EPA 365.1 A4500-P F 3 H2SO4, ≤6oC
or Freeze Nitrate-Nitrite as N EPA 353.2 A4500-NO3 F 10
Water Samples - Dissolved Metals (0.45 um filtered)
Aluminum EPA 200.7 EPA 200.8 30 180 250ml HDPE Filt 0.45 um, HNO3
Water Samples - Total Recoverable Metals and Common Ions
Total Recoverable Metals Digestion
EPA 200.2 APHA3030F
(b) N/A
180
500 ml HDPE/ 250 ml HDPE
HNO3
Arsenic EPA 200.8 3
Cadmium EPA 200.8 0.08
Calcium EPA 200.7 1000
Chromium EPA 200.8 EPA 200.7 1
Copper EPA 200.8 EPA 200.7 1
Iron EPA 200.7 50
Lead EPA 200.8 0.5
Magnesium EPA 200.7 1000
Potassium EPA 200.7 1000
Selenium EPA 200.8 1
Silver EPA 200.8 EPA 200.7/200.9
0.5
Sodium EPA 200.7 1000
Zinc EPA 200.7 EPA 200.8 10
Water Samples - Calculated Results
Total Hardness as CaCO3 A2340 B (Calc)
1000
Sodium Absorption Ratio (SAR)
Calc

Water Quality Planning Bureau Field Procedures Manual For Water Quality Assessment Monitoring
2/27/12 10
Table 5-1. Basic Monitoring Suite
Parameter Preferred Method
Alternate Method
Req. Report Limit
mg/kg (dry weight)
Holding Time Days
Bottle Preservative
Sediment Samples - Total Recoverable Metals
Total Recoverable Metals Digestion
EPA 200.2 N/A
180 2000 ml
HDPE Widemouth
Arsenic EPA 200.8 EPA 200.9 1
Cadmium EPA 200.8 EPA 200.9 0.2
Chromium EPA 200.8 EPA 200.7 9
Copper EPA 200.8 EPA 200.7 15
Iron EPA 200.7 EPA 200.7 10
Lead EPA 200.8 EPA 200.9 5
Zinc EPA 200.7 EPA 200.7 20
Sediment Samples - Total Metals
Mercury EPA 7471B 0.05 28 Same container as TR sediment sample.
Parameter Preferred Method
Alternate Method
Req. Report Limit
mg/m2
Holding Time Days
Bottle Preservative
Substrate Samples - Chlorophyll-a
Chlorophyll-a A 10200 H 21(pH≥7) /ASAP
(pH<7)
Filter Freeze
Ash Free Dry Weight (AFDW) A 10300 C (5)
IMPORTANT: Do not allow your hands to contact the sample bottle opening as handling coins or other metal objects could contaminate your hands and subsequently the sample. Also, do not smoke prior to or during sampling as cigarette smoke contains cadmium and other heavy metals.
5.2.1 Water samples for total recoverable parameters, TSS/TDS, and common ions Unfiltered “grab” water samples are collected for total recoverable metals, nutrients, TSS/TDS, and
common ions (Table 5-1).
At the “F” site, rinse the sample bottles three times with ambient stream water. After rinsing, submerge the bottles to fill them with fresh water upstream from any previous disturbances to avoid contaminating the sample. Submerge the bottle sufficiently to prevent particulates floating on the water surface or substrate from the stream bottom from entering the sample bottle.
Affix to each bottle a label containing the following information and cover it with clear tape Activity ID Waterbody name Sample type Collection date

Water Quality Planning Bureau Field Procedures Manual For Water Quality Assessment Monitoring
2/27/12 11
Collector’s name
Add the appropriate preservative to each sample bottle (Table 5-1 and Attachment B), securely affix the lid and mix the sample by gently inverting 3-5 times: Nitric acid (HNO3) for metals and common ions Sulfuric acid (H2SO4) for TP and NO2+3 NO preservative for TN and TSS/TDS
Ensure lids are tight and will not leak. Store samples upright, completely surrounded with ice in a cooler until delivery to the laboratory for analysis.
5.2.2 Water samples for dissolved fractions Filtered “grab” water samples are collected for dissolved fractions of metals and nutrients. A 60cc
syringe with 0.45um disposable filter units is used to collect the sample(s).
Rinse the syringe three times with ambient stream water. Fill the rinsed syringe with 60ml of ambient stream water. Place a new disposable filter tip on the syringe, and rinse the sample bottle three times with at least 20 ml of filtered water during each rinse.
After rinsing, remove and dispose of the filter. Refill the syringe with 60 ml of ambient stream water upstream from any previous disturbances to avoid contaminating the sample. Place a new filter on the syringe tip and filter 50 ml into a 250 ml sample bottle, replacing filter units as needed. If the water is very rich in sediment, several filters may be needed.
Affix to each bottle a label containing the following information and cover it with clear tape: Activity ID Waterbody name Sample type Collection date Collector’s name
Add the appropriate preservative to the sample bottle (Table 5-1 and Attachment B), securely affix the lid and mix the sample by gently inverting 3-5 times: Nitric acid (HNO3) for dissolved metals
Ensure lids are tight and will not leak. Store samples upright, completely surrounded with ice in a cooler until delivery to the laboratory for analysis.
5.2.3 Water samples for low-level total mercury This procedure requires a two-person sampling team; one person is designated as “clean hands” and
the second person is designated as “dirty hands”. “Dirty hands” is responsible for all activities that do not involve direct contact with the sample bottles and sample water.
Refer to the MDEQ “low-level” total mercury SOP for wadeable streams (Montana Department of Environmental Quality, 2010a) for additional considerations. Refer to Attachment A for a list of necessary equipment.

Water Quality Planning Bureau Field Procedures Manual For Water Quality Assessment Monitoring
2/27/12 12
Prior to departure for the field, acquire and package ice (“wet”). Upon acquisition, the ice must go directly from the store to the sealable bags, to the designated sample cooler. Bags should not be temporarily set on the ground, on a vehicle, or in a shopping cart. Gloves should be worn whenever placing items into the sample cooler. Package ice as follows: 1. Place a large garbage bag in the cooler, 2. Pack ice in sealable gallon-size plastic bags and place the bags in the garbage bag, lining the
bottom and also the sides of the cooler, 3. Place a second large garbage bag inside the first garbage bag containing the ice bags - this is the
bag in which completed samples will be placed, and 4. Close the inner and outer garbage bags.
Avoid contaminating samples by heeding the following recommendations: Fuel vehicles and acquire ice the day prior to the commencement of sampling activities; if fuel or
ice is needed after sampling activities have begun, it needs to be acquired at the end of the day once sampling for that day has been completed
“Clean hands” must not smoke cigarettes during a sampling day Use hand wipes regularly to clean hands and surfaces such as the vehicle steering wheel. Whenever possible, approach the sampling site from downwind and downstream to reduce the
risk of contamination. Open, fill and close the sample bottle while submerged in the ambient water to avoid
atmospheric contamination
Sample bottles will be received pre-preserved with hydrochloric acid from the laboratory. Stage 1: Arrival at site
At the vehicle, “dirty hands” puts on a clean pair of gloves. “Clean hands” puts on chest high waders as necessary.
For field preservation, carry the sample supply cooler and the completed samples cooler to the sample site. For field preservation, leave the completed sample cooler at the vehicle and instead bring a clean garbage bag (stored within the sample supply cooler) to the sample site. “Dirty hands” also carries the field forms, pencils, GPS unit and camera to the site.
Stage 2: Sample Preparation
Upon reaching the water’s edge at the location where the waterbody will be entered for sample collection, “dirty hands” carries the sample supply cooler to the water’s edge and “clean hands” enters the water.
Standing at the water’s edge, “dirty hands” opens the cooler, removes the bag of gloves, opens the outer sealed plastic bag containing the gloves and holds the bag open without touching the inside of the outer bag. “Clean hands” reaches into the outer bag, opens the inner plastic bag, extracts, and puts on the inner gloves, followed by the elbow or shoulder length gloves. After this point, if “clean hands” touches anything besides the sample bottle, cap, stream water, paper towel, and sample label (e.g. waders, branches, rocks, etc.), the outer gloves must immediately be removed.
"Dirty hands" unzips the outer sample bag containing the pre-preserved sample bottle and holds the bag open without touching the inside of the bag. Without removing the inside bag from the outside

Water Quality Planning Bureau Field Procedures Manual For Water Quality Assessment Monitoring
2/27/12 13
bag, "clean hands" opens the inside bag containing the sample bottle and removes the bottle, and if possible, reseals the inside bag. "Dirty hands" then reseals the outer bag and returns it to the sampler supply cooler.
Stage 3: Sample Collection
"Clean hands" wades into the stream and locates the thalweg. Facing directly upstream, the sample bottle is positioned upstream of their standing position. If the stream is not flowing (pool or glide systems), wade the stream carefully to avoid disturbing the sediment. Meanwhile, “dirty hands” will be completing the field form and preparing the sample label.
“Clean hands” submerges the bottle completely beneath the water surface, taking care not to disturb the channel substrate. Once the bottle is completely submerged into the streamflow, “clean hands” unscrews the cap underwater and allows the bottle to fill with water. During filling of the bottle, the cap should remain underwater to minimize atmospheric exposure. The sample bottle is not rinsed with ambient water prior to sample collection.
The bottle should be filled as completely with water as possible. After the bottle has filled and is still completely underwater, "clean hands" seals the cap on the bottle. In this way, the sample water has never contacted the atmosphere.
NOTE: If there is not enough water in the stream, a “clean” beaker might be used to fill out the bottle as described above.
Stage 4: Sample Completion
“Clean hands” moves to the edge of the stream channel.
“Dirty hands” removes the paper towel bag from the sample supply cooler and opens the plastic bag. While holding the sample bottle, “clean hands” removes the outer sample gloves and then removes a paper towel and dries the sample bottle. If it is raining and the sample bottle cannot be dried at the stream, the bottle is put into the inner sample bag following the procedure below and is taken to the vehicle where it can be labeled inside the vehicle.
“Dirty hands” gives the completed sample label and tape to “clean hands” who affixes the label to the bottle.
"Dirty hands" removes the sealed sample bag from the cooler, opens the outer sample bag, and holds it open. "Clean hands" opens the inner sample bag. “Clean hands” then places the sample bottle into the inner bag, and reseals the inner bag. "Dirty hands" seals the outer sample bag.
“Clean hands” opens the completed samples cooler and places the sample bottle inside the inner garbage bag. “Clean hands” closes all garbage bags and closes the samples cooler. “Dirty hands” discards used sample supplies in a small garbage bag.
Upon reaching the vehicle, dirty hands,” with gloved hands, transfers the double-bagged sample bottle into the inner garbage bag in the sample storage cooler, ensuring that the bottle is completely surrounded by but not in direct contact with the packaged bags of ice. Gloves can now be removed.

Water Quality Planning Bureau Field Procedures Manual For Water Quality Assessment Monitoring
2/27/12 14
5.2.4 Sediment samples for metals parameters Identify at least 5 wadeable deposition zones of VERY fine bed sediment that are representative of
the stream reach; identify additional zones as necessary.
Place the Teflon 60-micron mesh sieve between the two pieces of the Buchner funnel. Place the end of the funnel in the 2L sample bottle.
Scoop sediment from the streambed with a non-metallic spoon or turkey baster and place it on the sieve in the funnel. Scoop enough sediment so the sieve is completely covered.
Use the spoon or turkey baster to add minimal amounts of ambient stream water over the sediment in the funnel. Stir the water and sediment in the funnel, being very gentle not to damage the mesh, to create fine sediment slurry. Allow the slurry to filter into the bottle.
Once the first zone is completed, pour the excess sediment out of the sieve. Rinse all equipment with ambient stream water between each depositional zone. Move to the next depositional zone and repeat the sample collection steps above. Use the same sample bottle at each zone to collect a composite sample.
IMPORTANT: Fill the bottle no more than 1/5 full (or approximately 1cm deep in a 2L wide-mouth sample bottle). Be aware while sampling to collect only enough sample volume at each of ≥5 depositional zones without exceeding the maximum composite sample volume. Use a minimal amount of water, only as needed.
Affix to each bottle a label containing the following information and cover it with clear tape: Activity ID Waterbody name Sample type Collection date Collector’s name
Ensure lids are tight and will not leak. Store samples completely surrounded with ice in a cooler until delivery to the laboratory for analysis.
Between sampling sites/events, thoroughly rinse the Buchner funnel, mesh, and spoon and/or turkey baster with dilute nitric acid (5%). Rinse equipment again with distilled water after acid wash is complete.
5.3 RECORDING THE CHEMISTRY SAMPLING EVENT ON THE SITE VISIT FORM/CHAIN
OF CUSTODY FORM
5.3.1 Water chemistry samples Refer to Attachments C and D, lines 7-15.

Water Quality Planning Bureau Field Procedures Manual For Water Quality Assessment Monitoring
2/27/12 15
5.3.2 Sediment metals samples Refer to Attachments C and D, lines 16-17.
5.4 QUALITY ASSURANCE AND QUALITY CONTROL – FIELD BLANKS
5.4.1 Description Field Blanks are collected according to SAP/QAPP guidelines for all water chemistry samples to assess potential for false positive results due to site contamination, preservative and/or container contamination. Field blank results will verify that false positive results from site conditions or cross-contamination during transport will not result in erroneous beneficial use support determinations.
5.4.2 Preparation, Transport, and Submittal The analytical laboratory will provide distilled water in a large (≥ 4 liter) sealed HDPE container. Field
personnel must keep several liters (enough to triple rinse and refill an entire set of bottles used for routine water chemistry sampling) of distilled water in clean 1L HDPE bottles in the vehicle where it is not exposed to excessive dust, mud, or other equipment. Label these bottles “distilled water” to avoid accidental contamination, and triple rinse the bottles with distilled water prior to (re)filling.
Prepare field blanks in the field each time samples are to be delivered to the analytical laboratory. For example, prepare field blanks after sampling the last site of a multi-site sampling “trip”, or “mid-trip” if sample holding times require samples to be delivered to the lab part-way through a multi-site sampling trip.
At the sampling site, prepare a set of bottles – the same number and size bottles as used for routine sampling – by rinsing each bottle three times with the distilled water. Fill each sample bottle with distilled water as during routine sampling except pour or filter (with a 60cc syringe and 0.45um filter unit) distilled water instead of stream water (Section 5.2).
Add the appropriate preservative to each sample bottle, securely affix the lid and mix the sample by gently inverting 3-5 times (Table 5-1).
Affix to each bottle a label containing the following information and cover it with clear tape: Activity ID Collector’s name Collection date Sample type Write “Field Blank” in place of waterbody name on the label
Ensure lids are tight and will not leak. Store samples completely surrounded with ice in a cooler until delivery to the laboratory along with routine samples for analysis. Field blanks must be handled identically (e.g., preservation, holding time) to their respective sample counterparts.
Fill out a separate Site Visit Form for field blanks. Fill this new form the same as the initial Site Visit Form (Section 4.3), except use a distinct Activity ID (i.e., site visit code) and write “Field Blanks” in the “Site Visit Comments” field. Use the same medium code as the initial samples (e.g., “W” for water, “SED” for sediment) (Attachments C and D, lines 7-17). Refer to the project plan (SAP/QAPP) for quality control criteria.

Water Quality Planning Bureau Field Procedures Manual For Water Quality Assessment Monitoring
2/27/12 16
5.5 QUALITY ASSURANCE AND QUALITY CONTROL – FIELD DUPLICATES
5.5.1 Description To assess both precision and representativeness of the sampling technique, DEQ collects duplicate samples for all chemistry (except in situ physical) parameters. The number of duplicate samples to collect will depend on sampling frequency per parameter throughout the field season; generally, collect duplicate samples for at least 10% of the total number of samples per parameter. Duplicate sample results will verify that field personnel collect samples consistently and that method and site variability is understood.
5.5.2 Sample Collection and Submittal Select a site that allows for two samples to be taken side-by-side upstream from any previous
disturbances. When collecting duplicate samples, repeat all steps performed in collecting one sample (or set of samples) so that TWO IDENTICAL samples (or sets of samples) have been collected at the SAME site.
Add the appropriate preservative to each sample bottle, securely affix the lid and mix the sample by gently inverting 3-5 times (Table 5-1).
Affix to each bottle a label containing the following information and cover it with clear tape: Activity ID Collector’s name Collection date Sample type Waterbody name (write “Duplicate Sample” next to waterbody name on the label)
Ensure lids are tight and will not leak. Store samples completely surrounded with ice in a cooler until delivery to the laboratory along with routine samples for analysis. Duplicate samples must be handled identically (e.g., preservation, holding time) to their respective sample counterparts.
Fill out a separate Site Visit Form for duplicate samples. Fill this new form the same as the initial Site Visit Form (Section 4.3), except use a distinct Activity ID (i.e., site visit code) and write “Duplicate Samples” in the “Site Visit Comments” field. Use the same medium code as the initial samples (e.g., “W” for water, “SED” for sediment) (Attachments C and D, lines 7-17). Refer to the project plan (SAP/QAPP) for quality control criteria.
6.0 SET-UP AND COLLECTION OF BIOLOGICAL SAMPLES
Biological sampling includes collection of chlorophyll-a (benthic and phytoplankton), periphyton, and (or) macroinvertebrates. These samples are used primarily to determine the status of streams’ aquatic life, fisheries and primary contact recreation beneficial use support.

Water Quality Planning Bureau Field Procedures Manual For Water Quality Assessment Monitoring
2/27/12 17
6.1 SITE LAYOUT
DEQ uses a variation of EPA’s Environmental Monitoring and Assessment Program (EMAP) sampling site layout procedures for biological sampling (Peck, et al., 2006). An 11 transect sampling frame is used at each site. This frame consists of 11 equidistant transects with 40 wetted widths defining the total sampling frame length. This section describes the basic sequential procedure for laying out the sampling frame, with the assumption that field personnel have already established the “F” site (Section 4.0).
6.1.1 Total site length and transect length determination Use a tape to measure the wetted width of the stream channel at five places considered to be of
“typical” width around the “F” site (2 upstream, 2 downstream, and 1 at the “F” site).
Calculate and record (Attachments C and D, line 33) the mean wetted channel width, total site length, and transect length (all rounded to the nearest 1m), as follows: Mean Wetted Width (m) = (sum of 5 wetted widths) / 5 Total Site Length (m) = (mean wetted width) x 40 Transect Length (m) = (total site length) / 10
IMPORTANT: For small streams, field personnel must set up a sampling reach of 40 wetted widths or a minimum of 150 meters, whichever is larger.
6.1.2 Site layout diagram Figure 6-1 depicts the sampling frame and transect layout, as well as the sampling scheme for biological parameters.
Figure 6-1. Site Layout Diagram

Water Quality Planning Bureau Field Procedures Manual For Water Quality Assessment Monitoring
2/27/12 18
6.1.3 Flagging transects (A K) Beginning at “F” site, stretch a tape upstream and downstream along the contour of the
streambank, taking into account channel sinuosity, to measure and flag transects A K based on the transect length calculated in Section 6.1.1. As shown in Figure 6-1, transect A marks the lowermost extent of the sampling site and transect K marks the uppermost extent, with “F” site in the middle. Identify transects by hanging brightly colored flagging labeled with each transects’ letter (A K).
IMPORTANT: During reach set-up, carefully avoid disturbing the stream’s water column and substrate prior to sampling chemical and biological parameters.
6.1.4 Single biological parameter sampling scheme Biological sampling ALWAYS progresses from transect A (downstream) to transect K (upstream). Also, stream “Right” and stream “Left” is determined while facing downstream. This section describes the simple sampling scheme to use when sampling a site for a single biological parameter.
The basic sampling scheme is Right (R) - Left (L) – Center (C) from downstream to upstream. Randomly select the channel position (either R, L, or C) at which to start sampling at the most downstream location (transect A). For example, if right is randomly chosen: (1) sample at transect A within the right 1/3 of the channel width; (2) move upstream and sample at transect B within the left 1/3 of the channel width; (3) move upstream and sample at transect C within the center 1/3 of the channel width. Continue this alternating Right - Left – Center pattern until the final sample is collected at transect K, as depicted by the X’s in Figure 6-1.
Once the channel position (R, L, C) is located on the transect, identify an area approximately 1 m2 that is representative of that position and collect the sample within that area.
6.1.5 Multiple biological parameter sampling scheme When multiple biological parameters are being sampled, each field personnel will follow a similar
alternating R, L, C sequence as described in the previous paragraphs. However, the channel position chosen as the starting point at transect A must be determined such that each person sampling for a different biological parameter is beginning at a different locale. There should be no overlap at each channel position (R, L, or C) along a single transect to avoid disturbance from sampling one parameter to subsequent parameter data collections (Figure 6-1).
For example, the person sampling chlorophyll-a and periphyton begins at Right at transect A and moves R-L-C upstream. The second person, sampling macroinvertebrates, begins at Left at transect A and moves L-C-R upstream. The third person, collecting a macroinvertebrate duplicate sample, begins at Center at transect A and moves C-R-L upstream.
6.1.6 Adjusting for obstructions at transect sampling locations If an obstruction (e.g., boulder, deep water, artificial structure) is encountered that impairs the ability to collect a sample at the proper R, L, or C location along a transect, there are two options for making adjustments: (1) Move temporarily to another channel position along the transect line and collect the sample. For
example, if Right is obstructed, move to either Left or Center to collect the sample. Return to the

Water Quality Planning Bureau Field Procedures Manual For Water Quality Assessment Monitoring
2/27/12 19
ORIGINAL sampling scheme after moving upstream to the next transect (i.e., if at transect B Right was blocked so the sample was collected at Left, transect C would be sampled at Left). This alternative is often ideal when a single biological parameter is being sampled.
(2) Staying at the initial R, L, or C channel position, move 1m in the upstream or downstream direction from the transect line and collect the sample. For example, if there is an obstruction at transect A Right, move upstream 1m, staying Right, and collect the sample. Follow your ORIGINAL sampling scheme after moving upstream to the next transect. This alternative is often ideal when multiple biological parameters are being sampled.
6.2 CHLOROPHYLL-A
Chlorophyll-a (Chla) is measured as a means of estimating algae (periphyton or phytoplankton) biomass in a body of water. Heavy growths of algae generally indicate inferior water quality. These sampling methods are designed to produce a quantitative measure of algae growth by relating the total mass of Chla pigment to a known area or volume. Three benthic Chla collection methods are presented, followed by the phytoplankton collection method. All chlorophyll-a methods use monochromatic analysis, corrected for phaeophytin. Always use dry ice for sample storage in the field and during transport to the laboratory; regular ice is an acceptable alternative only if dry ice is unavailable. Refer to the Chla SOP (Water Quality Planning Bureau, Montana Department of Environmental Quality, 2011b) for further instruction. IMPORTANT: Since chlorophyll-a breaks down readily in sunlight, avoid exposing all chlorophyll-a samples to direct sunlight at all times.
6.2.1 Benthic chlorophyll-a (reach-wide method) Field personnel must use the 11 transect sampling frame detailed in Section 6.1 and Figure 6-1 of this field manual while sampling benthic Chla. Samples taken at each location within the sampling frame are single collections; the substrate and conditions encountered at the sampling locale on the transect determine the collection technique: (1) template method, (2) hoop method, and (3) core method (Attachment E). Index period: Sampling designs using Chla must be inclusive of the times when stable flows have been achieved, as well as times when diversity and standing crop are peaking. The summer and early fall period of July 1st to September 30th is generally the time of maximum growth potential in western Montana (mountainous region); a somewhat longer sampling index period (June 16th to September 30th) is recommended for some plains ecoregions (Woods, et al., 2002; Suplee, et al., 2008; Water Quality Planning Bureau, Montana Department of Environmental Quality, 2011b). August is the preferred month for chlorophyll-a sampling. Recent conditions: If the waterbody has had recent significant rainfall or is currently experiencing a significant rainfall event, consider the effect of scouring and reschedule sampling event, as needed (Water Quality Planning Bureau, Montana Department of Environmental Quality, 2011b). Sample compositing: At the laboratory, sample compositing may be used to reduce the costs associated with the 11 samples collected. Sample compositing will, in effect, return results of each collection method as a mean when the composite Chla concentration is calculated to the sum of the areas collected. The laboratory does the compositing, and only samples collected by the same technique (template, hoop, or core) can be composited. In the field, the sampler should keep each of the 11

Water Quality Planning Bureau Field Procedures Manual For Water Quality Assessment Monitoring
2/27/12 20
samples separate, but needs to check the “Composite at Lab” box on the DEQ’s Site Visit Form/Chain of Custody (SVF/COC) (Attachment C and D, line 19). A weighted average Chla value should also be obtained which, if composited, is based on the number of transects per collection method; the ash free dry weight of the samples is also determined (check the “Ash-Free Dry Weight” box, see Attachment C and D, line 19).
Randomly select the starting point right (R), left (L), or center (C) at the most downstream transect (transect A). Place the remaining sampling locations progressing upstream following the R, L, C pattern.
At each of the 11 sampling locales, the algae sample collected should represent conditions prevalent in approximately a 1 m2 area around the transect. For example, if the sample is to be collected at transect D, Right (Figure 6-1), the sampler should observe the algae conditions that prevail from the right wetted edge to 1m out along and 0.5 m up and down of the transect line. The sampler then selects the appropriate sampling method and samples the most representative point. For Center samples, observe 0.5 m on four sides of the channel centerpoint (upstream, downstream, towards river R, towards river L) and then sample the most representative point.
Once collected, place all individual foil-wrapped benthic Chla samples, one from each of 11 transects, into one (or more as needed) large Ziploc bag for organization and storage in the cooler. Label these storage bag(s) with the activity ID, date, waterbody name, and collector name.
Field Activities Associated with Benthic Chlorophyll-a Collection
Always complete the Aquatic Plant Tracking Form and the Aquatic Plant Visual Assessment Form (2012 versions) while collecting quantitative measurements of benthic chlorophyll-a at each transect AK (see Attachments G and H, respectively, for form completion guidance). If the stream you are assessing does not entail laying out a longitudinal reach, use only the “F” labeled form in Attachment K. For this latter scenario, use one “F” site form per stream site.
Always take at least one digital photograph per transect (AK) at the channel position (R, L, C) where each benthic Chla sample was collected. These photos should represent a close-up aerial view of the channel substrate in the representative area that was sampled using either the hoop, core or template method to accompany the Aquatic Plant Visual Assessment Form. Use a polarized lens to reduce glare from the sun and water’s surface to enhance photo quality. Record the photo number, latitude, longitude, and a brief description of each photo on the Photograph Locations and Description Form. See Section 7.3.1 for further instruction on site photographs.
Template Method – for sampling transects with substrate dominated by small boulders, cobble, and gravel without heavy filamentous growth
A template with a 12.5 cm2 area can be made from a cut-off piece of PVC pipe (Schedule 40 - 1 1/2” nominal I.D.). The internal diameter of templates should be within 3.93 to 4.05 cm (+/- 4% area error).
Locate a representative point at the sampling locale (R, L, or C) on the transect line. Observe the algae density in a roughly 1 m2 area centered on the sampling point and select a representative rock therein.

Water Quality Planning Bureau Field Procedures Manual For Water Quality Assessment Monitoring
2/27/12 21
Lift the rock slowly out of the water to minimize disturbance of the algal film and place it in a shallow pan. Place the template over the upper (light-facing) surface of the rock.
Use a sharp point (knife, awl) to score the algal film around the inner circumference of the template. Use a pocket knife to scrape all of the growing material within the template into the pan. In certain cases the volume of algal material on the rock surface is small, therefore it is better to scrub the rock surface with a toothbrush and then rinse the rock surface and toothbrush into the pan with a small volume of tap water (Note: Previous versions of this manual listed de-ionized water. DO NOT USE de-ionized water as it may burst cells due to osmotic pressure differences).
In cases where rocks are smaller than the template diameter but too large for core sampling, place several representative rocks inside the template diameter, and follow the process as described in the paragraphs above, scrubbing the light-facing surfaces.
Set up the filtration unit and use clean forceps to place a glass fiber filter (GF/F nominal pore size 0.7 um) on the filter holder. Use a small amount of tap water from a wash bottle to settle the filter. Rinse the sides of the filter funnel and filter with a small volume of tap water. Attach the filter funnel and connect the plastic tubing and vacuum pump.
IMPORTANT: Filtration MUST be performed in the field!
Pour all rinse water/algae material from the pan into the filter unit, rinsing as necessary to capture all material in the funnel. Minimize rinse water use to assure that all water will move through the GF/F filter. Draw the sample through the GF/F filter using the vacuum hand pump. Note: To avoid rupture of fragile algal cells, do not exceed 9 inches Hg on the vacuum gage.
After filtration is complete, use clean forceps to remove the filter, fold it in half with the colored side folded in on itself, and place it in a 50ml centrifuge tube.
If benthic algae density from a single template is so high that the GF/F filter clogs prior to all water passing through, the remaining algal material/water in the upper half of the Nalgene unit may be returned to the clean pan. Load a second GF/F filter on filter unit, filter the remaining water/algae material, and place both filters in the centrifuge tube together. Record the number of GF/F filters associated with the single template on the Aquatic Plant Tracking Form (Attachment G).
If attached algae levels are so low that scrapings from a single template will result in very little material on the GF/F filter, little or no color will be observed on the filter after filtration. To better assure that the sample is sufficient to achieve detectable levels, a maximum of 3 templates from the same rock (or from other representative rocks in the sampling locale) can be collected and all the scraped material is then captured on the same GF/F filter. Record the number of templates aggregated on the single GF/F filter on the Aquatic Plant Tracking Form (Attachment G).
Fill out a label with the following information: Sample method (“T” for template) Activity ID w/medium code “C” Waterbody Name

Water Quality Planning Bureau Field Procedures Manual For Water Quality Assessment Monitoring
2/27/12 22
Transect letter (AK) Collection Date Collector’s Name
Affix the label to the centrifuge tube and cover the label with clear tape. Wrap the tube completely with aluminum foil, leaving no space for light to enter. Write the Activity ID on the foil with a black ink Sharpie.
Place the foil-wrapped sample into the large Ziploc bag for storage. Immediately store the sample on dry ice; samples should be frozen upon delivery to the lab. The samples should be sent to the laboratory as soon as possible for analysis.
Hoop Method –for transects dominated by the presence of filamentous algae, regardless of stream substrate
The hoop can be made by wrapping a stiff wire around the bottom of a 5 gallon bucket. Measure the hoop diameter and calculate the area of a circle (A=3.14*(D/2)2) and adjust as necessary to arrive at an area of 710 cm2. The diameter of the hoop is approximately 30 cm.
Locate a representative area within approximately 1 m2 at the sampling locale (R, L, or C) on the transect line. Place the metal hoop over the collection site and lower it from the water surface to the substrate, capturing all algae within the hoop from the water surface to the substrate (Attachment F).
Collect all the algal material (i.e. filamentous and non-filamentous) within the hoop, using scissors or a knife to detach the filamentous algae from their substrate, and place it in a shallow pan. Note: Filaments originating inside the hoop that are streaming beyond it in the downstream direction, or originating upstream of the hoop which are streaming down into the hoop, are to be cut off along the edge of the hoop and only the parts within the hoop are retained. Scrape algae attached to rocks within the hoop into the Ziploc bag. Minimize the amount of water submitted by decantation (do not decant floating algae); gently squeezing the water out of filaments works well.
Manually separate the filamentous algae from macrophytes. Retain both portions only if both algae and macrophyte ash free dry weight is being analyzed; otherwise, retain only the algae portion. If ≤5% by area macrophytes are present, separate them from the algae at the time of collection; If >5% macrophytes are present, place the sample into a small plastic pan and separate them from the algae on the bank or other stable surface. Record the relative proportion of algae to macrophytes on the Aquatic Plant Tracking Form (Attachment G). Note: If the sample contains 100% macrophytes (no algae), discard all and record “N” for “no sample” on the Site Visit Form and indicate “no sample” and 100% macrophytes on the Aquatic Plant Tracking Form for that transect.
Place all algae collected at a site in a single Ziploc bag. Fill out a label with the following information, attach it to the Ziploc bag containing the sample, and cover it with clear tape: Sample method (“H” for hoop) Activity ID w/medium code “C” Waterbody Name Transect letter (AK)

Water Quality Planning Bureau Field Procedures Manual For Water Quality Assessment Monitoring
2/27/12 23
Collection Date Collector’s Name
Wrap the sample bag completely in aluminum foil, leaving no space for light to enter. Write the Activity ID on the foil with a black ink Sharpie.
Place the foil-wrapped sample into the large Ziploc bag for storage. Immediately store the sample on dry ice; samples should be frozen upon delivery to the lab. The samples should be sent to the laboratory as soon as possible for analysis.
Core Method –for transects dominated by silt-clay substrate without heavy filamentous algae growth; these substrate types are often dominated by varying thicknesses of microalgae mats
A corer can be made by cutting off the end of a 60cc plastic syringe, leaving a 5.6 cm2 opening. To extend your reach in deeper water, a long pole (broom handle) can be duct-taped to the syringe.
Locate a representative area within approximately 1 m2 at the sampling locale (R, L, or C) on the transect line. Drive the 60 cc syringe vertically into the substrate to a depth 5-10 cm. The syringe plunger may have to be drawn up as the body of the syringe sinks into the substrate to accommodate the core sample “plug” (the plunger may have too much friction within the barrel to rise on its own as the body of the syringe is punched into the sediment) (Attachment F).
The plug may be comprised of loose sediment that will fall out of the syringe as it is lifted out of the substrate water column. To minimize loss, the sampler should place fingers over the end of the syringe until the core is out of the substrate and water. Immediately invert the syringe to prevent the plug from sliding out of the barrel.
Extrude the core so only the upper 1 cm of the core remains in the syringe. Slice off and discard the lower portion. Place the upper 1 cm portion in a 60 ml centrifuge tube.
IMPORTANT: Assure that all the material adhering to the rubber surface of the plunger-end is carefully collected, as most of the Chla is located there.
Fill out a label with the following information: Sample method (“C” for core) Activity ID w/medium code “C” Waterbody Name Transect letter (AK) Collection Date Collector’s Name
Affix the label to the centrifuge tube and cover it the label with clear tape. Wrap the centrifuge tube completely in aluminum foil, leaving no space for light to enter. Write the Activity ID on the foil with a black ink Sharpie.

Water Quality Planning Bureau Field Procedures Manual For Water Quality Assessment Monitoring
2/27/12 24
Place the foil-wrapped sample into the large Ziploc bag for storage. Immediately store the sample on dry ice; samples should be frozen upon delivery to the lab. The samples should be sent to the laboratory as soon as possible for analysis.
Visual Estimation – for use in place of hoop/core/template sample collection methods when field personnel believe, based on visual estimation, that the entire sampling frame (11 transects) has universally low chlorophyll-a values <50mg/m2
Field personnel may decide that, based on visual assessment, benthic algal Chla is low (<50 mg/m2) at all transects of a stream site. Review the photos in the DEQ chlorophyll-a SOP (Water Quality Planning Bureau, Montana Department of Environmental Quality, 2011b) to see what this level of algal growth looks like. For each stream site, EITHER quantitative samples are collected at all 11 transects, OR photos are taken to document that Chla is <50mg/m2 at all 11 transects. A mixture of photos (i.e., no sample taken) and quantitative Chla samples from a site is not permitted. If you are not confident that algae levels at all transects are equal to or lower than the photos in the SOP (Water Quality Planning Bureau, Montana Department of Environmental Quality, 2011b), then proceed with quantitative Chla sampling.
If all transects appear to be <50mg/m2, take at least one digital photo per transect (AK). Each photo should represent a close-up aerial view of the channel substrate at the transect. Use a polarized lens or filter to reduce glare from the sun and water’s surface to enhance photo quality. Record the photo number and a brief description of each photo on the Photograph Locations and Description Form. If conditions do not allow for substrate photos through the water column and the bottom is rocky, some representative rock samples should be taken to the bank and photographed for each transect.
Single-Transect Method - for use on stream and rivers channels if the sampling frame would exceed approximately 500 meters. If the sampling frame would exceed 500 meters, then it is acceptable to switch to the single-transect method. This entails taking 11 evenly spaced samples across the channel at a defined point (“F” in Figure 6-1). Samples taken at each location within the frame are single collections using the appropriate collection technique for the substrate encountered, as described above using the 11-transect reach-wide method. Single-Transect Method for Large Rivers – for use on large river channels as defined by DEQ (Flynn and Suplee, 2011a). This method entails taking transect samples across the channel at a defined point (often the “F” site) (Water Quality Planning Bureau, Montana Department of Environmental Quality, 2011b). Work on large rivers (Flynn and Suplee, 2010; Flynn and Suplee, 2011b) has shown that an adequate number of samples needs to be collected in the wadeable region. It is recommended that 16 samples be collected across a large-river transect; 11 samples in the wadeable zone, and 5 samples in the non-wadeable zone (if possible). A water depth of 1 m can be used to separate wadeable from non-wadeable zones. Wadeable samples should be equitably distributed out from the R and L banks, to the degree possible, and equally spaced. The five non-wadeable samples can be collected via boat using an Ekman grab or similar device and should be equitably spaced (Water Quality Planning Bureau, Montana Department of Environmental Quality, 2011b).

Water Quality Planning Bureau Field Procedures Manual For Water Quality Assessment Monitoring
2/27/12 25
6.2.2 Phytoplankton (chlorophyll-a in water column) This method is for lakes and sites dominated by pools with green color (light to dark green).
Avoid exposing samples to direct sunlight at all times. Set up the filter apparatus prior to sample collection to minimize the time between sampling and filtration. Use clean forceps to place a glass fiber filter (GF/F nominal pore size 0.70 um) on the filter holder. Use a small amount of tap water from a wash bottle to help settle the filter properly. Rinse the sides of the filter funnel and the filter with a small volume of tap water. Attach the filter funnel and connect the plastic tubing and vacuum pump.
Rinse a 100-250 ml graduated cylinder 3 times with tap water (a smaller graduated cylinder may be necessary if the filter clogs with <20ml in the next two steps).
IMPORTANT: Filtration MUST be performed in the field!
Measure ≥20 ml of stream water in the graduated cylinder, pour it into the filter funnel, and place the cap on the filter funnel. Draw the sample through the filter using the hand pump (Note: To avoid rupture of fragile algal cells, do not exceed 9 inches Hg on the vacuum gage).
Keep track of the volume of sample filtered! The volume of sample filtered can vary from 5 ml to 1000 ml or more. When filtration slows and the filter has developed a distinct green (or green-brown) color, sufficient sample has been filtered. Do not allow the filter to clog. If a filter completely clogs while water remains in the upper half of the filter funnel, discard the filter and start again, using less water volume (note that this differs from the allowable method for collecting benthic algae templates presented in Section 6.2.1).
After filtration is complete, unplug the hand pump, remove the filter funnel from the filter holder, and remove the filter with clean forceps. Avoid touching the colored portion of the filter. Fold the filter in half, with the colored side folded in on itself, and place the folded filter in a 50 ml centrifuge tube).
Fill out a label with the following information: Sample Type Collection Date Collector’s Name Activity ID w/medium code “PHY” Waterbody Name Volume filtered Replicate # (1 or 2)
Affix the label to the centrifuge tube and cover the label with clear tape. Wrap the tube completely in aluminum foil, leaving no space for light to enter. Write the Activity ID and date on the foil with a black ink Sharpie.

Water Quality Planning Bureau Field Procedures Manual For Water Quality Assessment Monitoring
2/27/12 26
Place the foil-wrapped centrifuge tube in a small Ziploc bag. Immediately store the sample on dry ice; samples should be frozen upon delivery to the lab. The samples should be sent to the laboratory as soon as possible for analysis.
Always collect one additional field replicate phytoplankton sample following the same procedures for collection, labeling, and storage described in the paragraphs above, using a different centrifuge tube for replicate #1 and replicate #2.
6.2.3 Recording the chlorophyll-a sampling event(s) on the Site Visit Form Benthic chlorophyll-a Refer to Attachments C and D, lines 18-20. Phytoplankton Refer to Attachments C and D, lines 21-22.
6.2.4 Quality Control – field duplicates Duplicate samples for benthic Chla do not generally need to be collected unless project DQOs
require a high degree of defensibility. If a duplicate sampling event is desired, repeat the entire process but commence the duplicate’s pattern at transect A at one of the two remaining transect starting points (e.g., if R was used for the first sampling, use L or C). Follow the pattern upstream accordingly as described in Section 6.1.5.
Wherever phytoplankton is sampled, always collect one replicate field sample in addition to the initial phytoplankton sample. Follow the protocol described above for sample collection, labeling, storage and transport. Assure that the grab sample is collected from an undisturbed location that is in near proximity to the initial grab sampling locale.
6.3 PERIPHYTON (REACH-WIDE COMPOSITE SAMPLING METHOD)
Periphyton are algae that live attached to or in close proximity to the stream bottom. Measures of the structure of algal associations, such as species diversity and dominance, can be sensitive and useful indicators of water-quality impacts and ecological disturbance. For identification and enumeration of algae, one of two sample collection methods should be used: (1) PERI-1, or (2) PERI-1mod. Each is described below, with suggestions as to which types of streams or studies the method may be most applicable to. The goal for both methods is to collect a single composite sample that is a miniature replica of the stand of microalgae and macroalgae which are present at the study site. Refer to the DEQ periphyton SOP (Water Quality Planning Bureau, Montana Department of Environmental Quality, 2011a) for further instruction. Index Period: Periphyton samples that will be used to derive increaser diatom metrics per Teply (Montana Department of Environmental Quality, 2010b; Montana Department of Environmental Quality, 2010a) are to be collected during the July 1st to September 30th index period. Furthermore, high flows and turbid waters should be avoided because they limit access to and obscure visibility of the stream bottom. Assessments should be delayed for at least two weeks following high, bottom-scouring streamflows to allow for recolonization by algae and succession to a mature periphyton community. If monitoring for year-to-year trends, perform data collection about the same time each year (Water Quality Planning Bureau, Montana Department of Environmental Quality, 2011a).

Water Quality Planning Bureau Field Procedures Manual For Water Quality Assessment Monitoring
2/27/12 27
You may (but are not required to) complete the Aquatic Plant Visual Assessment Form (2012 version) while collecting quantitative measurements of periphyton at each transect AK (see Attachment H and K for form completion guidance and to access the form). If the stream you are assessing does not entail laying out a longitudinal reach (i.e., with PERI-1 method below), use only the “F” labeled form in Attachment K. For this latter scenario, use one “F” site form per stream site.
Take at least one digital photograph at each transect at which the Aquatic Plant Visual Assessment Form is filled out. When using the PERI-1 method, take the photo at “F” site only. When using the PERI-1mod method, take one photo per transect (AK) at the channel position (R, L, C) where the periphyton sample was collected. These photos should represent a close-up aerial view of the channel substrate in the representative area that was sampled to accompany Aquatic Plant Visual Assessment Form. Use a polarized lens to reduce glare from the sun and water’s surface to enhance photo quality. Record the photo number, latitude, longitude, and a brief description of each photo on the Photograph Locations and Description Form. See Section 7.3.1 for further instruction on site photographs.
6.3.1 Sample collection PERI-1:
The PERI-1 method is appropriate for assessing non-flowing streams where the collector may be restricted to extant large pools, and also for flowing streams where a defined reach is not being established. PERI-1 does not require a defined reach length; rather, it requires that the reach is represented by the sample. Thus, when periphyton is the only biological parameter being sampled, the site layout protocol (11 transects over 40 wetted widths) described in Section 6.1 need not be followed and the PERI-1 method can be used.
Observe conditions about 50 m up- and downstream from the initial arrival site (~100 m total), to assure that the collection area is fairly typical of the site in question. Collect a composite sample of microalgae from natural substrates in proportion to the approximate rank of those substrates at the study site by scraping the entire surface of several rocks (small gravel through cobbles), lifting the algal film off of near-shore sediments, scraping submerged branches, and sucking up fine sediment in depositional areas. Collection tools include a toothbrush or test-tube brush, a small pocket knife, a turkey baster (to suck up fine sediments), and (or) a small stainless steel spoon. Place the material in a plastic tray prior to transfer to a 50 ml (50 cm3) centrifuge tube.
IMPORTANT: The centrifuge tube is fairly small and will fill quickly; do not over-add any particular batch of sampled material. To aide in this, material collected in the plastic tray can be sub-sampled and the subsample transferred to the centrifuge tube. Thoroughly mix the material in the tray prior to sub-sampling.
Pick macroalgae by hand in proportion to their abundance at the site; attempt to visually distinguish between the various growth forms that represent different algal taxa. Macroalgae are collected both for determining community composition and as substrates for microalgae. Include macroalgae with the microalgae composite in the centrifuge tube.
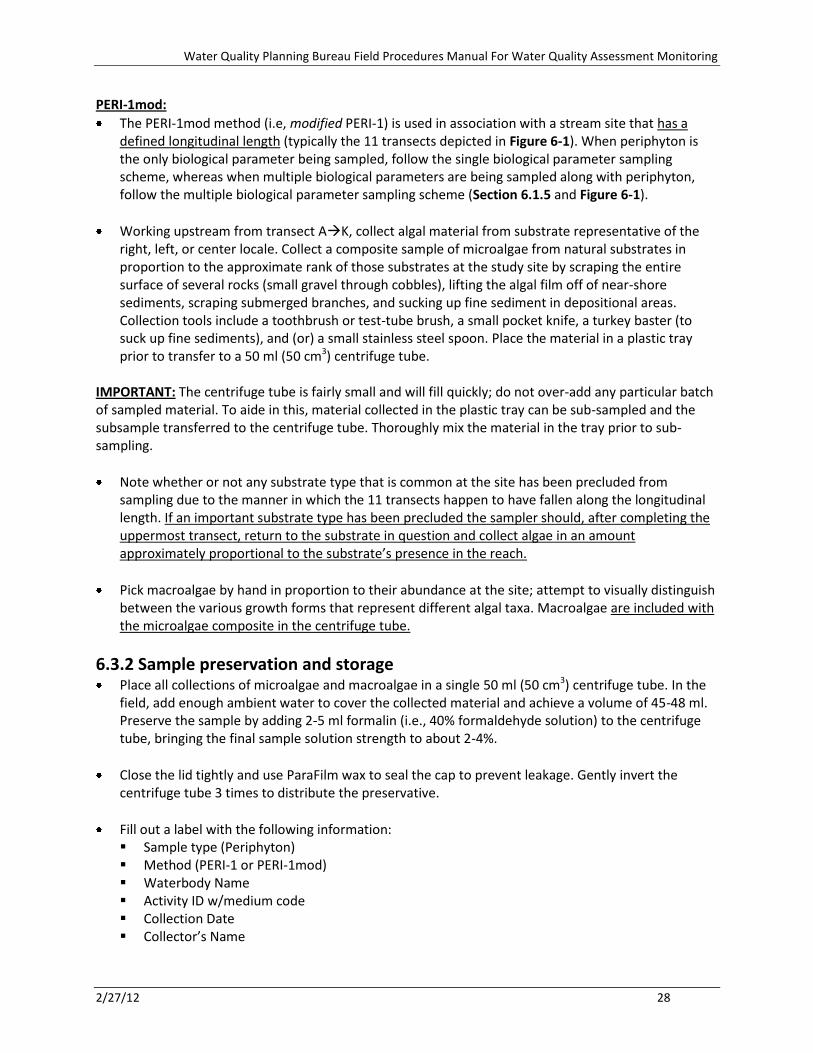
Water Quality Planning Bureau Field Procedures Manual For Water Quality Assessment Monitoring
2/27/12 28
PERI-1mod:
The PERI-1mod method (i.e, modified PERI-1) is used in association with a stream site that has a defined longitudinal length (typically the 11 transects depicted in Figure 6-1). When periphyton is the only biological parameter being sampled, follow the single biological parameter sampling scheme, whereas when multiple biological parameters are being sampled along with periphyton, follow the multiple biological parameter sampling scheme (Section 6.1.5 and Figure 6-1).
Working upstream from transect AK, collect algal material from substrate representative of the right, left, or center locale. Collect a composite sample of microalgae from natural substrates in proportion to the approximate rank of those substrates at the study site by scraping the entire surface of several rocks (small gravel through cobbles), lifting the algal film off of near-shore sediments, scraping submerged branches, and sucking up fine sediment in depositional areas. Collection tools include a toothbrush or test-tube brush, a small pocket knife, a turkey baster (to suck up fine sediments), and (or) a small stainless steel spoon. Place the material in a plastic tray prior to transfer to a 50 ml (50 cm3) centrifuge tube.
IMPORTANT: The centrifuge tube is fairly small and will fill quickly; do not over-add any particular batch of sampled material. To aide in this, material collected in the plastic tray can be sub-sampled and the subsample transferred to the centrifuge tube. Thoroughly mix the material in the tray prior to sub-sampling.
Note whether or not any substrate type that is common at the site has been precluded from sampling due to the manner in which the 11 transects happen to have fallen along the longitudinal length. If an important substrate type has been precluded the sampler should, after completing the uppermost transect, return to the substrate in question and collect algae in an amount approximately proportional to the substrate’s presence in the reach.
Pick macroalgae by hand in proportion to their abundance at the site; attempt to visually distinguish between the various growth forms that represent different algal taxa. Macroalgae are included with the microalgae composite in the centrifuge tube.
6.3.2 Sample preservation and storage Place all collections of microalgae and macroalgae in a single 50 ml (50 cm3) centrifuge tube. In the
field, add enough ambient water to cover the collected material and achieve a volume of 45-48 ml. Preserve the sample by adding 2-5 ml formalin (i.e., 40% formaldehyde solution) to the centrifuge tube, bringing the final sample solution strength to about 2-4%.
Close the lid tightly and use ParaFilm wax to seal the cap to prevent leakage. Gently invert the centrifuge tube 3 times to distribute the preservative.
Fill out a label with the following information: Sample type (Periphyton) Method (PERI-1 or PERI-1mod) Waterbody Name Activity ID w/medium code Collection Date Collector’s Name

Water Quality Planning Bureau Field Procedures Manual For Water Quality Assessment Monitoring
2/27/12 29
Affix the label to the centrifuge tube and cover the label with clear tape. Place samples in a cooler without ice with the lid closed (after preservation with formalin, samples can be transported without refrigeration, but they should be protected from light until the time that they are processed). Prop the tubes up so they will not fall over. Samples stored for a long time should be checked and may be replenished with formalin, if needed.
6.3.3 Recording the periphyton sampling event on the Site Visit Form Refer to Attachments C and D, line 23.
6.3.4 Quality control – field duplicates To measure the degree of influence by the judgment of the sampler of what is considered a representative sample, replicate samples may be collected and submitted to the same taxonomist (to minimize counting and identification differences) in order to determine Percent Taxonomic Difference (PTD). If PERI-1mod has been used, the sampler should collect the replicate PERI-1mod sample via the multiple biological parameters sampling scheme (Section 6.1.5 and Figure 6-1).
6.4 BENTHIC MACROINVERTEBRATES
This section describes the semi-quantitative benthic macroinvertebrate sample collection method used by the DEQ in wadeable streams (first order and higher). The method aligns with EPA’s Environmental Monitoring and Assessment Program (EMAP) benthic macroinvertebrate field methods (reach-wide) (Peck, et al., 2006). DEQ primarily follows the reach-wide macroinvertebrate sampling protocol. If a SAP/QAPP is developed which includes a sample collection method that differs from the reach-wide method (e.g., targeted riffle), refer to the historical SOP or field manual containing the appropriate method description.
6.4.1 Sample collection EMAP reach-wide method:
When macroinvertebrates are the only biological sample being collected, follow the single biological parameter sampling scheme (transect AK) described in Section 6.1.4. When multiple biological parameters are being sampled in along with macroinvertebrates (chlorophyll-a and (or) periphyton), follow the multiple biological parameter sampling scheme described in Section 6.1.5 and depicted in Figure 6-1.
The kick samples from each transect are composited together into 1-liter wide-mouth polyethylene sample jars. Pour a small amount (≤ 500ml) of 95% ethanol (EtOH) in the sample jar(s) prior to collecting the sample; this will help avoid predation and decomposition during sample collection. Estimate how many jars you will need; expect 2-3 jars per site in Western MT streams and 4-5 jars per site in Eastern MT streams. Each replicate will receive its own set of jars.
At each transect, working upstream from transect A K, locate a representative point at the designated channel position (R, L, C) along the transect to be sampled (Figure 6-1). Position a 500um D-frame kick net within a representative portion of the designated channel location and hold the net vertically upright with the base of the frame in contact with the substrate and the open portion of the net facing into the flow.

Water Quality Planning Bureau Field Procedures Manual For Water Quality Assessment Monitoring
2/27/12 30
Collect a kick sample at each transect by first picking up any substrate within a 1ft2 (0.09 m2) area in front of the net that is golf ball size or larger and cleaning them off into the net. Then disturb the substrate over the same 1 ft2 (0.09 m2) area immediately in front of the net for 30 seconds. Carefully avoid sweeping the substrate and organisms out of the path of flow in front of the net opening while kicking. If there is no flow, use your hands or feet to push material into the net. If there is no flow, and the sampling location is full of aquatic vegetation, sweep the net over the 1 ft2 (0.09 m2) area while disturbing the substrate.
Refer to Section 6.4.2 for instructions on sample transfer, preservation, and storage.
6.4.2 Sample transfer, preservation, and storage At each transect (reach-wide) or riffle unit (targeted riffle), after the sample has been collected,
immerse the net several times to remove fine sediments and concentrate the sample in the bottom of the net, taking care not to lose any of the sample in the stream.
Carefully transfer the sample from the net into 1-liter wide-mouth polyethylene sample jar(s). It may be necessary to use more than one 1-liter polyethylene bottle.
IMPORTANT: Each sample jar must only be filled half to three-quarters of the way with sample to ensure that the same will not decompose before being processed by the lab. Always fill each sample jar to the top with EtOH.
Thoroughly inspect and clean (with stream water) the net after each sampling event to ensure that all organisms have been removed to prevent contamination between sites. Consider the following procedures to ensure that all organisms are removed from the net and placed in the jars: Rinse large rocks, sticks, and other debris into the net and thoroughly inspect them prior to
discarding. Use a small plastic spoon to scoop the sample into the sample jar. Inspect the entire inner surface of the net and use clean forceps to remove any organisms
clinging to the net and place them into the sample jar. Dump the contents of the net into a 500 um sieve, rinse stream water through the sieve to clean
the sample of fine sediment and transfer the sample into the jar. Elutriate each kick sample to separate the organic and inorganic portions before you transfer it
into sample jars; this should help protect the soft-bodied macroinvertebrates from damage caused by inorganic material in the sample jar during sample transport and storage. Elutriate by submerging portions of the sample in a 5 gallon bucket containing some water, vigorously swirl the sample in the water to separate the organic and inorganic portions of the sample, then decant the floating material into the 500 micron sieve and transfer from the sieve into the sample jar. Repeat this process several times until almost the entire organic portion of the sample has been removed. Then transfer the inorganic portion to different sample jars and submit these along with the organic portions to the analytical laboratory.
Spray organisms clinging to the net with a dilute (10%) ammonia or (95%) EtOH solution to detach them from the net. Partially immerse the net in the stream to concentrate the detached organisms at the base of the net and/or use forceps to transfer organisms directly into the jar.
Once a jar is ≤ half-full with collected sample and contains at least 500 ml of 95% ethanol, begin filling another jar. Be sure that the caps are closed tightly between transects and after sample

Water Quality Planning Bureau Field Procedures Manual For Water Quality Assessment Monitoring
2/27/12 31
collection is complete. When sample collection is complete, top off each sample jar with 95% ethanol (EtOH) so the entire jar is full. Note: EtOH is flammable!
Close the lid tightly and use ParaFilm wax to seal the cap to prevent leakage. Gently invert each sample jar 3 times to distribute the preservative.
Fill out a label for each sample jar with the following information, affix the label(s) to the sample jar(s) and cover the label with clear tape: Sample Type (Macroinvertebrate) Method (reach-wide or targeted riffle) Waterbody Name Sample Jar Number (i.e., 1 of 2, 2 of 2) Activity ID w/medium code Collection Date Collector’s Name
Place samples in a cooler without ice. Prop the bottles up so they will not fall over. Keep the cooler closed to avoid light exposure.
6.4.3 Recording the macroinvertebrate sampling event on the Site Visit Form Refer to Attachments C and D, lines 24-25.
6.4.4 Quality Control – field duplicates Field personnel should collect co-located duplicate samples at a predetermined number of sampling
sites (typically 10% of the total samples collected), as described in the project plan (SAP/QAPP). These are two or more samples, collected side-by-side or consecutively, at the sampling site. Duplicate samples should be collected at places that are very similar in terms of depth, substrate, composition, and slope. Avoid sample contamination by always collecting samples from downstream to upstream.
When collecting duplicate samples with the EMAP reach-wide method, use the multiple biological parameter sampling scheme (Section 6.1.5). Choose a channel position (R, L, M) to begin sampling at transect A that differs from that used for the initial macroinvertebrate sample collection or other biological parameters to avoid overlap.
Refer to the project plan (SAP/QAPP) for quality control criteria.
Fill out a separate Site Visit Form for duplicate samples. Fill this new form the same as the initial Site Visit Form (Section 6.4.3), except use a distinct Activity ID (i.e., site visit code) and write “Duplicate Samples” in the “Site Visit Comments” field. Use the same medium code as the initial samples (“M” for macroinvertebrates) (Refer to Attachments C and D, lines 24-25).

Water Quality Planning Bureau Field Procedures Manual For Water Quality Assessment Monitoring
2/27/12 32
7.0 SET-UP AND COLLECTION OF PHYSICAL AND HABITAT INFORMATION
7.1 TOTAL DISCHARGE (FLOW)
Three methods are available for measuring flow (in descending order of preference): (1) flow meter, (2) float, and (3) visual estimation. The practicality of using certain methods is largely dependent upon the flow condition of the stream. For instance, a flow meter can only be used in streams that have sufficient water depth to reliably use the instrument (≥0.2 in).
7.1.1 Flow Meter Method (quantitative) Meter settings
A Marsh-McBirney FlowMate flow meter is used with a top-setting wading rod to adjust the depth at which the probe is positioned in the stream channel. Attach the probe to the top-setting wading rod and secure it in place with the screw provided. Turn on the flow meter. Refer to the instrument operations manual for further details on use, calibration and maintenance.
Set the flow meter to the “fixed point average” (FPA) setting, which provides an average of velocities over a fixed period of time, and specify a FPA interval of 10 seconds. Set the units to either ft/s or m/s.
Choosing a cross-section
The flow meter method is appropriate for narrow streams where 10-15 points along a cross-section can be measured, or wide streams where 20-30 points along a cross-section can be measured. A flow meter with wading rod can only be used in streams that have sufficient water depth to reliably use the instrument (≥0.2 in).
Choose a location for the cross-section in a straight reach with laminar flow; a glide is preferred. Consider the following guidance: Location should be free of disturbances (i.e., boulders, aquatic growth, pipe joints, inflowing or
out flowing side channels or tributaries, other obstructions) Flow should be free of swirls, eddies, vortices, backward flow, and dead zones Avoid areas downstream of sharp bends, upstream or downstream of vertical drops or where
stream empties into a stationary body of water Use best judgment in choosing the best site when all of the above criteria do not exist.
Setting up the cross-section
Stretch a tape (ft or m) between end-points of your cross-section, ensuring that it is oriented perpendicular to flow. The tape should be stretched at a minimum from water’s edge to water’s edge; however, it is acceptable to extend the tape beyond water’s edge on either bank to allow for ease of securing the tape. Use bank pins or stakes to secure the ends of the tape in place.
For narrow streams, divide the distance from left water’s edge to right water’s edge by 10-15; for wide streams, divide the distance from 20-30 to determine the number of equidistant points along the cross-section at which flow measurements will be collected. It is acceptable to round to nearest 0.25 ft or 0.1 m for ease of determining the distance between points of measurement.

Water Quality Planning Bureau Field Procedures Manual For Water Quality Assessment Monitoring
2/27/12 33
Recording flow measurements
Flow is measured at multiple equidistant points from left water’s edge to right water’s edge to account for complexity and variability in channel shape and flow patterns. Start at left water’s edge and call out the location on the tape to the person recording the data. At left water’s edge and right water’s edge (the initial and final points of measurement, respectively) the depth and velocity will each be recorded as “0”.
From left water’s edge, move across the channel cross-section toward right water’s edge, locate the next point of measurement on the tape (calculated previously) and, holding the wading rod vertical and steady with the base on top of the substrate, position the probe directly into (parallel to) the flow. Stand downstream from the tape and meter and at least 18” off to the side of the wading rod to avoid disrupting the flow measurement.
Read the depth on the graduated hex main rod at this point to the person recording the data. Each mark on the rod is 0.1 ft. Double marks are at 0.5 ft and triple marks are at 1 ft.
IMPORTANT: Be careful not to push the base of the wading rod down into the substrate when measuring flow in streams with soft substrates.
Position the probe to 0.6 depth by adjusting the round setting rod to the depth of the water (from the previous step). Slide the round sliding rod to line up the foot (or meter) scale on the sliding rod with the tenth scale on top of the main hex rod. For example, if the water depth is 2.7 ft, line up the 2 on the round sliding rod with the 7 on the tenth scale on the top of the main hex rod.
Once positioned to begin recording measurements, wait for a new averaging interval to begin or hit the reset button (ON/C). Allow the flow meter to cycle through three 10-second fixed point average intervals, then call out the average of these three values to the person recording the data.
Fill in the header information on the Total Discharge Form: Collection data Personnel name(s) Waterbody name Activity ID Transect letter nearest to flow cross-section
Fill in the following fields on the Total Discharge Form and circle the proper units: Distance on tape (ft or m) Depth (ft or m) Velocity at point (ft/s or m/s) Comments (i.e., “left water’s edge”, “right water’s edge”, channel irregularities or unavoidable
obstructions like channel islands)
7.1.2 Float Method (semi-quantitative) The floating stick/ball method is a semi-quantitative method of determining flow. It is important to note this method tends to underestimate the flow due to slower velocity near the surface, but it is more accurate than a visual estimate.

Water Quality Planning Bureau Field Procedures Manual For Water Quality Assessment Monitoring
2/27/12 34
Find a stream reach that is straight and uniform in width and depth; a glide is preferred. This will assure that laminar flow is achieved to the greatest extent possible. Measure a length at least twice the mean wetted width (≥50 ft is preferable) and mark each end by hanging flagging or driving a stake or rebar into the ground at the high water line.
Determine the mean width (from the water’s edge) by measuring at least three cross-sections (if wadeable), using a rangefinder, or by making a visual estimate.
Determine the mean depth by measuring depth at multiple points throughout the reach (if wadeable) or by making a visual estimate.
Record the measured distance and a description of each stake’s location on the Total Discharge Form for high flow. Note landmarks and make a sketch if necessary to help identify stake locations in the event that they are no longer in place during subsequent flow measurements. Photograph both stakes to record their location along the streambank and the water level.
Toss a small stick or other biodegradable floating object (i.e., an orange) heavy enough to stay in and move consistently with the main current into the middle of the stream above the upstream marker of the measured reach. Begin timing when the object passes the upstream marker. Count (with a watch or stopwatch) the seconds it takes the object to reach the downstream marker. The object must stay in the main current. If it does not, repeat the measurement. Complete three measurable floats. Remove the stakes upon completion unless subsequent site visits requiring flow measurement are anticipated.
Record the following information on the Total Discharge Form for high flow: Reach length (ft or m) Mean depth (ft or m) Mean width (ft or m) Float times (sec)
Complete the following calculations on the Total Discharge Form for high flow: Cross-sectional area (m2 or ft2) = Mean width x Mean depth Average float time (sec) = (Float time 1 + Float time 2 + Float time 3) / 3 Float velocity (ft/sec or m/s) = Reach Length / Average float time Discharge (ft3/sec or m3/sec) = Cross-sectional area x Float velocity
7.1.3 Estimated Flow Estimated flow is a simple observation. This should only be used for very small streams that will not support the use of flow meters or the float method. When estimating flow, record a single estimated value rather than a range. Field crews are encouraged to include remarks about flow on the Summary Form, particularly if it will not be measured.
7.1.4 Recording Flow Measurements on the Site Visit Form Refer to Attachment C and D, lines 30-31.

Water Quality Planning Bureau Field Procedures Manual For Water Quality Assessment Monitoring
2/27/12 35
7.2 CHANNEL CROSS-SECTIONS
The cross-section method contains elements of Rosgen Level II measurement but should not be confused with the complete Rosgen Stream Classification (Rosgen, 1994).
7.2.1 Laser Level Cross-Section Method Set up the surveying instrument (laser level and tripod) in a location where the entire cross-section can be viewed (i.e., on a hillside above the stream channel) (Figure 7-1). Place the instrument at an elevation higher than the highest feature required for the survey (typically the outermost boundary of the flood-prone area). Position the laser head as level as possible atop the tripod by adjusting the tripod legs and bubble levels, lock the tripod legs into position, and turn the instrument on. Allow the self-leveling feature (if available) a few moments to stabilize; when the red laser begins to spin, the instrument is level. IMPORTANT: Leave the instrument undisturbed in this position for the remainder of the cross-section measurement!
Figure 7-1. Cross-section survey set-up
Choose a location for the cross-section in a straight reach with laminar flow and relatively uniform depth; a glide is preferred. Note: The same cross-section used while measuring flow may be appropriate for use with this method. Consider the following guidance, where possible, when choosing a cross-section: Locate the cross-section in a straight reach between two major curves in the stream Avoid wide floodplains Avoid cross-sections with tall obstructions in the stream channel or in the floodplain.

Water Quality Planning Bureau Field Procedures Manual For Water Quality Assessment Monitoring
2/27/12 36
Stretch a tape (ft or m) between end-points of your cross-section from left bankfull to right bankfull (or slightly beyond), ensuring that the tape is perpendicular to the channel. Use bank pins or stakes to secure the tape in place (Figure 7-1).
Attach the clamp attachment exactly at the top of a stadia rod such that the side with the laser panel on the clamp is facing away from the numeric gradations on the stadia rod.
If bankfull is not obvious on both banks, locate bankfull on the side that is most obvious, place the base of the stadia rod at this point and adjust the rod height until the sensor intercepts the laser. Then move to the opposite bank and walk upslope holding the stadia rod vertical; mark bankfull at the point where the sensor again intercepts the laser.
Determine the distance on the tape between left bankfull and right bankfull. Divide this distance by 15-30 to obtain 15-30 equidistant points along the cross-section within bankfull (use 30 points for larger streams).
IMPORTANT: Measurements must be taken at left bankfull (LBF), Thalweg (THL), and right bankfull (RBF); if the 15-30 calculated points along the cross-section do not fall exactly on these points, add these three additional locations (distances on the tape) to the Channel Cross-Section Form. Cross-section survey measurement
Begin the cross-section survey. Beginning at left bankfull and moving toward right bankfull, position the surveying rod on the stream substrate at each of the distances on the tape calculated in the previous step. Collect cross-section measurements at each calculated distance, as well as major breaks in bed elevation and key features such as right bankfull (RBF), right water’s edge (RWE), Thalweg (THL), left water’s edge (LWE), and left bankfull (LBF) (Attachment J).
At each distance point (“station”), hold the stadia rod vertical with the base on the substrate and adjust the rod height by extending or collapsing rod segments until the laser clamp indicates it is level with the laser level on the tripod (beeping will stop and high-pitched tone will remain constant).
Record the station (distance on the tape, ft) and the corresponding foresight (elevation, ft) at each station on the Channel Cross-Section (Laser) Form. Include notation indicating right bankfull (RBF), right water’s edge (RWE), Thalweg (THL), left water’s edge (LWE), and left bankfull (LBF). Note: It may be easiest to have one field crew member read the measurements off and the other record the information.
Flood-prone area calculations
Calculate in column “Height; Depth or Elevation”: Line 1: Subtract RBF from itself = 0 Lines 2 - X: Subtract RBF from each subsequent foresight measurement
Calculate the average of all values in the “Height” column = average elevation
Calculate the elevation of the flood-prone area (FPA): Step 1: Measure foresight at Max Depth (Dmax)

Water Quality Planning Bureau Field Procedures Manual For Water Quality Assessment Monitoring
2/27/12 37
Step 2: Measure foresight at right bankfull (RBF) Step 3: Subtract step 2 from step 1 (Dmax – RBF) Step 4: Multiply step 3 by 2 ((Dmax-RBF) x 2) Step 5: Subtract step 4 from Step 1 (Dmax - ((Dmax-RBF) x 2))
Adjust the stadia rod height to the elevation of the FPA (step 5 above). Move the rod up the bank slope and along the cross-section (away from the stream channel) in both directions until the sensor intercepts the laser. Mark the FPA locations on both banks.
Use a rangefinder or tape to measure the straight-line distance between the two FPA locations. This is the flood-prone area width (Wfpa) (width of the channel at an elevation that is 2 times the maximum bankfull depth).
Calculate the bankfull cross-sectional area and plot your cross-section.
Calculate mean depth and the width/depth ratio (bankfull width/mean depth)
Calculate the entrenchment ratio = FPA width (Wfpa) / Bankfull width (Wbkfl)
Record the distance point (or “station”) (ft), the corresponding Fore-Sight (ft), and the Height Depth or Elevation (ft).
If feasible, use appropriate regional curves to check that the calculated cross-sectional area, bankfull width and depth are reasonable. Also, check that calculated bankfull velocity is reasonable (Velocity = Bankfull Discharge/Bankfull Area).
7.2.2 Laser Level Water Surface Slope Measurements Position the laser level on tripod as described in the Laser Level Cross-Section Method (Section
7.2.1). Keep laser level in same position if measuring water surface slope at same time as cross-section.
Locate two end points along stream channel between which to measure water surface slope. This portion of the stream should measure from one stream feature to a similar stream feature (i.e., top of pool to top of pool) and should include 3 pool-riffle series.
Stretch a tape along one bank of the stream from the upper end point to the lower end point; record the distance at the upper end point as “0” and record the distance at the lower end point (ft or m) on the Channel Cross-Section (Laser) Form.
Set the base of the stadia rod at water’s edge (left or right) and extend it until the sensor intercepts the laser. Record the height at distance “0” (upper end point, ft or m). Walk downstream along the stream channel until reaching the lower end point. Set the base of the stadia rod at water’s edge (left or right, same as previous step) and extend it until the sensor intercepts the laser. Record the height at distance “x” (lower end point, ft or m).
Perform and record the following calculations: Δ Height = (height at lower end point) – (height at upper end point)

Water Quality Planning Bureau Field Procedures Manual For Water Quality Assessment Monitoring
2/27/12 38
Δ Distance = (distance on tape at lower end point) – (distance on tape at upper end point) Slope = Δ Height / Δ Distance
7.2.3 Non-Laser Level Cross-Section Method Identify a representative riffle cross-section in the stream reach which typifies the form of the
stream. Pick a fairly straight section where the channel is somewhat constricted; avoid large boulders and large woody debris which alter the form and lateral extent of the channel.
Install stakes at both left bankfull and right bankfull elevation. Attach the tape first to the left bank stake, facing downstream. Pull the tape tight and attach it to the right bank stake. If the tape is so long that it tends to sag, install a nylon cord tightly at the same points on the stakes so you may have a more uniform horizontal plane to measure to.
IMPORTANT: To achieve a near-level bankfull elevation, measure the bankfull-to-water surface distance at the side with the most reliable bankfull indicator, and then adjust level of the tape at the other side of the channel to correspond with that measurement.
Determine the distance on the tape between left bankfull and right bankfull. Divide this distance by 15-30 to obtain 15-30 equidistant points along the cross-section within bankfull (use 30 points for larger streams).
Measure the cross-section from left bankfull to right bankfull. IMPORTANT: Measurements must be taken at left bankfull (LBF), Thalweg (THL), and right bankfull (RBF); if the 15-30 calculated points along the cross-section do not fall exactly on these points, add these three additional locations (distances on the tape) to the Non-Laser Level Cross-section Form.
Record the station (distance on the tape, ft) and the corresponding depth (measured from the channel bottom to the tape or nylon cord, ft) at each station on the Non-Laser Level Cross-section Form. Include notation indicating right bankfull (RBF), right water’s edge (RWE), Thalweg (THL), left water’s edge (LWE), and left bankfull (LBF).
7.2.4 Recording Cross-Section Measurements on the Site Visit Form Refer to Attachment C and D, line 30.
7.3 SITE DOCUMENTATION
7.3.1 Digital Photographs Photographs should be taken on-site during each site visit unless directed otherwise.
Photo points are required where conditions are observed that indicate waterbody character (i.e., width, substrate type, channel form, woody debris, human disturbance or other potential pollutant sources).
Suggested minimum photo points include a photo at “F” site facing across the channel, at “F” site facing upstream, and at “F” site facing downstream
Water Quality Planning Bureau Field Procedures Manual For Water Quality Assessment Monitoring
2/27/12 39
Take at least one digital photograph at each transect where the Aquatic Plant Visual Assessment Form is completed. When using the benthic chlorophyll-a reach-wide method (Section 6.2) or the periphyton PERI-1mod method (Section 6.3), take one digital photo per transect (AK) at the channel position (R, L, C) where the samples were collected. When using the periphyton PERI-1 method (Section 6.3), take at least one photo at the “F” site. These photos should represent a close-up aerial view of the channel substrate in the representative area that was sampled using either method. Use a polarized lens to reduce glare from the sun and water’s surface to enhance photo quality.
For every photo taken, record the following information on the Photograph Locations and Description Form: Waterbody name Activity ID Personnel name Date Site visit number Photo number for each photo GPS coordinates (latitude, longitude) for each photo Brief description of photo location (i.e., “Transect A, channel substrate”)
Refer to Attachment C and D, line 27.
8.0 WRAP-UP
Verify that all necessary field forms are completed before leaving the site.
Return to vehicle.
Complete preservation of samples as follows: Ensure that all sample bottles and containers are properly labeled, properly preserved and
tightly closed, and all Ziploc bags are sealed Place all water and sediment chemistry samples (total, dissolved, and sediment metals,
nutrients, commons) in a cooler on wet ice. Confirm that all chlorophyll-a samples are completely covered with foil and place the samples in
a cooler on dry ice. Ensure each macroinvertebrate sample bottle is topped off with 95% ethanol, and place the
samples in a cooler without ice. Place all periphyton samples in a cooler without ice.
Deliver the samples to the laboratory according sample to holding time schedule and sign the chain of custody form upon delivery (Attachments C and D, lines 36-40).
9.0 REFERENCES
Biggs, B. J. F. 2000. New Zealand Periphyton Guideline: Detecting, Monitoring and Managing Enrichment of Streams. Christchurch, New Zealand: NIWA.

Water Quality Planning Bureau Field Procedures Manual For Water Quality Assessment Monitoring
2/27/12 40
DiTomaso, Joseph and Evelyn Healy. 2003. Aquatic and Riparian Weeds of the West, Publication No. 3421 ed., Oakland, CA: University of California Agriculture and Natural Resources.
Flynn, Kyle and Michael Suplee. 2010. Defining Large Rivers in Montana Using a Wadeablity Index: Montana Department of Environmental Quality, Water Quality Planning Bureau.
-----. 2011a. Defining Large Rivers in Montana Using a Wadeablity Index: Montana Department of Environmental Quality, Water Quality Planning Bureau.
-----. 2011b. Using a Computer Water Quality Model to Derive Numeric Nutrient Criteria; Lower Yellowstone River (Final Draft). Helena, MT: Montana Department of Environmental Quality. Report WQPBDMSTECH-22.
Montana Department of Environmental Quality. 2010a. "Low-Level" Total Mercury Sampling Procedure for Wadeable Streams (Draft). Helena, MT: Montana Department of Environmental Quality.
-----. 2010b. Call for Data Guidance Manual. http://deq.mt.gov/wqinfo/datamgmt/mtewqx.mcpx. Accessed 1/18/12b.
-----. 2011. Water Quality Assessment Method. Helena, MT: Montana Department of Environmental Quality.
O'Ney, S. E. 2009. "Standard Operating Procedure #1: Initial Site Establishment, Version 1.0," in Water Resource Monitoring Protocol, Version 1.0, Appendix VIII, (Bozeman, MT: National Park Service, Greater Yellowstone Network)
Peck, D. V., A. T. Herlihy, B. H. Hill, R. M. Hughes, P. R. Kaufmann, D. J. Klemm, J. M. Lazorchak, F. H. McCormick, S. A. Peterson, P. L. Ringold, T. Magee, and M. Cappaert. 2006. Surface Waters Western Piolot Study: Field Operations Manual for Wadeable Streams. Environmental Protection Agency. Report EPA 620-R-06/003. http://www.epa.gov/wed/pages/publications/authored/EPA620R-06003EMAPSWFieldOperationsManualPeck.pdf. Accessed 1/18/12.
Rosgen, David L. 1994. A Classification of Natural Rivers. Catena. 22: 169-199.
Suplee, M. and R. Sada de Suplee. 2011a. Assessment Methodology for Determining Wadeable Stream Impairment Due to Excess Nitrogen and Phosphorus Levels. Helena, MT: Montana Department of Environmental Quality Water Quality Planning Bureau. Report WQPMASTR-01.
Suplee, Michael and Rosie Sada de Suplee. 2011b. Technical Memorandum: Best Use of MiniDOT Loggers for Dissolved Oxygen Measurement in Streams and Rivers. Helena, MT: Montana Department of Environmental Quality.

Water Quality Planning Bureau Field Procedures Manual For Water Quality Assessment Monitoring
2/27/12 41
Suplee, Michael W., Vicki Watson, Mark E. Teply, and Heather McKee. 2009. How Green Is Too Green? Public Opinion of What Constitutes Undesirable Algae Levels in Streams. Journal of the American Water Resources Association. 45(1): 123-140.
Suplee, Michael W., Vicki Watson, Arun Varghese, and Joshua Cleland. 2008. Scientific and Technical Basis of the Numeric Nutrient Criteria for Montana's Wadeable Streams and Rivers. Helena, MT: Montana Department of Environmental Quality.
Water Quality Planning Bureau, Montana Department of Environmental Quality. 2005. Field Procedures Manual for Water Quality Assessment Monitoring. Helena, MT: Montana Department of Environmental Quality. http://www.deq.mt.gov/wqinfo/qaprogram/PDF/SOPs/WQPBWQM-020.pdf. Accessed 1/10/12 A.D.
-----. 2011a. Periphyton Standard Operating Procedure. Helena, MT: Montana Department of Environmental Quality. Report WQPBWQM-010_FNL.
-----. 2011b. Sample Collection and Laboratory Analysis of Chlorophyll-a: Standard Operating Procedure. Helena, MT: Montana Department of Environmental Quality. Report WQPBWQM-011v.5_FNL.
Woods, Alan J., James M. Omernik, John A. Nesser, Jennifer Shelden, Jeffrey A. Comstock, and Sandra J. Azevedo. 2002. Ecoregions of Montana, 2nd ed., Reston, VA: United States Geographical Survey.

Water Quality Planning Bureau Field Procedures Manual For Water Quality Assessment Monitoring – Attachment A
2/27/12 A-1
ATTACHMENT A – FIELD SUPPLY LIST
A1.0 PHYSICAL ATTRIBUTES
1 – hand-help GPS receiver with user manual (i.e., Magellan SportTrak MAP, Garmin GPS 60) Maps (topographic, US Forest Service, BLM, property boundary) Digital camera with user manual, additional memory card, polarized lens and lens adapter YSI 85 hand-held meter with user manual and replacement membrane kit 1 – air thermometer 1 – small squirt bottle of DI water to clean probes 1 – hand-held pH meter with user manual and buffer solutions (4.0, 7.0, 10.0) for calibration Marsh-McBirney FlowMate flow meter 1 – top-setting wading rod for use with flow meter 2 –tapes for determining cross-sections (1, 100 ft. and 1, 300 ft. or 1, 50m and 1, 100m) 2 – bank pins or stakes 1 –field watch with timer Rebar (optional) Roll of twine or thin rope (optional) Hammer or mallet (optional) Stadia rod Laser level , tripod, and laser sensor 1 - Rangefinder 1 – calculator
A2.0 WATER COLUMN SAMPLES
Refer to Attachment B for water chemistry sample bottle sizes and preservatives sulfuric acid (H2SO4) nitric acid (HNO3) 250 ml plastic bottles for metals and nutrients samples 500ml or 1L plastic bottle(s) for suspended solids (TSS) and dissolved solids (TDS) 1 – 60 cc syringe to collect water for each dissolved metals sample Disposable 0.45 um filters for filtering water for dissolved metals sample 1 – large cooler for new bottles 1-2 – large cooler(s) for sample storage on ice (regular ice and dry ice kept in separate
coolers)
A3.0 METALS SEDIMENT SAMPLES
1 – 2L wide mouth Nalgene bottle 1 – two-piece plastic Buchner funnel 2 – 12”x12” squares of 63 micron nylon mesh 1 – large plastic spoon to scoop stream bed sediment into funnel 1 – 1000 ml squeeze bottle of dilute nitric acid (5%) for washing equipment between sites 1 – 1000 ml bottle of DI water for rinsing after acid wash 1 – large cooler for sample storage on ice 1 – small cooler for equipment storage

Water Quality Planning Bureau Field Procedures Manual For Water Quality Assessment Monitoring – Attachment A
2/27/12 A-2
A4.0 LOW-LEVEL MERCURY SAMPLES
Gloves: Clean, non-talc (i.e. powder-free) polyethylene, latex, vinyl, or PVC; one pair of gloves per site for “dirty hands”, two pairs of gloves per site worn by “clean hands”. Gloves must be bagged by the analyzing lab or in a clean indoor environment and then stored in a clean cooler. Under no circumstances will non-bagged gloves be stored in the field vehicle, e.g. do not store open boxes of gloves in the vehicle cab, storage space, or in a cooler. The pair of gloves for “dirty hands” is stored separately from the gloves for “clean hands” in a sealed plastic bag. The two pairs of gloves for “clean hands” are double-bagged. The inner gloves for “clean hands” may be wrist-length while the outer gloves must be at least elbow-length. For dexterity purposes, thin outer length gloves are preferable.
Sample bottles (borosilicate glass or fluoropolymer) - individual bottles are pre-cleaned and double-bagged by the analyzing laboratory)
Plastic coolers (soft-sided, clean) for unused sampling equipment, e.g. glove sets, sample bottles, preservatives, glove bag. Store gloves for dirty hands in a separate cooler. Small enough to carry to sample site.
Plastic coolers (hard-sided, clean) for completed samples. Small enough to carry to sample site, large enough to house bags of ice and one or more sample bottles.
Ice, “wet” Plastic bags (clean) stored in a clean plastic bag within sample supply cooler; zip-type, non-
vented, colorless polyethylene. Garbage bags (large, clean) stored in a clean cooler, for lining sample cooler. Garbage bags (small) stored in a plastic bag within the sample supply cooler; for discarding
used supplies. Hand-wipes Paper towels for drying sample bottles prior to affixing labels; prior to the field trip, the
paper towel is placed in a sealable plastic bag in a clean indoor environment. Labeling supplies: labels, clear tape, black sharpies, and pencil. Field forms, clipboard, pencils, erasers, sharpies.
A5.0 CHLOROPHYLL-A SAMPLES
A5.1 BENTHIC CHLOROPHYLL-A
1 – hoop: copper wire secured in circular hoop (internal surface area 710 cm2) 1 – core: 60cc syringe with tapered end cut off (internal surface area 5.6 cm2) 1 – template: approximately ¾ inch long portion of PVC pipe (internal surface area 12.5 cm2) Pall glass fiber filters (GF/F) (0.70 um) 1 – Filtration unit (filter flask & funnel, o-rings) 1 – vacuum hand pump 1 – set of tubing for vacuum pump Large Ziploc bags – 1 gallon size Small Ziploc bags – sandwich size 50 ml centrifuge tubes 1 – roll aluminum foil ParaFilm wax
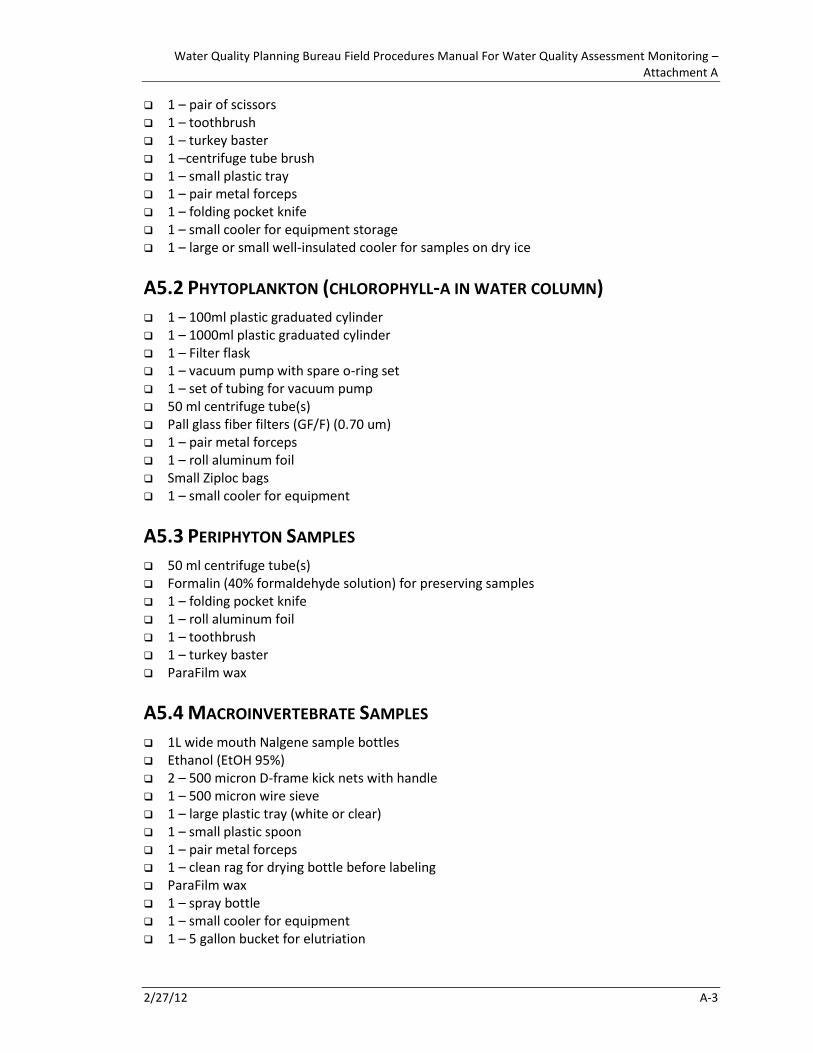
Water Quality Planning Bureau Field Procedures Manual For Water Quality Assessment Monitoring – Attachment A
2/27/12 A-3
1 – pair of scissors 1 – toothbrush 1 – turkey baster 1 –centrifuge tube brush 1 – small plastic tray 1 – pair metal forceps 1 – folding pocket knife 1 – small cooler for equipment storage 1 – large or small well-insulated cooler for samples on dry ice
A5.2 PHYTOPLANKTON (CHLOROPHYLL-A IN WATER COLUMN)
1 – 100ml plastic graduated cylinder 1 – 1000ml plastic graduated cylinder 1 – Filter flask 1 – vacuum pump with spare o-ring set 1 – set of tubing for vacuum pump 50 ml centrifuge tube(s) Pall glass fiber filters (GF/F) (0.70 um) 1 – pair metal forceps 1 – roll aluminum foil Small Ziploc bags 1 – small cooler for equipment
A5.3 PERIPHYTON SAMPLES
50 ml centrifuge tube(s) Formalin (40% formaldehyde solution) for preserving samples 1 – folding pocket knife 1 – roll aluminum foil 1 – toothbrush 1 – turkey baster ParaFilm wax
A5.4 MACROINVERTEBRATE SAMPLES
1L wide mouth Nalgene sample bottles Ethanol (EtOH 95%) 2 – 500 micron D-frame kick nets with handle 1 – 500 micron wire sieve 1 – large plastic tray (white or clear) 1 – small plastic spoon 1 – pair metal forceps 1 – clean rag for drying bottle before labeling ParaFilm wax 1 – spray bottle 1 – small cooler for equipment 1 – 5 gallon bucket for elutriation

Water Quality Planning Bureau Field Procedures Manual For Water Quality Assessment Monitoring – Attachment A
2/27/12 A-4
A5.5 FIELD FORMS AND LABELS
Site Visit Form(s) Aquatic Plant Tracking Form(s) Aquatic Plant Visual Assessment Form(s) Photograph Location and Description Form(s) Total Discharge (Flow) Forms Site Summary Forms Channel Cross-Section (Laser) Form(s) Activity ID label(s) (Site Visit Codes) Project ID labels Water chemistry sample labels (nutrients, metals, TSS/TDS, common ions, etc.) Chlorophyll-a (benthic and/or phytoplankton) sample labels Periphyton sample labels Macroinvertebrate sample labels Clip Board Pencils, Sharpies
A5.6 OTHER
First Aid kit Field Procedures Manual Waders/ wader boots Hiking boots Rain gear Insect repellant Bear spray Sunscreen/Hat Drinking water

Water Quality Planning Bureau Field Procedures Manual For Water Quality Assessment Monitoring – Attachment B
2/27/12 B-1
ATTACHMENT B – DEQ MONITORING PARAMETER SUITE
Parameter Preferred Method
Alternate Method
Req. Report Limit ug/L
Holding Time Days
Bottle Preservative
Water Sample - Common Ions and Physical Parameters
Total Suspended Solids (TSS) A2540 D
4000 7
1000 ml HDPE/ 500 ml HDPE
≤6oC
Total Dissolved Solids (TDS) A2540 C
4000 7
Volatile Suspended Solids (VSS) A2540 E
4000 7
Alkalinity (Bicarb., Carb.) A2320 B EPA 310.2 1000 14
Sulfate EPA 300.0 A4110 B 50 28
Chloride EPA 300.0 A4110 B 50 28
E. Coli A9223 B EPA 160.4 1 MPN/ 100 ml 6 hrs 100 ml HDPE ≤10oC
Biochemical Oxygen Demand (BOD)
A5210 B
2000 2 1000 ml HDPE ≤6oC
Carbonaceous Biochemical Oxygen Demand (CBOD)
A5210 B EPA 405.1
2 1000 ml HDPE ≤6oC
Dissolved Organic Carbon (DOC) A5310 B
500 28 125ml Glass Filt. 0.45 um, H2SO4, ≤6
oC
Total Organic Carbon (TOC) A5310 C
500 28 125ml Glass H2SO4, ≤6oC
Sulfide A4500-S2 D
1000 7 250 ml HDPE Zinc Acetate +
NaOH to pH >9, ≤6
oC
Water Sample - Nutrients
Total Persulfate Nitrogen (TPN) A4500-N C A4500-N B 40 28 250ml HDPE ≤6
oC (7 d HT),
Freeze (28d HT)
Dissolved Orthophosphate as P EPA 365.1 A4500-P F 1 2 250ml HDPE Filt. 0.45 um, ≤6oC
Total Phosphorus as P EPA 365.1 A4500-P F 3
28 250 ml HDPE
H2SO4 , ≤6oC or
Freeze Nitrate-Nitrite as N EPA 353.2 A4500-NO3 F 10
Total Ammonia as N EPA 350.1 A4500-NH3 B,C,D,E,or G
50
Water Sample - Dissolved Metals (0.45 um filtered)
Aluminum EPA 200.7 EPA 200.8 30 180 250 ml HDPE Filt 0.45 um, HNO3
Water Sample - Total Recoverable Metals
Total Recoverable Metals Digestion
EPA 200.2 APHA3030F (b) N/A
180 500 ml
HDPE/ 250 ml HDPE
HNO3
Arsenic EPA 200.8
1
Cadmium EPA 200.8
0.03
Calcium EPA 200.7
1000
Chromium EPA 200.8 EPA 200.7 1
Copper EPA 200.8 EPA 200.7 1
Iron EPA 200.7
20
Lead EPA 200.8
0.3
Magnesium EPA 200.7
1000
Potassium EPA 200.7
1000
Selenium EPA 200.8
1
Silver EPA 200.8 EPA
200.7/200.9 0.2
Sodium EPA 200.7
1000
Zinc EPA 200.7 EPA 200.8 8
Antimony EPA 200.8
0.5
Barium EPA 200.7 EPA 200.8 3
Beryllium EPA 200.7 EPA 200.8 0.8
Boron EPA 200.7 EPA 200.8 10
Manganese EPA 200.7 EPA 200.8 5
Nickel EPA 200.7 EPA 200.8 2
Thallium EPA 200.8
0.2
Uranium, Natural EPA 200.8
0.2

Water Quality Planning Bureau Field Procedures Manual For Water Quality Assessment Monitoring – Attachment B
2/27/12 B-2
Parameter Preferred Method
Alternate Method
Req. Report Limit ug/L
Holding Time Days
Bottle Preservative
Water Sample - Total
Mercury EPA
245.1 0.05 28 HDPE, Glass HNO3
Mercury, Ultra low level EPA
245.7 0.005 28 100mL Glass 0.5 ml 12N HCl
Water Sample - Calculated Results
Total Hardness as CaCO3 A2340 B
(Calc) 1000
Sodium Absorbtion Ratio (SAR) Calc
Parameter Preferre
d Method
Alternate Method
Req. Report Limit mg/kg (dry weight)
Holding Time Days
Bottle Preservative
Sediment Sample - Total Recoverable Metals
Total Recoverable Metals Digestion
EPA 200.2
N/A
180 2000 ml
HDPE Widemouth
Arsenic EPA
200.8 EPA 200.9 1
Cadmium EPA
200.8 EPA 200.9 0.2
Chromium EPA
200.8 EPA 200.7 9
Copper EPA
200.8 EPA 200.7 15
Iron EPA
200.7 EPA 200.7 10
Lead EPA
200.8 EPA 200.9 5
Zinc EPA
200.7 EPA 200.7 20
Sediment Sample - Total Metals
Mercury EPA
7471B 0.05 28
2000 ml HDPE
Widemouth
Parameter Preferred Method
Alternate Method
Req. Report Limit mg/m2
Holding Time Days
Bottle Preservative
Substrate Sample - Chlorophyll-a
Chlorophyll-a A 10200
H
21(pH≥7)/ASAP(pH
<7)
Filter Freeze
Ash Free Dry Weight (AFDW) A 10300
C (5)
Bold Italics = These metals are not part of the target metal suite
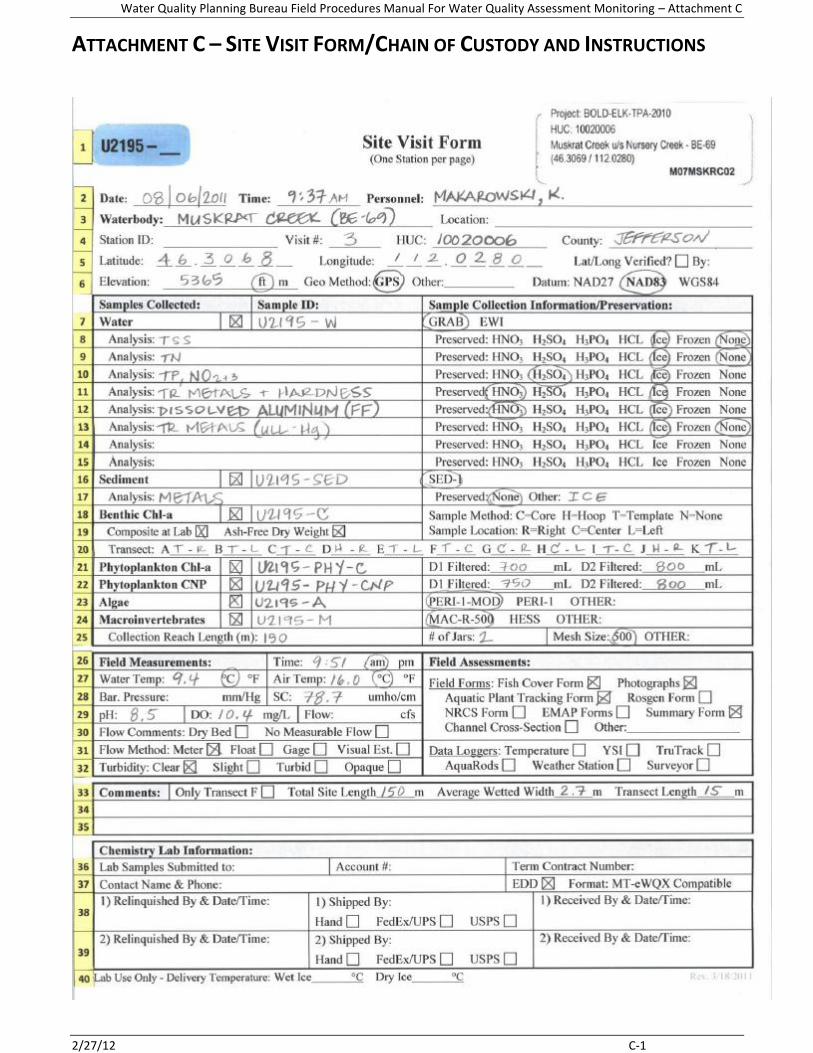
Water Quality Planning Bureau Field Procedures Manual For Water Quality Assessment Monitoring – Attachment C
2/27/12 C-1
ATTACHMENT C – SITE VISIT FORM/CHAIN OF CUSTODY AND INSTRUCTIONS

Water Quality Planning Bureau Field Procedures Manual For Water Quality Assessment Monitoring – Attachment C
2/27/12 C-2

Water Quality Planning Bureau Field Procedures Manual For Water Quality Assessment Monitoring – Attachment D
2/27/12 D-1
ATTACHMENT D – GUIDANCE ON SAMPLE LABELS AND SITE VISIT FORMS/CHAIN OF
CUSTODY
Label completion Use pencil when filling out labels! Use clear packaging tape strips to secure the labels to the bottles, taking care to avoid gaps where water can leak in; tape
all the way around the entire circumference of the bottle. Add to Site Visit Codes the following medium codes: “W” for water chemistry, “SED” for sediment metals, “C” for
chlorophyll a, “A” for periphyton (algae), and “M” for macroinvertebrate. If raining, use black ink Sharpie to indicate the sample contained in each bottle in the field and attach labels after returning
to the vehicle. Site Visit Form completion Always use pencil when writing on forms EXCEPT use pen for signature on chain of custody (lines 38-39)! Use individual site visit codes and site visit forms for each site visit, each duplicate set & each field blank If submitting water samples (i.e., TSS, E. coli) separately from the other samples, use a different SVF/COC. The Site Visit
Code will be the same UNLESS collected at a different date. Sign and date your SVF/COC at the end of your trip loop or just prior to sample delivery to the lab.
Line Form Completion Guidance (fill in the following fields, as necessary, per line) (see Attachment C)
1
Site Visit Code: Affix sticker to the upper left hand corner
Project ID: Affix label with HUC and water body information to the upper right hand corner. Note: If sites are unknown and you do not have a unique Project ID, leave this field blank. DEQ’s Data Management Section will assign a Project ID when the completed Site Visit Form is received.
2 Date: of site visit
Time: of arrival at site
Personnel: Last name, first initial of each field personnel present during site visit
3
Waterbody: name of ADB segment being sampled. Include a specific site I.D. # or name if one exists. If sampling an unnamed ditch, write “unnamed ditch”.
Location: Only include brief waterbody location if you do not have an established site I.D. #/name and if an obvious/well-known landmark exists (e.g., downstream from Deep Creek confluence”)
4 Visit #: Number of visits to the site for sampling event purposes (excluding reconnaissance)
HUC: 4th
level hydrological unit code (8-digit) containing “F” site
County: County containing “F” site
5 Latitude: of “F” site, in decimal degrees (DEG.DDDD)
Longitude: of “F” site, in decimal degrees (DEG.DDDD)
6
Elevation: Fill in elevation of “F” site and circle units (ft or m)
Geo Method: Circle “GPS”; if another method is used, write “other” and describe why GPS was not used in Site Visit Comments (lines 34-35)
Datum: Circle “NAD83”
7
If water chemistry sample(s) were collected: Place “X” in box Write site visit code with medium ID “W” for Water Circle “GRAB”
8-15 For each water chemistry sample/parameter collected: Write each sample ID next to “Analysis” Circle preservatives used
16
If sediment metals sample(s) were collected: Place “X” in box Write site visit code with medium ID “SED” for Sediment Circle “SED-1”
17 For each sediment metals sample collected: Write “Metals” next to “Analysis” Circle “None” next to Preserved and write “Ice” next to Other
18 If benthic chlorophyll-a samples were collected: Place “X” in box Write site visit code with medium ID “C” for Chlorophyll

Water Quality Planning Bureau Field Procedures Manual For Water Quality Assessment Monitoring – Attachment D
2/27/12 D-2
19 Composite at Lab: Place “X in box
Ash-Free Dry Weight Analysis: Place “X” in box
20 For each transect AK: Fill in Sample Method (C=Core, H=Hoop, T=Template, N=None) in the first blank space provided Fill in Sample Location (R=Right, L=Left, M=Middle) in the second blank space provided
21-22
If phytoplankton sample(s) were collected: Place “X” in box Write site visit code with medium ID “PHY-C” for Chla analysis, and/or medium ID “PHY-CNP” for CNP analysis Write volume of water filtered (mL) for both duplicate samples collected
23
If a periphyton sample was collected: Place “X” in box Write site visit code with medium ID “A” for Algae Circle PERI-1-MOD or circle PERI-1 to distinguish which collection method was used (if PERI-1 was used and no other biological parameters were collected, place “X” in “only at transect F” box on line 33)
24
If a macroinvertebrate sample was collected: Place “X” in box Write site visit code with medium ID “M” for Macroinvertebrate If reach-wide method was used circle MAC-R-500, or write name of alternate method next to Other
25
Collection Reach Length (m): Reach length within which macroinvertebrate samples were collected. Note: This may differ from the “total site length” (i.e., if any transects are dry or inaccessible)
# of Jars: Write total number of jars used to composite the macroinvertebrate sample
Mesh Size: of D-frame net (um); Circle 500
26 Time: Time that dissolved oxygen measurement was taken (typically differs from Line 2 “time of arrival")
27 Water Temp: value measured with one-time field measurement (YSI) meter; circle units (oC or oF)
Air Temp: value measured with thermometer; circle units (oC or oF)
Field Forms: Place “X” in boxes if completing Aquatic Plant Visual Assessment Form or taking site photographs
28 SC: value measured with one-time field measurement (YSI) meter (µmho/cm)
Field Forms: Place “X” in appropriate boxes if either Aquatic Plant Tracking Form or Rosgen Form was completed
29
pH: value measured with hand-held pH meter
DO: value measured with one-time field measurement (YSI) meter (mg/L)
Flow: value measured or estimated (CFS)
Field Forms: Place “X” in appropriate boxes if either NRCS, EMAP, or Summary Forms were completed
30 Flow Comments: Place “X” in box indicating why flow was not measured (Dry Bed or No Measureable Flow)
Channel Cross-Section: Place “X” in box if channel cross-section is measured
Other: If additional forms were completed during site visit, distinguish which on line provided
31 Flow Method: Place “X” in box indicating which flow method was used (Meter, Float, Gage, Visual Estimate)
Data Logger: Place “X” in box indicating which continuous data loggers were deployed (Temperature, YSI, TruTrack)
32 Turbidity: Place “X” in box representing the turbidity during site visit (Clear, Slight, Turbid, Opaque)
Data Logger: Place “X” in appropriate boxes if data loggers were deployed (Weather Station, AquaRod, Surveyor)
33
If EMAP reach-wide (11 transects AK) method is NOT used for site layout, place “X” in box “only at transect F.” If EMAP reach-wide (11 transects AK) method is used for site layout: Write Total Site Length sampled Write Average Wetted Width used to calculate total site length Write Transect Length (total site length /10)
34 -35
The following are applicable Site Visit Comments to include on these lines. Record any additional site comments on the Summary Form:
Indicate instrument failures or if you couldn’t collect a sample
Indicate justification if samples could not be collected
36 Lab Samples Submitted To: Indicate name of laboratory where samples will be sent
Account #: Indicate account number at laboratory where samples will be sent
Term Contract Number: Indicate term contract number for laboratory where samples will be sent
37 Contact Name & Phone: Contact information of agency (WQPB, DEQ) contact
EDD and Format: Place “X” in box for EDD and indicate “MT-eWQX Compatible” format
38-9 Sign, date, and indicate the mode of sample delivery each time the samples change possession (chain of custody)
40 Lab Use Only – the laboratory will indicate the temperature of the samples upon delivery for QA/QC purposes
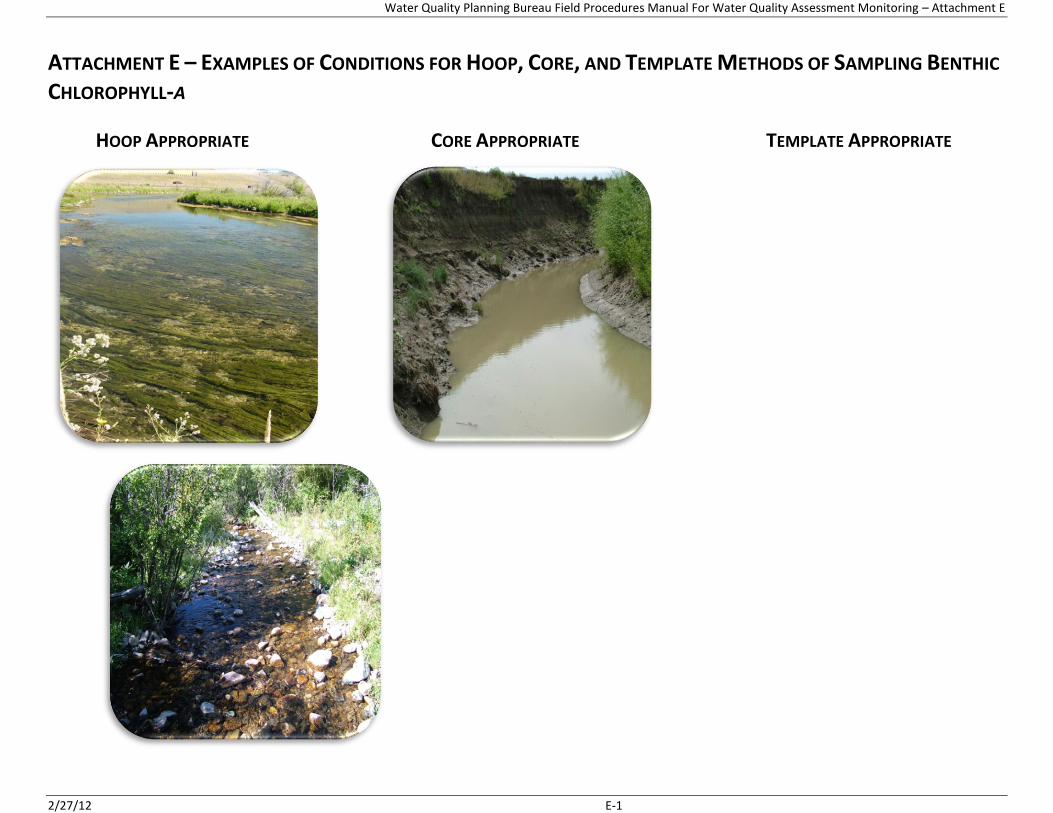
Water Quality Planning Bureau Field Procedures Manual For Water Quality Assessment Monitoring – Attachment E
2/27/12 E-1
ATTACHMENT E – EXAMPLES OF CONDITIONS FOR HOOP, CORE, AND TEMPLATE METHODS OF SAMPLING BENTHIC
CHLOROPHYLL-A
HOOP APPROPRIATE CORE APPROPRIATE TEMPLATE APPROPRIATE

Water Quality Planning Bureau Field Procedures Manual For Water Quality Assessment Monitoring – Attachment E
2/27/12 E-2

Water Quality Planning Bureau Field Procedures Manual For Water Quality Assessment Monitoring – Attachment E
2/27/12 E-3

Water Quality Planning Bureau Field Procedures Manual For Water Quality Assessment Monitoring – Attachment F
2/27/12 F-1
ATTACHMENT F – BENTHIC CHLOROPHYLL A SAMPLING METHOD DIAGRAMS

Water Quality Planning Bureau Field Procedures Manual For Water Quality Assessment Monitoring – Attachment F
2/27/12 F-2

Water Quality Planning Bureau Field Procedures Manual For Water Quality Assessment Monitoring – Attachment G
2/27/12 G-1
ATTACHMENT G – GUIDANCE FOR COMPLETING THE AQUATIC PLANT TRACKING
FORM
Complete the Aquatic Plant Tracking Form whenever benthic chlorophyll a samples are collected at a sampling unit. Fill in the waterbody name, date, Site Visit Code, site visit number, and reach or transect method used at the top of the page. For each transect (AK in column 1), record:
the position on the transect where the sample was collected (R = Right, L = Left, C = Center) the sampling method used to collect the sample (H = Hoop; C = Core; T = Template), the number of composites collected (1-3) (only if template method was used), the number of GF/F filters on which the sample was collected (only if template method was used), and the dominant algae growing in the representative area from which the sample was collected (F = Filamentous; M
= Algal film on a mud surface; R = Non-filamentous on rock surfaces, n/a = no algae present). In the “sampling method” column, record N (= No sample) if a sample was not collected at a transect because, for
example, the transect was dry, inaccessible, or if 100% macrophytes were encountered and a hoop sample yielded no algae. Record H/N if the representative area on the transect was hoop-appropriate but no algae sample was retained because the hoop contained only macrophytes or moss.

Water Quality Planning Bureau Field Procedures Manual For Water Quality Assessment Monitoring – Attachment G
2/27/12 G-2

Water Quality Planning Bureau Field Procedures Manual For Water Quality Assessment Monitoring – Attachment H
2/27/12 H-1
ATTACHMENT H – GUIDANCE FOR COMPLETING THE AQUATIC PLANT VISUAL
ASSESSMENT FORM
The Aquatic Plant Visual Assessment Form (Attachment K) should always be filled out while collecting quantitative measurements of benthic chlorophyll-a (Water Quality Planning Bureau, Montana Department of Environmental Quality, 2011b). It may also be used when collecting periphyton samples (Water Quality Planning Bureau, Montana Department of Environmental Quality, 2011a). If the stream you are assessing does not entail laying out a longitudinal reach, use only the “F” labeled form in Attachment K. For this latter scenario, use one “F” site form per stream site. This form is used to visually assess the general composition, amount, color, and condition of aquatic plants in the field. This information helps describe the health and productivity of the aquatic ecosystem, record nuisance aquatic plant problems, and document changes in the plant community over time. Fill in the waterbody name, activity ID (i.e., Site Visit Code), date, and visit number at the top of the page. Complete the following at each transect (AK): Evaluate the entire wetted stream bottom as it appears 5 m above and 5 m below the transect line (i.e., an evaluation
zone comprising 10 linear m of stream bottom, with 5 m of stream bottom downstream of the transect line and 5 m upstream) (see Attachment I).
ACTUAL COVER IN CHANNEL
Refers to the areal coverage of the stream bottom by the plant type in question, within the evaluation zone. Circle the percent coverage category that most closely fits what you see: 0 = Absent (0%) 1 = Sparse (<10%)
2 = Moderate (10-40%) 3 = Heavy (40-75%)
4 = Very Heavy (>75%)
Record predominant color and condition for microalgae, filamentous algae, macrophytes, and moss; record thickness
and length for microalgae and filamentous algae, respectively. Refer to the following guidance, photos, and the chlorophyll a SOP (Water Quality Planning Bureau, Montana Department of Environmental Quality, 2011a).
PREDOMINANT COLOR
The colors of aquatic plants are clues to their identity, state of growth, and health of the aquatic ecosystem. Record the predominant color of the plants or algae from the pick list, using the letter codes. Be sure to lift up your sunglasses to record accurate color categories. Note: Color refers here to the actual colors observed, not the types of algae the assessor may identify. The colors of aquatic plants are clues to their identity, state of growth, and health of the aquatic ecosystem. Record the predominant color of microalgae, filamentous algae, macrophytes and moss using the letter codes:
G = Green
GLB = Green/light brown
LB = Light brown
BR = Brown/reddish
DBB = Dark brown/black
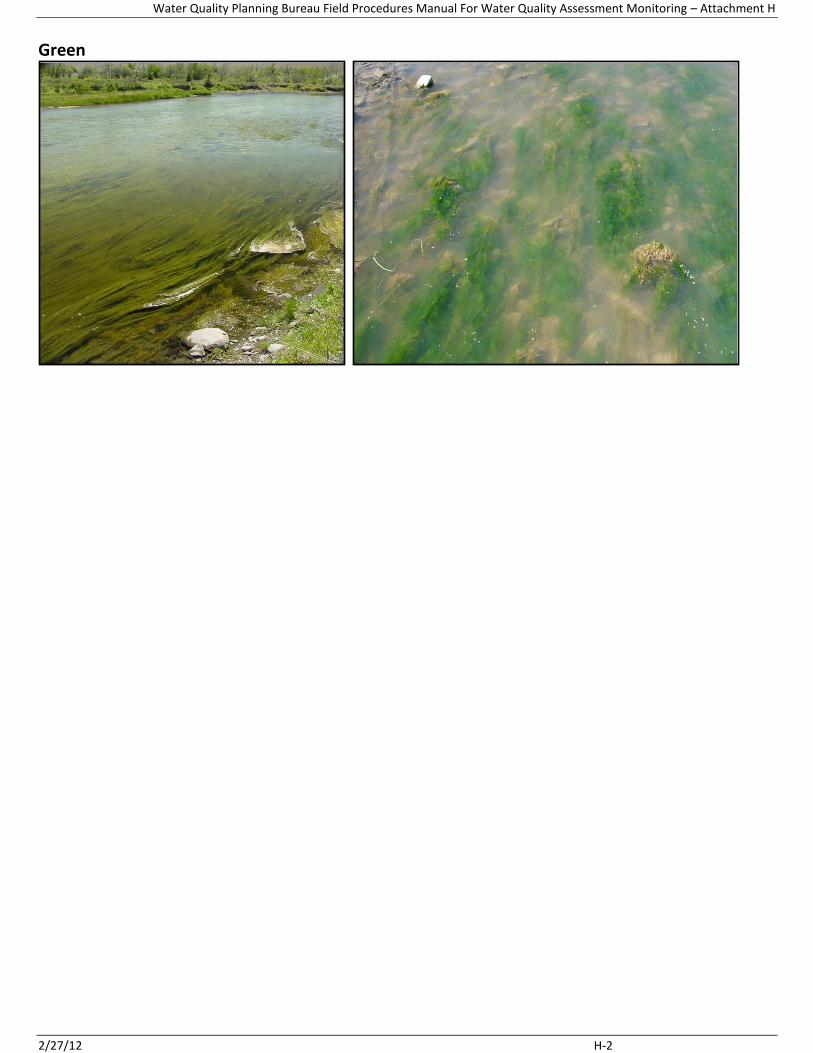
Water Quality Planning Bureau Field Procedures Manual For Water Quality Assessment Monitoring – Attachment H
2/27/12 H-2
Green

Water Quality Planning Bureau Field Procedures Manual For Water Quality Assessment Monitoring – Attachment H
2/27/12 H-3
Green/light brown

Water Quality Planning Bureau Field Procedures Manual For Water Quality Assessment Monitoring – Attachment H
2/27/12 H-4
Light Brown
Brown/reddish
Dark brown/black – no example available

Water Quality Planning Bureau Field Procedures Manual For Water Quality Assessment Monitoring – Attachment H
2/27/12 H-5
CONDITION
Aquatic plants go through seasonal cycles of growth, maturity, and decay. The condition of a plant or algae will indicate the approximate stage of this seasonal cycle. It can also help explain cases where, for example, Ash Free Dry Weight (AFDW) to chlorophyll a (Chla) ratios are found to be unusually high. Growing plants and algae show new growth and bright colors. Mature plants and algae are larger but have more subdued colors because of age, epiphytes, and sediment deposits. Decaying plant and algae display a loss of both pigmentation and physical integrity. Record conditions as Growing, Mature, or Decaying on the form using the letter codes:
Gr = Growing
M = Mature
D = Decaying
Growing (filamentous algae)
Growing (Diatoms - note the golden brown color on rocks)

Water Quality Planning Bureau Field Procedures Manual For Water Quality Assessment Monitoring – Attachment H
2/27/12 H-6
Mature
Decaying

Water Quality Planning Bureau Field Procedures Manual For Water Quality Assessment Monitoring – Attachment H
2/27/12 H-7
THICKNESS CATEGORY FOR MICROALGAE
Non-filamentous microalgae can be present on stones and fine sediment surfaces and can develop a fairly wide array of Chla levels depending upon the mat thickness. The categories (Thin, Medium, and Thick) will help corroborate Chla and AFDW measurements collected and also show the progression of algal growth at a site. Use a mm-scale ruler to measure the mat:
Thin = <0.5 mm thick
Medium = 0.5-3 mm thick
Thick = >3 mm thick
Microalgae Thin (note thickness on rocks that don’t have filaments)

Water Quality Planning Bureau Field Procedures Manual For Water Quality Assessment Monitoring – Attachment H
2/27/12 H-8
Microalgae Medium
Microalgae Thick

Water Quality Planning Bureau Field Procedures Manual For Water Quality Assessment Monitoring – Attachment H
2/27/12 H-9
LENGTH CATEGORY FOR FILAMENTOUS ALGAE
Increasing length of filamentous algae has been associated with recreation impacts (Biggs, 2000; Suplee, et al., 2009). Highly enriched waters tend to grow long filaments, 1-2 meters or more in length at times. Record filamentous algae filament lengths as Short or Long on the form. When filaments are >2 cm in length, record their approximate lengths in the Comments section.
Short = <2 cm long
Long = >2 cm long
Short
Long

Water Quality Planning Bureau Field Procedures Manual For Water Quality Assessment Monitoring – Attachment H
2/27/12 H-10
A FEW EXAMPLES OF OTHER AQUATIC PLANTS IN STREAMS
Presented here are a few photos of other aquatic plants found in Montana streams, but this is by no means complete. It is recommended that a good aquatic plant identification guide (e.g., DiTomaso and Healy, 2003) be taken to the field and consulted when filling out the form.
Macrophytes
Moss
Chara (branched algae, often associated with good water quality)

Water Quality Planning Bureau Field Procedures Manual For Water Quality Assessment Monitoring – Attachment I
2/27/12 I-1
ATTACHMENT I – DIAGRAM OF 10 METER TRANSECT FOR SITE
INFORMATION

Water Quality Planning Bureau Field Procedures Manual For Water Quality Assessment Monitoring – Attachment I
2/27/12 I-2

Water Quality Planning Bureau Field Procedures Manual For Water Quality Assessment Monitoring – Attachment J
2/27/12 J-1
ATTACHMENT J – LASER LEVEL CHANNEL CROSS-SECTION DIAGRAM

Water Quality Planning Bureau Field Procedures Manual For Water Quality Assessment Monitoring – Attachment J
2/27/12 J-2

Water Quality Planning Bureau Field Procedures Manual For Water Quality Assessment Monitoring – Attachment K
2/27/12 K-1
ATTACHMENT K - AQUATIC PLANT VISUAL ASSESSMENT FORM
Waterbody: Site Visit Code:
Date: Reach: EMAP Layout
Visit No.:
Transect Letter: A0 = Absent (0% ) G = Green Gr = Growing Thin = < 0.5 mm thick
1 = Sparse (< 10% ) GLB=Green/light brown M = Mature Medium = 0.5-3 mm thick
2 = Moderate (10-40% ) LB= Light brown D = Decaying Thick = > 3 mm thick
3 = Heavy (40-75% ) BR = Brown/reddish Short = < 2 cm long
4 = Very Heavy (>75% ) DBB =Dark brown/black Long = >2 cm long
Predominant
Color Condition
Transect Letter: B0 = Absent (0% ) G = Green Gr = Growing Thin = < 0.5 mm thick
1 = Sparse (< 10% ) GLB=Green/light brown M = Mature Medium = 0.5-3 mm thick
2 = Moderate (10-40% ) LB= Light brown D = Decaying Thick = > 3 mm thick
3 = Heavy (40-75% ) BR = Brown/reddish Short = < 2 cm long
4 = Very Heavy (>75% ) DBB =Dark brown/black Long = >2 cm long
Predominant
Color Condition
Transect Letter: C0 = Absent (0% ) G = Green Gr = Growing Thin = < 0.5 mm thick
1 = Sparse (< 10% ) GLB=Green/light brown M = Mature Medium = 0.5-3 mm thick
2 = Moderate (10-40% ) LB= Light brown D = Decaying Thick = > 3 mm thick
3 = Heavy (40-75% ) BR = Brown/reddish Short = < 2 cm long
4 = Very Heavy (>75% ) DBB =Dark brown/black Long = >2 cm long
Predominant
Color Condition
For microalgae & filamentous
algae: Record thickness or
length category
Microalgae 0 1 2 3 4
Filamentous Algae 0 1 2 3 4
Macrophytes 0 1 2 3 4
Moss 0 1 2 3 4
AQUATIC PLANT
VISUAL ASSESSMENT
FORM
Actual Cover in channel
(circle one)
COMMENTS
AQUATIC PLANT
VISUAL ASSESSMENT
FORM
Actual Cover in channel
(circle one)
For microalgae & filamentous
algae: Record thickness or
length category
Moss 0 1 2 3 4
Microalgae 0 1 2 3 4
Filamentous Algae 0 1 2 3 4
Macrophytes 0 1 2 3 4
AQUATIC PLANT
VISUAL ASSESSMENT
FORM
Actual Cover in channel
(circle one)
For microalgae & filamentous
algae: Record thickness or
length category
COMMENTS
Moss 0 1 2 3 4
Microalgae 0 1 2 3 4
Filamentous Algae 0 1 2 3 4
Macrophytes 0 1 2 3 4
COMMENTS

Water Quality Planning Bureau Field Procedures Manual For Water Quality Assessment Monitoring – Attachment K
2/27/12 K-2
Site Visit Code:
Date:
Transect Letter: D0 = Absent (0% ) G = Green Gr = Growing Thin = < 0.5 mm thick
1 = Sparse (< 10% ) GLB=Green/light brown M = Mature Medium = 0.5-3 mm thick
2 = Moderate (10-40% ) LB= Light brown D = Decaying Thick = > 3 mm thick
3 = Heavy (40-75% ) BR = Brown/reddish Short = < 2 cm long
4 = Very Heavy (>75% ) DBB =Dark brown/black Long = >2 cm long
Predominant
Color Condition
Transect Letter: E0 = Absent (0% ) G = Green Gr = Growing Thin = < 0.5 mm thick
1 = Sparse (< 10% ) GLB=Green/light brown M = Mature Medium = 0.5-3 mm thick
2 = Moderate (10-40% ) LB= Light brown D = Decaying Thick = > 3 mm thick
3 = Heavy (40-75% ) BR = Brown/reddish Short = < 2 cm long
4 = Very Heavy (>75% ) DBB =Dark brown/black Long = >2 cm long
Predominant
Color Condition
Transect Letter: F0 = Absent (0% ) G = Green Gr = Growing Thin = < 0.5 mm thick
1 = Sparse (< 10% ) GLB=Green/light brown M = Mature Medium = 0.5-3 mm thick
2 = Moderate (10-40% ) LB= Light brown D = Decaying Thick = > 3 mm thick
3 = Heavy (40-75% ) BR = Brown/reddish Short = < 2 cm long
4 = Very Heavy (>75% ) DBB =Dark brown/black Long = >2 cm long
Predominant
Color Condition
AQUATIC PLANT
VISUAL ASSESSMENT
FORM
Actual Cover in channel
(circle one)
For microalgae & filamentous
algae: Record thickness or
length category
Moss 0 1 2 3 4
Microalgae 0 1 2 3 4
Filamentous Algae 0 1 2 3 4
Macrophytes 0 1 2 3 4
AQUATIC PLANT
VISUAL ASSESSMENT
FORM
Actual Cover in channel
(circle one)
For microalgae & filamentous
algae: Record thickness or
length category
COMMENTS
Moss 0 1 2 3 4
Microalgae 0 1 2 3 4
Filamentous Algae 0 1 2 3 4
Macrophytes 0 1 2 3 4
AQUATIC PLANT
VISUAL ASSESSMENT
FORM
Actual Cover in channel
(circle one)
For microalgae & filamentous
algae: Record thickness or
length category
COMMENTS
Moss 0 1 2 3 4
Microalgae 0 1 2 3 4
Filamentous Algae 0 1 2 3 4
Macrophytes 0 1 2 3 4
COMMENTS

Water Quality Planning Bureau Field Procedures Manual For Water Quality Assessment Monitoring – Attachment K
2/27/12 K-3
Site Visit Code:
Date:
Transect Letter: G0 = Absent (0% ) G = Green Gr = Growing Thin = < 0.5 mm thick
1 = Sparse (< 10% ) GLB=Green/light brown M = Mature Medium = 0.5-3 mm thick
2 = Moderate (10-40% ) LB= Light brown D = Decaying Thick = > 3 mm thick
3 = Heavy (40-75% ) BR = Brown/reddish Short = < 2 cm long
4 = Very Heavy (>75% ) DBB =Dark brown/black Long = >2 cm long
Predominant
Color Condition
Transect Letter: H0 = Absent (0% ) G = Green Gr = Growing Thin = < 0.5 mm thick
1 = Sparse (< 10% ) GLB=Green/light brown M = Mature Medium = 0.5-3 mm thick
2 = Moderate (10-40% ) LB= Light brown D = Decaying Thick = > 3 mm thick
3 = Heavy (40-75% ) BR = Brown/reddish Short = < 2 cm long
4 = Very Heavy (>75% ) DBB =Dark brown/black Long = >2 cm long
Predominant
Color Condition
Transect Letter: I0 = Absent (0% ) G = Green Gr = Growing Thin = < 0.5 mm thick
1 = Sparse (< 10% ) GLB=Green/light brown M = Mature Medium = 0.5-3 mm thick
2 = Moderate (10-40% ) LB= Light brown D = Decaying Thick = > 3 mm thick
3 = Heavy (40-75% ) BR = Brown/reddish Short = < 2 cm long
4 = Very Heavy (>75% ) DBB =Dark brown/black Long = >2 cm long
Predominant
Color Condition
AQUATIC PLANT
VISUAL ASSESSMENT
FORM
Actual Cover in channel
(circle one)
For microalgae & filamentous
algae: Record thickness or
length category
Moss 0 1 2 3 4
Microalgae 0 1 2 3 4
Filamentous Algae 0 1 2 3 4
Macrophytes 0 1 2 3 4
AQUATIC PLANT
VISUAL ASSESSMENT
FORM
Actual Cover in channel
(circle one)
For microalgae & filamentous
algae: Record thickness or
length category
COMMENTS
Moss 0 1 2 3 4
Microalgae 0 1 2 3 4
Filamentous Algae 0 1 2 3 4
Macrophytes 0 1 2 3 4
AQUATIC PLANT
VISUAL ASSESSMENT
FORM
Actual Cover in channel
(circle one)
For microalgae & filamentous
algae: Record thickness or
length category
COMMENTS
Moss 0 1 2 3 4
Microalgae 0 1 2 3 4
Filamentous Algae 0 1 2 3 4
Macrophytes 0 1 2 3 4
COMMENTS

Water Quality Planning Bureau Field Procedures Manual For Water Quality Assessment Monitoring – Attachment K
2/27/12 K-4
Site Visit Code:
Date:
Transect Letter: J0 = Absent (0% ) G = Green Gr = Growing Thin = < 0.5 mm thick
1 = Sparse (< 10% ) GLB=Green/light brown M = Mature Medium = 0.5-3 mm thick
2 = Moderate (10-40% ) LB= Light brown D = Decaying Thick = > 3 mm thick
3 = Heavy (40-75% ) BR = Brown/reddish Short = < 2 cm long
4 = Very Heavy (>75% ) DBB =Dark brown/black Long = >2 cm long
Predominant
Color Condition
Transect Letter: K0 = Absent (0% ) G = Green Gr = Growing Thin = < 0.5 mm thick
1 = Sparse (< 10% ) GLB=Green/light brown M = Mature Medium = 0.5-3 mm thick
2 = Moderate (10-40% ) LB= Light brown D = Decaying Thick = > 3 mm thick
3 = Heavy (40-75% ) BR = Brown/reddish Short = < 2 cm long
4 = Very Heavy (>75% ) DBB =Dark brown/black Long = >2 cm long
Predominant
Color Condition
AQUATIC PLANT
VISUAL ASSESSMENT
FORM
Actual Cover in channel
(circle one)
For microalgae & filamentous
algae: Record thickness or
length category
Moss 0 1 2 3 4
Microalgae 0 1 2 3 4
Filamentous Algae 0 1 2 3 4
Macrophytes 0 1 2 3 4
AQUATIC PLANT
VISUAL ASSESSMENT
FORM
Actual Cover in channel
(circle one)
For microalgae & filamentous
algae: Record thickness or
length category
COMMENTS
Microalgae 0 1 2 3 4
Filamentous Algae 0 1 2 3 4
Macrophytes 0 1 2 3 4
COMMENTS
Moss 0 1 2 3 4