figure 1 - fs unep centrefs-unep-centre.org/sites/default/files/attachments/unepfsglobal... ·...
TRANSCRIPT

Figure 1. Global new investment in renewable energy by asset class, 2004-2012, $bn
Figure 2. Global transactions in renewable energy, 2012, $bn
Figure 3. Global Trends In Renewable Energy Investment 2012 data table, $bn
Figure 4. Global new investment in renewable energy: developed v developing countries, 2004-2012, $bn
Figure 5. Global new investment in renewable energy by sector, 2012, and growth on 2011, $bn
Figure 6. VC/PE new investment in renewable energy by sector, 2012, $bn
Figure 7. Public markets new investment in renewable energy by sector, 2012, $bn
Figure 8. Asset finance of renewable energy assets by sector, 2012, $bn
Figure 9. Asset finance of renewable energy assets and small distributed capacity by sector, 2012, and growth on 2011, $bn
Figure 10. VC/PE, public markets, and asset finance investment in renewable energy quarterly trend, Q1 2004-Q1 2013, $bn
Figure 11. Global new investment in renewable energy: developed v developing countries, 2012, and total growth on 2011, $bn
Figure 12. Global new investment in renewable energy by region, 2012, $bn
Figure 13. Global new investment in renewable energy by region, 2004-2012, $bn
Figure 14. New investment in renewable energy by country and asset class, 2012, and growth on 2011, $bn
Figure 15. Asset finance of renewable energy assets by country, 2012, and growth on 2011, $bn
Figure 16. Small distributed capacity investment by country, 2012, and growth on 2011, $bn
Figure 17. VC/PE, public markets, and asset finance investment in renewable energy in the US by sector, 2012, $bn
Figure 18. VC/PE, public markets, and asset finance investment in renewable energy in China by sector, 2012, $bn
Figure 19. VC/PE, public markets, and asset finance investment in renewable energy in India by sector, 2012, $bn
Figure 20. VC/PE, public markets, and asset finance investment in renewable energy in Brazil by sector, 2012, $bn
Figure 21. Total VC/PE, public markets, and asset finance investment in renewable energy in Africa, 2012, $bn
Figure 22. Total VC/PE, public markets, and asset finance investment in renewable energy in Latin America (excluding Brazil), 2012, $bn
Figure 23. Total VC/PE, public markets, and asset finance investment in renewable energy in non-OECD Asia (excluding China and India), 2012, $bn
Figure 24. Renewable power generation and capacity as a proportion of global power, 2006-2012, %
Figure 25. Renewable power investment compared to gross fossil-fuel power investment, 2006-2012, $bn
Figure 26. Levelised cost of electricity for different generation technologies, Q2 2009 v Q1 2013
Figure 27. Cross-border investment volumes by regional flow, 2004-H1 2012, $bn
Figure 28. Global CO2 emissions, 1990-2035, million tonnes
Figure 32. Annual power generation investment needed in 2010-2020 to meet 2-degree scenario
Figure 30.Support schemes for new renewable power projects in the EU-27, 2013
Figure 31. US states with Renewable Portfolio Standards, and those without
Figure 32. Power purchasing agreement prices for wind submitted in Brazilian auctions, 2009-12, $ per MWh
Figure 33. Asset financing new investment in renewable energy by type of security, 2004-2012, $bn
Figure 34. Asset financing new investment in renewable energy by region, 2004-2012, $bn
Figure 35. Asset financing new investment in renewable energy by sector, 2004-2012, $bn
Figure 36. Large hydro capacity additions by country, 2012, GW
Figure 37. Small distributed capacity investment, 2004-2012, $bn
Figure 38. Small PV system cost in Japan, Germany and California, $/W
Figure 39. Small distributed capacity investment by country, 2012, and growth on 2011, $bn
Figure 40. Gross and net increase in Chinese and world solar water heater capacity, 2012, GWth
Figure 41. Public market new investment in renewable energy by stage, 2004-2012, $bn
Figure 42. NEX vs selected indices, 2003 to 2013 YTD
Figure 43. NEX vs selected indices, 2011 to 2013 YTD
Figure 44. Public market new investment in renewable energy by sector, 2004-2012, $bn
Figure 45. Public market new investment in renewable energy by sector, 2012, and growth on 2011, $bn
Figure 46. Public market new investment in renewable energy by region of exchange, 2004-2012, $bn
Figure 47. Public market new investment in renewable energy by exchange, 2012, and growth on 2011, $bn
Figure 48. Public market new investment in renewable energy by company nationality, 2012, and growth on 2011, $bn
Figure 49. VC/PE new investment in renewable energy by stage, 2004-2012, $bn
Figure 50. VC/PE new investment in renewable energy by stage, 2012, and growth on 2011, $bn
Figure 51. VC/PE new investment in renewable energy by sector, 2004-2012, $bn
Figure 52. VC/PE new investment in renewable energy by sector, 2012, and growth on 2011, $bn
Figure 53. VC/PE new investment in renewable energy by region, 2004-2012, $bn
Figure 54. VC/PE new investment in renewable energy by region, 2012, and growth on 2011, $bn
Figure 55. R&D investment in renewable energy, 2004-2012, $bn
Figure 56. Corporate and government R&D renewable energy investment by technology, 2012, and growth on 2011, $bn
Figure 57. Corporate and government R&D renewable energy investment by region, 2012, and growth on 2011, $bn
Figure 58. Acquisition transactions in renewable energy by type, 2004-2012, $bn
Figure 59. Acquisition transactions in renewable energy by sector, 2004-2012, $bn
Figure 60. Acquisition transactions in renewable energy by sector, 2012, and growth on 2011, $bn
Figure 61. Acquisition transactions in renewable energy by region, 2004-2012, $bn
Figure 62. New clean energy public equity funds launched, by year, 2000-2012
Figure 63. Tier 1 green bond issuance, 2003-2013
Figure 64. Development bank finance for broad clean energy, transmission and distribution, 2007-2012

Figure 1
2004 2005 2006 2007 2008 2009 2010 2011 2012
Asset finance* 25 44 71 98 121 108 138 176 147
Small distributed capacity 9 10 10 14 23 34 62 77 80
Public markets 0 4 9 22 12 12 12 11 4
VC/PE 1 2 4 6 10 5 6 5 4
Government R&D 3 3 3 4 4 4 5 5 5
Corporate R&D 2 2 2 3 3 5 5 5 5
Total 40 65 100 146 172 168 227 279 244
% Growth 63% 55% 46% 17% -2% 35% 23% -12%
Footnote:
Source: UNEP, Bloomberg New Energy Finance
Global new investment in renewable energy by asset class, 2004-2012
$bn
*Asset finance volume adjusts for re-invested equity. Total values include estimates for
undisclosed deals
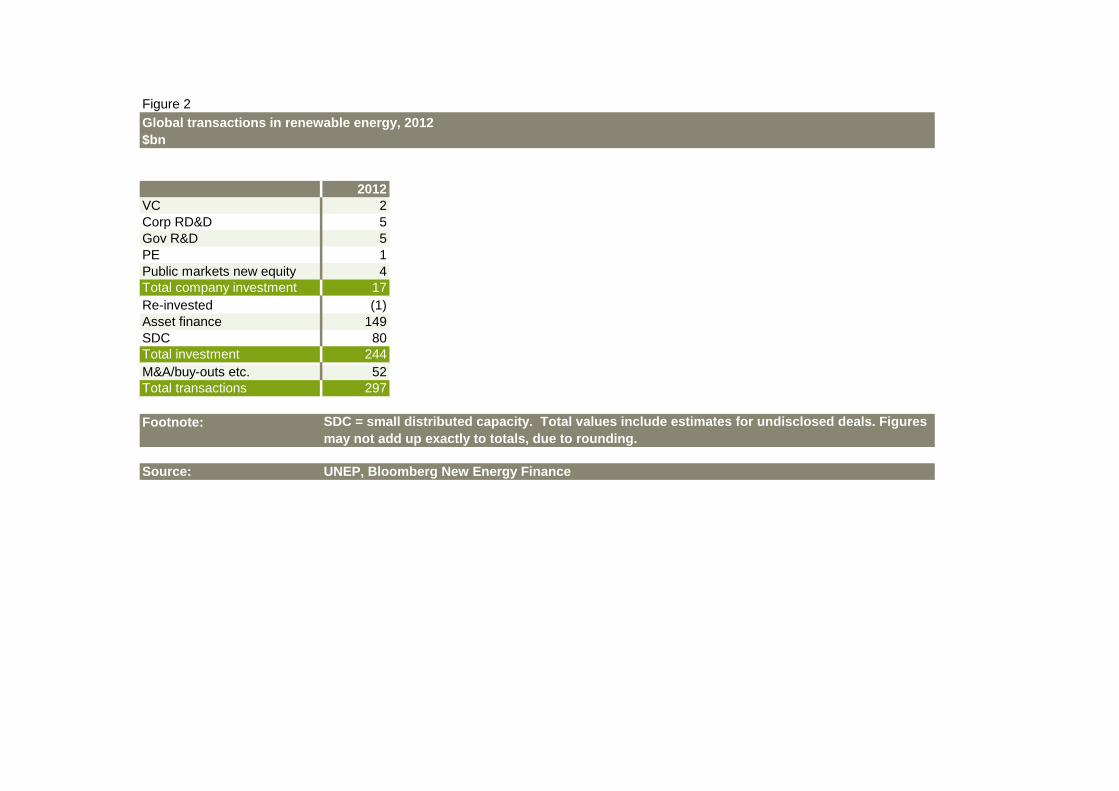
Figure 2
2012
VC 2
Corp RD&D 5
Gov R&D 5
PE 1
Public markets new equity 4
Total company investment 17
Re-invested (1)
Asset finance 149
SDC 80
Total investment 244
M&A/buy-outs etc. 52
Total transactions 297
Footnote:
Source: UNEP, Bloomberg New Energy Finance
Global transactions in renewable energy, 2012
$bn
SDC = small distributed capacity. Total values include estimates for undisclosed deals. Figures
may not add up exactly to totals, due to rounding.

Figure 3. Global Trends In Renewable Energy Investment 2012 data table, $bn
Year 2004 2005 2006 2007 2008 2009 2010 2011 2012
2011-12
Growth
2004-12
CAGRCategory Unit $bn $bn $bn $bn $bn $bn $bn $bn $bn % %
1 Total Investment
1.1 New investment 39.6 64.7 100.0 146.2 171.7 168.2 227.2 279.0 244.4 -12% 26%
1.2 Total transactions 48.4 90.7 135.6 204.7 231.0 232.5 285.8 352.5 296.7 -16% 25%2 New Investment by Value Chain
2.1 Technology development
2.1.1 Venture capital 0.4 0.6 1.2 2.2 3.2 1.6 2.5 2.6 2.3 -15% 25%
2.1.2 Government R&D 2.0 2.1 2.3 2.7 2.8 5.2 4.7 4.7 4.8 3% 12%
2.1.3 Corporate RD&D 3.0 2.9 3.3 3.6 4.0 4.0 4.6 4.8 4.8 -1% 6%
2.2 Equipment Manufacturing
2.2.1 Private equity expansion capital 0.3 1.0 3.0 3.7 6.8 2.9 3.1 2.6 1.4 -46% 20%
2.2.2 Public markets 0.3 3.8 9.1 22.2 11.6 12.5 11.8 10.6 4.1 -61% 41%
2.3 Projects
2.3.1 Asset finance 24.8 44.0 72.1 100.6 124.2 110.3 143.7 180.1 148.5 -18% 25%
Of which re-invested equity 0.0 0.1 0.7 3.1 3.4 1.8 5.5 3.7 1.5 -60% -
2.3.3 Small distributed capacity 8.9 10.5 9.8 14.3 22.5 33.5 62.4 77.4 80.0 3% 32%
Total Financial Investment 25.8 49.3 84.7 125.6 142.4 125.5 155.6 192.2 154.8 -19% 25%
Gov't R&D, corporate RD&D, small projects 13.8 15.4 15.3 20.6 29.3 42.7 71.7 86.8 89.6 3% 26%
Total New Investment 39.6 64.7 100.0 146.2 171.7 168.2 227.2 279.0 244.4 -12% 26%
3 M&A Transactions
3.1 Private equity buy-outs 0.8 3.8 1.8 3.6 5.5 2.5 1.9 3.0 2.4 -19% 14%
3.2 Public markets investor exits 0.0 1.4 2.7 4.2 1.0 2.6 4.7 0.1 0.4 200% 41%
3.3 Corporate M&A 2.4 7.9 12.7 20.4 18.0 21.5 18.0 29.5 7.1 -76% 14%
3.4 Project acquistion & refinancing 5.4 12.8 18.4 30.4 34.9 37.7 33.9 40.9 42.3 4% 29%
4 New Investment by Sector
4.1 Wind 14.4 25.5 32.4 57.4 69.9 73.7 96.2 89.3 80.3 -10% 24%
4.2 Solar 12.3 16.4 22.1 39.1 59.3 62.3 99.9 158.1 140.4 -11% 36%
4.3 Biofuels 3.7 8.9 26.1 28.2 19.3 10.6 9.2 8.3 5.0 -40% 4%
4.4 Biomass & w-t-e 6.3 8.3 11.8 13.1 14.1 13.2 13.7 12.9 8.6 -34% 4%
4.5 Small hydro 1.5 4.6 5.4 5.9 7.1 5.3 4.5 6.5 7.8 20% 22%
4.6 Geothermal 1.4 0.9 1.4 1.8 1.8 2.7 3.5 3.7 2.1 -44% 5%
4.7 Marine 0.0 0.1 0.9 0.7 0.2 0.3 0.2 0.3 0.3 13% 30%
Total 39.6 64.7 100.0 146.2 171.7 168.2 227.2 279.0 244.4 -12% 26%
5 New Investment by Geography
5.1 United States 5.7 11.9 28.2 34.5 36.2 23.3 34.6 54.8 36.0 -34% 26%
5.2 Brazil 0.5 2.2 4.2 10.3 12.5 7.9 7.9 8.6 5.4 -37% 34%
5.3 AMER (excl. US & Brazil) 1.4 3.4 3.4 5.0 5.6 5.9 11.5 8.3 9.5 14% 27%
5.4 Europe 19.6 29.4 38.4 61.7 72.9 74.7 101.3 112.3 79.9 -29% 19%
5.5 Middle East & Africa 0.6 0.6 1.2 1.7 2.7 1.7 5.0 3.5 11.5 228% 46%
5.6 China 2.6 5.8 10.2 15.8 25.0 37.2 40.0 54.7 66.6 22% 50%
5.7 India 2.4 3.2 5.5 6.3 5.2 4.4 8.7 13.0 6.5 -50% 13%
5.8 ASOC (excl. China & India) 6.7 8.3 8.9 11.0 11.5 13.2 18.1 23.8 29.0 22% 20%
Total 39.6 64.7 100.0 146.2 171.7 168.2 227.2 279.0 244.4 -12% 26%
Footnote:
Source: UNEP, Bloomberg New Energy Finance
New investment volume adjusts for re-invested equity. Total values include estimates for undisclosed deals.

Figure 4
2004 2005 2006 2007 2008 2009 2010 2011 2012
Developed 32 48 73 103 112 104 150 186 132
Developing 8 17 27 43 59 64 77 94 112
Total 40 65 100 146 172 168 227 279 244
% Growth 63% 55% 46% 17% -2% 35% 23% -12%
Footnote:
Source: UNEP, Bloomberg New Energy Finance
New investment volume adjusts for re-invested equity. Total values include estimates for
undisclosed deals. Developed volumes are based on OECD countries excluding Mexico, Chile,
and Turkey.
Global new investment in renewable energy: developed v developing countries, 2004-2012
$bn

Figure 5
2012 % growth on 2011
Marine 0.3 13%
Geothermal 2 -44%
Biofuels 5 -40%
Small hydro 8 20%
Biomass & Waste 9 -34%
Wind 80 -10%
Solar 140 -11%
Footnote:
Source: UNEP, Bloomberg New Energy Finance
Global new investment in renewable energy by sector, 2012, and growth on 2011
$bn
New investment volume adjusts for re-invested equity. Total values include estimates for
undisclosed deals.

Figure 6
2012 % growth on 2011
Solar 1.5 -41%
Biofuels 0.9 5%
Biomass & w-t-e 0.5 -54%
Geothermal 0.3 69%
Wind 0.3 -42%
Marine 0.1 146%
Small Hydro 0.04 -32%
Footnote:
Source: UNEP, Bloomberg New Energy Finance
VC/PE new investment in renewable energy by sector, 2012
$bn
VC/PE new investment excludes PE buy-outs. Total values include estimates for undisclosed
deals.

Figure 7
2012 % growth on 2011
Solar 2.3 -50%
Wind 1.3 -72%
Biofuels 0.4 -43%
Biomass & w-t-e 0.1 -77%
Small hydro 0.03 -66%
Geothermal 0.01 -97%
Marine 0.01 16%
Footnote:
<none>
Source:
Public markets new investment in renewable energy by sector, 2012
$bn
UNEP, Bloomberg New Energy Finance

Figure 8
2012 % growth on 2011
Wind 77.4 -9%
Solar 52.7 -24%
Biomass & w-t-e 7.4 -33%
Small hydro 7.4 20%
Biofuels 2.0 -63%
Geothermal 1.6 -45%
Marine 0.1 -34%
Footnote:
Source:
Asset finance of renewable energy assets by sector, 2012
$bn
Total values include estimates for undisclosed deals
UNEP, Bloomberg New Energy Finance

Figure 9
2012 % growth on 2011 2011 blank series
Marine 0.1 -34% 0.1 0
Geothermal 1.6 -45% 2.9 0
Biofuels 2.0 -63% 5.3 0
Small hydro 7.4 20% 6.2 0
Biomass & w-t-e 7.4 -33% 11.1 0
Wind 77.4 -9% 84.8 0
Solar 132.7 -10% 147.1 0
Footnote:
Source:
Asset finance of renewable energy assets and small distributed capacity by sector, 2012, and growth on 2011
$bn
Total values include estimates for undisclosed deals.
UNEP, Bloomberg New Energy Finance

Figure 10
Q1 04 Q2 04 Q3 04 Q4 04 Q1 05 Q2 05 Q3 05 Q4 05 Q1 06 Q2 06 Q3 06 Q4 06 Q1 07 Q2 07 Q3 07 Q4 07 Q1 08 Q2 08 Q3 08 Q4 08 Q1 09 Q2 09 Q3 09 Q4 09 Q1 10 Q2 10 Q3 10 Q4 10 Q1 11 Q2 11 Q3 11 Q4 11 Q1 12 Q2 12 Q3 12 Q4 12 Q1 13
Asset Finance* 6.3 5.8 5.5 7.2 7.9 12.9 10.1 13.0 14.5 13.5 16.4 27.0 18.2 21.2 27.3 31.0 25.4 31.4 29.9 34.1 16.9 32.7 31.2 27.7 27.4 31.4 36.4 42.9 31.3 51.1 50.9 43.1 30.7 39.8 35.6 41.0 19.2
Public Markets 0.0 0.1 0.0 0.2 0.6 0.4 0.4 2.4 1.3 4.0 0.9 3.0 2.2 3.1 3.7 13.3 1.6 6.4 2.6 1.0 0.4 4.5 2.5 5.1 1.4 2.4 2.8 5.1 3.9 4.3 1.3 1.0 0.6 1.3 1.4 0.8 1.5
VC/PE 0.1 0.4 0.1 0.1 0.4 0.4 0.2 0.6 0.8 1.0 1.4 0.9 1.7 0.8 1.5 1.8 1.7 2.4 3.5 2.3 0.8 1.2 1.6 1.0 1.8 1.9 1.0 0.9 1.3 1.8 1.1 1.1 1.3 0.8 0.7 0.8 0.6
Total 6 6 6 7 9 14 11 16 17 19 19 31 22 25 32 46 29 40 36 37 18 38 35 34 31 36 40 49 36 57 53 45 33 42 38 43 21
4Q running average 6 7 9 10 12 14 15 17 21 23 24 28 31 33 37 38 36 33 32 32 31 34 34 35 39 40 46 49 48 47 43 39 39 36
Footnote:
Source:
VC/PE, public markets, and asset finance investment in renewable energy quarterly trend, Q1 2004-Q1 2013
$bn
*Asset finance volume adjusts for re-invested equity. Total values include estimates
for undisclosed deals
UNEP, Bloomberg New Energy Finance

Figure 11
Total
2012 % growth on 2011 2012 % growth on 2011 % growth on 2011
Marine 0.3 28% 0.0 -71% 13%
Geothermal 0.6 -75% 1.4 21% -44%
Biofuels 3.8 -22% 1.2 -65% -40%
Small hydro 0.3 -29% 7.5 23% 20%
Biomass & w.t.e 3.9 -50% 4.7 -8% -34%
Wind 35.0 -16.2% 45.3 -4.7% -10%
Solar 88.7 -31% 51.7 72% -11%
Footnote:
Source: UNEP, Bloomberg New Energy Finance
Developed Developing
Global new investment in renewable energy: developed v developing countries, 2012, and total growth on 2011
$bn
Total values include estimates for undisclosed deals. New investment volume adjusts for re-
invested equity. Includes estimates for small distributed capacity, corporate and government
R&D. Developed volumes are based on OECD countries excluding Mexico, Chile, and Turkey.

Figure 12
2012 % growth on 2011
Europe 79.9 -29%
China 66.6 22%
United States 36.0 -34%
ASOC (excl. China & India) 29.0 22%
Middle East & Africa 11.5 228%
AMER (excl. US & Brazil) 9.5 14%
India 6.5 -50%
Brazil 5.4 -37%
Footnote:
Source: UNEP, Bloomberg New Energy Finance
Global new investment in renewable energy by region, 2012
$bn
New investment volume adjusts for re-invested equity. Total values include estimates for
undisclosed deals.

Figure 13
2004 2005 2006 2007 2008 2009 2010 2011 2012 Total
United States 5.7 11.9 28.2 34.5 36.2 23.3 34.6 54.8 36.0 265.1
Brazil 0.5 2.2 4.2 10.3 12.5 7.9 7.9 8.6 5.4 59.5
AMER (excl. US & Brazil) 1.4 3.4 3.4 5.0 5.6 5.9 11.5 8.3 9.5 54.1
Europe 19.6 29.4 38.4 61.7 72.9 74.7 101.3 112.3 79.9 590.3
Middle East & Africa 0.6 0.6 1.2 1.7 2.7 1.7 5.0 3.5 11.5 28.5
China 2.6 5.8 10.2 15.8 25.0 37.2 40.0 54.7 66.6 257.9
India 2.4 3.2 5.5 6.3 5.2 4.4 8.7 13.0 6.5 55.4
ASOC (excl. China & India) 6.7 8.3 8.9 11.0 11.5 13.2 18.1 23.8 29.0 130.4
Total
Footnote:
Source: UNEP, Bloomberg New Energy Finance
Global new investment in renewable energy by region, 2004-2012
$bn
New investment volume adjusts for re-invested equity. Total values include
estimates for undisclosed deals.

Figure 14
Asset finance* SDC Public markets VC/PE 2012 Total % growth on 2011
France 1.7 2.7 0.1 0.1 4.6 -31%
Brazil 5.1 0.1 0.2 5.3 -38%
South Africa 5.7 0.03 5.7 17598%
India 6.1 0.2 0.1 6.4 -50%
United Kingdom 5.3 3.2 0.0 0.3 8.8 -12%
Italy 1.1 13.0 0.003 0.01 14.1 -53%
Japan 3.0 13.1 16.0 73%
Germany 4.7 15.0 0.03 0.0 19.8 -35%
United States 23.2 7.3 1.0 2.6 34.2 -36%
China 57.1 5.5 2.0 0.01 64.7 22%
Footnote:
Source: UNEP, Bloomberg New Energy Finance
New investment in renewable energy by country and asset class, 2012, and growth on 2011
$bn
Top 10 countries. *Asset finance volume adjusts for re-invested equity. Excludes corporate and
government R&D

Figure 16
2012 % growth on 2011
Ukraine 2.8 205%
Japan 3.0 230%
Canada 3.7 -17%
Germany 4.8 -58%
Brazil 5.1 -39%
United Kingdom 5.3 -10%
South Africa 5.7 23410%
India 6.4 -49%
United States 23.4 -49%
China 57.7 23%
Footnote:
Source: UNEP, Bloomberg New Energy Finance
Asset finance of renewable energy assets by country, 2012, and growth on 2011
$bn
Top 10 countries. Total values include estimates for undisclosed deals

Figure 15
2012 % growth on 2011
France 2.7 -32%
Belgium 2.8 -19%
Greece 3.1 195%
United Kingdom 3.2 -16%
Australia 3.3 -30%
China 5.5 195%
United States 7.3 63%
Italy 13.0 -43%
Japan 13.1 56%
Germany 15.0 -15%
Footnote:
Source:
Small distributed capacity investment by country, 2012, and growth on 2011
$bn
Top 10 countries. Represents investments in solar PV projects with capacities below 1MW
UNEP, Bloomberg New Energy Finance

Figure 17
Asset finance* Public markets VC/PE Total
Wind 14.8 - 0.04 14.8
Solar 6.8 0.6 1.3 8.8
Biofuels 0.8 0.4 0.8 1.9
Biomass & Waste 0.7 0.01 0.2 1.0
Geothermal 0.1 - 0.3 0.4
Marine - - 0.003 0.003
Small hydro - - 0.002 0.002
Total 23.2 1.0 2.6 26.9
Footnote:
Source: UNEP, Bloomberg New Energy Finance
*Asset finance volume adjusts for re-invested equity
VC/PE, public markets, and asset finance investment in renewable energy in the United States by sector, 2012
$bn

Figure 18
Asset finance* Public markets VC/PE Total
Wind 27.2 0.9 - 28.1
Solar 24.7 1.1 0.01 25.7
Small hydro 2.7 0.01 - 2.7
Biomass & w-t-e 2.5 - - 2.5
Biofuels 0.04 - - 0.04
Total 57.1 2.0 0.0 59.1
Footnote:
Source: UNEP, Bloomberg New Energy Finance
VC/PE, public markets, and asset finance investment in renewable energy in China by sector , 2012
$bn
*Asset finance volume adjusts for re-invested equity

Figure 19
Asset finance* Public markets VC/PE Total
Wind 3.0 - 0.1 3.1
Solar 1.8 - 0.01 1.8
Small hydro 0.6 - - 0.6
Biomass & w-t-e 0.5 - 0.03 0.6
Biofuels 0.02 - - 0.02
Total 6.0 0.0 0.1 6.2
Footnote:
Source: UNEP, Bloomberg New Energy Finance
VC/PE, public markets, and asset finance investment in renewable energy in India by sector, 2012
$bn
*Asset finance volume adjusts for re-invested equity

Figure 20
Asset finance* Public markets VC/PE Total
Wind 3.2 0.2 - 3.4
Small hydro 0.7 - - 0.7
Biofuels 0.6 - - 0.6
Biomass & w-t-e 0.5 - - 0.5
Solar 0.1 - - 0.1
Total 5.0 0.2 0.0 5.2
Footnote:
Source: UNEP, Bloomberg New Energy Finance
VC/PE, public markets, and asset finance investment in renewable energy in Brazil by sector, 2012
$bn
*Asset finance volume adjusts for re-invested equity

Figure 23
2012
Ethiopia 0.4
Kenya 1.1
Morocco 1.8
South Africa 5.7
Footnote:
Source:
Total VC/PE, public markets, and asset finance investment in renewable energy in Africa by country, 2012
$bn
Omits countries with less than $0.1bn investment. Investment volume adjusts for
re-invested equity
UNEP, Bloomberg New Energy Finance

Figure 21
2012
Ecuador 0.1
Panama 0.1
Uruguay 0.2
Nicaragua 0.2
Costa Rica 0.2
Argentina 0.2
Dominican Republic 0.3
Peru 0.6
Chile 0.8
Mexico 1.9
Footnote:
Source:
Total VC/PE, public markets, and asset finance investment in renewable energy in Latin America (excluding Brazil) by
country, 2012, $bn
Omits countries with less than $0.1bn investment. Investment volume adjusts for re-invested
equity
UNEP, Bloomberg New Energy Finance

Figure 22
2012
Mongolia 0.1
Iran (Islamic Republic) 0.1
Malaysia 0.2
Pakistan 0.2
Philippines 0.2
Indonesia 0.2
Vietnam 0.3
Taiwan 0.5
Thailand 1.3
Footnote:
Source: UNEP, Bloomberg New Energy Finance
Omits countries with less than $0.1bn investment. Investment volume adjusts for re-
invested equity
Total VC/PE, public markets, and asset finance investment in renewable energy in non-OECD Asia (excluding China and
India) by country, 2012, $bn

Figure 24
2006 2007 2008 2009 2010 2011 2012
Renewable power capacity change as a % of global power capacity change (net) 10.2% 15.3% 25.6% 23.3% 28.8% 36.3% 41.6%
Renewable power generation change as a % of global power generation change (net) 4.7% 7.2% 21.3% -97.7% 11.0% 23.3% 26.7%
Renewable power as a % of global power capacity 5.0% 5.4% 6.1% 6.8% 7.7% 8.9% 10.2%
Renewable power as a % of global power generation 3.6% 3.8% 4.1% 4.6% 4.9% 5.7% 6.5%
Footnote:
Source:
Renewable power generation and capacity as a proportion of global power, 2006-2012
%
Excludes large hydro. Renewable capacity figures based on Bloomberg New Energy Finance
global totals.
EIA, IEA, Bloomberg New Energy Finance

Figure 25
2008 2009 2010 2011 2012
Gross fossil-fuel 261 302 312 301 262
Net fossil-fuel 150 182 189 180 148
Renewable energy 142 144 209 256 227
Footnote:
Source:
Renewable power investment compared to gross fossil-fuel power investment, 2008-2012
$bn
Renewable energy total excludes large hydro. Fossil fuel is gross investment on coal, gas and
oil capacity and includes investment to replace capacity retirements. We assume capacity
retirement of 3.3%/yr for coal, 4%/yr for gas and 2.5%/yr for oil.
EIA, Bloomberg New Energy Finance

Figure 26
Data: n/a
Footnote:
Source:
Levelised cost of electricity for different generation technologies, Q2 2009 v Q1 2013
CHP = combined heat and power; c-Si = crystalline silicon; STEG = solar thermal electricity
generation or concentrated solar power; CCGT = combined cycle gas turbine.
Bloomberg New Energy Finance estimates.

Figure 27
2004 2005 2006 2007 2008 2009 2010 2011 H1 2012
North/North 4.2 9.1 17.3 24.6 31.0 21.5 31.9 33.0 12.9
South/North 0.1 0.1 0.5 0.2 0.3 1.6 0.3 0.9 0.3
South/South 0.0 0.4 0.6 1.0 1.8 2.0 2.2 3.9 1.1
North/South 0.9 1.7 2.2 2.8 6.5 3.9 5.9 8.1 3.9
Footnote:
Source:
Cross-border investment volumes by regional flow, 2004-H1 2012
$bn
New-build asset finance for renewable energy projects only.
Bloomberg New Energy Finance

Figure 28
1990 2010 2015 2020 2025 2030 2035
Power 7,481 12,495 13,849 14,338 14,545 14,738 14,951
Transport 4,388 6,565 7,095 7,512 7,841 8,162 8,519
Heat, other 8,098 9,562 10,547 10,989 11,275 11,525 11,753
Total 20 29 31 33 34 34 35
Growth 43% 10% 4% 3% 2% 2%
Footnote:
<none>
Source:
Global CO2 emissions, 1990-2035
million tonnes
International Energy Agency, World Energy Outlook 2012

Figure 29
2010-20
Coal 43
Gas 50
CCS 7
Wind 75
Solar 61
Other renewables 74
Nuclear 62
Footnote:
Source: International Energy Agency, Energy Technology Perspectives 2012
Annual power generation investment needed in 2010-2020 to meet 2-degree scenario
$bn
Numbers shown are the projected annual energy sector investment needed to stay within 2
degrees C temperature rise. These can be compared with the actual capacity investments reported
for 2012 within this Global Trends report, i.e., $77 billion for wind, $133 billion for solar, $50 billion
for other renewables including hydro, and $148 billion for net coal and gas additions.

Figure 30
Data: n/a
Footnote:
<none>
Source:
Support schemes for new renewable power projects in the EU-27, 2013
Bloomberg New Energy Finance

Figure 31
Data: n/a
Footnote:
Source:
The Database of State Incentives for Renewables & Efficiency (DSIRE) is a comprehensive
source of information on state, local, utility, and federal incentives and policies that promote
renewable energy and energy efficiency. Established in 1995 and funded by the US Department
of Energy, DSIRE is an ongoing project of the NC Solar Center and the Interstate Renewable
Energy Council.
Dsireusa.org.
US states with Renewable Portfolio Standards, and those without

Figure 32
LER 2009 A-3 2010 LER 2010 LER 2011 A-3 2011 A-5 2011 A-5 2012
Price 85.2 76.9 70.2 62.5 62.2 57.2 42.2
Footnote:
Source:
Power purchasing agreement prices for wind submitted in Brazilian auctions, 2009-2012
$ per MWh
The X axis shows different capacity and energy auctions. A-3 means project for delivery in three
years, A-5 projects for delivery in five years.
Bloomberg New Energy Finance

Figure 33
2004 2005 2006 2007 2008 2009 2010 2011 2012
Balance sheet 19.9 29.7 50.0 68.1 76.0 83.9 93.2 105.9 101.0
Project finance 4.7 13.7 21.5 31.3 46.6 25.4 48.6 69.8 45.9
Bond/other 0.2 0.6 0.6 1.2 1.5 1.0 2.0 4.4 1.6
Disclosed deal count 221 504 701 924 991 839 860 826 648
Total deal count 618 1049 1368 1692 1850 1755 2203 2453 1860
Footnote:
Source: Bloomberg New Energy Finance
Asset financing new investment in renewable energy by type of security, 2004-2012
$bn
Total values include estimates for undisclosed deals.

Figure 34
2004 2005 2006 2007 2008 2009 2010 2011 2012
Europe 11.8 18.7 23.8 37.7 48.2 45.9 48.3 50.8 30.0
China 1.9 4.9 8.6 13.2 23.3 30.6 37.1 46.9 57.7
United States 3.9 8.5 22.1 25.9 22.3 12.0 22.8 45.5 23.4
Brazil 0.5 1.7 4.2 7.9 12.2 7.3 7.4 8.4 5.1
India 2.3 2.8 5.3 4.7 4.8 3.9 7.8 12.5 6.4
ASOC (excl. China & India) 2.8 4.1 4.4 6.5 7.0 5.0 6.2 6.4 8.0
AMER (excl. US & Brazil) 1.3 2.9 2.8 3.9 5.0 5.1 10.5 7.2 8.7
Middle East & Africa 0.3 0.3 0.8 0.8 1.3 0.4 3.6 2.3 9.3
Disclosed deal count 221 504 701 924 991 839 860 826 648
Total deal count 618 1049 1368 1692 1850 1755 2203 2453 1860
Footnote:
Source: Bloomberg New Energy Finance, UNEP
Asset financing new investment in renewable energy by region, 2004-2012
$bn
Total values include estimates for undisclosed deals.

Figure 35
2004 2005 2006 2007 2008 2009 2010 2011 2012
Wind 13.2 23.2 29.6 44.7 63.9 67.6 92.0 84.8 77.4
Solar 0.3 1.0 4.1 13.0 22.6 16.9 26.4 69.7 52.7
Biofuels 2.9 7.0 21.0 24.6 16.5 7.3 6.3 5.3 2.0
Biomass & w-t-e 5.9 7.5 10.9 10.9 13.3 11.8 12.2 11.1 7.4
Small hydro 1.4 4.4 5.1 5.6 6.5 4.9 3.6 6.2 7.4
Geothermal 1.1 0.8 0.7 1.5 1.2 1.7 3.2 2.9 1.6
Marine 0.005 0.03 0.8 0.4 0.02 0.1 0.03 0.1 0.1
Disclosed deal count 221 504 701 924 991 839 860 826 648
Total deal count 618 1049 1368 1692 1850 1755 2203 2453 1860
Footnote:
Source: Bloomberg New Energy Finance, UNEP
Asset financing new investment in renewable energy by sector, 2004-2012
$bn
Total values include estimates for undisclosed deals.

Figure 36
2012
China 14.0
Russian Federation 3.3
Vietnam 1.6
Brazil 1.3
Iran 0.8
India 0.5
Peru 0.2
Canada 0.2
Sri Lanka 0.2
Namibia 0.1
Guatemala 0.1
Pakistan 0.1
Chile 0.1
Footnote:
<none>
Source:
Large hydro capacity additions by country, 2012
GW
Bloomberg New Energy Finance

Figure 37
2004 2005 2006 2007 2008 2009 2010 2011 2012
Total 8.9 10.5 9.8 14.3 22.5 33.5 62.4 77.4 80.0
% Growth 18% -7% 46% 57% 49% 86% 24% 3%
Footnote:
Source: Bloomberg New Energy Finance
Small distributed capacity investment, 2004-2012
$bn
Represents investments in solar PV projects with capacities below 1MW

Figure 38
Data: n/a
Footnote:
<none>
Source: BSW-Solar, California Solar Initiative filings, JPEA, Bloomberg New Energy Finance
Small PV system cost in Japan, Germany and California
$/W

Figure 39
2012 % growth on 2011 2011 blank series
France 2.7 -32% 4 0
Belgium 2.8 -19% 3 0
Greece 3.1 195% 1 0
United Kingdom 3.2 -16% 4 0
Australia 3.3 -30% 5 0
China 5.5 195% 2 0
United States 7.3 63% 4 0
Italy 13.0 -43% 23 0
Japan 13.1 56% 8 0
Germany 15.0 -15% 18 0
Footnote:
Source:
Small distributed capacity investment by country, 2012, and growth on 2011
$bn
Top 10 countries. Represents investments in solar PV projects with capacities below 1MW
Bloomberg New Energy Finance

Figure 40
Gross Net
China 45 28
Rest of world 9 5
Footnote:
<none>
Source:
Gross and net increase in Chinese and world solar water heater capacity, 2012
GWth
IEA-SHC, REN21 Global Status Report

Figure 41
2004 2005 2006 2007 2008 2009 2010 2011 2012
IPO 0.2 2.6 5.4 12.8 3.3 3.1 5.8 4.8 1.5
Secondary & PIPE 0.1 0.8 2.7 4.2 2.0 5.9 3.3 3.4 1.8
Convertible & other - 0.2 0.3 4.7 4.9 2.2 2.3 2.4 0.8
OTC 0.02 0.2 0.7 0.5 1.4 1.3 0.3 0.04 -
IPO/Secondary & PIPE/Convertible & Other/OTC deal count (6/8/0/4) (24/35/9/6) (39/55/10/17) (44/82/28/28) (16/50/22/20) (9/85/13/21) (32/73/22/14) (22/55/20/14) (15/52/20/0)
Total 0.0 0.3 3.8 9.1 22.2 11.6 12.5 11.8 10.6 4.1
Footnote:
Source: Bloomberg New Energy Finance, UNEP
Public market new investment in renewable energy by stage, 2004-2012
$bn
PIPE = private investment in public equity, OTC = over-the-counter

Figure 42
Data: n/a
Footnote:
Source: Bloomberg New Energy Finance
NEX vs selected indices
Index values as of 15 April 2013; Nasdaq and S&P 500 rebased
to 100 on 1 January 2003

Figure 43
Data: n/a
Total
Footnote:
Source: Bloomberg New Energy Finance
NEX vs selected indices
Index values as of 15 April 2013; Nasdaq and S&P 500 rebased
to 100 on 1 January 2011

Figure 44
2004 2005 2006 2007 2008 2009 2010 2011 2012
Solar 0.1 1.7 3.8 6.1 6.4 6.6 5.4 4.6 2.3
Wind 0.03 1.2 1.4 11.5 4.0 4.5 5.1 4.6 1.3
Biofuels 0.03 0.6 3.2 2.7 0.8 0.2 0.5 0.7 0.4
Biomass & w.t.e 0.01 0.2 0.2 1.3 0.1 0.5 0.5 0.2 0.1
Geothermal 0.1 0.0 0.5 0.3 0.4 0.4 0.1 0.4 0.01
Small hydro 0.02 0.01 0.02 0.1 - 0.2 0.2 0.1 0.03
Marine - - - 0.1 0.002 0.01 - 0.005 0.005
Total 0.3 3.8 9.1 22.2 11.6 12.5 11.8 10.6 4.1
Total deal count 18 73 120 182 110 128 141 109 81
Footnote:
<none>
Source: Bloomberg New Energy Finance, UNEP
Public market new investment in renewable energy by sector, 2004-2012
$bn

Figure 45
2012 % growth on 2011
Marine 0.01 16%
Geothermal 0.01 -97%
Small hydro 0.03 -66%
Biomass & w.t.e 0.1 -77%
Biofuels 0.4 -43%
Wind 1.3 -72%
Solar 2.3 -50%
Footnote:
<none>
Source: Bloomberg New Energy Finance, UNEP
Public market new investment in renewable energy by sector, 2012, and growth on 2011
$bn

Figure 46
2004 2005 2006 2007 2008 2009 2010 2011 2012
Europe 0.1 1.5 5.5 11.9 5.5 2.7 2.1 1.9 0.4
United States 0.2 0.8 2.8 5.1 4.8 3.3 2.7 1.2 1.0
China - - 0.1 1.1 0.2 4.6 5.0 5.0 2.0
ASOC (excl. China & India) 0.03 0.4 0.7 0.6 0.2 1.2 0.7 1.5 0.4
AMER (excl. US & Brazil) 0.02 0.3 0.1 0.7 0.4 0.5 0.4 0.4 0.1
Brazil - 0.4 - 1.5 0.5 - 0.1 0.2 0.2
India - 0.3 0.03 1.3 0.04 0.2 0.7 0.2 -
Middle East & Africa - - - - - - - 0.2 0.005
Footnote:
<none>
Source: Bloomberg New Energy Finance, UNEP
Public market new investment in renewable energy by region of exchange, 2004-2012
$bn

Figure 47
2012 % growth on 2011
Bern Stock Exchange 0.06 0 in 2011
Shenzhen Stock Exchange - Main Board 0.1 -88%
Toronto Stock Exchange (TSX) 0.1 -79%
Euronext Paris (PAR or EPA) 0.1 -50%
São Paulo (BOVESPA) 0.2 -25%
Oslo Stock Exchange (Oslo Bors) 0.2 0 in 2011
Taiwan Stock Exchange (TSEC) 0.3 119%
NASDAQ Global Select Market (GS) 1.0 66%
Hong Kong Stock Exchange (HKEX) 1.0 -41%
Shanghai Stock Exchange 1.0 -65%
Footnote:
Source: Bloomberg New Energy Finance
Public market new investment in renewable energy by exchange, 2012, and growth on 2011
$bn
Top 10 exchanges

Figure 48
2012 % growth on 2011
Australia 0.03 -67%
Thailand 0.05 0 in 2011
Switzerland 0.06 0 in 2011
Canada 0.1 -73%
France 0.1 -50%
Brazil 0.2 -25%
Norway 0.2 0 in 2011
Taiwan 0.3 3%
United States 1.0 49%
China 2.0 -62%
Footnote:
Source: Bloomberg New Energy Finance
Public market new investment in renewable energy by company nationality, 2012, and growth on 2011
$bn
Top 10 countries

Figure 49
2004 2005 2006 2007 2008 2009 2010 2011 2012
VC early stage 0.2 0.3 0.6 1.3 1.8 0.7 1.0 0.8 0.5
VC late stage 0.2 0.3 0.6 0.8 1.4 0.9 1.6 1.8 1.7
PE expansion capital 0.3 1.0 3.0 3.7 6.8 2.9 3.1 2.6 1.4
Total 0.7 1.6 4.2 5.9 10.0 4.5 5.6 5.2 3.6
% Growth 129% 159% 41% 71% -55% 23% -7% -30%
Disclosed deal count 55 80 140 215 247 195 257 251 198
Total deal count 75 102 177 251 290 224 270 276 228
Footnote:
Source:
VC/PE new investment in renewable energy by stage, 2004-2012
$bn
Buy-outs are not included as new investment. Total values include estimates for undisclosed
deals
Bloomberg New Energy Finance, UNEP

Figure 50
2012 % growth on 2011 Disclosed deal count Total deal count
PE buy-out 2.4 -19% 11 26
PE expansion capital 1.4 -46% 47 53
VC bridge/interim 0.2 -17% 26 36
VC further rounds 0.7 -21% 22 23
VC series C 0.8 21% 29 30
VC series B 0.2 -49% 28 31
VC series A 0.3 -21% 40 47
VC seed/spin-off 0.02 146% 6 8
Footnote:
Source: Bloomberg New Energy Finance, UNEP
VC/PE new investment in renewable energy by stage, 2012, and growth on 2011
$bn
Buy-outs are not included as new investment. Total values include estimates for undisclosed
deals

Figure 51
2004 2005 2006 2007 2008 2009 2010 2011 2012
Solar 0.2 0.5 1.4 2.6 5.0 1.7 2.2 2.5 1.5
Biofuels 0.1 0.5 1.4 1.7 1.7 0.9 0.8 0.9 0.9
Wind 0.4 0.2 0.9 0.7 2.0 1.3 1.6 0.5 0.3
Biomass & w-t-e 0.1 0.3 0.3 0.5 0.6 0.5 0.4 1.0 0.5
Geothermal 0.0 0.1 0.1 0.1 0.2 0.1 0.1 0.2 0.3
Small hydro 0.0 0.0 0.1 0.0 0.4 0.0 0.4 0.1 0.0
Marine 0.0 0.0 0.1 0.2 0.1 0.1 0.1 0.0 0.1
Total 0.7 1.6 4.2 5.9 10.0 4.5 5.6 5.2 3.6
Footnote:
Source: Bloomberg New Energy Finance, UNEP
VC/PE new investment in renewable energy by sector, 2004-2012
$bn
Buy-outs are not included as new investment. Total values include estimates for undisclosed
deals.

Figure 52
Data:
Units: $bn 2012 % growth on 2011
Small hydro 0.04 -32%
Marine 0.1 146%
Wind 0.3 -42%
Geothermal 0.3 69%
Biomass & w-t-e 0.5 -54%
Biofuels 0.9 5%
Solar 1.5 -41%
Footnote:
Source: Bloomberg New Energy Finance, UNEP
VC/PE new investment in renewable energy by sector, 2012, and growth on 2011
$bn
Buy-outs are not included as new investment. Total values include estimates for undisclosed
deals
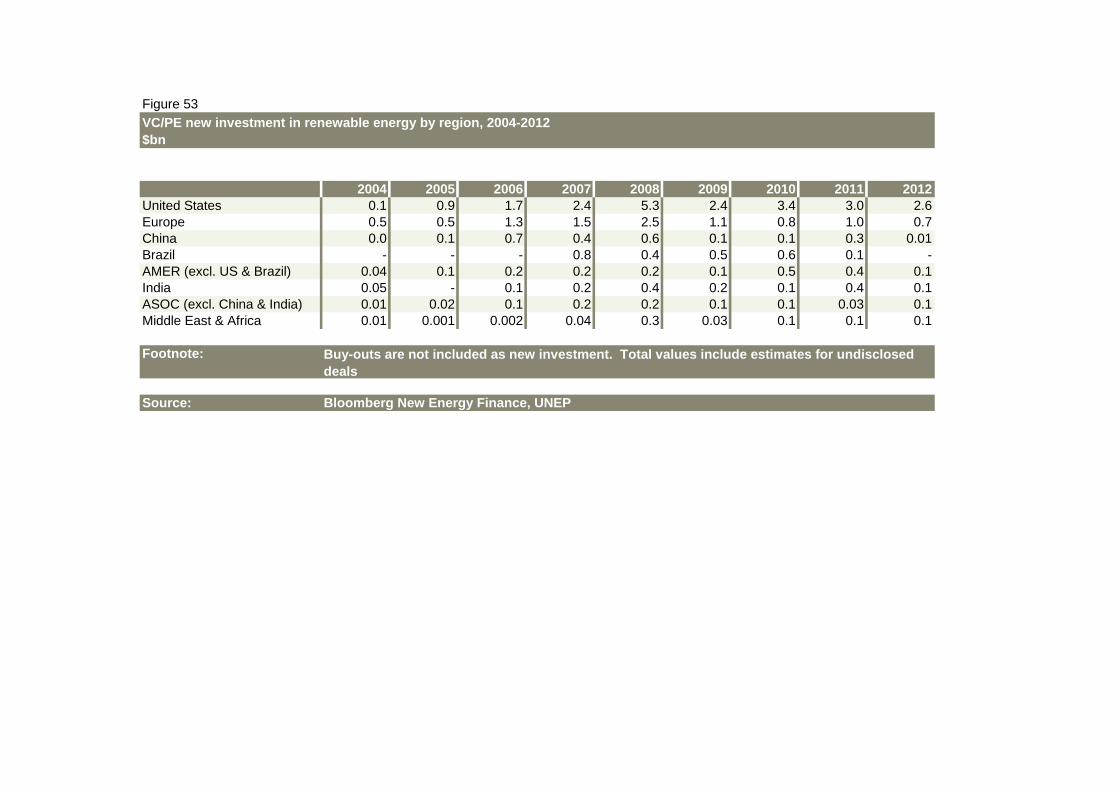
Figure 53
2004 2005 2006 2007 2008 2009 2010 2011 2012
United States 0.1 0.9 1.7 2.4 5.3 2.4 3.4 3.0 2.6
Europe 0.5 0.5 1.3 1.5 2.5 1.1 0.8 1.0 0.7
China 0.0 0.1 0.7 0.4 0.6 0.1 0.1 0.3 0.01
Brazil - - - 0.8 0.4 0.5 0.6 0.1 -
AMER (excl. US & Brazil) 0.04 0.1 0.2 0.2 0.2 0.1 0.5 0.4 0.1
India 0.05 - 0.1 0.2 0.4 0.2 0.1 0.4 0.1
ASOC (excl. China & India) 0.01 0.02 0.1 0.2 0.2 0.1 0.1 0.03 0.1
Middle East & Africa 0.01 0.001 0.002 0.04 0.3 0.03 0.1 0.1 0.1
Footnote:
Source: Bloomberg New Energy Finance, UNEP
VC/PE new investment in renewable energy by region, 2004-2012
$bn
Buy-outs are not included as new investment. Total values include estimates for undisclosed
deals

Figure 54
2012 % growth on 2011
Brazil - -100%
China 0.01 -97%
AMER (excl. US & Brazil) 0.1 -85%
Middle East & Africa 0.1 -44%
ASOC (excl. China & India) 0.1 268%
India 0.1 -67%
Europe 0.7 -32%
United States 2.6 -11%
Footnote:
Source: Bloomberg New Energy Finance, UNEP
VC/PE new investment in renewable energy by region, 2012, and growth on 2011
$bn
Buy-outs are not included as new investment. Total values include estimates for undisclosed
deals

Figure 55
2004 2005 2006 2007 2008 2009 2010 2011 2012
Corporate R&D 3 3 3 4 4 4 5 5 5
Government R&D 2 2 2 3 3 5 5 5 5
Total 5.0 5.0 5.5 6.3 6.8 9.2 9.2 9.5 9.6
% Growth 0% 12% 13% 8% 36% 0.4% 3% 1%
Footnote:
<none>
Source: Bloomberg, Bloomberg New Energy Finance, IEA, IMF, various government agencies
R&D investment in renewable energy, 2004-2012
$bn

Figure 56
Total
2012 % growth on 2011 2012 % growth on 2011 % growth on 2011
Marine 0.01 -26% 0.1 1% -4%
Geothermal 0.1 -7% 0.1 1% -1%
Small hydro 0.1 5% 0.2 7% 6%
Biomass & w-t-e 0.3 2% 0.3 2% 2%
Biofuels 0.5 2% 1.2 1% 2%
Wind 1.1 4% 0.6 3% 4%
Solar 2.6 -5% 2.2 4% -1%
Footnote:
<none>
Source: Bloomberg, Bloomberg New Energy Finance, IEA, IMF, various government agencies
Corporate and government R&D renewable energy investment by technology, 2012, and total growth on 2011
$bn
Corporate R&D Government R&D

Figure 57
Total
2012 % growth on 2011 2012 % growth on 2011 % growth on 2011
India 0.04 41% 0.05 5% 20%
Brazil 0.01 -21% 0.1 1% 0%
Middle East & Africa 0.1 3% 0.1 -3% -1%
AMER (excl. US & Brazil) 0.1 -6% 0.1 2% -1%
United States 0.9 3% 0.9 2% 2%
China 0.5 -10% 1.4 8% 2%
ASOC (excl. China & India) 1.2 -11% 0.8 2% -6%
Europe 2.0 6% 1.3 0% 3%
Footnote:
<none>
Source: Bloomberg, Bloomberg New Energy Finance, IEA, IMF, various government agencies
Corporate and government R&D renewable energy investment by region, 2012, and growth on 2011
$bn
Corporate R&D Government R&D

Figure 58
2004 2005 2006 2007 2008 2009 2010 2011 2012
PE buy-outs 0.8 3.8 1.8 3.6 5.5 2.5 1.9 3.0 2.4
Public market investor exits 0.0 1.4 2.7 4.2 1.0 2.6 4.7 0.1 0.4
Corporate M&A 2.4 7.9 12.7 20.4 18.0 21.5 18.0 29.5 7.1
Asset acquisitions & refinancing 5.4 12.8 18.4 30.4 34.9 37.7 33.9 40.9 42.3
Total 8.7 26.0 35.6 58.5 59.4 64.3 58.6 73.4 52.3
Disclosed deal count 43 130 170 273 290 296 284 268 229
Total deal count 94 258 367 507 537 565 601 644 525
Footnote:
Source: Bloomberg New Energy Finance
Acquisition transactions in renewable energy by type, 2004-2012
$bn
Total values include estimates for undisclosed deals.

Figure 59
2004 2005 2006 2007 2008 2009 2010 2011 2012
Wind 5.4 17.4 22.6 32.4 38.9 34.8 30.5 41.0 32.6
Solar 0.4 0.9 4.5 11.3 10.6 15.6 14.2 22.0 14.1
Biofuels 0.2 0.8 5.2 5.4 4.4 7.0 8.2 5.7 1.7
Biomass & w-t-e 1.0 3.8 1.9 2.1 2.5 2.6 3.0 1.9 1.8
Small hydro 1.4 2.1 0.9 1.1 1.9 2.7 1.1 2.3 1.8
Geothermal 0.3 0.9 0.5 6.1 1.0 1.4 1.4 0.4 0.3
Marine - 0.1 0.05 - 0.1 0.1 0.2 0.1 0.04
Footnote:
Source: Bloomberg New Energy Finance
Acquisition transactions in renewable energy by sector, 2004-2012
$bn
Total values include estimates for undisclosed deals.

Figure 60
2012 % growth on 2011
Marine 0.04 -61%
Geothermal 0.3 -30%
Biofuels 1.7 -71%
Small hydro 1.8 -24%
Biomass & w-t-e 1.8 -2%
Solar 14.1 -36%
Wind 32.6 -20%
Footnote:
Source: Bloomberg New Energy Finance
Acquisition transactions in renewable energy by sector, 2012, and growth on 2011
$bn
Total values include estimates for undisclosed deals.

Figure 61
2004 2005 2006 2007 2008 2009 2010 2011 2012
United States 3.0 8.7 11.4 19.6 13.9 17.1 17.7 16.8 22.2
Brazil 0.2 0.1 0.8 2.4 2.3 4.0 6.2 7.0 3.6
AMER (excl. US & Brazil) 0.2 0.6 1.3 2.3 2.0 3.2 5.1 5.9 6.6
Europe 5.0 14.0 20.4 25.8 35.7 30.2 22.3 37.1 16.7
Middle East & Africa 0.1 - 0.0 0.1 0.1 0.6 0.1 0.2 0.1
China - - 0.1 2.0 1.8 5.3 3.5 3.2 0.5
India - 0.1 0.1 0.4 0.9 1.0 1.1 0.7 0.4
ASOC (excl. China & India) 0.2 2.4 1.5 5.8 2.8 2.8 2.6 2.5 2.1
Footnote:
Source: Bloomberg New Energy Finance, UNEP
Total values include estimates for undisclosed deals.
Acquisition transactions in renewable energy by region, 2004-2012
$bn

Figure 62
Data: n/a
Footnote:
<none>
Source: Bloomberg New Energy Finance
New clean energy public equity funds launched, by year, 2000-2012

Figure 63
Data: n/a
Footnote:
<none>
Source: Bloomberg New Energy Finance
Tier 1 green bond issuance, 2003-2013
$bn
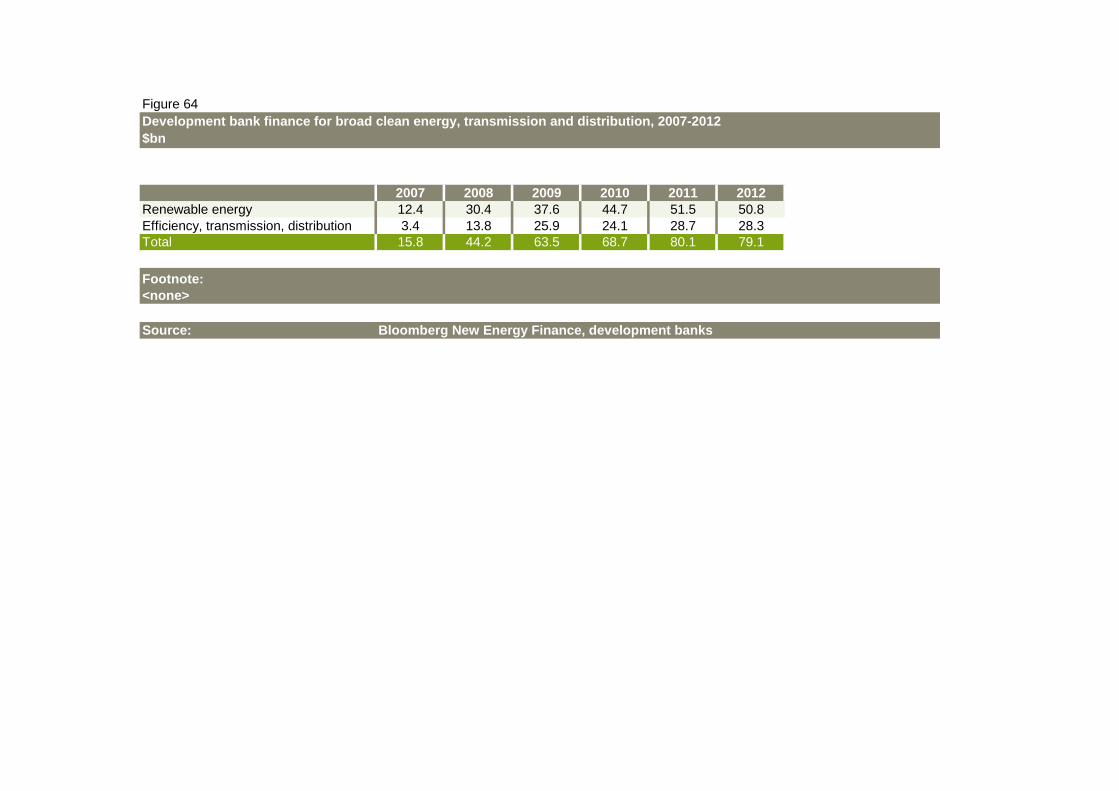
Figure 64
2007 2008 2009 2010 2011 2012
Renewable energy 12.4 30.4 37.6 44.7 51.5 50.8
Efficiency, transmission, distribution 3.4 13.8 25.9 24.1 28.7 28.3
Total 15.8 44.2 63.5 68.7 80.1 79.1
Footnote:
<none>
Source:
Development bank finance for broad clean energy, transmission and distribution, 2007-2012
$bn
Bloomberg New Energy Finance, development banks