final deliverable report november, 13 2014
TRANSCRIPT
Final Report – November, 13 2014 page 1 on 87
Contract No. 30-CE-0609772/00-59
Title: Modelling feed consumption in the European Union:
update and improvement of the Feed-Model (FeedMod)
______________________________________________________________________________
Final Deliverable Report
November, 13 2014
Project funded by the European Commission

European Commission — Contract : 30-CE-0609772/00-59 — Tallage Modelling feed consumption in the European Union: update and improvement of the Feed-Model (FeedMod)
Final Report – November, 13 2014 page 2 on 87
Abstract A computer model called FeedMod was created in 2009 to improve the European Commission’s ability to understand the feed consumption of raw materials in the EU 27. In 2014, a new version of this model has been proposed; the main improvements are:
• Nutritional parameters have been updated using reference tables, opinions of local experts, literature and our own expertise (theme 1)
• New raw materials have been included (theme 2)
• Croatia has been added to the model (theme 3)
• The part of the model predicting on-farm feed has been largely redesigned (theme 4). The roughages consumption (grassland and maize silage) no longer depends from fixed coefficients but is dynami-cally estimated from actual grassland and silage production data. The overall on-farm consumption (roughages + raw materials) can be assessed and predicted; it is no longer the simple difference between the theoritical animal nutritional needs and the energy supplied by industrial compound feed
• Model reliability has been improved through calibration (theme 5) and sensitivity analysis (theme 6) exploring the model's behavior in response to different scenarios of variability in inputs
Résumé Un modèle informatique, baptisé FeedMod, a été créé en 2009 pour aider la Commission Européenne à ap-préhender la consommation des matières premières par les animaux au sein de l’UE27. En 2014, une nou-velle version de ce modèle a été proposée ; les principales améliorations apportées sont les suivantes :
Ø L’actualisation des paramètres à partir de tables nutritionnelles de référence, d’avis d’experts locaux, d’éléments bibliographiques et de notre expertise (thème 1)
Ø L’intégration de nouvelles matières premières (thème 2)
Ø L’inclusion de la Croatie (thème 3)
Ø L’amélioration de la partie alimentation à la ferme (thème 4). La consommation animale des four-rages (prairies et ensilage de maïs) ne dépend plus désormais de coefficients fixes mais est estimée dy-namiquement à partir de données réelles de production fourragère. La consommation de matières premières destinées aux aliments fermiers est maintenant prédite directement à partir de la produc-tion de céréales, de l’utilisation de matières premières dans les aliments industriels, et de la produc-tion fourragère.
Ø Une fiabilité accrue du modèle grâce au travail de calibration (thème 5) et d’analyse de sensibilité (thème 6)
European Commission — Contract : 30-CE-0609772/00-59 — Tallage Modelling feed consumption in the European Union: update and improvement of the Feed-Model (FeedMod)
Final Report – November, 13 2014 page 3 on 87
Disclaimer:
This study was financed by the European Commission and was carried out by Tallage, AFZ and INRA (Mo-SAR).The information and views set out in this report are those of the authors and do not necessarily reflect the official opinion of the Commission. The Commission does not guarantee the accuracy of the data included in this study. Neither the Commission nor any person acting on the Commission’s behalf may be held responsible for the use which may be made of the information contained therein.

European Commission — Contract : 30-CE-0609772/00-59 — Tallage Modelling feed consumption in the European Union: update and improvement of the Feed-Model (FeedMod)
Final Report – November, 13 2014 page 4 on 87
Table of contents
1 INTRODUCTION – OBJECTIVES OF THE STUDY 6
1.1 CONTEXT OF THE STUDY 6 1.2 OBJECTIVES OF THE STUDY 8 1.3 METHODOLOGY USED 9 1.3.1 METHODOLOGY USED TO REVIEW AND UPDATE THE MODEL PARAMETERS AND INTEGRATE NEW FEED MATERIALS 9 1.3.2 METHODOLOGY USED TO INTEGRATE CROATIA INTO THE MODEL 17 1.3.3 METHODOLOGY USED TO IMPROVE THE MODEL FOR ON-FARM FEED 18 1.3.4 METHODOLOGY USED TO IMPROVE THE OVERALL ESTIMATED OF CONSUMPTION OF FEED MATERIALS IN SINGLE STATES (MODEL CALIBRATION) 19 1.3.5 METHODOLOGY USED FOR SENSITIVITY 21
2 THEME 1: REVIEW AND UPDATE THE MODEL PARAMETERS 24
2.1.1 THE NUTRITIONAL COMPOSITION OF RAW MATERIALS 24 2.1.2 NUTRITIONAL LEVELS OF THE INDUSTRIAL COMPOUND FEEDS FORMULAS 25 2.1.3 THE INCORPORATION LIMIT OF RAW MATERIALS IN THE COMPOSITION OF INDUSTRIAL COMPOUND FEEDS 26 2.1.4 CONVERSION COEFFICIENTS USED BY THE INDUSTRIAL MODEL 26 2.1.5 THE PRICE OF RAW MATERIALS 30
3 THEME 2: INTEGRATION OF NEW FEED MATERIALS USED IN THE INDUSTRIAL COMPOUND FEED 32
3.1.1 INVENTORY OF POSSIBLE NEW RAW MATERIALS 32 3.1.2 HIGH PRO SUNFLOWER MEAL 32 3.1.3 PROCESSED ANIMAL PROTEINS (POULTRY OR PIG) 32 3.1.4 UREA 33
4 THEME 3: INTEGRATION OF CROATIA INTO THE MODEL 34
4.1 ANALYSIS OF CROATIA'S ANIMAL PRODUCTION SYSTEMS 34 4.1.1 CATTLE PRODUCTION 34 4.1.2 POULTRY PRODUCTION 34 4.1.3 PIG PRODUCTION 35 4.1.4 LINKING CROATIA TO SEVERAL VIRTUAL FACTORIES 35
5 THEME 4: IMPROVEMENT OF THE MODEL FOR ON-FARM FEED 37
5.1 ANALYSIS OF FACTORS AFFECTING FEEDING ON THE FARM 37 5.1.1 FACTORS THAT AFFECT FEEDING ON THE FARM 37 5.1.2 DEVELOPMENT OF ON-FARM FEED IN THE EU 28 39 5.1.3 DIVISION PER MEMBER STATE 41 5.2 ESTIMATE OF FODDER CONSUMPTION BY POLYGASTRIC ANIMALS 42 5.2.1 PASTURES DATA BASE 42 5.2.2 DATABASE FOR MAIZE SILAGE 43 5.3 RECALCULATION OF ON-FARM FEED ON THE BASIS OF FODDER PRODUCTION BALANCE SHEETS 43 5.3.1 CALCULATION OF TOTAL CONSUMED “BALANCE SHEET BASIS” AND COMPARISON WITH NEEDS 43 5.3.2 FIXING MARKERS OF NEEDS ON HISTORICAL BASIS 48 5.4 CONSEQUENCE ON THE PREDICTIVE MODEL 49

European Commission — Contract : 30-CE-0609772/00-59 — Tallage Modelling feed consumption in the European Union: update and improvement of the Feed-Model (FeedMod)
Final Report – November, 13 2014 page 5 on 87
5.4.1 FODDERS 49 5.4.2 ON-FARM FEEDS (NON-FODDER COMPONENT) 50
6 THEME 5: MODEL CALIBRATION 57
6.1 PRELIMINARY WORK 57 6.1.1 LIMITATION OF QUARTERLY TONNAGES 57 6.1.2 OTHER PRELIMINARY CHANGES 57 6.2 CALIBRATION RESULTS 58 6.2.1 BELGIUM-LUXEMBURG 58 6.2.2 CZECH REPUBLIC 58 6.2.3 DENMARK 58 6.2.4 FRANCE 58 6.2.5 GERMANY 59 6.2.6 HUNGARY 59 6.2.7 IRELAND 60 6.2.8 ITALY 60 6.2.9 NETHERLANDS 60 6.2.10 POLAND 60 6.2.11 ROMANIA 61 6.2.12 SPAIN 61 6.2.13 UNITED KINGDOM 62 6.2.14 EU-28 62 6.3 CONCLUSION ON CALIBRATION 67
7 THEME 6: SENSITIVITY ANALYSIS 69
7.1 GENERAL COMMENTS ON SENSITIVITY ANALYSIS 69 7.2 APPLICATION TO FEEDMOD 69 7.2.1 INPUT DATA 71 7.2.2 RESULTS 81
8 CONCLUSIONS AND RECOMMENDATIONS 86
TABLE OF FIGURES 87

European Commission — Contract : 30-CE-0609772/00-59 — Tallage Modelling feed consumption in the European Union: update and improvement of the Feed-Model (FeedMod)
Final Report – November, 13 2014 page 6 on 87
1 Introduction – Objectives of the study
1.1 Context of the study
Animal production constitutes one of the largest agricultural sectors in Europe. According to the estimates provided by the European Feed Manufacturers Federation (FEFAC) in 2013, animal feed manufacturers in the EU produced 155 Mt of industrial compound feed. Fully 61 % of all grains produced in the EU are used in livestock feeds and this makes animal feedstuffs the major outlet for the EU cereal production. In 2013, the volume of feedstuffs used for animal production within the EU 28 was about 477 million tonnes (49% roughages, 11% cereals grown and used on the farm, 8% purchased feed materials and 32% industrial com-pound feed)1.
Roughages represent almost half of all feed consumed in the EU. This includes grass (pasture), silage, lucerne, fodder beets and other fodder crops. This is the main source of energy for especially beef and dairy cattle, sheep and goats, as well as other species. While grass is often consumed through grazing, considerable quanti-ties of roughages are also harvested and fed housed animals or stored for later (winter) consumption.
Compound feed is a very important part of feed stuffs and includes: cereals2, oilseed and other protein meals, field peas and beans, dehydrated fodder, cassava, skimmed-milk powder, and a collection of commercially traded agricultural by-products, including corn gluten feed (CGF), bran, corn germ meal, citrus pulp, sugar beet pulp, brewer's and distiller's residues, fruit and vegetable wastes, molasses, animal and vegetable fats, fish meal, and meat and bone meal. Feed ingredients (raw materials) are highly substitutable among themselves. Feed ingredients other than grains and high-protein oilseed meals are often also referred to as non-grain feed ingredients (NGFI) or "cereal substitutes" because they are thought to replace grains in feed rations. Feed is either produced by the manufacturing industry (industrial compound feed) or prepared by the farmers (on-farm feed) from various crops grown on the farm and /or other feeding materials purchased on the market.
The European Commission is responsible for the management of the EU agricultural markets, with the pur-pose of ensuring a stable supply of food. This requires knowledge of the consumption of cereals and other crops. In order to improve the Commission's capacity to estimate EU demand for raw materials used in ani-mal feed, the Directorate General for Agriculture and Rural Development of the European Commission (DG AGRI) supported the development of a quantitative model via the study "Modelling feed consumption in the European Union".
As a result of the study an IT model (FeedMod) was created. The model consists of an MS Access database application (written in Visual Basic for Applications VBA) and FICOTM Xpress for linear optimization. The model uses as an input data on the production of industrial compound feed, cereals, animal production and market prices of raw materials from the EU Member States. The model calculates the quantity of raw mate-rials used in industrial compound feed and in on-farm feed. The consumption of raw materials in industrial compound feed is calculated by linear optimization – the optimizer looks for the least expensive mixture of feed materials, which meet the nutritional constraints. The consumption of materials in on-farm feed is cal- 1 FEFAC : « From Farm to table – statistics 2013 » and « Comound feed 2013 » : http://www.fefac.eu/publications.aspx?CategoryID=2061&EntryID=10802 http://www.fefac.eu/publications.aspx?CategoryID=2061&EntryID=10646
2 Only the cereal grains are considered ingredients for producing feed concentrates
European Commission — Contract : 30-CE-0609772/00-59 — Tallage Modelling feed consumption in the European Union: update and improvement of the Feed-Model (FeedMod)
Final Report – November, 13 2014 page 7 on 87
culated using fixed coefficients obtained from statistical regression. More information on the study and model can be found in the study report3. The model has been extensively used in DG AGRI to estimate and forecast not only the consumption of feed ingredients in the European Union but also the cost of materials used in compound feeds. Based on experience from using it, the following three areas for improving the model have been identified.
The first area concerns the update of the model parameters. The model requires an extensive set of parame-ters related to animal nutrition and production in the European Union Member States. These parameters re-flect the state of livestock production systems in 2008. Since then, changes in these systems may have oc-curred due to e.g. changes to the Common Agricultural Policy and to economic conditions in the Member States. In order to ensure reliable estimates of the model the parameters should be updated. The update after 5 years was also a recommendation of the initial study.
The second area concerns the addition of Croatia to the model, after its accession to the EU. The parameters for animal production systems in Croatia should be added to the model database.
The third area concerns the improvement of the application to better model consumption of on-farm feed. Currently, the consumption of on-farm feed is calculated in three steps (Figure 7 page 18).
• In the first step the total energy needs of the animals are calculated.
• In the second, the energy supplied by the industrial compound feeds is deducted from the total energy needs of all farm animals. The difference is the energy supplied from the on-farm feed and roughage. For cattle it is further reduced by the percentage of the energy supplied by roughage.
• In the third step the remaining energy is converted into tonnage of different materials (cereals, meals etc.) used in on-farm feeds with coefficients from statistical regression4.
This approach has some limitations. Firstly, the energy supplied to the cattle from the green fodder5 is calcu-lated using fixed percentages6. In reality, changes of weather conditions or raw materials prices may modify the percentage of green fodder in the animals' diet and thus affect the consumption of cereals used in the on-farm feed. Secondly, the current method does not give any information on the quantity of roughage used. Thus, the part of the model for the on-farm feed should be further developed to enable better estimates of:
• roughage;
• cereals grown and used on the farm;
• purchased feed materials.
To take into account the influence of weather conditions, the model will include specific data from the Eu-ropean Commission Joint Research Centre Monitoring of Agricultural Resources (JRC MARS)7 unit.
3 More details about the study and the model can be found on the website : http://ec.europa.eu/agriculture/analysis/feed/index_en.htm
4 statistical regression based on the level of harvest for each material and the percentage of the material calculated in the optimiza-tion for the industrial compound feeds
5 The percentage of energy supplied to the animals from green fodder is used in the model only for dairy and beef cattle
6 Per Member State, animal group and quarter
7 JRC MARS activities : http://mars.jrc.ec.europa.eu/mars/About-us/AGRI4CAST/Crop-Monitoring-and-Yield-Forecasting

European Commission — Contract : 30-CE-0609772/00-59 — Tallage Modelling feed consumption in the European Union: update and improvement of the Feed-Model (FeedMod)
Final Report – November, 13 2014 page 8 on 87
1.2 Objectives of the study
The study aims to improve the quality of the FeedMod model’s estimates. This is to be achieved by:
• Updating the parameters related to feed material prices, animal nutrition (feed formulation etc.), in-dustrial compound feed production and animal production in the model,
• Incorporating Croatia into the model,
• Improving the on-farm feed part of the application to calculate of quantities of roughage, cereals grown and used on the farm and purchased raw materials.
The study covers all individual EU 28 Member States for the period 2007/2008 to 2012/13 (marketing years July/June).
The study will concern the same animal groups as in the first study “Modelling of feed consumption in the European Union”, i.e. dairy cows, beef cattle, broilers, turkeys, ducks, laying hens and pigs.

European Commission — Contract : 30-CE-0609772/00-59 — Tallage Modelling feed consumption in the European Union: update and improvement of the Feed-Model (FeedMod)
Final Report – November, 13 2014 page 9 on 87
1.3 Methodology used
1.3.1 Methodology used to review and update the model parameters and integrate new feed materials
Fefac statistics
Eurostat statistics
Material prices
Calculation of feed material tonnages
for industrial compound feeds
Calculation of industrial feed
tonnages
Calculation of on-farm feed
tonnages
Calculation of material costs
Calculation of feed material tonnages for
on-farm feeding
Nutritional data
On-farm parameters
Final results Input data: update frequently
Access procedures
Parities
Industrial parameters
Model parameters: update every 5 years
Xpress optimizer
JRC fAPAR indices
Input data: update very frequently
Figure 1: FeedMod calculations
In March 2014 Tallage received on behalf of DG AGRI a copy of folders from the database FeedMod, see above the calculations of the model Figure 1. This database was used as the basis for the current work.
1.3.1.1 Methodology used to update the composition of materials and the nutritional needs formula of industrial compound feeds
The result of the 2009 FeedMod study was to work with reference nutritional tables for the main Member States that have one even if some of these data were relatively old (German tables DLG, 1997) – than a single source of data. It was decided to keep this principle for the FeedMod 2014 study as it adds precision to the model. Indeed variations in the expressing of data for nutritional values between tables explain different hierarchies between raw materials. For example, pig energy could be expressed in metabolizable, digestible or net energy depending on the country in question. If only one reference table was used for all, then these hierarchies would be erased and it would therefore be difficult to model the behavior of feed producers.
European Commission — Contract : 30-CE-0609772/00-59 — Tallage Modelling feed consumption in the European Union: update and improvement of the Feed-Model (FeedMod)
Final Report – November, 13 2014 page 10 on 87
After consulting European experts in animal nutrition, it was concluded that the reference tables mostly used by animal feed producers to characterize the raw materials and nutritional needs are still the same as those used in the study FeedMod 2009. On the other hand there have been some intrinsic adjustments to tables for certain raw materials and/or nutritional needs (as in the case of high protein sun meal or in the case of the EvaPig tables derived from INRA tables in France for pig production).
As for the study FeedMod 2009, even if there existed noticeable differences between animal feed producers, Tallage could confirm that in the Member States that already have a long history in the compound feed industry a certain consensus exists on the use of a nutritional system (France, Germany, Netherlands, Spain and Denmark). In Member States where the industry is more recent and notably still developing via international companies setting up branches, the nutritional systems are more mixed and depend on the codes of practice of the company. Even though these Member States are making an effort in publication and research, the values given by the national research institutes are not fully integrated into the producers’ formulation system of compound feeds.
It was decided (in FeedMod 2009) to further investigate all Members States whose total industrial com-pound feed production is more than 5% of the total compound feed production in the EU 27 countries (Germany, France, Italy, Netherlands, UK, Spain, Poland). Some Member States with a special production of compound feed (Belgium, Denmark, which have a significant production of food for pigs, and Ireland, as it has an important feed cattle production -5% of the EU 27) was added to this list. Finally, as the integration of Eastern European countries is also important, it was decided to study in detail Czech republic, Hungary and Romania.
Thus, 13 Member States were classified as " main Member States" for the "Industrial Compound Feed sec-tion”. They represent 92% of the compound feed production in the EU 27. The remaining 14 Member States were linked to main ones, based on the information gathered in the analysis of livestock production systems.

European Commission — Contract : 30-CE-0609772/00-59 — Tallage Modelling feed consumption in the European Union: update and improvement of the Feed-Model (FeedMod)
Final Report – November, 13 2014 page 11 on 87
Figure 2 presented below shows the main references for the values of raw material nutritional composition and nutritional needs of animals.
Reference tables for the matrix of chemical and nutritional components of raw materials Member States Cattle Pig Poultry Germany DLG Belgium CVB
Denmark
Dansk Kvæg
(Videncenter for Landrug)
Dansk Svineproduktion
(Videncenter for Svineproduktion) CVB Spain FEDNA France INRA-AFZ EvaPig INRA- AFZ Netherlands CVB UK Several references (ADAS NSRU, INRA, private tables)
Czech Republic Private Tables / Czech Academy of Agricultural Sciences
Figure 2: Reference tables for nutritional compositions of raw materials and nutritional needs of animals
Figure 3 shows how Hungary, Ireland, Italy, Romania and Poland joined the 8 other main States (for exam-ple: Hungarian production is closed to France case for ducks production and closed to Germany for produc-tion of other species).

European Commission — Contract : 30-CE-0609772/00-59 — Tallage Modelling feed consumption in the European Union: update and improvement of the Feed-Model (FeedMod)
Final Report – November, 13 2014 page 12 on 87
State Reference State Comments Hungary France for ducks,
Germany for the other species.
Numerous data are available on the site of the Research institute in animal nutrition of Herceghalom (HU). The nutritional systems proposed (metabolizable energy pig, net energy dairy cow) seemed coherent with the choice of Germany as reference State. With duck production being heavily orientated toward foie gras (2nd producer in the world) exported towards France, Tallage privileged this State as reference for this production.
Ireland France The French evaluation system of nutritional values (UF and PDI) for cattle has been officially adopted by Ireland. For pork, the firm RH Hall published in 2001 a table of energy values with EN of the Noblet type (French system).
Italy France The French system is often cited in Italian references for the nutrition of cattle.
Romania Germany The pork and poultry system relies on metabolizable energy as in Germany. It would appear that the system is moving towards the French one for cattle (UF and PDI). There also exists a Romanian nutritional system for cattle based on energy values of oats.
Poland Germany The tables for Polish pork date back to 1993 and show energy values in metabolizable energy (as in Germany). Polish translations of German DLG tables exist for ruminants and pigs. Poultry tables were published in 2005.
Figure 3: Choice of tables for Hungary, Ireland, Italy, Romania and Poland
1.3.1.2 Methodology used to update the limits of incorporation of raw materials in formulas of industrial compound feeds
Tallage surveyed European experts in the field of animal feeds on their recommendations of the use of raw materials by species and by production phase. Tallage also gathered bibliographic information.
1.3.1.3 Methodology used to update conversion coefficients used by the model
To set-up the model, FeedMod uses animal data from Eurostat and/or Statistics from national offices (live-stock or animal production) that enables to calculate tonnage forecasts, and FEFAC tonnage for completed periods.
In order to simplify the model, geographical areas by Member States were defined on the basis of their con-sistency with respect to types of animal production and supply of raw materials circuits. Thus, a virtual plant is included in the model to simulate the global production of industrial compound feed’s tonnages in the ar-ea.
There are 27 virtual plants in FeedMod for the 13 « main » Member States. Figure 4 illustrates Brittany ‘s virtual plant in France. In Brittany, one virtual factory (yellow square in figure) produces all tonnages of in-dustrial compound feed of this region.

European Commission — Contract : 30-CE-0609772/00-59 — Tallage Modelling feed consumption in the European Union: update and improvement of the Feed-Model (FeedMod)
Final Report – November, 13 2014 page 13 on 87
Figure 4: Localisation of a FeedMod’s virtual plant
There are 5 conversion coefficients used in turn by the model to break down these statistical data into feed formulas per species and per virtual factory.
The conversion coefficients C1 transform the statistical data of FEFAC or Eurostat into tonnage of com-pound feeds per animal group (pig, cattle, and poultry). They are calculated automatically thanks to FEFAC/Eurostat data. They represent an average of the three most recent years when information has been available. C1 coefficients were therefore not put into question in this study.
The conversion coefficients C2 are mostly calculated from statistical data. These coefficients allow to decon-struct an animal group into its different physiological stages. For most States this coefficient is available in national statistics; it corresponds to an average of the three most recent years when information has been gathered. They can also be copied from one MS to another according to the conclusions of the FeedMod 2009 study (for example: the coefficient 2 in Estonia is copied from Denmark's). Therefore these coefficients C2 were not called into question. However, for some MS where coefficient C2 were “frozen”, (and therefore not updated through the launch of calculating averages) Tallage proceeded in updating them (from Tallage, FEFAC, Eurostat, statistics from national offices and professional or national research organizations data-bases).
The C3 coefficients distribute the tonnages from an animal type to an animal formula and were obtained from the study in 2009. These coefficients C3 have not been updated in this study as this would have meant more a reworking of the whole project and not a simple update exercise.
Conversion coefficients C4 distribute the formulas per virtual factory within one MS. These C4 coefficients have undergone a general update. To do this Tallage has used the same sources than for coefficients C2.
Finally, conversion coefficients C5 allow to move from yearly formulation to quarterly formulation. Tallage has updated coefficients C5 for ruminant feeds only, as it is the only production where a quarterly cycle can easily be identified. For the other species conversion coefficient C5 remains equal to 25% for each period and each State. To do this, Tallage used the same sources than for C2 coefficients.
Tallage conducted a bibliographic work from the diverse sources of information and compared the results of this research with those available in the DG Agri model of March 2014. Tallage made the changes when nec-essary and only when the available information sources were detailed enough to give greater precision to the model in place.
Figure 5 is an example, which presents the utilization of conversion coefficients in the estimation for meat poultry feed in the UK in 2007.

European Commission — Contract : 30-CE-0609772/00-59 — Tallage Modelling feed consumption in the European Union: update and improvement of the Feed-Model (FeedMod)
Final Report – November, 13 2014 page 14 on 87
F E E D M O D M A N U A L - 1 3
4. C4: Coefficients that distribute the tonnages from an animal group (pig) at Member State level to the same group at plant level.
5. C5: Coefficients that distribute the tonnages from an animal group (pig) at Member State level to the same group at quarter level
The following example presents the estimations for meat poultry feed in the UK in 2007.
The first input is the poultry meat production (1000 t) from Eurostat, provided at Member State level.
Member State level Poultry meat production 1454
The C1 coefficient estimates the total meat poultry feed production.
Feed C1 coefficient Animal group estimate Meat poultry feeds 4567 3.14
The C2 coefficients estimate the total poultry feed production for broilers and turkeys (duck production is considered to be negligible)
Feed C2 coefficient Animal type estimates Broiler feeds 3517 77% Turkey feeds 1050 23%
The C3 coefficients estimate the feed production for turkey formulas.
Feed C4 coefficient Formula estimates Turkey growing 788 75% Turkey finishing 262 25%
The C4 coefficients estimate the feed production by individual formulas at Plant level.
Great Britain
Northen Ireland
Plant level C4 coefficients 80% 20% Turkey growing 630 158 Turkey finishing 210 53
The C5 coefficients estimate the turkeys feed production by individual formulas at plant and quarterly level.
C5 coefficients
Quarterly level 1rst quarter 25% 2nd quarter 25% 3rd quarter 25% 4th quarter 25%
Great Britain
Northen Ireland
1rst quarter Turkey growing 158 39 Turkey finishing 53 13
For each formula for a given Member State and calendar year, the procedure first searches for a Fefac feed tonnage corresponding to the related animal group (meat poultry in the case of a
Figure 5: Utilization of conversion coefficients in the estimation for meat poultry feed in the UK in 2007
1.3.1.4 Methodology used to redefine prices and balance parities of raw materials used by the model
Since the implementation of the model in 2009 some series of prices necessary in the formulation of indus-trial compound feeds were discontinued and therefore could no longer be used satisfactorily to allow the model to work (as data for the model) see Figure 6, below.

European Commission — Contract : 30-CE-0609772/00-59 — Tallage Modelling feed consumption in the European Union: update and improvement of the Feed-Model (FeedMod)
Final Report – November, 13 2014 page 15 on 87
Discontinued or frequently missing price time series used in FedMod
Price series Type Place Source DG AGRI comments
Feed pea / NL / cif Cif Netherlands V&V BINternet
Alfalfa 18 FeedBase La Depeche "Luzernes dehydrates" used.
Beet pulp / départ Marne 8mm In absence of 8mm "La Depeche pulpe de betterave Marne 6mm" used instead.
Breadmaking common wheat - Napoli (Italy) ex silo Napoli DG Agri Unavailable between 2011-Q4 and
2013-Q1
CaCO3 Feedbase not updated since 2012-Q2
Cassava BINternet
Citrus pulp Ex-store Liverpool ex store Liverpool HGCA In absence of original data La Depeche "PSC Citrus depart Bel-gique" used.
Corngluten Pellets, 23/24%, de ́p France (Lille/Montoir) (€ / T) ex France La Dépêche
In absence of original data La Depeche "PSC corn gluten feed Lestrem" used.
Dicalcium phosphate Feedbase not updated since 2012-Q2
Feed barley - Kobenhavn (Den-mark) ex Kobenhavn DG Agri Unavailable between 2012-Q3 and
2012-Q4
Feed barley - Köln (Germany) ex Köln DG Agri Unavailable since 2011-Q3
Feed barley - La Pallice (France) deli-vered La Pallice DG Agri Unavailable since 2012-Q3
Feed barley - Napoli (Italy) ex silo Napoli DG Agri Unavailable since 2011-Q3
Feed maize - Bayonne (France) deli-vered Bayonne DG Agri Unavailable 2011-Q3 - 2012-Q2 and
from 2013-Q1
Feed maize - Sud-Ouest (France) ex France Sud-
Ouest DG Agri Unavailable since 2011-Q3 (except 2012-Q3)
Feed oats - London (Royaume-Uni)
deli-vered London DG Agri Unavailable since 2011-Q3
Feed wheat - Kobenhavn (Den-mark) ex Kobenhavn DG Agri Unavailable 2012-Q3 - 2012-Q4
Field peas Delivered East Coast deli-vered
East Coast UK HGCA
Fish meal / Chili 66% "La Dépêche"

European Commission — Contract : 30-CE-0609772/00-59 — Tallage Modelling feed consumption in the European Union: update and improvement of the Feed-Model (FeedMod)
Final Report – November, 13 2014 page 16 on 87
Lysine Feedbase not updated since 2012-Q2
Maize / départ région lyonnaise ex Lyon La Dépêche "Sud Cote-d'Or/Saone-et-Loire" from "la Depeche" used as replce-ment.
Methionine Feedbase not updated since 2012-Q2
Molasses (beet) Molasses (cane) used.
Molasses (cane) BINternet
Soya pellets, 44/45% Argentine, cif Rotterdam (€ / T)
Discontinued in OilWorld. Toepfer "Soja Extr'schrot-Pell. 48% Pro/ Fat cif Rotterdam" used instead.
Soybeans, Argentina, cif Rotter-dam (€ / T) cif Rotterdam Oil world Discontinued in Oilworld from Aug
2012
Sun Pellets, 37/38%, Argentina, cif Rotterdam (€ / T) cif Rotterdam Oil world
Discontinued in OilWorld. Toepfer "Sonnenbl'schrot-Pell. Regular 37/38% Pro cif Rotterdam" used instead.
Threonine Feedbase not updated since 2012-Q2
Tryptophan Feedbase not updated since 2012-Q2
Figure 6: Quotations times series to be reviewed
Two coexisting cases.
The first involved cereals not listed for certain periods. Tallage estimates them from a series of known prices 8. The second case regarded four amino acids (lysine, threonine, methionine and tryptophan) and two min-erals (dicalcium phosphate and calcium carbonate). For these four amino acids, CEREOPA have undertaken to provide prices to DG AGRI.
1.3.1.5 Methodology used to add new raw materials to the model.
Firstly, Tallage checked the raw materials that were not incorporated in the model FeedMod 2009 and yet are frequently used by feed producers in the European Union. The work on this subject is based on regula-tion 68/20139 relating to the catalogue of raw materials for animal feeds supplied by DG AGRI. Tallage questioned experts and studied different databases of animal feeds (including reference tables cited in Figure 2, FeedBase- source AFZ10/CEREOPA, database of firm services). The difficulty of this phase was to carry 8by using the method of calculation of the coefficient of correlation between two variables
9 COMMISSION REGULATION (EU) N° 68/2013 of 16 January 2013 on the catalogue of feed materials ; http://eur-lex.europa.eu/LexUriServ/LexUriServ.do?uri=OJ:L:2013:029:0001:0064:EN:PDF
10 French Zootechnic association

European Commission — Contract : 30-CE-0609772/00-59 — Tallage Modelling feed consumption in the European Union: update and improvement of the Feed-Model (FeedMod)
Final Report – November, 13 2014 page 17 on 87
out sensible choices that brought precision to the model without at the same time making it more complex. Tallage evaluated the respective consumption of these raw materials within the European Union over the last six campaigns (2007/08-2012/13), based on the information available, the representative threshold having already being set by the Commission at 300 kt/year/raw material. Furthermore, the chemical composition of the potential new raw materials could not vary too much, (so that they could be valorized nutritionally from the reference tables). They also had to show a price easily accessible to the user.
1.3.2 Methodology used to integrate Croatia into the Model
Croatia's integration to the FeedMod was done after having analyzed the systems of animal production in order to link Croatia to virtual factories of the main MS.
For the FeedMod 2009 study, Tallage shortlisted 13 MS deemed to be the most important (Germany, Bel-gium, Denmark, Spain, France, Hungary, Ireland, Italy, Netherlands, Poland, Czech Republic and United Kingdom). Tallage created 27 virtual factories in these 13 MS (representing more than 90 % of the produc-tion of industrial compound feeds in the EU) according to the information coming from the analysis of the systems of animal production (homogenous zones of production in terms of animal production, supply routes in raw materials and animal feeds). Tallage linked each of the remaining MS animal production to a virtual factory, according to several criteria.
Analysis of Croatia's animal production systems was carried out in the same way as that of the FeedMod 2009 study. Therefore Tallage used the same model plan, i.e:
• Geographic presentation of the country followed by the distribution of compound feeds by species,
• Evolution of the three species of livestock (cattle, pig and poultry) since 2000,
• Characteristics of animal production: cattle (meat and dairy), poultry and pig, ratios compound feeds/animal production.
Then, according to this information, Tallage linked each animal species to a virtual factory in one of the main MS based on the following criteria:
• Availabilities of raw materials: Croatia must be linked with a country which has similar situation in terms of raw material supply (net importer for example) and that is situated in a similar geographic en-vironment,
• Structure of livestock: the attachment to a virtual factory of a main State is also a function of the break-down of cattle livestock (dairy and no dairy herd), breeding sows and pigs for fattening and between poultry for meat and laying hens,
• Zootechnic performances: Tallage compared the dairy yields for Croatia with those of Member States deemed main, along with production ratios of meat for all pig and poultry livestock,
• Feeding method: finally, the choice of the attachment of Croatia was based on the ratios compound feeds/livestock for the three species concerned.
Several information sources were used to conduct the analysis of Croatia's systems of animal production:
• Eurostat database: animal livestock, meat production (beef, pig and poultry), dairy and egg production,
• Tallage database: livestock structure, meat and egg production,
• Special issue of Stratégie grains – Tallage: Integration of Croatia in the European Union (April 2013),
• FEFAC: production of feeds for each species studied (cattle, pig and poultry),

European Commission — Contract : 30-CE-0609772/00-59 — Tallage Modelling feed consumption in the European Union: update and improvement of the Feed-Model (FeedMod)
Final Report – November, 13 2014 page 18 on 87
• National statistics institute, agricultural ministry for agriculture, professional organizations and nation-al research institutes: information on production systems and elements on animal feeds.
1.3.3 Methodology used to improve the model for on-farm feed
In the FeedMod 2009 model, the energy needs was calculated for each section of the herd,11 expressed in an appropriate unit (UFV, UFL)12. For each section, based on Tallage’s expertise, the energy supplied by com-pound feeds using the average content of the compound feed for a species as a starting point (cf. Figure 7 blue arrows) has been calculated. For monogastric animals (pig and poultry) section, Tallage considered that the balance between the total needs (BT) and the energy supplied by the industrial compound feed (EnACI) represents the consumption of on-farm feeds (orange arrows). For polygastric animals (cattle), the residual need is covered partly by green fodder (EnF), depending on a fixed percentage for each MS and section of the herd, independently from the crop year considered. On-farm feeds were then calculated as being the balance between the total needs and the total of industrial feeds and fodder (green arrows).
BT#:#To
tal#ene
rgy#he
rd#need
BT#:#To
tal#ene
rgy#he
rd#need
Industrial#compound#feed#production
Industrial#compound#feed#production
EnACI#:#energy#supplied#by#industrial#compound#feed
EnACF#:#energy#supplied#by#on=farm#compound#feed(balance#BT#=#EnACI)
PIG
POULTRY
BT#:#To
tal#ene
rgy#he
rd#need
EnACF#:#energy#supplied#by#on=farm#compound#feed(balance#BT#=#EnACI)
EnACI#:#energy#supplied#by#industrial#compound#feed
CATTLE
EnF#:#energy#supplied#by#forage(fixed#%)
EnACI#:#energy#supplied#by#industrial#compound#feed
Industrial#compound#feed#production
EnACF#:#energy#supplied#by#on=farm#compound#feed
(balance#BT#=#EnACI#=#EnF)
Figure 7: Diagram of the calculation of farm feeds in FeedMod 2009
The total volume of on-farm feed must be divided up between the different sources (cereal and meals) using the distribution coefficients C7.
11 Dairy cows, non-dairy cows, pigs, laying birds, poultry for meat
12 Unité Fourragère Viande (French feed unit) for meat production, Unité Fourragère Lait (French feed unit) for milk produc-tion, net energy for baconers, Metabolizable energy poultry.

European Commission — Contract : 30-CE-0609772/00-59 — Tallage Modelling feed consumption in the European Union: update and improvement of the Feed-Model (FeedMod)
Final Report – November, 13 2014 page 19 on 87
Two possibilities to improve the model came to light, that were taken into account in the tender for this cur-rent contract:
• Not to consider the energy supplied by fodder as fixed, but as a variable that the model would forecast.
• Study a possible improvement in the method of coefficients (C7) to calculate the division between the various raw materials of the on-farm feeds.
The objective was to estimate how much the calculated energy supplied differed from the theoretical need. Tallage thus has the evidence that taking into account the energy supplied by fodder enables to improve the results. Tallage has at its disposal, for previous crop years, data estimated on the basis of production and re-sults for all the sections of feeds: industrial compound feeds, on-farm feeds (like FeedMod 2009) and green fodder (new to FeedMod 2014).
Tallage calculated the theoretical overall energetic needs by herd using as a starting point the meal and grains results, the maize ensilage harvest and the projection of the energy supply from the pastures. The data for the consumption on the farm for grains and meals come from the supply and demand balance sheets supplied by Tallage. The past consumption from fodder crop years (maize ensilage and pastures) was estimated from da-tabases created for this purpose.
For the predictive aspect, production from green fodder will be estimated from the provisional data on sur-face area for ensilage and pastures, provisional ensilage yields and data from the fAPAR13 database (supplied by JRC).
The distribution of raw materials in on-farm feed remains the same as FeedMod. The distribution is realized on the basis of coefficients applied to harvests and consumption in industrial feeds. The distribution takes into account a variation in relation to the theoretical need in order to consider the adaptation of the perfor-mance of the herd by farmers according to prices and availability of raw materials.
1.3.4 Methodology used to improve the overall estimated of consumption of feed ma-terials in single States (model calibration)
1.3.4.1 Objectives
The FeedMod model comprises 3 sub-models:
• a « preliminary » model that estimates the tonnages of industrial compound feeds and on-farm feeds,
• an « industrial » model that estimates the tonnages of feed materials meant for industrial compound feeds,
• and an « on-farm » model that estimates the tonnages of feed materials meant for on-farm feeds.
The objective of the calibration step is to fit the parameters of the « industrial » model in order to obtain re-sults as close as possible to the available data for feed materials used in industrial compound feeds.
1.3.4.2 References
The reference period for calibration goes from the 2007/08 campaign to the 2012/13 campaign.
Pre-calibration results from FeedMod 2014 have been compared to references provided by Tallage, who has data for the 2007/13 period (6 campaigns), for the 28 Member States and for the main feed materials. Tal- 13 Fraction of Absorbed Photosynthetically Active Radiation

European Commission — Contract : 30-CE-0609772/00-59 — Tallage Modelling feed consumption in the European Union: update and improvement of the Feed-Model (FeedMod)
Final Report – November, 13 2014 page 20 on 87
lage separates the tonnages of feed materials meant for industrial compound feeds from the tonnages of feed materials meant for on-farm feeds.
Tallage data have been organized in a database using the same codes as in FeedMod in order to facilitate data extraction and comparisons. Tallage and FeedMod databases do not use exactly the same list of feed materi-als, but the differences only concern low-volume ingredients such as amino acids. Wheat and durum wheat, which are separate materials for Tallage, have been grouped together since FeedMod only recognizes one type of wheat.
1.3.4.3 Target
The industrial model in FeedMod is actually the sum of 540 models (27 « plants » x 20 formulas) that are almost independent from each other. Because reference data do not exist at this level of detail, the individual calibration of each model is impossible. The calibration was carried out at the only level of detail allowed by Tallage data: per Member State, campaign and feed material.
The calibration was done on the 13 main Member States (which represent 92% of the EU 28 tonnage), since the tonnages for the other States are derived from those and cannot be calculated independently. The feed materials targeted for the calibration were the major cereals (wheat, barley, maize) and the soybean meal, as these materials more or less drive the formulas.
The calibration target was the 6-campaign average of the absolute differences between Tallage data and FeedMod data. The objective was to minimize this target until it was lower than 500,000 t per State and feed material. A tonnage target was preferred to an inclusion rate target in order to prioritize the materi-al/Member State couples with the highest influence in the EU 28.
1.3.4.4 Calibration method
Differences between reference and model data have several causes:
• Model parameters such as feed composition, animal requirements or inclusion rates may differ from those actually used by feed manufacturers,
• Feed material prices may differ from reality,
• The buying strategies of feed manufacturers may not always be based on least-cost formulation.
Because these elements are unknown, the calibration must be done empirically, by modifying feed composi-tion, animal requirements, inclusion rates or prices.
Modifying composition data is not advisable unless they have been clearly identified as the source of a specif-ic problem. Composition data are reliable and well known, and even if local variations exist, they cannot be modified significantly without a complete reassessment of their biological basis. A similar issue exists with animal requirements.
Modifying prices can be very efficient. A feed material can be made more or less attractive by changing its « parity » value. This may correspond to actual situations, but preliminary tests showed that this method was difficult to tune properly to obtain accurate results, even when using large price differentials. The long-term effects of this method are also problematic, because it separates the model from the economic context.
Eventually, it appeared that the most efficient method for calibrating the « industrial » model of FeedMod was to modify the maximum (and sometimes the minimum) inclusion rates. This method simulates Member State-level availability constraints by forcing FeedMod to obey maximum inclusion rates rather than maxi-mum inclusion tonnages.

European Commission — Contract : 30-CE-0609772/00-59 — Tallage Modelling feed consumption in the European Union: update and improvement of the Feed-Model (FeedMod)
Final Report – November, 13 2014 page 21 on 87
1.3.5 Methodology used for sensitivity
1.3.5.1 General comments
Sensitivity analysis (SA) of a model deals with the question of « how uncertainty in the output of a model (numerical or otherwise) can be apportioned to different sources of uncertainty in the model input » (Salt-elli et al., 2004). Several objectives can be assigned to a model SA (Iooss, 2010 quoting Pappenberger et al. 2010):
• Identifying and ranking most influent inputs;
• Finding insensitive inputs to held them constant;
• Mapping model output behavior depending on input values with a focus on specify areas if necessary;
• Calibrating model variables depending on available information (real data, constraints).
SA has long been based on methods considered as local because they focused on output variation generated by small variation of inputs around a nominal value (Iooss, 2010). With such approaches, only a partial area of the whole input values domain can be studied and interactions among inputs are ignored. To overcome such limitations, methods considered as global have been developed since the 80’s. These methods are of two types, either qualitative or quantitative.
Qualitative (or screening) methods enable a fast model behavior exploration by varying a large number of inputs (from n=10 to 100). These deterministic methods are based on the discretization of input varia-bles in different levels. A first set of methods comes from the field of experimental plans (high dimensional screening with for instance hyper-saturated plans or sequential bifurcations method, see Ioos 2010 for more details). The idea is to carry out fewer calculations than the number of inputs. Such methods work only for models without input interactions, monotone and with relatively few influential inputs compared to the to-tal number of inputs. A second set of methods is based on Monte-Carlo approaches to create a sample of simulations. The most popular method is the Morris method also known as elementary effects method (Morris, 1991). This method is based on analyzing the mean and standard deviation of model outputs varia-tions associated to input variations. Simulations can also be used as visual display by producing multiple graphics for model output (Scatter Plots).
Quantitative methods enable to measure and rank the contribution of each model input to the output variance. These methods have a higher computational cost than qualitative methods, as sample size should be large enough to allow sensitivity index calculation. Quantitative methods are based on the decomposition of model output variance, depending on input variables. A first set of methods is based on a functional de-composition of the model (Brevault et al., 2013). This decomposition makes it possible to compute condi-tional variances for each input variable and for different levels of input interactions. A second set of methods is based on variance decomposition by experimental plans (design of experiments: DoE, Brevault et al., 2013). With an adequate design and factor levels definition, it is possible to estimate conditional variances as in the first set of methods.
Whatever the type of method, model assumptions (linearity, monotony, independence and interactions among factors) and computational cost are two major aspects to take into account for choosing a SA meth-od. Because of these two aspects, SA methods - both qualitative and quantitative- have generated a large range of adaptations in the literature. These adaptations rely on the way used to produce the simulation sample (e.g. LHS, Latin hypercube sampling, to estimate PRCC, partial rank correlation coefficients) and the way to handle model assumptions (handling interactions with the extended Morris method, see Campo-longo and Braddock, 1999).
European Commission — Contract : 30-CE-0609772/00-59 — Tallage Modelling feed consumption in the European Union: update and improvement of the Feed-Model (FeedMod)
Final Report – November, 13 2014 page 22 on 87
The recent developments in SA are based on coupling the previous methods to deal with complex models, with a large number of inputs. First, a qualitative SA is used to reduce input space and possibly build a meta-model or a surrogate model. Second, a quantitative SA is carried out on the simpler version of the model. Whatever the method used, the authors systematically highlighted the need to have a good understanding of model inputs, as well as relations and dependences of model elements.
1.3.5.2 Qualitative and quantitative methods
1.3.5.2.1 Qualitative methods
Scatter plots: this method relies on a visual display of correlation among input and output variables. It is based on Monte-Carlo (MC) technique to generate a simulation sample and assumes that input variables are independent. However, the 2-dimensions visualization can prevent from detecting multiple interactions (Saltelli et al., 2008).
Experimental plans: these methods are inspired from experimental design and a lot of versions exist depend-ing on the type of plan used (Iooss, 2010). They require a good understanding of the model (monotony in particular). Further, they assume no interaction between input variables as well as a limited number of influ-ent variables over the total number of inputs.
Morris method: this method relies on the repetition (5 to 10) of a randomized set of « one-factor-at-a-time » experiments (Iooss, 2010 ; Saltelli et al., 2008). This method enables to overcome the limitations of the “one- factor-at-a-time” by exploring different areas of input variables space. The output of this method is a ranking of the model input variables: insensitive; influential and linear; influential, nonlinear and/or with interactions. The method can account for 10 to 100 input variables. The computational cost is quite low compared to other quantitative methods (Iooss, 2010).
1.3.5.2.2 Quantitative methods
Variance decomposition: functional approach. Here, the model is considered as a function that trans-forms input variables into ouput variables. Decomposing this function into elementary functions enables the computation of conditional variances associated with input variables. These conditional variables represent the contribution of an input to the variance of the output (Saltelli et al., 2008; Iooss, 2010). The type of functional decomposition has given rise to different methods, the most widely used being Sobol and FAST. Whatever the type of decomposition, simulation sampling relies on Monte-Carlo methods. Functional ap-proaches offer several benefits: first, they don’t need assumptions on the model (linearity, monotony, inter-actions) except inputs independence; second, they provide indices easy to interpret and third they enable to quantify high order interactions among inputs. Yet, they have a high computational cost, largely higher than qualitative methods (e.g. 10000 runs for 14 and 16 inputs, see Wu et al., 2013). Fast is more efficient in terms of computational cost than Sobol but is less efficient regarding detection of interactions (Zhan et al., 2013).
Variance decomposition: design of experiments. Here, input variables are discrete. Computing the condi-tional variances depends on the type of plan and the levels of input variables (Brevault et al., 2013). Compu-tational cost is generally lower than for functional decomposition (in particular for latin-square or full facto-rial design). However, these methods imply the same assumptions on the model than classical experimental design.
Linear regression. Here, the model linearity enables to compute classical statistical measures: SRC (Stand-ardized Regression Coefficient), CC (Correlation Coefficient). For models with correlated inputs, other measures are used (PCC: partial correlation coefficient; PRCC: partial rank correlation coefficient). The dif-ferent variants of this approach consist in different sampling methods. Major inconvenient are the linearity assumption and the lack of results on inputs interactions.
Generally, the choice of a SA method and the specifications of its operation (input variation definition in particular) imply a good knowledge of the model structure, functioning and behavior.

European Commission — Contract : 30-CE-0609772/00-59 — Tallage Modelling feed consumption in the European Union: update and improvement of the Feed-Model (FeedMod)
Final Report – November, 13 2014 page 23 on 87
1.3.5.2.3 References
Brevault L., Balesdent M., Bérend N., Le Riche R., 2013. Comparison of different global sensitivity analysis meth-ods for aerospace vehicle optimal design. 10th World congress on Structural and MultidisciplinaryOptimization, Or-lando, Florida, USA, 19-24 May 2013.
Campolongo and Braddock, 1999. The use of graph theory in sensitivityanalysis of the model output: a new screen-ing method. Reliability engineering ans system design, 64, 1-12.
Iooss B., 2010. Revue sur l’analyse de sensibilité globale de modèles numériques. Journal de la Société Française de Sta-tistique
Saltelli A., Tarantola S., Campolongo F., Ratto M, 2004. Sensitivity Analysis in Practice: A Guide to Assessing Sci-entific Models, John Wiley & Sons publishers.
Saltelli A., Ratto M., Andres T., CampolongoF., Cariboni J., Gatelli D., SaisanaM., Tarantola S., 2008. Global SensitivityAnalysis: The Primer.Wiley Edition.
Wu J., Dhingra R., Gabhir M., Remais J.V., 2013. Sensitivity analysis of infectious disease models: methods, ad-vances and their application. Journal of Royal Society Interface, 10, 14pp.
Zhan C., Song X., Xia J., Tong C., 2013. An efficient integratedapproach for global sensitivity analysis of hydrologi-cal model parameters. Environmental Modelling and Software, 41, 39-52.

European Commission — Contract : 30-CE-0609772/00-59 — Tallage Modelling feed consumption in the European Union: update and improvement of the Feed-Model (FeedMod)
Final Report – November, 13 2014 page 24 on 87
2 Theme 1: Review and update the model parameters
The tonnage of raw materials used to produce industrial compound feeds remains calculated in FeedMod 2014 by the process known as 'formulation at lowest cost' in order to simulate the behavior of feed produc-ers. Formulation of a compound feed is a calculation of the quantity of each raw material used in the feed. The overall objective of this formulation is to mix raw materials of different nutritional composition in or-der to obtain a balanced feed with nutritional levels relatively close to that of the nutritional needs of the an-imal.
The incorporation of raw materials for a feed can change regularly according to an incorporation interval de-termined by a minimum and maximum (the incorporation limits). These changes are made according to raw materials availability and prices, while maintaining constant the nutritional levels of the feed. As part of the study, Tallage has updated the parameters that this method of formulation of industrial feed at the lowest price uses. They are listed below:
• The price of raw materials that is an issue, as the source of information is not continuous,
• The nutritional composition of raw materials used to generate formulas of industrial compound feeds of each of the 13 main Member States in the framework of the model,
• Nutritional levels of the formulas of industrial compound feeds indicating the nutritional needs of the animals for each of the main 13 Member States,
• Incorporation limits of each raw material of each industrial compound feeds for each of the 13 main Member States.
Some conversion coefficients used by the model (see paragraph 1.3.1.3) were also revised.
2.1.1 The nutritional composition of raw materials
The evolution between the nutritional composition of raw materials defined in 2009 for FeedMod (supplied by DG AGRI as of March 2014) and the present composition of the various reference tables quoted (Figure 2) was analyzed. In the FeedMod model, the nutritional composition data of raw materials is always ex-pressed according to the raw product.
For 8 of the 13 main MS, the nutritional composition of raw materials in relation to the new values of the nutritional reference tables have been updated. The following references were used for updating the nutri-tional compositions:
• Netherlands: CVB 2011 table for all species;
• Denmark: Videncenter tables for Svineproduktion of January 2014 and the book ‘The Basics of Pig Production’ edited by Landbrugsforlaget in 2010 for pigs, CVB tables 2011 for poultry and 2005 Dansk Kvaeg tables for ruminants;
• France: INRA tables 2004 for all species and also the Evapig tables of June 2013 for pigs;
• Spain: Fedna tables 2012 for all species;
• United Kingdom: Feeds Directory tables published by Doctor Ewing in 1997, various tables already used for FeedMod 2009 (ADAS NSRU, private tables) and INRA tables 2004;
European Commission — Contract : 30-CE-0609772/00-59 — Tallage Modelling feed consumption in the European Union: update and improvement of the Feed-Model (FeedMod)
Final Report – November, 13 2014 page 25 on 87
• Germany: DLG eV - Deutsche Landwirtschafts-Gesellschaft e.V. Tables – for all species;
• Belgium: CVB tables from 2011 for all species;
• Czech Republic: German DLG tables and private tables;
For the five other main Member States, Tallage kept the same grouping principle defined in FeedMod 2009 (see paragraph 1.3.1.1).
For all Member States, where there was no previous data given on raw materials, the information has been added where feasible and always on the basis of the recommendations of the reference tables, thus allowing the integration of raw materials into the model if needed. Despite this significant effort to develop the data-base, there are still a few Member States where nutritional composition of raw materials is empty due to lack of data. Those MS are: Germany (and associated countries), Denmark, Spain and the Czech Republic14.
2.1.2 Nutritional levels of the industrial compound feeds formulas
The nutritional reference tables shown in Figure 2 (page 11) contain both values of nutritional composition of raw materials and the nutritional needs of the animal. For each Member State, on the basis of Tallage’s ex-pertise, the choice of formulas of industrial compound feeds defined in FeedMod 2009 remains valid. For the main Member States, the nutritional levels of these formulas have been updated in relation to the new rec-ommendations of the nutritional reference tables.
1. For the Netherlands, CVB Booklet Feeding of ruminants of February 2008, CVB Booklet Feeding of poultry September 2009, CVB Booklet Feeding of pigs February 2008 are the reference tables used.
2. For Denmark, Videncenter for Svineproduktion January 2014 and the book ‘The Basics of Pig Pro-duction’ edited by Landbrugsforlaget in 2010 for pork, CVB Booklet Feeding of poultry September 2009 for poultry and Dansk Kvaeg 2005 for ruminants were the reference tables used.
3. For France, INRA 2004 for all species, the Céréopa model (Prospective feed), the opinion of experts in formulas of French service firms that Tallage consulted for the purpose of this study are the refer-ences used.
4. For Spain, Fedna April 2008 for poultry, 2006 for pigs, 2008 and 2009 for ruminants are the refer-ence tables used.
5. For the United Kingdom, the various tables (ADAS NSRU, private tables) FeedMod2009 are the references used.
6. Germany, DLG - Deutsche Landwirtschafts-Gesellschaft e.V. - are the reference tables used- for all species.
7. For Belgium, CVB Booklet Feeding of ruminants February 2008, CVB Booklet Feeding of poultry September 2009, CVB Booklet Feeding of pigs February 2008 are the reference tables used.
8. For the Czech Republic, the private tables taken from FeedMod2009 are the references used.
9. In the case of Ireland, the French tables for ruminant and poultry feeds were kept as a reference. Ac-cording to Tallage’s expertise, the incorporation principle of FeedMod 2009 could be considered as
14 When using FeedMod users must be ensured that their raw material has got a nutritional composition. To help them a test will be carried out automatically before each optimization and will inform them of the absence of composition data (per state and raw material) when a price is given for the optimization period chosen

European Commission — Contract : 30-CE-0609772/00-59 — Tallage Modelling feed consumption in the European Union: update and improvement of the Feed-Model (FeedMod)
Final Report – November, 13 2014 page 26 on 87
valid. However, for the formulas of pig feeds, Tallage has revised the nutritional needs on the back of the study done by Dublin University and published on the site Grain and Feed Association15. This fairly recent study includes data from 2011 indicating that the protein levels of Irish feeds for pigs are high (much higher than those given in France and that were used as the starting point for the Feed-Mod 2009). In fact, Tallage has integrated new protein levels to the model, that are very similar to those of the United Kingdom. Based on Tallage’s expertise, linking the energy levels of Irish pig for-mulas to that of British pig formulas is justified.
10. The update of nutritional reference levels for Italy is identical to French reference levels for the feeds of all species. Based on Tallage’s expertise, the grouping principle in FeedMod 2009 is kept.
11. References for updates of species Hungarian nutritional levels are the same as those of Germany for feeds for all species (tables DLG - Deutsche Landwirtschafts-Gesellschaft e.V. -) except for ducks. The references for updating nutritional levels for Hungarian ducks are identical to France’s. Tallage has kept the incorporation principle of FeedMod 2009.
12. The references for updating Polish nutritional levels are the same as German references for all species (tables DLG - Deutsche Landwirtschafts-Gesellschaft e.V. -). The incorporation principle of Feed-Mod 2009 is maintained.
13. The references for updating Romanian nutritional levels are identical to German references for feeds for all species (tables DLG - Deutsche Landwirtschafts-Gesellschaft e.V. -). The incorporation prin-ciple of FeedMod 2009 is maintained.
For this step, Tallage has calculated the number of changes made since FeedMod 2009. 2560 data have been changed in order to improve the precision of the model’s results.
2.1.3 The incorporation limit of raw materials in the composition of industrial com-pound feeds
Still using the same principle of linking the Member states of FeedMod 2009, Tallage updated all the incor-poration limitations of the model on the basis of local experts’ opinion, bibliographic elements and Tallage’s expertise. These are most certainly the most arguable parameters of the model due to the fact that big differ-ences in practice exist within a Member State for any one species at the same physiological phase. Further-more, these data consist of strategic information that feed producers are not inclined to share. These incor-poration restrictions have been given to reflect best practices in the use of raw materials. They then needed modification during the calibration phase of the model, stricter constraints at this point harms the optimiza-tion of calibration (see theme 4 calibration of the model).
2.1.4 Conversion coefficients used by the industrial model
2.1.4.1 Conversion coefficients C2
Tallage partook in verifying the conversion coefficients C2 in relation to its information sources that were 'fixed' during the study in 2009. Tallage updated the necessary information when had official data that was sufficiently precise 16.
15 Feeding Low Protein diets to pigs, John O’Doherty, disponible à l’adresse http://www.igfa.ie/docs/doc_pages/docs_feed_forum_low-protein-diets-for-pigs.html
16 To update the other conversion coefficients the user will need to calculate with the specific buttons of the keypad “3. Prelimi-nary calculations” or directly on the keypad “4.Optimization” during the optimization with the button “Preliminary calculations

European Commission — Contract : 30-CE-0609772/00-59 — Tallage Modelling feed consumption in the European Union: update and improvement of the Feed-Model (FeedMod)
Final Report – November, 13 2014 page 27 on 87
After analysis, the following modifications were done:
Split in feed consumption in the pig animal group for those in an inferior physiological phase: piglets, pigs for fattening and sows.
For Ireland, latest data from FEFAC (average 2010-2012) was used.
For Italy, latest data from Assalzoo (average 2009-2012) was used.
Split in feed consumption for the poultry animal group specifically chickens, turkeys and ducks.
For Belgium, latest data from FEFAC (average 2008-2012) was used. Tallage has put the coefficient C2 to zero (previously 1) that existed for ducks, as there is no duck composition for Belgium in the model.
With Denmark, latest data from FEFAC (average 2008-2012) was used.
For France, Tallage used monthly data from SNIA-COOP de France (average 2008-2014).
For Germany, monthly data from BLE (average 2010-2012) was used.
With Ireland, Tallage went off the latest data from FEFAC (average 2010-2012). The C2 coefficient is at ze-ro; this signifies that there is no duck feed consumption planned in Ireland. The composition for duck feeds planned for this production will therefore not be used.
For Italy also Tallage used the latest FEFAC data (average 2011-2012).
For the Netherlands Tallage has put the coefficient C2 to zero (previously 2) that existed for ducks as there is no duck formula for the Netherlands in the model.
For Austria, Cyprus, Malta, Greece and Slovenia the new data is copied off Italy. Tallage kept the incorpora-tion principle defined in FeedMod 2009.
Luxemburg’s new data is copied off Belgium. Tallage kept the incorporation principle defined in FeedMod 2009.
2.1.4.2 Conversion coefficients C4
Tallage partook in a global revision of the conversion coefficients C4.
The C4 conversions are only different by 100 for the Member States that are differentiated by virtual facto-ries.
France is divided into 5 virtual factories. An average of the regional statistics of SNIA for the years 2011 to 2012 were used for updating the C4 coefficients by species.
Germany is divided into 4 virtual factories. Tallage used the regional statistics of BLE dating from September 2011 when updating the C4 coefficients by species. In German official statistics produced by BLE, there are now only three regions instead of 4 during the study Feedmod 2009. The regions previously divided into South East and South West have been grouped to form one region: the South. The regrouping concerns the virtual factories of DE-Munich/DE-Frankfurt. The virtual factory DE-Frankfurt represented less than 5% of German industrial compound feeds in the FeedMod 2009 model. In the FeedMod 2014 structure, the four virtual factories of the model are kept assuming that the distribution between south west and south east has
and optimization”. The calculation is not automatic as it is quite long and its automation before each optimization (or each time new data is added) would slow the procedure quite considerably.

European Commission — Contract : 30-CE-0609772/00-59 — Tallage Modelling feed consumption in the European Union: update and improvement of the Feed-Model (FeedMod)
Final Report – November, 13 2014 page 28 on 87
not changed over the past 5 years. This is in order to avoid potential problems in the incorporation of facto-ries.
Spain is divided into 4 virtual factories. The average of regional statistics from the CESFAC from the years 2010 to 2011 were used to update the C4 coefficients by species.
The United Kingdom is shared into 2 virtual factories. The average of the regional statistics from DEFRA from the years 2009 to 2013 were used to update the C4 coefficients by species.
Italy is divided into 4 virtual factories. The average of regional statistics of ISTAT from the years 2010 to 2012 were used to update the C4 coefficients by species.
2.1.4.3 C5 conversion coefficients
The update of C5 coefficients concerns ruminants only as it is the only production where a production cycle by quarter is clearly identified. For the other species, C5 coefficient remains equal to 25% for each period and each State.
2.1.4.3.1 The situation of feeds for dairy cows
The opinion of the experts on this subject shows that there are two categories of MS concerning the season-ality of production for dairy cow feeds by quarter. There are those where letting the dairy cows out to graze spring and summer pastures marks a drop in the consumption of industrial compound feeds. This is for States that have many pastures such as Ireland, United Kingdom and France. Therefore these States will have a C5 coefficient that varies from one quarter to the next. On the other hand, there are all the other Member States where the production of industrial compound feeds is constant all year long. Hence the C5 coeffi-cients will be stable over the quarters (always around 25%).
C5 conversion coefficients were calculated for France, Great Britain, Northern Ireland and Germany thanks to the official statistics of feed production. The sources of information are the same of those used in the C4 conversion coefficient. Results found for Ireland and Northern Ireland were combinated. The values ob-tained confirmed the opinions of the experts consulted.
As the dairy yield is considered as a good indicator for production of compound feeds for dairy cows, the monthly data curves (source Eurostat) were also analyzed in order to validate the new values calculated for the C5 coefficients. Hence on the graphs presented below Figure 8, shows as an example the different seasons of dairy production between Italy and Ireland.

European Commission — Contract : 30-CE-0609772/00-59 — Tallage Modelling feed consumption in the European Union: update and improvement of the Feed-Model (FeedMod)
Final Report – November, 13 2014 page 29 on 87
600,0$
700,0$
800,0$
900,0$
1000,0$
a$ m$ j$ j$ a$ s$ o$ n$ d$ j$ f$ m$
Milk%produ
c,on
%in%kt%
Months%%
Italian%milk%collec,on%
2012/13$ 2011/12$ 2013/14$
300,0$
400,0$
500,0$
600,0$
a$ m$ j$ j$ a$ s$ o$ n$ d$ j$ f$ m$
Milk%produ
c,on
%in%kt%
Months%%
Spanish%milk%collec,on%
2012/13$ 2011/12$ 2013/14$
1500,0$
1600,0$
1700,0$
1800,0$
1900,0$
2000,0$
2100,0$
2200,0$
2300,0$
2400,0$
a$ m$ j$ j$ a$ s$ o$ n$ d$ j$ f$ m$
Milk%produ
c,on
%in%kt%
Months%
French%milk%collec,on%
2012/13$ 2011/12$ 2013/14$
50,0$
150,0$
250,0$
350,0$
450,0$
550,0$
650,0$
750,0$
850,0$
a$ m$ j$ j$ a$ s$ o$ n$ d$ j$ f$ m$
Milk%produ
c,on
%in%kt%
Months%
Irish%milk%collec,on%
2011/12$ 2012/13$ 2013/14$
Figure 8: Example of seasonality of dairy production
2.1.4.3.2 The situation for cow-calf operations
The opinion of the experts on this subject shows that there are two categories of MS concerning the season-ality of production for cow-calf feeds by quarter. There are those where letting the cows out to graze spring and summer pastures marks a drop in the consumption of industrial compound feeds. This is a specialty for Ireland, United Kingdom and France. This means that these States will have C5 coefficients that will vary from one quarter to the next. For the rest of the Member States, the production of compound feeds being constant over the year, C5 coefficients remains stable over the quarters (more or less equal to 25%).
C5 conversion coefficients have been calculated for France, Great Britain, Northern Ireland and Germany thanks to the official statistics of feed production. The information sources are the same to those used for the C4 conversion coefficients. Based on Tallage’s expertise, the Irish and Northern Irish results were grouped. The results confirm the opinions given by the experts.

European Commission — Contract : 30-CE-0609772/00-59 — Tallage Modelling feed consumption in the European Union: update and improvement of the Feed-Model (FeedMod)
Final Report – November, 13 2014 page 30 on 87
2.1.5 The price of raw materials
2.1.5.1 Replacing discontinued series Q
uota
tion
Stud
ied
quot
atio
n(in
blu
e=
sele
cted
)
Num
ber o
f stu
died
val
ues
The
oriti
cal r
coef
ficie
nt(a
=0,
01)
calc
ulat
ed r
r2 Aver
age g
ap
a b Erro
r typ
e
Obs
erva
tions
Feed pea / NL / cif source BINternet
Feed pea / NL / cif source V&V 24 0,515 0,989 0,978 2,575 Source: Intern
Beet pulp / départ Marne 8mm
Beet pulp / départ Marne 6mm 14 0,661 0,996 0,992 0,952 3,889 1,213 Source : La Dépêche Petit Meunier
Breadmaking common wheat - Napoli
Breadmaking common wheat - Bologna 38 0,449 0,958 0,917 19,685 0,946 32,686 14,003 Source: Intern
Breadmaking common wheat - Roma 38 0,449 0,935 0,874 23,541
Breadmaking common wheat - Torino 38 0,449 0,798 0,637 26,109
Breadmaking common wheat - Barcelona 38 0,449 0,922 0,849 16,076
Citrus pulp Ex-store Liverpool Citrus pulp Départ Belgique 23 0,515 0,970 0,940 0,729 17,143 9,089 Source: "UK Feed Ingredients " published by
the HGCA
Corngluten Pellet départ Belgique 5 0,959 0,919 0,845 0,943 6,917 3,757
The coefficient of correlation is not significant for a threshold of risk of 0,01, but it becomes it for a threshold of 0,05
Corngluten Pellets dép Montoir
Corngluten Pellet départ Belgique 5 a=0,05
0,878 0,919 0,845 0,943 6,917 3,757The coefficient of correlation is not significant for a threshold of risk of 0,01, but it becomes it for a threshold of 0,05
Feed barley - Hannover 44 0,393 0,955 0,913 4,156Feed barley - Kobenhavn Feed barley - Dresden 44 0,393 0,972 0,945 1,014 0,939 13,048 10,178 Source: Intern
Feed barley - Antwerpen 44 0,393 0,939 0,883 15,350Feed barley - Dresden 32 0,449 0,979 0,959 9,965Feed barley - München 32 0,449 0,985 0,970 6,784
Feed barley - Köln Feed barley - Hannover 32 0,449 0,987 0,974 6,344 0,940 14,364 6,508 Source: InternFeed barley - Antwerpen 32 0,449 0,972 0,945 5,167Feed barley - Nederland 32 0,449 0,970 0,941 9,583
Feed barley - La Pallice Feed barley - Eure-et-Loir 36 0,449 0,990 0,980 7,419 1,006 6,561 6,359 Source: InternFeed barley - London 36 0,449 0,975 0,952 5,738Feed barley - Roma 32 0,449 0,962 0,925 14,165Feed barley - Milano 32 0,449 0,943 0,889 2,762
Feed barley - Napoli (Italy) Feed barley - Bologna 32 0,449 0,980 0,961 1,361 0,870 26,262 7,733 Source: InternFeed barley - Lerida 32 0,449 0,928 0,861 11,124Feed barley - Burgos 32 0,449 0,915 0,837 19,192Feed barley - Albacete 32 0,449 0,928 0,860 18,511
Feed maize - Bayonne Feed maize - Bordeaux 34 0,449 0,989 0,979 4,643 1,015 -1,988 6,487 Source: InternFeed maize - Rhin 34 0,449 0,977 0,954 8,723Feed maize - La Pallice 34 0,449 0,982 0,964 4,962Feed maize - Bordeaux 33 0,449 0,984 0,968 4,434Feed maize - Rhin 33 0,449 0,976 0,953 8,775
Feed maize - Sud-Ouest (France) Feed maize - La Pallice 33 0,449 0,993 0,987 4,743 1,008 -0,515 4,828 Source: Intern
Feed oats - London (Royaume-Uni) Feed oats - Lidkoping 22 0,537 0,828 0,685 14,914 0,319 66,991 8,826 Source: Intern
Feed oats - Zachodni 32 0,449 0,672 0,451 14,308Feed wheat - Dresden 42 0,393 0,950 0,903 6,007
Feed wheat - Kobenhavn Feed wheat - Hannover 42 0,393 0,964 0,930 10,722 0,941 3,179 12,255 Source: InternFeed wheat - München 42 0,393 0,952 0,906 10,062Feed wheat - Antwerpen 42 0,393 0,953 0,908 19,940
Field peas Delivered East Coast Feed pea / Fob Creil 44 0,978 0,956 1,966 0,860 28,674 11,029 Source: Intern
Feed pea / départ E & Loir 44 0,976Feed pea / NL / cif 44 0,948
Maize Départ région lyonnaise Mais Départ Saône-et-Loire 20 0,561 0,998 0,997 0,463 0,968 4,860 2,487 Source : La Dépêche Petit Meunier
Molasses (beet) Molasses (cane) 20 0,561 0,648 0,420 1,900 -136,353 15,990 Source : La Dépêche Petit MeunierSoya pellets, 44/45% Argentine, cif Rotterdam
Soya pellets, 48%, Brazilian, cif Rotterdam 44 0,393 0,989 0,979 1,377 1,153 -44,169 14,353 Source: Intern
Soybeans, Argentina, cif Rotterdam
Soybeans, Brazilian, cif Rotterdam 37 0,449 0,983 0,966 0,810 0,992 1,594 15,743 Source: Intern
Figure 9: Summary of quotations selected to replace the discontinued quotations

European Commission — Contract : 30-CE-0609772/00-59 — Tallage Modelling feed consumption in the European Union: update and improvement of the Feed-Model (FeedMod)
Final Report – November, 13 2014 page 31 on 87
Tallage estimates the prices of cereals that are not listed from a series of known prices (see methodology part 1.3.1.4.). The table Figure 9 summarizes the quotations selected to replace discontinued quotations since 2009. Concerning molasses, DG AGRI asked to study the possibility of using quotations from Binternet in-stead of usual quotations. The series of prices given for this comparison show a gap between the two series from -1.78 to +2.64 €/t concretely a difference of 4.42 €/t in total. Analyzing the elasticity of the incorpora-tion of raw materials in relation to the prices of molasses indicate that there is no changes in the rate of in-corporation for a gap in prices ranging from -5/t to +5€/t. Binternet can therefore be used as source for the quotations of molasses without any changes in the tables of parity.
Amino Acids (lysine, threonine, methionine and tryptophan) and minerals (dicalcic phosphate and calcium carbonate), CEREOPA put itself foreword committed to providing DG AGRI with quarterly prices. Any-how - to simplify the use of the model for users - Tallage studied the possibility of replacing the quarterly prices by one price for the year: to what extent this substitution could influence the incorporation of the raw materials in animal feeds? To answer this question, the variations in price each year calculating the mini-mum, maximum, median and distance (minimum and maximum) were analyzed. For each amino acid and mineral, the year in which the total variation was the strongest was selected. For that year, the minimum and maximum values that could be caused by incorporating raw materials into animal feeds were simulated, cf Figure 10.
Yearréférence* Commodities
deviation [minimum -
médian]
deviation [maximum -
médian] impact on commodities
2009 lysin -75 725
no impact on the range -30 à 500 (65 % of the values)little impact (<1,5 %) on the range -75 to -30 and 500 to 725(1)
2006 threonine -250 1750 no impact in the considered range2012 tryptophan -1750 25850 no impact in the considered range2008 methionine -1850 400 no impact in the considered range
2011 Caco3 -44 10aucun impact pour une plage -35 à 10 (98 % des valeurs)impact réduit (<1 %) pour la plage -44 à -35(2)
2013 dicalcium phosphate -10 30 no impact in the considered range*Selected year is one with the largest absolute change.
Figure 10: Impact of the annual variations on amino acid and mineral quotations
The maximum impact consists of a progression of 1.5% of meal incorporation at the expense of cereals for a median gap inferior to -30% and an increase of cereals inferior to 1% at the expense of meals and by-products, for a gap superior of 500.
The maximum impact consists of an increase of 1% of the incorporation of maize at the expense of rape meal for a gap on average inferior to -35.
As a conclusion, it is possible to replace the quarterly prices by an annual price. This does not provoke any re-al changes concerning the incorporation of raw materials in animal feeds. These annual prices will be sup-plied by CEREOPA 17
17 on demand at the following email address: [email protected]
European Commission — Contract : 30-CE-0609772/00-59 — Tallage Modelling feed consumption in the European Union: update and improvement of the Feed-Model (FeedMod)
Final Report – November, 13 2014 page 32 on 87
3 Theme 2: Integration of new feed materials used in the indus-trial compound feed
3.1.1 Inventory of possible new raw materials
Tallage has made an inventory of raw materials, which could have nutritional interest for the model - with compositions quite different to those already available - that are not already used in FeedMod 2009. Amid this inventory, Tallage has particularly studied the nutritional compositions of some cereal by-products (wheat, barley and rice) largely used in compound feeds. These raw materials have a highly varied chemical composition and couldn’t be precisely described in order to be integrated into the model. Hence, these cereal by-products were taken out of the model as they would not give anymore precision.
3.1.2 High Pro Sunflower meal
For a few years now the consumption of high-protein sun meal is gaining more and more importance in Eu-rope especially in France. According to Cerepoa's conclusions18, two thirds of sunflower meal used by French animal feed producers in 2012 were high-protein, compared to one third in 2006. Today, Tallage estimates French animal consumption of sunflower meal at 1.4 Mt. This represents 0.9 Mt of high-protein sun meal consumed in France today by the animal feed industry.
This protein rich meal comes mainly from Eastern Europe notably Bulgaria, Romania, Ukraine and Russia. According to Tallage's data Russian and Ukrainian sunflower production could more or less have doubled in 6 years to 9.7 Mt and 10.4 Mt respectively for 2013/14. These two countries should represent 90% of global trade for high-protein sun meal. In France since 2013 the site Saipol in Bassens (Gironde) has procured a new husking tool that allows them at the end to have an annual production capacity of 0.5 Mt of high-protein sunflower meal.
The process to obtain high-protein meal consists of husking the grains before crushing to extract a part of the husk. Therefore the high-protein meal is complementary with the two other qualities of sun meal that Tal-lage has in the model: the meal called “strawy” coming from grains that contain around 28% of proteins and partially husked sunflower meal that has a protein value at 33%.
The percentage of protein expressed in raw form varies in the model from 35% in France to 38,4% in Great Britain, which makes it an ideal ally in the composition of animal feeds at the expense of soya. It is for this reason that despite its variable nutritional composition Tallage decided to include it in FeedMod 2014 in addition to the other sun meals.
The parameters of this new raw material have been incorporated into the model using the nutritional com-position reference tables for each of the 13 main Member States and detailed in the same way as for raw ma-terials already present in the model. The limits of incorporation of high-protein sunflower meal per Member State are identical to those of the two other sunflower meals. The price source for this new raw material is Oilworld, textual part, under the name: Sunmeal, HiPro,a.o.,cif France.
3.1.3 Processed animal proteins (poultry or pig)
These raw materials were withdrawn from animal feeds for all species in 2001 due to the risk of contamina-tion by bovine spongiform encephalopathy (BSE). After their reintroduction in June 2013 for fish farm feeds, their use in the case of monogastric feeds could be re-authorized under certain conditions (under 18 Reference La Dépêche- Le petit meunier- December, 3 2013

European Commission — Contract : 30-CE-0609772/00-59 — Tallage Modelling feed consumption in the European Union: update and improvement of the Feed-Model (FeedMod)
Final Report – November, 13 2014 page 33 on 87
traced production of the 3rd category i.e. adapted to human consumption, no cannibalism, strict separation of production chains and enforcement of a method for the detection ruminant proteins). Tallage suggested to include this raw material as they are important sources of phosphorus, calcium but also good quality proteins that would greatly reduce dependence on imported vegetal proteins. Lastly, they give value to animal bi-products from pigs and poultry.
The parameters of this new raw material have been incorporated into the model using the nutritional com-position reference tables (as it was mainly used in the past) for each of the 13 main Member States and de-tailed in the same way as for raw materials already present in the model. However, to avoid any accidental in-clusion, their incorporation is not possible but the model is ready to use these materials, should they be au-thorized in formulas again.
3.1.4 Urea
This is an additive that is only used for ruminants, in particular in the compositions of dairy cow feeds with a high-protein percentage (nitric correctors). Urea is non proteinic nitrogen, used by the bacteria of rumen. Its incorporation rate is relatively low but according to Tallage’s expertise, it would represent a substantial saving in terms of soya meal consumption in this type of composition, that is why it would be interesting to include it in the model.
As for the other raw materials, the parameters for urea have been incorporated into the model using the nu-tritional composition reference tables for each of the 13 main Member States. Prices will be supplied by CEREOPA on an annual basis, as is the case for amino acids and minerals.

European Commission — Contract : 30-CE-0609772/00-59 — Tallage Modelling feed consumption in the European Union: update and improvement of the Feed-Model (FeedMod)
Final Report – November, 13 2014 page 34 on 87
4 Theme 3: Integration of Croatia into the model
4.1 Analysis of Croatia's animal production systems
In 2010, according to Eurostat, Croatia had 233 280 farms. Croatia is characterized by lots of small farms, the average being 2.4 ha, and a few big entities held by big agribusiness groups. The majority of family owned farms are extremely fragmented, with their cultivated area divided into different plots often far away from each other.
Cereals are the main agricultural production in Croatia with 65% of the total arable surface. Croatia is self-sufficient in wheat and maize.
In the animal production sector, small farms are predominant for cattle, pigs, sheep, goats and horses. On the other hand, poultry production (meat and eggs) is characterized by big production units.
Regarding the production of compound feeds, poultry feeds represent 47% of compound feed production (estimated to be around 600 kt on average between 2008 and 2011 or 0.4% of the EU 28) ahead of pig feeds (36%) and cattle feeds (16%).
4.1.1 Cattle production
Cattle livestock in 2010 was mostly on farms of less than 10 ha (74%); and 48% of farms had less than 5 BCU (big cattle unit). In 2012, dairy herds had 181 000 dairy cows or 40% of cattle herds (compared to 61% in 2000). 51 % of dairy livestock is found in herds of 20 to 50 BCU.
Total milk collection was of 573 kt in 2012/13 for a quota of 765 kt (or 0.5 % of the European quota), this represents 87 % of milk production. On a national level, the yield per dairy cow reached 3 650 kg in 2012. It has increased greatly between 2000 and 2012 (+58%).
Beef production reached 47 kt in 2012 (0.6 % of the EU28's production); it has gone down 15 % since 2000. It represents 24% of total meat production.
The production of compound feeds for cattle was compared to Croatian cattle. The ratio obtained was 0.222 on average between 2007 and 2012.
4.1.2 Poultry production
Poultry production is made up of large production units. These farms use hybrid stock and modern produc-tion technology, but they are however confronted with problems of animal welfare.
Poultry meat production stood at 61 kt in 2012, down 28 % since 2000. (0.5 % of the EU28's production); the consumption per person was 22 kg/year in 2008. Chicken represents 87 % of poultry meats.
For poultry meat the ratio poultry meat feeds/production of poultry meat is at 2.55 in 2012.
Laying hens represented 43 % of all poultry flocks in 2012. Egg production remains globally stable compared to 2000 at 49 kt (0.8 % of the EU 28's production). Consumption was 11 kg/per person in 2011.

European Commission — Contract : 30-CE-0609772/00-59 — Tallage Modelling feed consumption in the European Union: update and improvement of the Feed-Model (FeedMod)
Final Report – November, 13 2014 page 35 on 87
For laying birds, the production of compound feeds for laying birds was compared to egg production. The ratio stood at 2.44 in 2012.
4.1.3 Pig production
Pigs were estimated at 1.18 million in 2012 of which 100 000 are breeding sows (8 % of total droves) and 727 000 piglets (61 %).
88 % of pig farms have less than 10 ha and 61 % of stock is concentrated in farms of less than 20 BCU. 24% is on farms of 500 BCU or more.
Croatian pork production was estimated at 75 kt in 2012 (compared to 64 kt in 2000) for a consumption per capita of 26 kt (compared to 19kg/capita in 2000).
The ration pig feeds/total livestock was estimated at 233 in 2012 compared to 195 on average between 2007-12. The ratio pig feeds/pork production was estimated at 3.06 in 2012 (2.96 on average between 2007-12).
4.1.4 Linking Croatia to several virtual factories
In line with the methodology laid out in section 1.3.2 of this report, Tallage selected a certain number of po-tentially suitable virtual factories to be linked to Croatia:
• factory of Turin (Italy)
• factory of Bologna (Italy)
• factory of Rome (Italy)
• factory of Naples (Italy)
• factory of Budapest (Hungary)
• factory of Prague (Czech Republic)
• factory of Călăraşi (Romania)
Croatia North)West North)East Center South Hungary Czech)rep. RomaniaFactory)location Turin Bologna Roma Naples Budapest Prague Calarasi
Cattle)sector %)of)dairy)cattle)in)total)cattle)herd 45% 19% 33% 26% 30% 36% 28% 57%milk)yield)(kg/cattle) 3445 6049 5301 4642 3987 6756 6887 1)806Compound)feed)cattle/cattle)herd 0,222 0,465 0,751 0,55 0,406 0,747 0,356 0,063
Pig)sector %)pig)for)fat)in)total)pig)herd 59% 79% 73% 87% 68% 66% 61% 76%meat)production/total)pig)herd 66 83 179 287 251 130 157 81Compound)feed)pig/pig)herd 195 702 328 221 177 467 482 269
Poultry)sector %)layer)hens)in)total)poultry)herd 43% 27% 26% 26% 25% 27% 33% 51%meat)production/total)poultry)herd 7,2 4,2 6,5 6,2 7,6 8,7 7,2 3,8Compound)feed)poultry/total)poultry)herd 28 36 33 34 35 39 38 20
Italy
Figure 11: Linking Croatian compound feed production to existing virtual factories
For this comparison, the following links were proposed:

European Commission — Contract : 30-CE-0609772/00-59 — Tallage Modelling feed consumption in the European Union: update and improvement of the Feed-Model (FeedMod)
Final Report – November, 13 2014 page 36 on 87
Cattle feeds => linked to the factory of Naples (Southern Italy): even though the percentage of dairy cows in cattle is lower in Southern Italy, the dairy yield is close to that of Croatia's. The feeding method differs slightly from that of the Naples factory (the ratio bovine CF /cattle livestock is at 0.406 compared to 0.222 in Croatia). For this ratio, Croatia is closer to the Prague factory (ratio 0.356), but dairy production is con-siderably higher in the Czech Republic (6887 kg/milk/cow/year). The best compromise was therefore to keep the Naples factory.
Pig feeds => linked to the factory of Călăraşi (Romania): The ratio of fattening pigs for the total of Croa-tian pig herd (59 %) is close to that of the Naples factory (68 %), Budapest 66%) and Prague (61 %). Regard-ing the ratio meat production/total herd the only suitable factory is Călăraşi (ratio of 81 compared to 66 for Croatia). Finally, the ratio compound feeds/pig herd is close to that of Călăraşi factory (at 269 compared to 195 for Croatia). The Călăraşi factory is therefore best suited to Croatia.
Poultry feeds => linked to the Prague factory (Czech Republic): the ratio laying hen flocks/total herd in Croatia (43 %) is between that of Prague (33 %) and that of Călăraşi (51 %). The production ratio between poultry meat/total herd in Croatia is the same as the factory in Prague (7.2). Finally, the ratio poultry com-pound feeds/total poultry herd is similar to those of the factories in Italy, Budapest and Prague. Over the three ratios, it is the factory in Prague that corresponds best for the linking of poultry feeds.
The production of compound feeds for each species will be added to that of the virtual factory of the main State (or area).
European Commission — Contract : 30-CE-0609772/00-59 — Tallage Modelling feed consumption in the European Union: update and improvement of the Feed-Model (FeedMod)
Final Report – November, 13 2014 page 37 on 87
5 Theme 4: Improvement of the model for on-farm feed
5.1 Analysis of factors affecting feeding on the farm
5.1.1 Factors that affect feeding on the farm
Like animal feed manufacturers, farmers must follow feed regulations and specifications, make sure that they have the appropriate supply of feed materials at the lowest cost, and that these feed materials meet livestock requirements. However, farmers and manufactures often do not have the same concerns, which may explain certain strategic choices in terms of supplies and some characteristics of the feed sector on the farm.
Presented below are the elements affecting this type of feeding. This is based on the expertise of Tallage that has been analyzing the raw materials market (and therefore feeding on the farm) for more than 20 years, studies on the subject and the opinions of experts.
Feeding on the farm can come in two forms: complete and partial. Partial feeding on farm is made up of a mix of simple cereals (often produced on the farm), proteinic raw materials (mostly soybean) and minerals. This is the most frequently encountered scenario.
The term of complete farm feeding is only used when farmers have a manufacturing unit for feeds on the farm.
It is very difficult to quantify the share between partial and complete feeding on farms for each Member State, as no study is available on the subject. Only a detailed study at farm level would allow to evaluate this proportion, but this is not the objective of the current study.
5.1.1.1 Motivations
For the farmer there are several reasons to produce feed on the farm:
• A desire for independence and autonomy
• A profitable investment
• Stability in the composition of the feed and better performance
• A better use of cereals
• A desire to link animal production to the land
• A desire to manage the feeding and the manufacturing procedure
• Consumer reassurance
• Better flexibility for niche markets
These motivations voiced by farmers for the manufacturing of feeds on the farm are a clear clue for the choice of raw materials as well as the supply routes.

European Commission — Contract : 30-CE-0609772/00-59 — Tallage Modelling feed consumption in the European Union: update and improvement of the Feed-Model (FeedMod)
Final Report – November, 13 2014 page 38 on 87
In particular, these farmers are concerned by the technical-economic performance of their livestock and would like where possible to create a link with the land and therefore look to acquire a double expertise. In parallel with their competence in the running of livestock farming, these farmers are looking to develop a high level of expertise in plant production in order to manage their raw material supply.
There are several difficulties in acquiring this knowledge:
• Limited available work time for crops, especially at certain times of year
• Useful farm space can sometimes be limited
• Occasionally, the necessity for rapid technical training and the assistance of competent people-resources
5.1.1.2 Raws materials used
In this context, ensuring supplies in raw materials is essential in the eyes of feed manufacturing farmers. Of-ten, this happens via a relatively simple, regular, but nonetheless technically efficient supply and a very lim-ited number of raw materials. Farmers are looking for maximum self-sufficiency in order to reduce their feed-ing costs, as the cheapest raw materials are those produced on the farm. When self-sufficiency is not possible supplies can come from neighbors and storage agencies.
Unlike manufacturers of industrial compound feeds; farmers rarely make opportunistic choices of raw mate-rials in terms of feeding. Given that their storage capacity is necessarily limited and the desire to optimize ca-pacity, the choice of raw materials is based on a restricted number of known products, but also products available all year long. Above all, farmers are looking to use as best as possible the cereals produced and stored on the farm in order to reduce the cost of feeds. Depending on the geographical location of the farm, the ce-reals used are different. Also, the variability of yields year upon year affects the level of self-sufficiency. Final-ly, when cereals harvested are insufficient, some farmers choose to go back to using compound feeds bought via a manufacturer until the next harvest.
All other raw materials will depend on the cereal incorporation level chosen. Consequently, this simplicity and wish to prioritize cereals means formulas are not always optimized to their full potential. Farmers who manufacture their feed are indeed willing to pay slightly over the economic optimum to ensure the regularity of feeds for the animals. Farmers’ reasoning is more on the overall competitiveness of the farm, where feed is a factor among others, rather than the optimization of the feed itself.
In addition, still with the aim of optimizing, storage and transport, but also to limit the amount of raw mate-rials, farmers tend to turn towards either product used in sufficient quantities in the feeds, or used in many formulas (sows, meat pigs etc.). Buying raw materials in big enough batches allows them to order by 25 ton-trucks, and then to allocate a permanent storage cell for this raw material over the year. Finally, the non-opportunistic nature of farmers in terms of feeds means that moving to a new raw material only happens if the economic interest is sufficiently beneficial and long term.
The composition of on-farm feeds therefore differs from that of industrial compound feeds. Many farmers that manufacture on the farm criticizes the continually changing nature of the composition of industrial feeds, which, according to them, leads to changes in the animals behavior and difficulties to manage the live-stock.
Beside cereals produced or not on the farm, the number one protein raw material on the farms is soybean meal, despite many farmers questioning their dependency on the product. There are alternative solutions, at least for the partial substitution of soybean meal. Mainly large outfits tend to resort more easily to alternative raw materials such as rapeseed meal and/or sunflower meal as well as by-products due to larger storage capac-ity, but mostly due to a higher consumption than more modest size farms.

European Commission — Contract : 30-CE-0609772/00-59 — Tallage Modelling feed consumption in the European Union: update and improvement of the Feed-Model (FeedMod)
Final Report – November, 13 2014 page 39 on 87
All the same, the use of soybean meal is, for the vast majority of farmers, a habit that is difficult to change. Soybean meal has managed to cement its place thanks to its nutritional qualities, but also the implementa-tion of performing supply strategies and sales.
5.1.2 Development of on-farm feed in the EU 28
The consumption figures are not official, as, in Europe as in most MS, statistics concerning this aggregate do not exist. These numbers are therefore supplied by supply and demand statements produced by Tallage.
Figure 12 shows the evolution of on farm feed consumption from the marketing year 2006/2007 for the EU 28 onwards (fodder excluded).
2037 90142 0,14289611voir/les/même/tendances/sur/alim/composés
voir/si/corrélation/avec/les/récoltes
voir/si/corrélation/avec/les/prix
MEALS100
90,3772864108,374254120,064411106,087018102,180272106,516327
0
20000
40000
60000
80000
100000
120000 kt
Campaign
OTHERS
MEALS
CEREALS
Figure 12: Evolution of on-farm feed consumption between 2006/2007 and 2012/2013
On the European Union level as a whole, Tallage observes that consumption peaks during the crop year 2009/10 and has dropped substantially since. However, Tallage expects on the basis of its expertise this to rise again for the crop year 2013/2014. It is interesting to compare the difference in evolution for each seg-ment (cereals and meal) then to bring it together with the level of harvests observed on one hand and on the other the total consumption of compound feeds.
5.1.2.1 Differentiated development between cereals and meals
Meal’s total share of consumption on the farm is 14 % on average (in volume) for the crop years 2006/2007 to 2012/2013. Their variability (between 90 and 120) is substantially lower than that of cereals (between 75 and 110) as is illustrated in Figure 13 (evolution since 2006/2007 on the basis that 100 = 2006): the stand-ard deviation, for these seven marketing years represents 9 % of the average value for meals, and 12 % for ce-reals.

European Commission — Contract : 30-CE-0609772/00-59 — Tallage Modelling feed consumption in the European Union: update and improvement of the Feed-Model (FeedMod)
Final Report – November, 13 2014 page 40 on 87
70
80
90
100
110
120
130 100 = 2006/07
Campaign
CEREALS
MEALS
Figure 13: Evolution of the share of cereals and meals in on-farm feeds for the UE
5.1.2.2 Share of on-farm feeds in total animal feed
The analysis of the proportion of on-farm feeds in total animal feeds reveals an aspect that is seen regularly by analysts interested in the agricultural raw material market. The correlation between industrial compound feeds and on-farm feeds is positive where a negative one would have been expected.
In other words, given that the needs of animals change very little from one year to the next, Tallage could have expected an industrial compound feeds drop compensated by higher on-farm feeds and vice versa, whereas Tallage sees the opposite where years with heavy consumption on the farm are equally good years for the consumption of industrial feeds.
Figure 14: Comparison of the progression of consumption of on-farm feeds and industrial compound feeds in the EU

European Commission — Contract : 30-CE-0609772/00-59 — Tallage Modelling feed consumption in the European Union: update and improvement of the Feed-Model (FeedMod)
Final Report – November, 13 2014 page 41 on 87
It looks as though the determining factor is not the need of the animal, but the quantity of raw materials available.
5.1.2.3 Connection with the level of production
To confirm or contradict this observation, it is beneficial to compare the level of cereal production with the actual consumption of these same cereals. Figure 15 shows that EU animal consumption on the farm is fairly clearly correlated to EU cereals production.
240
250
260
270
280
290
300
310
320
50
55
60
65
70
75
80
85
90 Mt Mt
campaign
on-farm consumption of cereals production
Figure 15: Comparison of cereal consumption on the farm with the harvest levels (Mt)
In this respect, it is worth noting that the standard deviation of animal cereal consumption is 15 Mt, whereas the standard deviation of cereal production, for the same period, is 20 Mt. Hence, even though we could as-sume that internal consumption is relatively stable, and that the main impact of inter-annual variations in production would be on exports, on the contrary Tallage can see that ¾ of variations are on average “ab-sorbed” by internal animal consumption.
5.1.3 Division per Member State
The main MS concerned by on-farm feeds are the same in 2012/2013 as in 2006/2007. In order of im-portance they are: Germany, France, Spain, Great Britain, Poland, Denmark, Italy and Finland.
The order is the same in 2012/13 as in 2006/07 apart from Poland which drops from 3rd place to 5th, and Spain, the only MS where consumption has gone up, and which on its own now represents over 13 % of the European total, against 10 % in 2006/07.

European Commission — Contract : 30-CE-0609772/00-59 — Tallage Modelling feed consumption in the European Union: update and improvement of the Feed-Model (FeedMod)
Final Report – November, 13 2014 page 42 on 87
Germany
France
Spain UK
Poland
Denmark
Italy
Others
2012/2013
Germany
France
Poland Spain
UK
Denmark
Italy
Others
2006/2007
Figure 16: Evolution of the distribution of on-farm feed consumption per MS
5.2 Estimate of fodder consumption by polygastric animals
One of the aspects of the study has consisted in replacing the set fodder calculation by a calculation that takes into account the variability of green fodder production.
To this end, based on its own experience, Tallage has analyzed the different categories of fodder and kept the two main sources: maize ensilage and pastures. The plants harvested when green have not been taken into ac-count (omissions and discrepancies in the data series, and surface areas that carry little weight in comparison to pastures). Forecasting work was carried out on production, using the statistics available, and reprocessing the data to get the most even series as possible for pastures as well as maize ensilage.
5.2.1 Pastures data base
The study conducted by JRC (PASK MARS-JRC: European pasture monograph and pasture knowledge base19) as well as the Eurostat database (surfaces, yields and production) were used as the main sources of in-formation in order to build a European pasture database. These statistics however have their limits: they are not always complete and sometimes have erroneous information. This is why national statistics for pastures, when available, were preferred. Where no statistics were available, Tallage resorted back to estimations based on its expertise.
The pasture database consists of one page per Member State and present data on area (thousand ha), produc-tion (thousand of tons expressed in dry matter) and yields (as production/surface in t/ha). Each page consists of the same headings:
• total pastures: represents the total surfaces, yields and production of permanent and non-permanent pastures,
19 http://mars.jrc.ec.europa.eu/mars/Projects/PASK

European Commission — Contract : 30-CE-0609772/00-59 — Tallage Modelling feed consumption in the European Union: update and improvement of the Feed-Model (FeedMod)
Final Report – November, 13 2014 page 43 on 87
o One heading permanent pastures, code Eurostat C0002, o One heading non-permanent pastures: representing the total surfaces, yields and productions
of temporary and artificial pastures, (C2680 + C 2670)
§ One heading temporary pastures, code Eurostat C2680,
§ One heading leguminous plants (artificial pastures), code Eurostat C2670: this totals the surfaces, yields and productions of sub categories clovers and blend, lucerne and other legume fodders.
The date chosen as the starting point for data archives was 1999, in order to be consistent with the Tallage's database for maize ensilage.
Tallage developed an incorporation system for MS where the data was too limited to get a direct 'total pas-tures' production result. Therefore, a MS for where information is missing is grouped on the basis of certain criteria (proportion of temporary pasture surface, yields of temporary pastures and the yield ratio permanent pastures/temporary pastures) with another Member State with similar results. The official statistics for mod-el MS (Denmark, Poland, France and Germany) are rarely subject to estimation. As a general rule, attached States are geographically close.
5.2.2 Database for maize silage
Tallage used EUROSTAT data available on the Internet site Eurostat (under the item “green maize” code C2625) to create the database for maize silage. The analysis of this database allowed to observe that for France and Ireland, the silage yields are expressed in tons of dry matter per hectare whereas for all other MS the yield given is expressed in ton of green matter at 32 % (roughly) of dry matter (in other words the yield of the field). For the consistency of data, and with the goal to then translate these maize silage productions into a feed value (expressed in % of dry matter), Tallage converted the yields into tons of dry matter by hectare for all MS (France and Ireland apart) by multiplying production by average content of dry matter (32 %).
Given that surface areas and production of maize for biogas are included in the production of maize silage supplied by Eurostat, Tallage subtracted the areas of production dedicated to biogas were subtracted and on-ly the areas for maize silage production dedicated to animal feed were kept. To this end, Tallage used its own database for production surfaces of maize silage for biogas in the context of its monitoring of surfaces and production of large crop in the EU.
5.3 Recalculation of on-farm feed on the basis of fodder production bal-ance sheets
5.3.1 Calculation of total consumed “balance sheet basis” and comparison with needs
5.3.1.1 Calculation and distribution of on-farm feed consumption
The total quantities of on-farm feed are calculated from the supply and demand balance sheets supplied by Tallage (cereals and meals).
The reprocessing of this data is necessary. Indeed, the analysis of the balance sheets of raw materials shows that the production statistics of industrial compound feeds published by FEFAC do not include the totality of the feeds produced because of missing data (for example there is no data for Greece, Luxembourg, Croa-

European Commission — Contract : 30-CE-0609772/00-59 — Tallage Modelling feed consumption in the European Union: update and improvement of the Feed-Model (FeedMod)
Final Report – November, 13 2014 page 44 on 87
tia). Also, in certain Member States, the distinction between industrial compound feeds and on-farm feeds is not possible, and Tallage’s balance sheets group this consumption under the entry “industrial compound feeds”. As a result, the total of raw materials consumed in industrial compound feeds, traced following the balance sheets, exceeds the quantities of industrial compound feeds produced (FEFAC data).
Yet the estimation of industrial feed consumption in FeedMod is based on these statistics.
Thus, just as a reprocessing of the data “industrial compound feeds” of balance sheets in the calibration stage was necessary, equally reprocessing needs to be done for on-farm feeds.
For each MS and each marketing year, the following relation is considered:
OFF =OFF(bil)+[ICF(bil)− ICF( fefac)]
with:
OFF = on farm-feeds
ICF = industrial compound feeds
…(bil) = base “Tallage’s balance sheets”
…(fefac) = FEFAC statistics database for compound feed production
0"
20"
40"
60"
80"
100"
120"
S&D"Tallage" FeedMod"
On"farm"compound"feed"
Industrial"compound"feed"
Figure 17: Reprocessing of farm feeds total
5.3.1.2 Distribution of fodder consumption between different sections
After having calculated (paragraph 5.2) the production of green fodder, it is necessary to consider two hy-potheses to get an estimate of the amount of energy supplied by green fodder in animal needs.

European Commission — Contract : 30-CE-0609772/00-59 — Tallage Modelling feed consumption in the European Union: update and improvement of the Feed-Model (FeedMod)
Final Report – November, 13 2014 page 45 on 87
The first hypothesis is that estimated production corresponds to the consumption of the marketing year. This would assume that green fodder harvests are consumed from the 1st of July to the 30th June the follow-ing year.
A second hypothesis is necessary to divide the fodder estimated between dairy and non-dairy herds. Based on its expertise, Tallage assumes that there is a fixed ratio between the average volume consumed by a dairy cow and the average volume consumed by a beef cattle, this for each type of fodder. Hence, the tonnage con-sumed by the section “non-dairy livestock” can be estimated using the equation:
with:
T = total tonnage of fodder
Tv = tonnage of fodder dedicated to non-dairy livestock
C = ratio [average consumption by dairy animal / average consumption by non-dairy animals]
Nv = non-dairy livestock
Nl = dairy livestock
In these calculations, the ratio (“C”) is considered to be equal to 3 for maize silage and 1 for pastures.
Tallage obtained the energy needs for the herds covered by fodder by applying to the results obtained an av-erage energy valorization, calculated in UFL for the dairy herd and in UFV for the non-dairy herd.
5.3.1.3 Analysis of the coverage of needs following this method
Once these breakdown ratios have been calculated, Tallage ends up with a figure for each herd section for each category of feed (ICF, FCF and fodders). Tallage can then compare the results obtained with total needs and analyze the coverage rates identified.
Analysis of the results shows that the notion of “energy needs” as the basis for the calculation of consump-tion obscures a sizeable variation in “needs”.
The main reason for this imbalance, between theoretical energy needs of herds and the quantity of energy in-gested, is due to farms adapting to the price of raw materials (and their availability) and more generally the profitability of the animal production is considered.
In cases where profitability is low, the animals are slaughtered younger (pig), egg production spaced out (poultry), or the dairy yields revised down. The opposite is true if the context is favorable, dairy production can be maximized, as can the weight of the animals being fattened and the rhythm of egg production acceler-ated.
Figure 18 shows that the theoretical global energy supply (Industrial compound feed + on-farm compound feed + roughages) is higher than herd need. This figure shows need coverage by total feed (in %) ; red histo-gram represents the maximum values of this coverage on the studied marketing years, and blue one the min-imum.
Tv = Nv*T / [C *Nl + Nv]
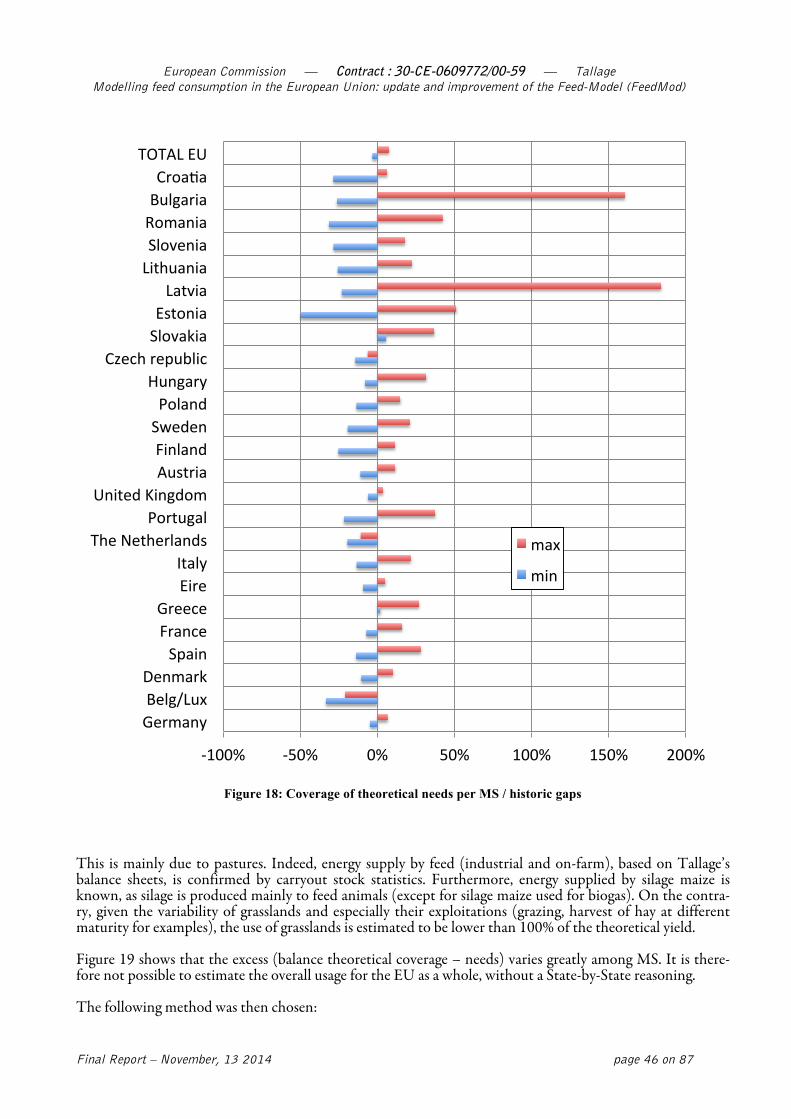
European Commission — Contract : 30-CE-0609772/00-59 — Tallage Modelling feed consumption in the European Union: update and improvement of the Feed-Model (FeedMod)
Final Report – November, 13 2014 page 46 on 87
!100%% !50%% 0%% 50%% 100%% 150%% 200%%
Germany%Belg/Lux%Denmark%
Spain%France%Greece%
Eire%Italy%
The%Netherlands%Portugal%
United%Kingdom%Austria%Finland%Sweden%Poland%
Hungary%Czech%republic%
Slovakia%Estonia%Latvia%
Lithuania%Slovenia%Romania%Bulgaria%CroaQa%
TOTAL%EU%
max%
min%
Figure 18: Coverage of theoretical needs per MS / historic gaps
This is mainly due to pastures. Indeed, energy supply by feed (industrial and on-farm), based on Tallage’s balance sheets, is confirmed by carryout stock statistics. Furthermore, energy supplied by silage maize is known, as silage is produced mainly to feed animals (except for silage maize used for biogas). On the contra-ry, given the variability of grasslands and especially their exploitations (grazing, harvest of hay at different maturity for examples), the use of grasslands is estimated to be lower than 100% of the theoretical yield.
Figure 19 shows that the excess (balance theoretical coverage – needs) varies greatly among MS. It is there-fore not possible to estimate the overall usage for the EU as a whole, without a State-by-State reasoning.
The following method was then chosen:

European Commission — Contract : 30-CE-0609772/00-59 — Tallage Modelling feed consumption in the European Union: update and improvement of the Feed-Model (FeedMod)
Final Report – November, 13 2014 page 47 on 87
For each MS and each segment group (dairy herd and non dairy herd), the excess of the theoretical average supply (from 2003/04 to 2012/13) was calculated, excluding atypical values. This average excess was then removed from the gross energy supply; to give an energy supply called “corrected”. The ratio {corrected sup-ply / net supply} is the real rate of energy given by pastures (see Figure 19).
dairy&cattle other&cattleGermany 76% 87%Belg/Lux 100% 100%Denmark 75% 68%Spain 39% 42%France 81% 89%Greece 39% 47%Eire 100% 96%Italy 55% 61%The&Netherlands 100% 100%Portugal 69% 46%United&Kingdom 53% 47%Austria 100% 92%Finland 44% 30%Sweden 42% 35%Poland 64% 61%Hungary 10% 8%Czech&republic 100% 100%Slovakia 22% 47%Estonia 39% 24%Latvia 35% 26%Lithuania 31% 25%Slovenia 61% 54%Cyprus 100% 100%Malta 100% 100%Romania 42% 53%Bulgaria 32% 33%Croatia 59% 55% Figure 19: Real use rate of energy supply from pastures
These calculations are used to produce the Figure 20.

European Commission — Contract : 30-CE-0609772/00-59 — Tallage Modelling feed consumption in the European Union: update and improvement of the Feed-Model (FeedMod)
Final Report – November, 13 2014 page 48 on 87
!100%% !50%% 0%% 50%% 100%% 150%% 200%% 250%% 300%% 350%%
Germany%Belg/Lux%Denmark%
Spain%France%Greece%
Eire%Italy%
The%Netherlands%Portugal%
United%Kingdom%Austria%Finland%Sweden%Poland%
Hungary%Czech%republic%
Slovakia%Estonia%Latvia%
Lithuania%Slovenia%Romania%Bulgaria%CroaRa%
TOTAL%EU%
max%
min%
Figure 20: Corrected cover of energy needs
5.3.1.4 Suggestion to change the method of calculation
Instead of calculating the volume of on-farm feeds as a balance on the basis of theoretical need, and then dis-tributing this difference between raw materials, Tallage suggested calculating supply by on-farm feed inde-pendently from need (whether it be for fodder components or for on-farm compound), and thereafter to ad-just it according to nutritional needs (a complete change in logic). A new method of calculation is needed.
5.3.2 Fixing markers of needs on historical basis
On a European level, the coverage of energy needs by total feed (fodders included) moves from -3 % to +8 % compared with the needs calculated (cf. Figure 23).
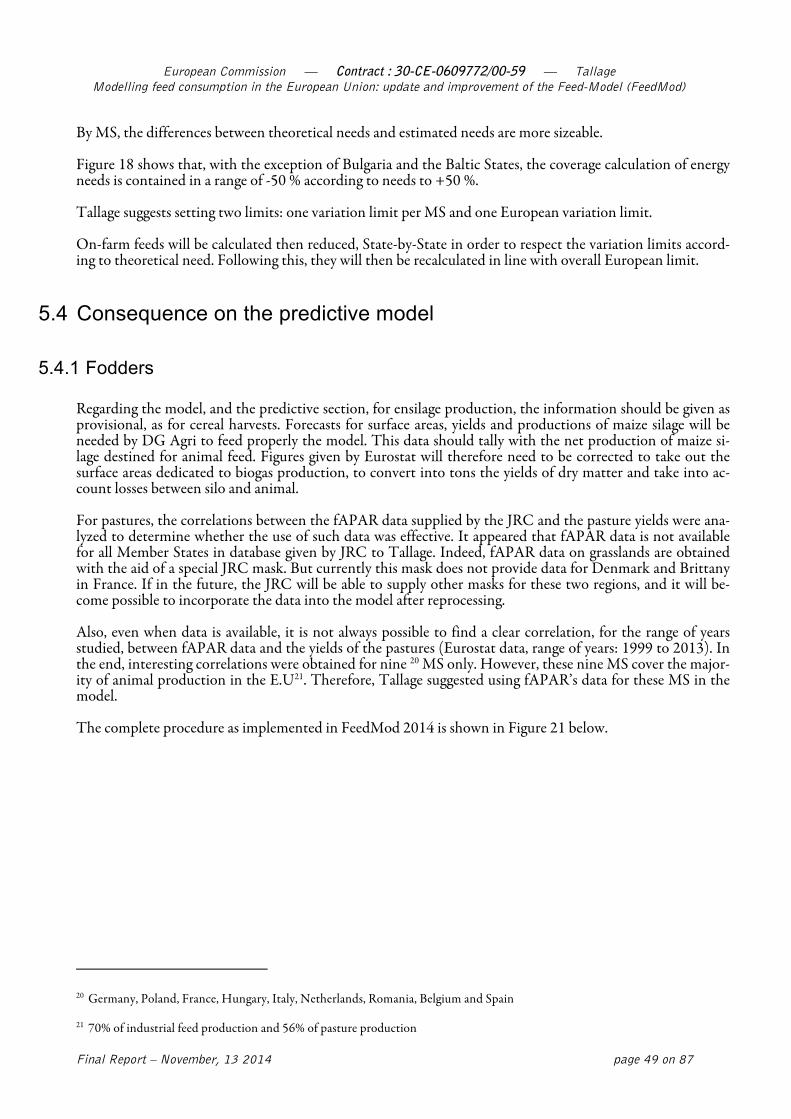
European Commission — Contract : 30-CE-0609772/00-59 — Tallage Modelling feed consumption in the European Union: update and improvement of the Feed-Model (FeedMod)
Final Report – November, 13 2014 page 49 on 87
By MS, the differences between theoretical needs and estimated needs are more sizeable.
Figure 18 shows that, with the exception of Bulgaria and the Baltic States, the coverage calculation of energy needs is contained in a range of -50 % according to needs to +50 %.
Tallage suggests setting two limits: one variation limit per MS and one European variation limit.
On-farm feeds will be calculated then reduced, State-by-State in order to respect the variation limits accord-ing to theoretical need. Following this, they will then be recalculated in line with overall European limit.
5.4 Consequence on the predictive model
5.4.1 Fodders
Regarding the model, and the predictive section, for ensilage production, the information should be given as provisional, as for cereal harvests. Forecasts for surface areas, yields and productions of maize silage will be needed by DG Agri to feed properly the model. This data should tally with the net production of maize si-lage destined for animal feed. Figures given by Eurostat will therefore need to be corrected to take out the surface areas dedicated to biogas production, to convert into tons the yields of dry matter and take into ac-count losses between silo and animal.
For pastures, the correlations between the fAPAR data supplied by the JRC and the pasture yields were ana-lyzed to determine whether the use of such data was effective. It appeared that fAPAR data is not available for all Member States in database given by JRC to Tallage. Indeed, fAPAR data on grasslands are obtained with the aid of a special JRC mask. But currently this mask does not provide data for Denmark and Brittany in France. If in the future, the JRC will be able to supply other masks for these two regions, and it will be-come possible to incorporate the data into the model after reprocessing.
Also, even when data is available, it is not always possible to find a clear correlation, for the range of years studied, between fAPAR data and the yields of the pastures (Eurostat data, range of years: 1999 to 2013). In the end, interesting correlations were obtained for nine 20 MS only. However, these nine MS cover the major-ity of animal production in the E.U21. Therefore, Tallage suggested using fAPAR’s data for these MS in the model.
The complete procedure as implemented in FeedMod 2014 is shown in Figure 21 below.
20 Germany, Poland, France, Hungary, Italy, Netherlands, Romania, Belgium and Spain
21 70% of industrial feed production and 56% of pasture production

European Commission — Contract : 30-CE-0609772/00-59 — Tallage Modelling feed consumption in the European Union: update and improvement of the Feed-Model (FeedMod)
Final Report – November, 13 2014 page 50 on 87
Figure 21: Calculation of forage energy supply for dairy and beef cattle
5.4.2 On-farm feeds (non-fodder component)
The compositions of on-farm compound feeds do not follow the same rules as those of industrial compound feeds. The on-farm feed comes in part or totally from raw materials produced on the farm. Its composition is therefore more or less strongly linked to the levels of local availabilities of different crops. It differs from in-dustrial compound feeds due to a more limited number of raw materials used, and its composition is not called into question as often. The change in composition is then less closely linked to the price of raw materi-als. Therefore, the use of models based on the optimization of rations through the minimization of their cost is only an approach suitable for industrial compound feeds and not applicable for farm made feeds, due to the difference in reasoning.
5.4.2.1 Calculation of distribution parameters between raw materials (new table C7)
Tallage keeps the postulates of FeedMod 2009:
• The on-farm feeds can be considered as a blend of cereals and meals (soya, rapeseed and sunflower meals) and by-products (from cereals).
• The proportion of each cereal in a on-farm compound feeds is dependent on different parameters, of which two are fundamental: the level of the harvest, and the proportion of each cereal in the industrial compound feed

European Commission — Contract : 30-CE-0609772/00-59 — Tallage Modelling feed consumption in the European Union: update and improvement of the Feed-Model (FeedMod)
Final Report – November, 13 2014 page 51 on 87
• The proportion of each meal (and each by-product) is proportional to the amount of this particular meal in the compound feeds, given that, except on a minor scale, the oil meal is bought and not produced on the farm.
Other (determining) factors could have been chosen, (for example the level of internal European trade, the level of exports, stocks etc.). But the aim being a forward-looking use of the model, it is important that the determining factors can equally be estimated to supply the model in the future.
A table of parameters (Feed material group) was created which indicates the correlation between detailed raw materials (used by the element “compound feeds” of FeedMod) and the grouped raw materials (used by the section “on-farm feeds” and for general results).
For example, the raw material group “soy bean meal” regroups the following detailed raw materials: “soy bean meal 44”, “soybean meal 48” and “soybean meal 50”.
The above hypothesis (predominance of factors “production” and “share of raw material in compound feeds”) leads to the hypothesis that there is, for each Member State and each cereal, three coefficients A, B and C such as:
VF(i) = A+B*VI(i)+C *R(i)
with:
(i): raw material
VF: consumed volume of raw material in on-farm feeds
VI: consumed volume of raw material in industrial feeds
R: harvested volume of raw material
5.4.2.2 Limits of results obtained (exceeding / under achievement)
Figure 23 shows the variations on a European level (EU28). Over the period studied, (2004/05 to 2012/13) the maximum excess is of 8 % whereas the maximum under achievement is 3 %.
So, Tallage suggests fixing as markers -20 % and +10 % by default (see Figure 22). These markers will be ac-cessible in a table of parameters, allowing them to be modified in the future.

European Commission — Contract : 30-CE-0609772/00-59 — Tallage Modelling feed consumption in the European Union: update and improvement of the Feed-Model (FeedMod)
Final Report – November, 13 2014 page 52 on 87
Mod
ellin
g fe
ed c
onsu
mpt
ion
in th
e E
urop
ean
Uni
on: u
pdat
e an
d im
prov
emen
t cf
the
Feed
-Mod
el (F
eedM
od)
Con
tract
No.
30-
CE
-060
9772
/00-
59
Total energy requirements
-20%
Industrial feed
On-farm feed Forage
Industrial feed
On-farm feed Forage
Industrial feed On-farm feed Forage
Feed energy supply
Industrial feed On-farm feed Forage
+10%
On-farm feed removed after adjustment On-farm feed added after adjustment
1
2
3
4
1. Energy supply is within bounds: no adjustment necessary 2. Energy supply over 110%: part of on-farm feed are removed 3. Energy supply of industrial feed and forage over 110%: all on-farm feed are removed 4. Energy supply below 80%: on-farm feed are added
Figure 22: Adjustment to energy requirements

European Commission — Contract : 30-CE-0609772/00-59 — Tallage Modelling feed consumption in the European Union: update and improvement of the Feed-Model (FeedMod)
Final Report – November, 13 2014 page 53 on 87
EU 2004/2005 2005/2006 2006/2007 2007/2008 2008/2009 2009/2010 2010/2011 2011/2012 2012/2013Dairy3cattle3feed
Need 2003928 1993145 1973732 1973054 1973783 1953316 1963166 1973301 1953613Industrial3CF3supply 413788 413556 423418 433923 413686 403996 423173 423696 433834
Farm3CF3supply 283597 323359 323194 293882 323623 323213 303659 283754 263667Fodder&supply&(gross) 217&900 210&842 195&870 205&252 213&929 193&924 194&770 198&405 204&337Fodder3supply3(net) 1433440 1333165 1183478 1323367 1403498 1203287 1173961 1213557 1273763
Total 2133826 2073080 1933090 2063172 2143807 1933495 1903793 1933007 1983265Balance 12#897 7#935 )4#643 9#118 17#023 )1#820 )5#373 )4#294 2#651
6% 4% )2% 5% 9% )1% )3% )2% 1%Other3cattle3feed
Need 3773410 3763906 3753688 3773320 3823184 3793220 3753508 3703553 3683419Industrial3CF3supply 233647 233643 233263 233064 213433 213117 213499 213781 223413
Farm3CF3supply 533717 623724 643470 653474 693699 683290 643831 583564 573851Fodder&supply&(gross) 449&357 438&404 419&123 474&804 492&946 424&769 422&634 422&399 451&554Fodder3supply3(net) 2973698 2813737 2623744 3213937 3393949 2703867 2663384 2663107 2953566
Total 3753061 3683103 3503477 4103475 4313080 3603274 3523713 3463452 3753830Balance )2#348 )8#803 )25#210 33#155 48#895 )18#947 )22#795 )24#101 7#411
)1% )2% )7% 9% 13% )5% )6% )7% 2%Pig3feed
Need 2423580 2433493 2473708 2433960 2353487 2323733 2313323 2283129 2243565Industrial3CF3supply 1173933 1193066 1243919 1283062 1223801 1193779 1213114 1183805 1173983
Farm3CF3supply 1073269 1233131 1243769 1193887 1183809 1183141 1113971 1023814 983667Total 2253202 2423197 2493688 2473950 2413610 2373920 2333085 2213620 2163649
Balance )17#378 )1#296 1#980 3#990 6#123 5#186 1#762 )6#509 )7#916)7% )1% 1% 2% 3% 2% 1% )3% 0%
Poultry3feedNeed 1973581 1943141 1933769 1983584 2003164 2023464 2033949 2043342 2063938
Industrial3CF3supply 1423747 1403679 1413972 1473049 1463835 1493727 1523463 1523722 1533355Farm3CF3supply 523456 553086 533971 533589 573483 573715 553804 523709 513693
Total 1953203 1953765 1953943 2003638 2043318 2073442 2083267 2053431 2053047Balance )2#378 1#623 2#174 2#054 4#153 4#978 4#318 1#089 )1#890
)4% 3% 4% 3% 7% 8% 7% 2% 0%TotalNeed 130183498 130133685 130143898 130163919 130153620 130093733 130063945 130003325 9953535
Industrial3CF3supply 3263115 3243943 3323572 3423098 3323755 3313619 3373248 3363005 3373585Farm3CF3supply 2423039 2733300 2753404 2683833 2783613 2763359 2633265 2423842 2343877
Fodder3supply3(net) 4413138 4143902 3813222 4543304 4803446 3913154 3843345 3873664 4233330Total 130093292 130133145 9893198 130653235 130913815 9993131 9843857 9663510 9953791
Balance )9#207 )540 )25#699 48#316 76#195 )10#603 )22#088 )33#815 256)1% 0% )3% 5% 8% )1% )2% )3% 0%
Figure 23: Exceeding/under achievement versus total energy requirement by species and by crop year since 2004/05 (EU)
Figure 24 shows the same table, but for one MS (France) and not the EU total. It presents an indication of the price of feeds by crop year and also of the price of animal production. There is no clear correlation in this example between the price and the level of coverage for the animal’s theoretic needs.

European Commission — Contract : 30-CE-0609772/00-59 — Tallage Modelling feed consumption in the European Union: update and improvement of the Feed-Model (FeedMod)
Final Report – November, 13 2014 page 54 on 87
France 2004/2005 2005/2006 2006/2007 2007/2008 2008/2009 2009/2010 2010/2011 2011/2012 2012/2013
Dairy5cattle5feed
Need 315816 315356 315030 315526 315453 305882 315559 325186 315227
Industrial5CF5supply 45125 45256 45334 55247 45869 45578 45912 45797 45916
Farm5CF5supply 35812 55087 55491 45736 55154 55343 45969 45675 45496
Fodder&supply&(gross) 30&978 26&035 26&800 31&467 29&990 27&150 24&890 24&941 28&781Fodder5supply5(net) 255687 205744 215509 265175 245698 215859 195598 195649 235489
Total 335624 305086 315333 365159 345721 315779 295479 295121 325902
Balance 1"808 %1"270 303 4"633 3"269 898 %2"080 %3"065 1"6746% %4% 1% 15% 10% 3% %7% %10% 5%
Other5cattle5feed
Need 875789 875473 875587 885809 945135 925558 925085 905134 885885
Industrial5CF5supply 25558 35120 35354 35542 35211 35105 35366 35297 35313
Farm5CF5supply 75436 95859 105747 105902 125282 125269 115350 95814 105097
Fodder&supply&(gross) 93&887 78&189 84&010 104&721 100&406 87&764 81&340 76&367 93&804Fodder5supply5(net) 845008 685310 745131 945842 905527 775885 715461 665489 835925
Total 945002 815289 885233 1095285 1065019 935260 865177 795599 975335
Balance 6"213 %6"184 646 20"477 11"884 702 %5"908 %10"534 8"4507% %7% 1% 23% 13% 1% %6% %12% 10%
Pig5feed
Need 235875 235558 235130 235098 225833 225430 225055 215684 215493
Industrial5CF5supply 145959 145490 145306 145649 135842 135209 135081 125654 125290
Farm5CF5supply 65639 95444 105233 95981 105632 105994 105207 95053 95659
Total 215598 235935 245540 245630 245474 245203 235288 215707 215950
Balance %2"277 377 1"409 1"532 1"641 1"772 1"233 23 457%10% 2% 6% 7% 7% 8% 6% 0% 2%
Poultry5feed
Need 305642 295362 285554 285881 285257 275615 275536 275399 275889
Industrial5CF5supply 275444 265174 265038 265684 255814 255670 265131 265006 255829
Farm5CF5supply 25714 35784 35606 35355 35578 35076 25614 25543 35081
Total 305158 295958 295645 305039 295392 285746 285745 285549 285909
Balance %483 596 1"091 1"158 1"135 1"131 1"209 1"151 1"020%7% 9% 16% 17% 17% 18% 22% 22% 18%
Total
Need 1745122 1715749 1705301 1725313 1765677 1735485 1735235 1715402 1695494
Industrial5CF5supply 495087 485040 485033 505122 475736 465562 475490 465754 465349
Farm5CF5supply 205601 285174 305078 285974 315646 315683 295141 265084 275333
Fodder5supply5(net) 1095695 895054 955640 1215017 1155225 995743 915059 865138 1075414
Total 1795382 1655268 1735750 2005113 1945607 1775988 1675689 1585977 1815096
Balance 5"261 %6"481 3"449 27"800 17"929 4"503 %5"546 %12"425 11"6023% %4% 2% 16% 10% 3% %3% %7% 7%
Pig5meat 100 89 99 108 120
Milk5products 161 100 110 130 121 148
Cattle5meat 100 98 101 115 130
72 74 86 126 100 86 124 121 153
Animal5products5price5level5(base51005=52008/09)
Feed5products5price5level5(base51005=52008/09)
Figure 24: exceeding/under achievement versus total energy requirement by species and by crop year since 2004/05
(France)
Figure 25 shows how the deviations will be reduced between calculated tonnage and total tonnage. This re-duction will be done in two steps. A first reduction will be done per MS to eliminate results that are too far off the limits. A table of markers per MS (min/max) is available, with initial values of 50% and +50%, these values remaining customizable per MS for further changes. Secondly, the final set up will be done on a global level, with the global markers also customizable.
European Commission — Contract : 30-CE-0609772/00-59 — Tallage Modelling feed consumption in the European Union: update and improvement of the Feed-Model (FeedMod)
Final Report – November, 13 2014 page 55 on 87
crop%year%n%
crop%year%n+1%
crop%year%n+2%
crop%year%n+3%
crop%year%n+4%
crop%year%n+5%
theore2cal%requirement%
lower%limit%
higher%limit%
crude%es2mate%
adopted%es2mate%
Figure 25: Gross estimation / estimation kept
The complete process is described in the Figure 26 below.

European Commission — Contract : 30-CE-0609772/00-59 — Tallage Modelling feed consumption in the European Union: update and improvement of the Feed-Model (FeedMod)
Final Report – November, 13 2014 page 56 on 87
Figure 26: Complete calculation process for on-farm feed materials

European Commission — Contract : 30-CE-0609772/00-59 — Tallage Modelling feed consumption in the European Union: update and improvement of the Feed-Model (FeedMod)
Final Report – November, 13 2014 page 57 on 87
6 Theme 5: Model calibration
6.1 Preliminary work
6.1.1 Limitation of quarterly tonnages
When using the previous version, the DG AGRI chose to limit the quarterly tonnages for some feed materi-als as indicated in Figure 27 after it realized that FeedMod output gave too high. Since this solution worked, the same was implemented in FeedMod 2014.
Maize DDGS 320 up to 2012-Q2 and 340 later
Wheat DDGS 480 up to 2012-Q2 and 510 later
Maize gluten feed 875
Wheat milling by-products 3000 Figure 27: Quartely limitations for tonnages in 1000 t
6.1.2 Other preliminary changes
6.1.2.1 Price of Spanish wheat
Wheat prices in Spain were previously based on the “Feed Wheat Fob Black Sea” prices, but this resulted in inconsistencies. Spanish wheat prices are now based on “Feed wheat - London (United Kingdom)” (with the parities +24 +29 +37 +35).
6.1.2.2 Lower energy requirements in broilers and turkeys (France, Italy, Ireland)
After updating the energy values of feed ingredients, it appeared that broiler and turkey formulas in France, Italy and Ireland contained abnormally high contents of industrial lysine (>0.5%). In order to correct this, the energy requirements of broilers and turkeys in these countries were reduced by 5%, which actually re-flects the now widespread utilization of enzymes in poultry formulas (abnormal consumption of lysine indi-cates that the formula requires excessive energy, and the industrial lysine is then used for its energy rather than for its lysine).

European Commission — Contract : 30-CE-0609772/00-59 — Tallage Modelling feed consumption in the European Union: update and improvement of the Feed-Model (FeedMod)
Final Report – November, 13 2014 page 58 on 87
6.2 Calibration results
6.2.1 Belgium-Luxemburg
Pre-calibration FeedMod 2014 estimates were rather satisfactory, though the tonnages are low.
The only calibration done consisted in limiting wheat at 50% in pigs.
Calibration allowed a slight gain in precision for maize but did not reduce the underestimation for rapeseed and sunflower meal.
6.2.2 Czech Republic
Before calibration, FeedMod overestimated maize (+0.4 Mt).
The only change introduced consisted in limiting maize at 15% (without minima).
Calibration improved the precision for wheat, maize and soybean meal, with a slight loss of precision for bar-ley.
6.2.3 Denmark
Before calibration, FeedMod underestimated barley (average difference 0.7 Mt) while overestimating wheat (0.8 Mt) and to a lesser extent maize (0.3 Mt). FeedMod also underestimated oil meals.
The following changes were introduced:
• Wheat limited to 35%
• Maize limited to 15%
Calibration largely reduced the gaps for the 3 cereals but oil meals were still underestimated.
6.2.4 France
Before calibration, FeedMod overestimated maize (+1.9 Mt) and underestimated wheat (-0.7 Mt), rapeseed meal (-0.5 Mt), sunflower meal (-0.4 Mt) and occasionally soybean meal. Interannual variations in barley seemed amplified by the model. Triticale did not enter formulas (even though Tallage reported 0.3-0.7 Mt) because there is no price available for this raw material.
The following changes were introduced:
• Maize limited to 25% in pigs
• Wheat limited to 40% (necessary to compensate the increase in wheat consumption due to the de-crease in maize)
• Barley limited to 25%

European Commission — Contract : 30-CE-0609772/00-59 — Tallage Modelling feed consumption in the European Union: update and improvement of the Feed-Model (FeedMod)
Final Report – November, 13 2014 page 59 on 87
• Triticale: maxima set at ¼ of their original value
• Fish meal limited to 0.5%
• Lysine limited to 0.5%
Calibration improved the already good estimations for barley (average difference decreased from 0.5 to 0.4 Mt). Estimations for maize and wheat clearly improved, with the average difference decreasing from 1.9 to 0.3 Mt and from 0.7 to 0.3 Mt respectively. Oil meal estimation was little improved, as FeedMod 2014 still underestimated soybean, rapeseed and sunflower meal by 0.4-0.5 Mt.
6.2.5 Germany
Before calibration, FeedMod overestimated barley (+1.6 Mt), wheat (+0.7 Mt), sunflower meal (+0.6 Mt) and maize gluten feed (+0.7 Mt). It underestimated soybean meal (-1.6 Mt) and rapeseed meal (-0.8 Mt). Maize was correctly predicted. Triticale did not appear in German formulas (though Tallage reports 0.5-0.6 Mt) because there is no price available for this raw material.
The following changes were introduced:
• Barley limited to 25% except for pigs 15% max (without minima)
• Maize limited to 10% in pigs (without minima), to 20% in poultry (15% for laying hens) and to 15% en cattle (without minima)
• Wheat limited to 25% in pigs
• Triticale limited to 10%
• Sunflower meal limited to 2%
• Oats limited to 0.5%
• Maize gluten feed limited to 2%
Triticale was introduced using a parity calculated from the relation between the wheat and triticale price se-ries in Belgium (« Feed wheat - Antwerpen (Belgium) » and « Triticale - Brussel – Bruxelles »). The equa-tion (1.00 * wheat – 4.713) was applied to each German plant using for input the wheat price and parity used for this plant.
Calibration significantly reduced differences for the main cereals: the average difference decreased from 1.6 Mt to 0.3 Mt for barley and from 0.7 Mt to 0.4 Mt for wheat. Calibration also improved the estimations for soybean meal (from 1.6 to 0.9 Mt) and rapeseed meal (from 0.8 to 0.6 Mt) but underestimation remained important. Sunflower meal was correctly estimated (difference < 0.1 Mt).
6.2.6 Hungary
Before calibration, FeedMod overestimated barley and underestimated maize. Wheat and soybean were cor-rect.
The only change introduced consisted in limiting barley to 15%.
European Commission — Contract : 30-CE-0609772/00-59 — Tallage Modelling feed consumption in the European Union: update and improvement of the Feed-Model (FeedMod)
Final Report – November, 13 2014 page 60 on 87
Calibration solved the overestimation for barley but underestimation of maize persisted (0.3-0.4 Mt).
6.2.7 Ireland
Before calibration, FeedMod underestimated barley and maize and overestimated soybean meal (-0.7 Mt).
Calibration attempts did not improve these estimations. The differences between tonnages before and after calibration only come from the lowering of energy requirements in poultry.
6.2.8 Italy
Before calibration, FeedMod largely underestimated maize (average difference 1.7 Mt) while overestimating soybean meal (0.5 Mt).
The following changes were introduced:
• No maximum limit for maize and minimum 50% in pigs
• Wheat milling by-products limited to 10%
Calibration largely decreased the difference for maize (from 1.7 Mt to 0.3 Mt) but there was a slight loss of precision for barley and soybean meal, and a slight overestimation for sunflower meal.
6.2.9 Netherlands
Before calibration, FeedMod amplified the substitutions between cereals, particularly for barley. Wheat was underestimated (0.9 Mt) as well as soybean meal (0.6 Mt) and other oil meals, while maize was largely overes-timated (1.5 Mt).
The following changes were introduced:
• Wheat limited to 35%
• Maize limited to 18%
• Barley limited to 15%
• Triticale limited to 2%
Calibration decreased the amplitude of interannual variations for barley (average difference decreased from 0.6 to 0.1 Mt) and considerably decreased the difference for maize (from 1.5 to 0.2 Mt) and for wheat (from 0.9 to 0.2 Mt). However, underestimation persisted for oil meals.
6.2.10 Poland
Before calibration, FeedMod overestimated wheat (+0.9 Mt), soybean meal (+0.5 Mt) and rye (0.5 Mt). It underestimated wheat milling by-products (-0.8 Mt), oats (-0.6 Mt) and sunflower meal (-0.2 Mt).
The following changes were introduced:

European Commission — Contract : 30-CE-0609772/00-59 — Tallage Modelling feed consumption in the European Union: update and improvement of the Feed-Model (FeedMod)
Final Report – November, 13 2014 page 61 on 87
• Wheat limited to 25%
• Rye limited to 10%
• Limits for oats were copied from the more liberal ones used in the United Kingdom
Calibration mostly corrected wheat (average difference decreased from 0.9 to 0.3 Mt) and partly corrected oats (from 0.6 to 0.4 Mt) but did not affect other feed materials. Underestimation of wheat milling by-products remained important (0.8 Mt).
6.2.11 Romania
Before calibration, FeedMod largely underestimated maize (-1.6 Mt) and overestimated wheat (+1.0 Mt) and barley (+0.4 Mt).
The following changes were introduced:
• Wheat limited to 6%,
• Barley limited to 6%
• Sorghum limited to 3%
• No max limits for maize avec 50% min in pigs (Cf. Italy)
Calibration was able to reduce the differences for wheat and barley, but maize estimations were still too low. In fact, it seems impossible to reach the extremely high maize levels (70% of all diets) reported in Romania. It is probable that part of those “industrial” maize tonnages actually correspond to non-industrial feeds that do not use least-cost formulation.
6.2.12 Spain
Before calibration, FeedMod seemed to amplify the substitutions between cereals, with much too large in-creases or decreases in feed material consumption, notably for wheat and maize (overestimation of 3 Mt for maize in 2007-2008 and of 2.8 Mt for wheat in 2009-2010).
The following changes were introduced:
• Wheat limited to 20%
• Maize limited to 30%
• Barley limited to 30%
• Sorghum limited to 5%
Sorghum, which was initially absent from Spanish formulas (no price), was introduced with a parity calculat-ed from the relation « Feed maize - Bayonne (France) » and « Sorghum - Toulouse ». The equation (0.84 * maize + 2.04) was applied to Spanish plants using as input the maize price and parity for this plant.

European Commission — Contract : 30-CE-0609772/00-59 — Tallage Modelling feed consumption in the European Union: update and improvement of the Feed-Model (FeedMod)
Final Report – November, 13 2014 page 62 on 87
Calibration reduced efficiently the differences for cereals : the average difference for wheat and maize decreased from 0.7 Mt to 0.4 Mt and from 1.8 Mt to 0.4 Mt respectively. However, there was a slight loss of precision for soybean meal (the average difference increased from 0.2 to 0.3 Mt) with no improvement for other oil meals.
6.2.13 United Kingdom
Before calibration, FeedMod underestimated barley (-0.5 Mt), wheat (-0.9 Mt) and oil meals (-0.4 Mt for soja), and overestimated maize (1.1 Mt), oats (1 Mt) and wheat milling by-products (1.1 Mt).
The following changes were introduced:
• Maize limited to 5%
• Avoine limited to 5%
• Wheat : max limit up to 65% in poultry
Calibration improved the estimations for barley, maize, wheat and oats but decreased the precision for soy-bean meal without solving the overestimation of wheat milling by-products. An attempt to limit the inclu-sion of the latter material (< 15%) failed, as the model just moved the corresponding tonnages to barley.
6.2.14 EU-28
At EU-28 level, calibration largely reduced the average differences for barley, maize and wheat: the average difference for the EU-28 tonnages of the sum of the 3 cereals decreased from 5.5 Mt to 1.2 Mt. Triticale was also improved (from 1.8 Mt to 0.4 Mt). Soybean meal was improved too (from 1.8 to 1.2 Mt) but most of the difference comes from the 2008/09 marketing year, since the estimations for the other marketing year are correct. The average difference for sunflower meal slightly increased (from 0.8 to 1 Mt) but the last mar-keting years are correct.
Oats and wheat milling by-products are still overestimated (by 2.6 Mt and 1.4 Mt respectively) while rape-seed meal is underestimated by 2.4 Mt.
Figure 28 presents the calibration results for the main feed materials. In this table, the « Diff. » column shows the 6-marketing year average of absolute differences between reference data (Tallage) and after calibra-tion (1rst value) or before calibration FeedMod (2nd value).

European Commission — Contract : 30-CE-0609772/00-59 — Tallage Modelling feed consumption in the European Union: update and improvement of the Feed-Model (FeedMod)
Final Report – November, 13 2014 page 63 on 87
Barley EU-‐28 (Industrial) 2007-‐2008 2008-‐2009 2009-‐2010 2010-‐2011 2011-‐2012 2012-‐2013 Diff.
FeedMod after calibration 13771 17792 20604 18914 12033 16156 1716
Tallage 14365 16269 17373 18152 14717 14651
FeedMod before calibration 13925 18697 22907 23018 10309 16327 3225
% FeedMod after calibration 10% 13% 15% 14% 9% 12%
% Tallage 10% 12% 13% 13% 11% 11%
% FeedMod before calibration 10% 14% 17% 17% 7% 12%
Maize EU-‐28 (Industrial) 2007-‐2008 2008-‐2009 2009-‐2010 2010-‐2011 2011-‐2012 2012-‐2013 Diff.
FeedMod after calibration 29200 24449 21108 25413 28116 27896 1568
Tallage 28955 26056 24142 26388 27088 30413
FeedMod before calibration 35997 26037 19538 28543 31934 33981 3706
% FeedMod after calibration 21% 18% 15% 18% 20% 20%
% Tallage 21% 19% 18% 19% 20% 22%
% FeedMod before calibration 26% 19% 14% 21% 23% 25%
Wheat EU-‐28 (Industrial) 2007-‐2008 2008-‐2009 2009-‐2010 2010-‐2011 2011-‐2012 2012-‐2013 Diff.
FeedMod after calibration 26278 30730 30190 27238 31740 27659 727
Tallage 26609 31670 31525 27877 31498 28536
FeedMod before calibration 26281 34765 36290 27276 36631 26903 2592
% FeedMod after calibration 19% 22% 22% 20% 23% 20%
% Tallage 19% 23% 23% 20% 23% 21%
% FeedMod before calibration 19% 25% 27% 20% 27% 20%
Barley/Maize/Wheat EU-‐28 (Industrial) 2007-‐2008 2008-‐2009 2009-‐2010 2010-‐2011 2011-‐2012 2012-‐2013 Diff.
FeedMod after calibration 69249 72972 71901 71565 71888 71710 1167
Tallage 69929 73995 73041 72418 73302 73599
FeedMod before calibration 76203 79499 78734 78836 78874 77211 5512
% FeedMod after calibration 50% 53% 53% 52% 52% 52% 0.523
% Tallage 51% 54% 53% 53% 53% 54% 0.537
% FeedMod before calibration 55% 58% 58% 57% 57% 56% 0.563
Soybean meal EU-‐28 (Industrial) 2007-‐2008 2008-‐2009 2009-‐2010 2010-‐2011 2011-‐2012 2012-‐2013 Diff.
FeedMod after calibration 21410 16368 16860 19829 18349 17949 1238
Tallage 21931 19256 17665 18744 18590 16062
FeedMod before calibration 20544 15033 15814 19354 17087 17453 1828
% FeedMod after calibration 16% 12% 12% 14% 13% 13%
% Tallage 16% 14% 13% 14% 13% 12%
% FeedMod before calibration 15% 11% 12% 14% 12% 13%
Rapeseed meal EU-‐28 (Industrial) 2007-‐2008 2008-‐2009 2009-‐2010 2010-‐2011 2011-‐2012 2012-‐2013 Diff.
FeedMod after calibration 9172 10849 10241 8783 9490 6778 2417
Tallage 9972 11263 12394 11929 11857 12402
FeedMod before calibration 9141 10739 10256 8376 9280 6492 2589
% FeedMod after calibration 7% 8% 7% 6% 7% 5%
% Tallage 7% 8% 9% 9% 9% 9%
% FeedMod before calibration 7% 8% 8% 6% 7% 5%

European Commission — Contract : 30-CE-0609772/00-59 — Tallage Modelling feed consumption in the European Union: update and improvement of the Feed-Model (FeedMod)
Final Report – November, 13 2014 page 64 on 87
Sunflower meal EU-‐28 (Industrial) 2007-‐2008 2008-‐2009 2009-‐2010 2010-‐2011 2011-‐2012 2012-‐2013 Diff.
FeedMod after calibration 4139 6413 3941 4132 5034 5193 1073
Tallage 3165 4693 4736 4719 6170 6420
FeedMod before calibration 4468 7343 4234 4653 6209 5921 843
% FeedMod after calibration 3.0% 4.7% 2.9% 3.0% 3.6% 3.8%
% Tallage 2.3% 3.4% 3.5% 3.4% 4.5% 4.7%
% FeedMod before calibration 3.3% 5.3% 3.1% 3.4% 4.5% 4.3%
Wheat milling by-‐products EU-‐28 (Industrial) 2007-‐2008 2008-‐2009 2009-‐2010 2010-‐2011 2011-‐2012 2012-‐2013 Diff.
FeedMod after calibration 10668 12000 12000 11815 12000 12000 1404
Tallage 10364 10261 10189 10340 10312 10594
FeedMod before calibration 10435 12000 12000 12000 12000 12000 1396
% FeedMod after calibration 8% 9% 9% 9% 9% 9%
% Tallage 8% 7% 7% 8% 7% 8%
% FeedMod before calibration 8% 9% 9% 9% 9% 9%
Maize gluten feed EU-‐28 (Industrial) 2007-‐2008 2008-‐2009 2009-‐2010 2010-‐2011 2011-‐2012 2012-‐2013 Diff.
FeedMod after calibration 2561 2694 3500 3500 3500 3500 479
Tallage 2667 2522 2504 3074 3050 2775
FeedMod before calibration 2894 3185 3500 3500 3500 3500 581
% FeedMod after calibration 2% 2% 3% 3% 3% 3%
% Tallage 2% 2% 2% 2% 2% 2%
% FeedMod before calibration 2% 2% 3% 3% 3% 3%
Seigle EU-‐28 (Industrial) 2007-‐2008 2008-‐2009 2009-‐2010 2010-‐2011 2011-‐2012 2012-‐2013 Diff.
FeedMod after calibration 1736 2012 2160 2115 1801 2698 583
Tallage 1002 1405 1967 1454 1200 1995
FeedMod before calibration 1199 1853 2030 1314 738 2425 290
% FeedMod after calibration 1% 1% 2% 2% 1% 2%
% Tallage 1% 1% 1% 1% 1% 1%
% FeedMod before calibration 1% 1% 1% 1% 1% 2%
Oats EU-‐28 (Industrial) 2007-‐2008 2008-‐2009 2009-‐2010 2010-‐2011 2011-‐2012 2012-‐2013 Diff.
FeedMod after calibration 973 725 871 1010 874 955 2613
Tallage 3639 3616 3634 3672 3332 3189
FeedMod before calibration 2289 1106 1303 1013 853 1869 2108
% FeedMod after calibration 1% 1% 1% 1% 1% 1%
% Tallage 3% 3% 3% 3% 2% 2%
% FeedMod before calibration 2% 1% 1% 1% 1% 1%
Triticale EU-‐28 (Industrial) 2007-‐2008 2008-‐2009 2009-‐2010 2010-‐2011 2011-‐2012 2012-‐2013 Diff.
FeedMod after calibration 2746 2683 2372 1992 1982 1784 450
Tallage 1633 2211 2497 2240 2063 2443
FeedMod before calibration 267 364 372 342 365 356 1837
% FeedMod after calibration 2% 2% 2% 1% 1% 1%
% Tallage 1% 2% 2% 2% 1% 2%
% FeedMod before calibration 0% 0% 0% 0% 0% 0%

European Commission — Contract : 30-CE-0609772/00-59 — Tallage Modelling feed consumption in the European Union: update and improvement of the Feed-Model (FeedMod)
Final Report – November, 13 2014 page 65 on 87
Figure 28: FeedMod 2014 results before and after calibration and Tallage data for UE 28
Figure 29 shows the reference tonnages (orange line), pre-calibration FeedMod tonnages (grey line) and cali-brated FeedMod tonnages (blue line).
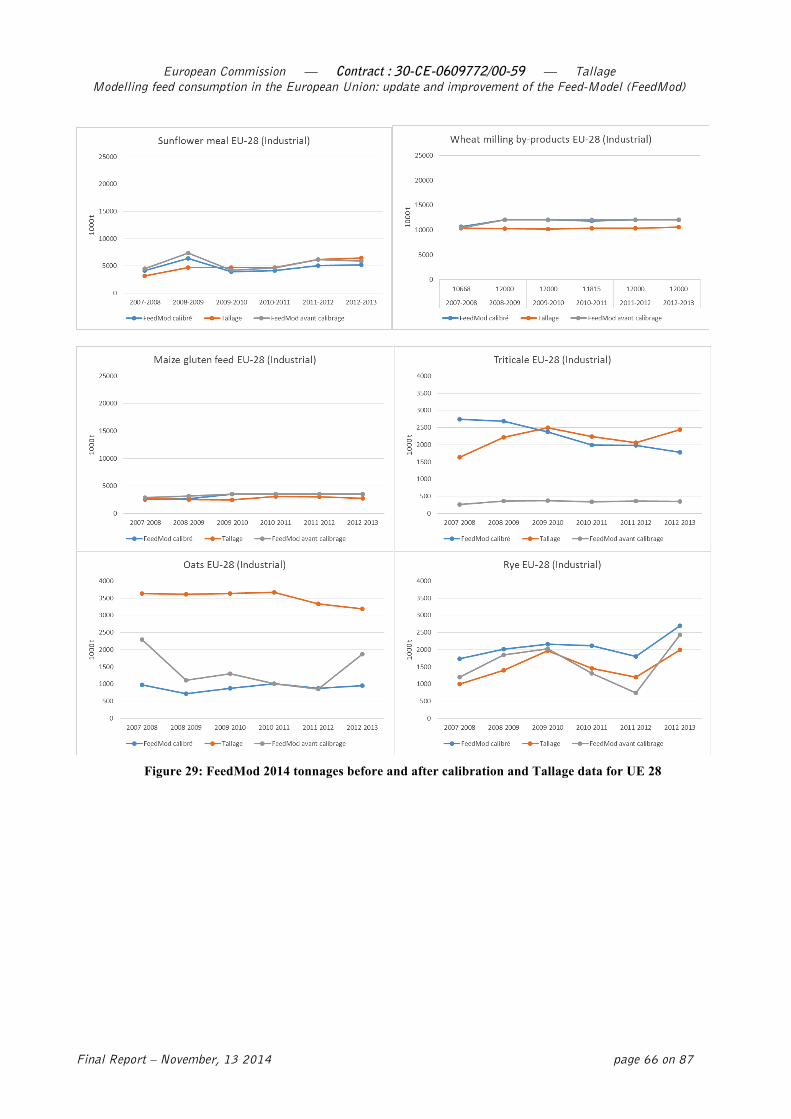
European Commission — Contract : 30-CE-0609772/00-59 — Tallage Modelling feed consumption in the European Union: update and improvement of the Feed-Model (FeedMod)
Final Report – November, 13 2014 page 66 on 87
Figure 29: FeedMod 2014 tonnages before and after calibration and Tallage data for UE 28
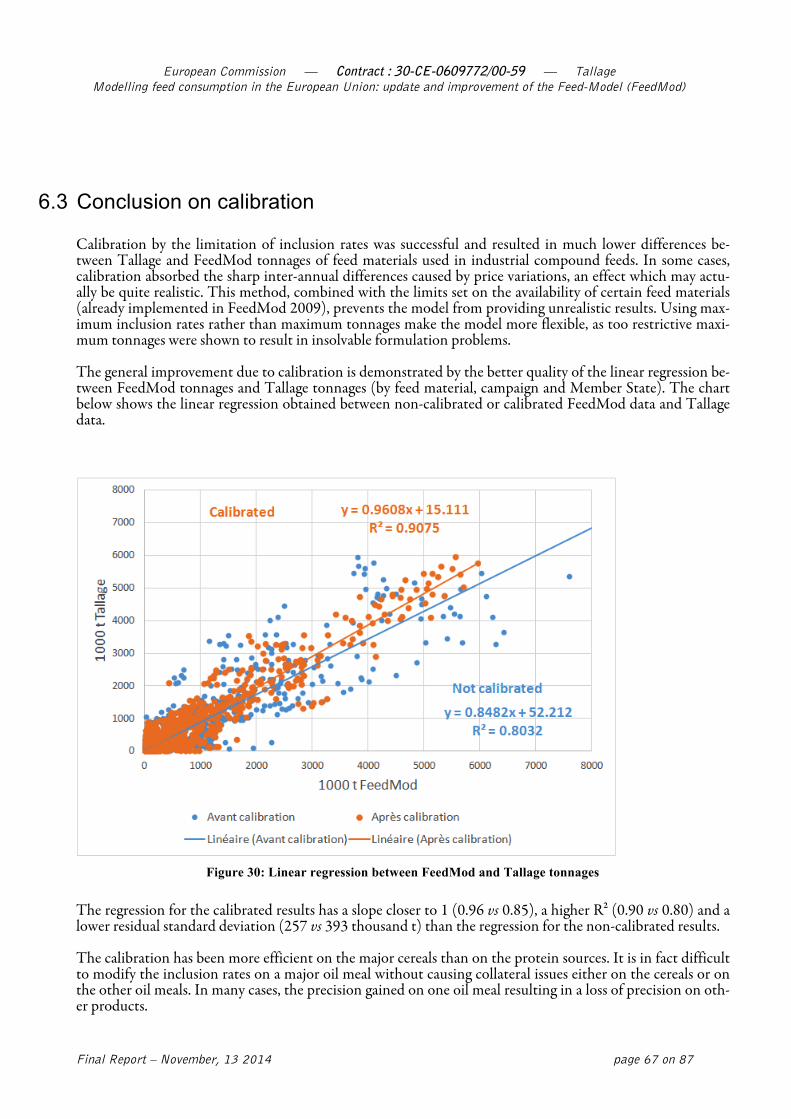
European Commission — Contract : 30-CE-0609772/00-59 — Tallage Modelling feed consumption in the European Union: update and improvement of the Feed-Model (FeedMod)
Final Report – November, 13 2014 page 67 on 87
6.3 Conclusion on calibration
Calibration by the limitation of inclusion rates was successful and resulted in much lower differences be-tween Tallage and FeedMod tonnages of feed materials used in industrial compound feeds. In some cases, calibration absorbed the sharp inter-annual differences caused by price variations, an effect which may actu-ally be quite realistic. This method, combined with the limits set on the availability of certain feed materials (already implemented in FeedMod 2009), prevents the model from providing unrealistic results. Using max-imum inclusion rates rather than maximum tonnages make the model more flexible, as too restrictive maxi-mum tonnages were shown to result in insolvable formulation problems.
The general improvement due to calibration is demonstrated by the better quality of the linear regression be-tween FeedMod tonnages and Tallage tonnages (by feed material, campaign and Member State). The chart below shows the linear regression obtained between non-calibrated or calibrated FeedMod data and Tallage data.
Figure 30: Linear regression between FeedMod and Tallage tonnages
The regression for the calibrated results has a slope closer to 1 (0.96 vs 0.85), a higher R² (0.90 vs 0.80) and a lower residual standard deviation (257 vs 393 thousand t) than the regression for the non-calibrated results.
The calibration has been more efficient on the major cereals than on the protein sources. It is in fact difficult to modify the inclusion rates on a major oil meal without causing collateral issues either on the cereals or on the other oil meals. In many cases, the precision gained on one oil meal resulting in a loss of precision on oth-er products.

European Commission — Contract : 30-CE-0609772/00-59 — Tallage Modelling feed consumption in the European Union: update and improvement of the Feed-Model (FeedMod)
Final Report – November, 13 2014 page 68 on 87
Nevertheless, the calibrated FeedMod model provides a realistic image of the consumption of the major feed materials by the feed industry in the EU-28.

European Commission — Contract : 30-CE-0609772/00-59 — Tallage Modelling feed consumption in the European Union: update and improvement of the Feed-Model (FeedMod)
Final Report – November, 13 2014 page 69 on 87
7 Theme 6: Sensitivity analysis
7.1 General comments on sensitivity analysis
Qualitative methods (so-called screening methods) rely on a limited number of simulations generated by ei-ther deterministic experimental plans (“one-factor-at-a-time”, various elaborated latin square designs, etc) or random techniques (Monte-Carlo). The analysis of results is either based on a visual display of the relation between inputs and outputs (scatter plots) or the calculation of indexes, in case of simple models with well known and appropriated mathematical properties (Morris method for instance).
Quantitative methods rely on a very high number of simulations, generated in the same way as qualitative methods (deterministic plans or random techniques). These methods don’t assume mathematical properties but they can’t be used for a model with a high number of parameters. The analysis of results is based on the calculation of conditional variances for each input variable. These conditional variances represent the con-tribution of an input to the whole variance of the output (Saltelli et al., 2008; Iooss, 2010). Different meth-ods of variance decomposition exist and generate different indexes (for instance Sobol or FAST).
For complex models with a high number of parameters, the two methods are generally used in a sequential way. First, qualitative methods allow reducing the parameter space by detecting non influential input param-eters. Second, quantitative methods are run on the remaining parameters and provide measurements to rank the contribution of each model input to the output variance.
Whatever the type of method, model assumptions (linearity, monotony, independence and interactions among factors) and computational cost are two major aspects to account for in choosing a sensitivity analysis method. Because of these two aspects, sensitivity analysis methods, both qualitative and quantitative, have generated a large range of adaptations in the literature, often specifically developed to fit a given model. Gen-erally, the choice of a sensitivity method and the specifications of its implementation (input variation defini-tion in particular) imply a good knowledge of the model structure, functioning and behavior.
7.2 Application to FeedMod
FeedMod is a calculation chain that estimates the tonnage of materials used in the 28 European Member States for livestock industrial and on-farm feeds. The general structure of the model is shown in Figure 31 with the following key components: output variables, input data, parameters and calculation steps. This dia-gram allows visualizing the hierarchy of calculation steps and the sequential implication of input data and pa-rameters.
The following features of the FeedMod model had constrained the way to design and perform the sensitivity analysis :
• The huge of number of parameters (more than 80000 individual values organized through matrixes) • The matrix nature of FeedMod computation (decomposition by year, quarter, Member State, plant,
animal group, formula, materials and nutrients) • The lack of previous knowledge on the model behavior and its mathematical properties (interactions
among input parameters, linearity and monotony of output responses, etc)

European Commission — Contract : 30-CE-0609772/00-59 — Tallage Modelling feed consumption in the European Union: update and improvement of the Feed-Model (FeedMod)
Final Report – November, 13 2014 page 70 on 87
• The hierarchical structure of the model, sequential nature of the calculation chain and core optimi-zation procedure
• The lack of knowledge on a priori range of variation of input parameters
The limited time for computation and access limited to only one licence key for the optimization module (Xpress).Given these considerations and with respect to the objective of the sensitivity analysis (i.e. providing in-sights on FeedMod, detecting influential inputs and helping selecting which sub-parts to focus on for further im-provement), we adopt a reasonable and pragmatic approach with the following characteristics:
- Mainly qualitative with scenarios focusing on variability sources (for obvious reasons of computational and analytical feasibility, it is not possible to perform a sensitivity analysis by screening the whole parameter space.
- Repeated experimental plans designed to explore the whole model by sub-parts (instead of a “blind screen-ing”)
- Preference for visual displays of outputs variation (scatter plots) in order to maximize the informative value of the analysis
This approach makes it possible to stay within the time of the project with a possible simulation number.
FeedMod sensitivity analysis is performed to characterize variations in output variables induced by variations in input data and parameters. In the following sections, these two types of model inputs are analyzed and the strategy for sensitivity analysis through variability sources is presented. The general objective is to provide a comprehensive set of synthetic results showing FeedMod behavior relative to different scenarios of input changes.

European Commission — Contract : 30-CE-0609772/00-59 — Tallage Modelling feed consumption in the European Union: update and improvement of the Feed-Model (FeedMod)
Final Report – November, 13 2014 page 71 on 87
Figure 31: FeedMod calculation chain
7.2.1 Input data
FeedMod calculations use three types of chronological series as input data (Figure 32). EUROSTAT and FEFAC data are directly used to calculate industrial feed tonnages. EUROSTAT data are also used in on-farm feed tonnage calculation (by way of animal energy requirements). Material price series are used to calcu-late formula costs at the virtual plant level.
These datasets are linked and have dependencies: animal number and production in EUROSTAT, animal production in EUROSTAT and feed tonnage in FEFAC, material price in a given quarter quotation list. The analysis of these links is beyond the scope of this study.

European Commission — Contract : 30-CE-0609772/00-59 — Tallage Modelling feed consumption in the European Union: update and improvement of the Feed-Model (FeedMod)
Final Report – November, 13 2014 page 72 on 87
Series Period Data Dimension by period Status
Eurostats Year Animal
productions
Meat (pig, cattle, poultry)
Egg
Cow milk
140
(5 products x 28 states)
Source #3
Livestock
Numbers
Pig
Cattle
Dairy cow
84
(3 animals x 28 states)
Cereal
productions
Wheat, Barley, Maize, Oats
Rye, Triticale, Sorghum
196
(7 cereals x 28 states)
FEFAC Year Industrial
compound
feeds
Cattle (total, dairy, beef)
Pig (total, piglet, growing,
breeder)
Poultry (total, meat, laying)
280
(10 feeds x 28 states)
Source #3
Prices Quarter Material prices List of 117 quotations 3276
(117 prices x 28 states)
Source #2
Figure 32: Input data
7.2.1.1 Parameters and variability sources
Conventionally, a thorough preliminary study of the structure of the model was performed to understand the role of each parameter in the calculation chain. This study was done in closed interaction with FeedMod developers. Figure 33 details the parameter space of FeedMod. This study resulted in the identification of “a priori” types of parameter influences (Figure 34) and in the identification of the main leverages of modula-tion of FeedMod behavior. FeedMod parameters can be thus grouped in families according to their implica-tion in the calculation path (industrial feed vs on-farm feed) and the calculation step (feed tonnage, material inclusion rate, material cost).
Some parameters can directly be estimated from input data (C1, C2 and C6). At the end, the number of unit parameters in a family depends of the partition level that they drive (between States, animals, formulas, ma-terials, plants).

European Commission — Contract : 30-CE-0609772/00-59 — Tallage Modelling feed consumption in the European Union: update and improvement of the Feed-Model (FeedMod)
Final Report – November, 13 2014 page 73 on 87
Calculation Parameter
Chain Step Name Dimension1 Decomposition Status in sensitivity analysis
Industrial Feed tonnage C1 392 14 statistics x 28 states Fixed (dependency to data)
Industrial Feed tonnage C2 252 (164) 9 animal types x 28 states Fixed (dependency to data)
Industrial Feed tonnage C3 560 20 formulas x 28 states Fixed (structural realism)
Industrial Feed tonnage C4 210 (8) 42 plants x 5 animal groups Source #8
Industrial Feed tonnage C5 260 13 primary states x 4 quarters x 5 animal groups Fixed (structural realism)
On-Farm Feed tonnage C6 84 3 animal products x 28 states Fixed (dependency to data)
On-Farm Inclusion rate C7 924 3 coefficients x 11 cereals x 28 states Source #7
On-Farm Feed tonnage Animal distrib. 196 7 animal types x 28 states Fixed (dependency to data)
On-Farm Feed tonnage Energy req. 308 (119) 11 energy coefficients x 28 states Source #4
On-Farm Feed tonnage %Energy FO 224 2 cattle type x 4 quarters x 28 states Source #4
On-Farm Feed tonnage Energy CO feed 280 10 animal types x 28 states Source #4
On-Farm Feed tonnage Energy feed 280 10 animal types x 28 states Source #4
Industrial Feed cost Paritiy 1161 (393) 43 materials x 27 plants Source #9
Industrial Inclusion rate Min req. 14040 (1853) 54 nutrients x 20 formulas x 13 primary states Source #6
Industrial Inclusion rate Max req. 14040 (841) 54 nutrients x 20 formulas x 13 primary states Source #6
Industrial Inclusion rate Min inclusion 10660 (91) 41 materials x 20 formulas x 13 primary states Source #5
Industrial Inclusion rate Max inclusion 10660 (3431) 41 materials x 20 formulas x 13 primary states Source #5
Industrial Inclusion rate Composition 30186 43 materials x 54 nutrients x 13 primary states Source #1
Figure 33: Classification and dimension of parameter matrix
1in parenthesis: number of values different from default or to take into account of values identical within a level, basis FeedMod2009
FeedMod families of parameters are considered according to their nature and their position in the calcula-tion chain (see Figure 34).
(1) Input data or parameters with an internal consistency to be preserved;
(2) Parameters linked to input data;
(3) Non influential parameters;
(4) Parameters representative of a family of parameters;
(5) Key parameters;
(6) Supplementary parameters introduced to modulate a set of parameters and thus generate analysis scenar-ios.

European Commission — Contract : 30-CE-0609772/00-59 — Tallage Modelling feed consumption in the European Union: update and improvement of the Feed-Model (FeedMod)
Final Report – November, 13 2014 page 74 on 87
Figure 34: parameter selection
Parameters C1 and C2 are involved in the ventilation of feed tonnage in animal groups (dairy cattle, beef cat-tle, pig, meat poultry, laying hens) and animal types (dairy cows, beef cattle, piglets, growing pigs, sows, broil-ers, turkeys, ducks, laying hens) from FEFAC and Eurostats data. They can be directly estimated from input data (if available for the current period). Moreover, these two matrixes of parameters are only involved for pig and poultry meat. Given their link to input data (i.e. to animal production structure), parameters C1 and C2 are considered as fixed, i.e. neither manipulated nor changed in the sensitivity analysis process.
Parameters C3 and C5 are involved in the ventilation of feed tonnage at the level of the 20 formulas and the 4 quarters. Given that these parameters reflect a structural reality, they are considered as fixed.
Finally nine families of parameters are defined to design the sensitivity analysis and considered as variability sources (Figure 35):
Source #1: Variability of material composition
Source #2: Variability of material prices
Source #3: Variability of production data
Source #4. Variability of energy parameters
Source #5. Heterogeneity of requirement constraints
Source #6. Heterogeneity of inclusion constraints
Source #7. Heterogeneity of on-farm feed inclusion rate
Source #8. Heterogeneity of virtual plants

European Commission — Contract : 30-CE-0609772/00-59 — Tallage Modelling feed consumption in the European Union: update and improvement of the Feed-Model (FeedMod)
Final Report – November, 13 2014 page 75 on 87
Source #9. Heterogeneity of parities
These families allow breaking down the whole parameter space into meaningful blocks (Figure 35) that can be manipulated to explore the model behavior. These variability sources thus allow reducing the parameter space (including more than 80000 individual parameter values) and design a feasible sensitivity analysis of the whole model.
For each source of variability, one or several modalities have been considered. Each modality corresponds to a scenario of repetition of runs with varying model input. The number of modality for a given source of varia-bility corresponds to a relevant sub-set of parameters, for instance energy and protein by animal type for source 1. As modalities were designed for each source, the number of modalities among sources is different. A total of 36 modalities have been analyzed (see Figure 36). A total of 308 runs of FeedMod have been per-formed representing around 40 hours of computation. This time accounts for 20% of the total time contrac-tually dedicated to the SA.
Processing of input data (generation of scenarios) and output data (model results) has been conducted with R and Scilab softwares and with VBA macros.
7.2.1.2 Details on variability sources and modalities
Source #1: material composition
These parameters are involved in the optimization process, for the calculation of animal requirement cover-age.
6 modalities: variation of parameters relative to energy content (1:3) and lysine content (4:6) of materials by animal type (cattle, pigs and poultry)
Source #2: material prices
These parameters are involved in the optimization process, for the calculation of formula cost.
5 modalities : (1) random drawing of quarterly vectors of material prices in the set of available quarterly pric-es (period 2003-2004 considered as representative of a potential price variability, price chock on (2) barley, (3) maize, (4) soya and (5) wheat.
Source #3: production data
These parameters are involved in the calculation of animal energy requirement needed before the calculation of on-farm feed tonnage.
3 modalities: variation of the number of s (1) cattle, (2) dairy cows and (3) pigs.
Source #4: energy parameters
These parameters are involved in the calculation of o-farm tonnage on the basis of animal requirements not covered by industrial feed supply.
13 modalities: variation of energy requirements of (1) cattle, (2) pigs and (3) poultry, and variation of energy content of (4:6) industrial feeds and (7:9) on-farm feed (for cattle, pigs and poultry, modulation of foraging systems of (10) beef cattle and (11) dairy cattle, simulation of a drought affecting (12) beef cattle and (13) dairy cattle.
Source #5: requirement constraints
European Commission — Contract : 30-CE-0609772/00-59 — Tallage Modelling feed consumption in the European Union: update and improvement of the Feed-Model (FeedMod)
Final Report – November, 13 2014 page 76 on 87
These parameters are involved in the optimization process, to constraint supply from a nutritional stand-point.
3 modalities: (1) simulation of combinations of minimal and maximal constraint release for all materials, (2) change in minimal requirement constraints and (3) change in maximal requirement constraints.
Source #6: inclusion constraints
These parameters are involved in the optimization process to constraint inclusion form an industrial stand-point.
3 modalities: (1) simulation of combinations of minimal and maximal constraint release for all materials, (2) change in minimal inclusion constraints and (3) change in maximal inclusion constraints.
Source #7: on-farm inclusion rate
These parameters are involved in the calculation of on-farm inclusion rates from industrial inclusion rates.
1 modality: modulation of the heterogeneity between States in the calculation model of on-farm inclusion rate (simulations ranging from theoretical homogeneity between States to the current reference heterogenei-ty).
Source #8: virtual plants
These parameters are involved in the calculation step of ventilation of industrial tonnage between plants within a Member State (only for Germany, Spain, France, Italy and UK).
1 modality: modulation of relative proportion of tonnage between virtual plants (simulations ranging from theoretical homogeneity between plants to the current reference heterogeneity).
Source #9: parity
These parameters are involved in the optimization process, to calculate the material cost differential between plants.
1 modality: modulation of cost differences.
A detailed description of the modalities for each variability source is given Figure 36.

European Commission — Contract : 30-CE-0609772/00-59 — Tallage Modelling feed consumption in the European Union: update and improvement of the Feed-Model (FeedMod)
Final Report – November, 13 2014 page 77 on 87
Figure 35: variability sources for sensitivity analysis

European Commission — Contract : 30-CE-0609772/00-59 — Tallage Modelling feed consumption in the European Union: update and improvement of the Feed-Model (FeedMod)
Final Report – November, 13 2014 page 78 on 87
Source Parameter fa-mily
Sheet Columns Rows Levels (% of devia-
tion from refer-ence)
# runs*
#1 Composition All
Net energy dairy cow, Net energy dairy cow FR-UFL, Net energy beef cattle FR-UFV, Net energy dairy cow NL-VEM, Net energy
beef cattle NL-VEVI, Metaboliza-ble energy ruminant
All (material) [-20%,-15%,-10%,-5%,+5%,+10%,+15
%,+20%] 8 (4)
#1 Composition All
Net energy pig, Net energy sow, Metabolizable energy pig, Energy pig NL-EW, Energy pig DK-FE, Energy sow DK-FE, Digestible
energy pig UK
All (material) [-20%,-15%,-10%,-5%,+5%,+10%,+15
%,+20%] 8 (4)
#1 Composition All Metabolizable energy poultry, Me-tabolizable energy layers, Metabo-
lizable energy others All (material)
[-20%,-15%,-10%,-5%,+5%,+10%,+15
%,+20%] 8 (2)
#1 Composition All
Lysine, Digestible protein rumi-nant, Digestible protein FR-PDIE, Digestible protein FR-PDIN, Di-gestible protein DE-nXP, Diges-tible protein NL-DVE, Ruminal nitrogen balance DE-RNB, De-
graded protein balance NL-OEB, Ruminal nitrogen balance DK-PBV
All (material) [-20%,-15%,-10%,-5%,+5%,+10%,+15
%,+20%] 8(4)
#1 Composition All Lysine, Digestible lysine pig All (material) [-20%,-15%,-10%,-5%,+5%,+10%,+15
%,+20%] 8
#1 Composition All Lysine, Digestible lysine poultry All (material) [-20%,-15%,-10%,-5%,+5%,+10%,+15
%,+20%] 8
#2 Material prices 2010-Q3, 2010-Q4, 2011-Q1, 2011-Q2 All (quotation)
Randomization of Q1,Q2,Q3,Q4 price vectors among the
28 states
100
#2 Material prices 2010-Q3, 2010-Q4, 2011-Q1, 2011-Q2 Barley
[-50%,+10%,+50%,+
100%,+200%] 5
#2 Material prices 2010-Q3, 2010-Q4, 2011-Q1, 2011-Q2 Maize
[-50%,+10%,+50%,+
100%,+200%] 5
#2 Material prices 2010-Q3, 2010-Q4, 2011-Q1, 2011-Q2
Soybean meal 44, Soybean meal 48, Soy-bean meal 50,
[-50%,+10%,+50%,+
100%,+200%] 5
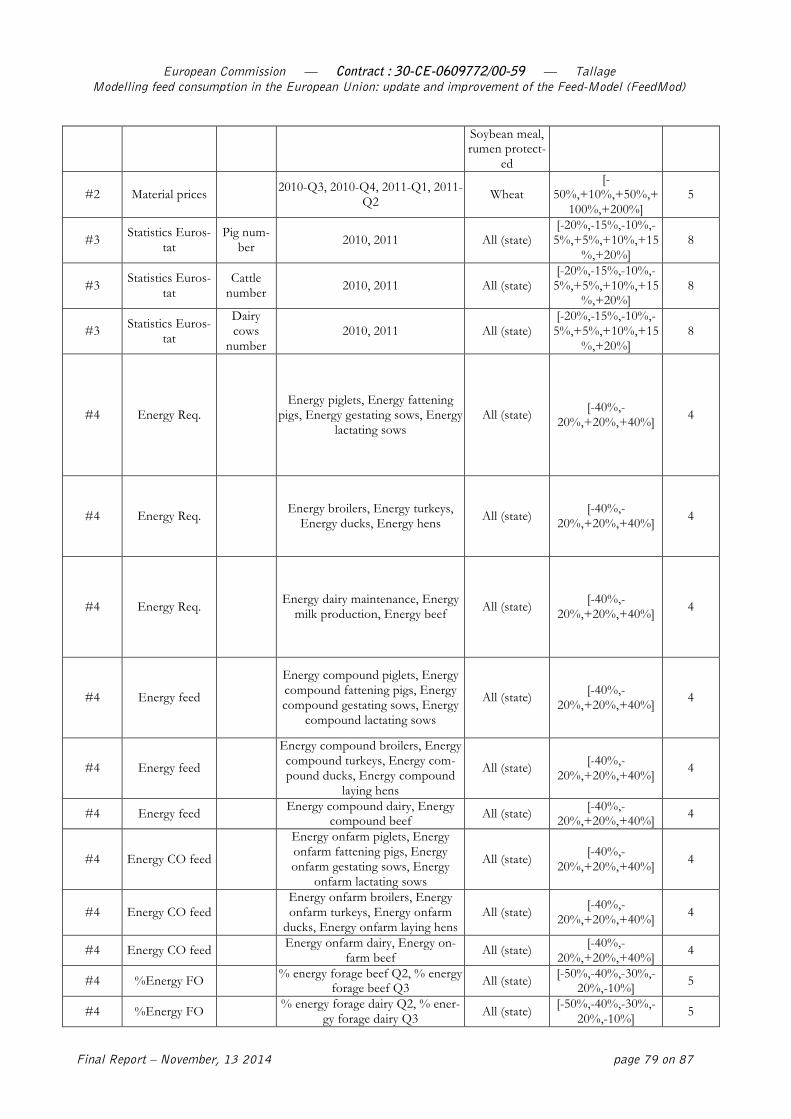
European Commission — Contract : 30-CE-0609772/00-59 — Tallage Modelling feed consumption in the European Union: update and improvement of the Feed-Model (FeedMod)
Final Report – November, 13 2014 page 79 on 87
Soybean meal, rumen protect-
ed
#2 Material prices 2010-Q3, 2010-Q4, 2011-Q1, 2011-Q2 Wheat
[-50%,+10%,+50%,+
100%,+200%] 5
#3 Statistics Euros-tat
Pig num-ber 2010, 2011 All (state)
[-20%,-15%,-10%,-5%,+5%,+10%,+15
%,+20%] 8
#3 Statistics Euros-tat
Cattle number 2010, 2011 All (state)
[-20%,-15%,-10%,-5%,+5%,+10%,+15
%,+20%] 8
#3 Statistics Euros-tat
Dairy cows
number 2010, 2011 All (state)
[-20%,-15%,-10%,-5%,+5%,+10%,+15
%,+20%] 8
#4 Energy Req. Energy piglets, Energy fattening
pigs, Energy gestating sows, Energy lactating sows
All (state) [-40%,-20%,+20%,+40%] 4
#4 Energy Req. Energy broilers, Energy turkeys, Energy ducks, Energy hens All (state) [-40%,-
20%,+20%,+40%] 4
#4 Energy Req. Energy dairy maintenance, Energy milk production, Energy beef All (state) [-40%,-
20%,+20%,+40%] 4
#4 Energy feed
Energy compound piglets, Energy compound fattening pigs, Energy compound gestating sows, Energy
compound lactating sows
All (state) [-40%,-20%,+20%,+40%] 4
#4 Energy feed
Energy compound broilers, Energy compound turkeys, Energy com-pound ducks, Energy compound
laying hens
All (state) [-40%,-20%,+20%,+40%] 4
#4 Energy feed Energy compound dairy, Energy compound beef All (state) [-40%,-
20%,+20%,+40%] 4
#4 Energy CO feed
Energy onfarm piglets, Energy onfarm fattening pigs, Energy onfarm gestating sows, Energy
onfarm lactating sows
All (state) [-40%,-20%,+20%,+40%] 4
#4 Energy CO feed Energy onfarm broilers, Energy onfarm turkeys, Energy onfarm
ducks, Energy onfarm laying hens All (state) [-40%,-
20%,+20%,+40%] 4
#4 Energy CO feed Energy onfarm dairy, Energy on-farm beef All (state) [-40%,-
20%,+20%,+40%] 4
#4 %Energy FO % energy forage beef Q2, % energy forage beef Q3 All (state) [-50%,-40%,-30%,-
20%,-10%] 5
#4 %Energy FO % energy forage dairy Q2, % ener-gy forage dairy Q3 All (state) [-50%,-40%,-30%,-
20%,-10%] 5

European Commission — Contract : 30-CE-0609772/00-59 — Tallage Modelling feed consumption in the European Union: update and improvement of the Feed-Model (FeedMod)
Final Report – November, 13 2014 page 80 on 87
#4 %Energy FO % energy forage beef Q1, % energy
forage beef Q2, % energy forage beef Q3, % energy forage beef Q4
All (state) 6 foraging systems (see figure 52) 6
#4 %Energy FO % energy forage beef Q1, % energy
forage beef Q2, % energy forage beef Q3, % energy forage beef Q4
All (state) 6 foraging systems (see figure 52) 6
#5 Requirements All All (formula) All (nutrient) No min/Max ;
Min/No max; No Min/No Max
3
#5 Requirements All
Min (Dairy cow low, Dairy cow high, Dairy cow standard, Beef
cattle low, Beef cattle high, Broiler growing, Broiler finishing, Turkey growing, Turkey finishing, Duck growing, Duck finishing, Laying
hens, Piglet, Pig standard, Pig growing, Pig finishing, Pig finishing (heavy), Sow standard, Sow gesta-
tion, Sow lactation)
All (nutrient) [-20%,-15%,-10%,-5%,+5%,+10%,+15
%,+20%] 8(2)
#5 Requirements All
Max (Dairy cow low, Dairy cow high, Dairy cow standard, Beef
cattle low, Beef cattle high, Broiler growing, Broiler finishing, Turkey growing, Turkey finishing, Duck growing, Duck finishing, Laying
hens, Piglet, Pig standard, Pig growing, Pig finishing, Pig finishing (heavy), Sow standard, Sow gesta-
tion, Sow lactation)
All (nutrient) [-20%,-15%,-10%,-5%,+5%,+10%,+15
%,+20%] 8(4)
#6 Inclusion rates All All (formula) All (nutrient) No min/Max ;
Min/No max; No Min/No Max
3
#6 Inclusion rates All
Min (Dairy cow low, Dairy cow high, Dairy cow standard, Beef
cattle low, Beef cattle high, Broiler growing, Broiler finishing, Turkey growing, Turkey finishing, Duck growing, Duck finishing, Laying
hens, Piglet, Pig standard, Pig growing, Pig finishing, Pig finishing (heavy), Sow standard, Sow gesta-
tion, Sow lactation)
All (nutrient) [-20%,-15%,-10%,-5%,+5%,+10%,+15
%,+20%] 8
#6 Inclusion rates All
Max (Dairy cow low, Dairy cow high, Dairy cow standard, Beef
cattle low, Beef cattle high, Broiler growing, Broiler finishing, Turkey growing, Turkey finishing, Duck growing, Duck finishing, Laying
hens, Piglet, Pig standard, Pig growing, Pig finishing, Pig finishing (heavy), Sow standard, Sow gesta-
tion, Sow lactation)
All (nutrient) [-20%,-15%,-10%,-5%,+5%,+10%,+15
%,+20%] 8
#7 C7 A constant, B pct material in feed, C pct cereal in harvest
All (material group)
5 steps (0.2 length) from heterogeneity (0) toward homoge-
neity (1)
5
#8 C4 coeff_4 All (animal group/plant)
5 steps (0.2 length) from heterogeneity (0) to homogeneity
(1)
5
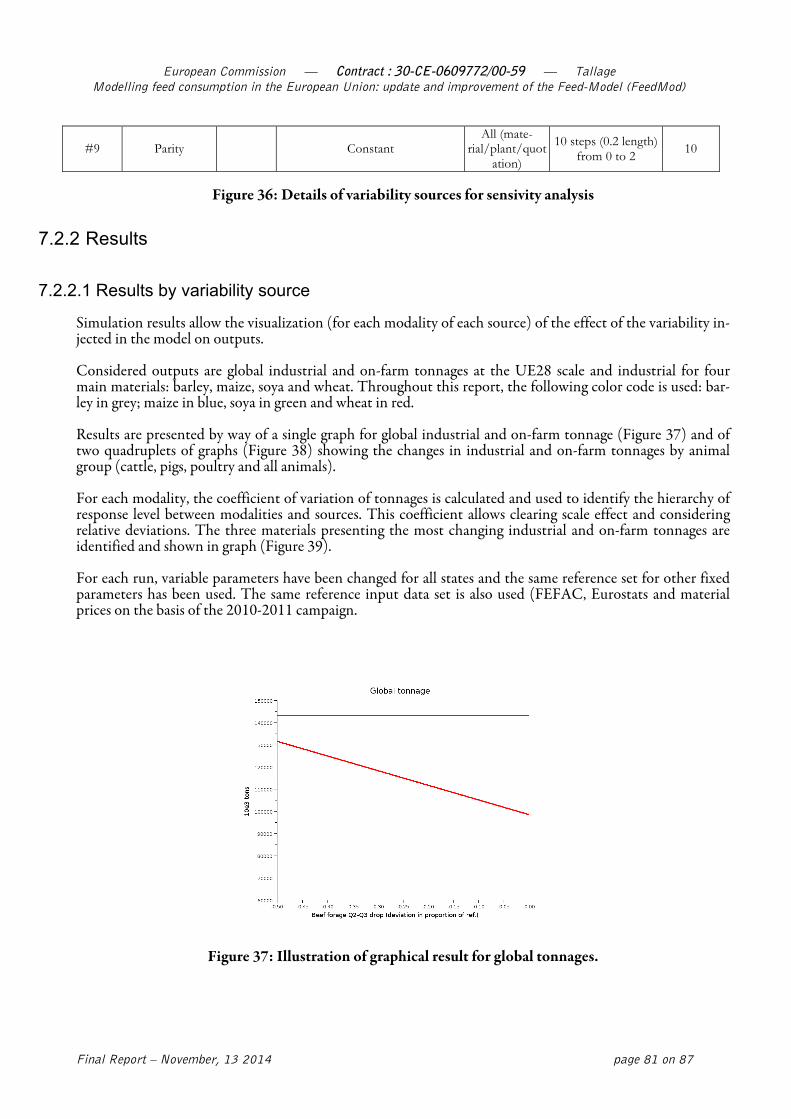
European Commission — Contract : 30-CE-0609772/00-59 — Tallage Modelling feed consumption in the European Union: update and improvement of the Feed-Model (FeedMod)
Final Report – November, 13 2014 page 81 on 87
#9 Parity Constant All (mate-
rial/plant/quotation)
10 steps (0.2 length) from 0 to 2 10
Figure 36: Details of variability sources for sensivity analysis
7.2.2 Results
7.2.2.1 Results by variability source
Simulation results allow the visualization (for each modality of each source) of the effect of the variability in-jected in the model on outputs.
Considered outputs are global industrial and on-farm tonnages at the UE28 scale and industrial for four main materials: barley, maize, soya and wheat. Throughout this report, the following color code is used: bar-ley in grey; maize in blue, soya in green and wheat in red.
Results are presented by way of a single graph for global industrial and on-farm tonnage (Figure 37) and of two quadruplets of graphs (Figure 38) showing the changes in industrial and on-farm tonnages by animal group (cattle, pigs, poultry and all animals).
For each modality, the coefficient of variation of tonnages is calculated and used to identify the hierarchy of response level between modalities and sources. This coefficient allows clearing scale effect and considering relative deviations. The three materials presenting the most changing industrial and on-farm tonnages are identified and shown in graph (Figure 39).
For each run, variable parameters have been changed for all states and the same reference set for other fixed parameters has been used. The same reference input data set is also used (FEFAC, Eurostats and material prices on the basis of the 2010-2011 campaign.
Figure 37: Illustration of graphical result for global tonnages.
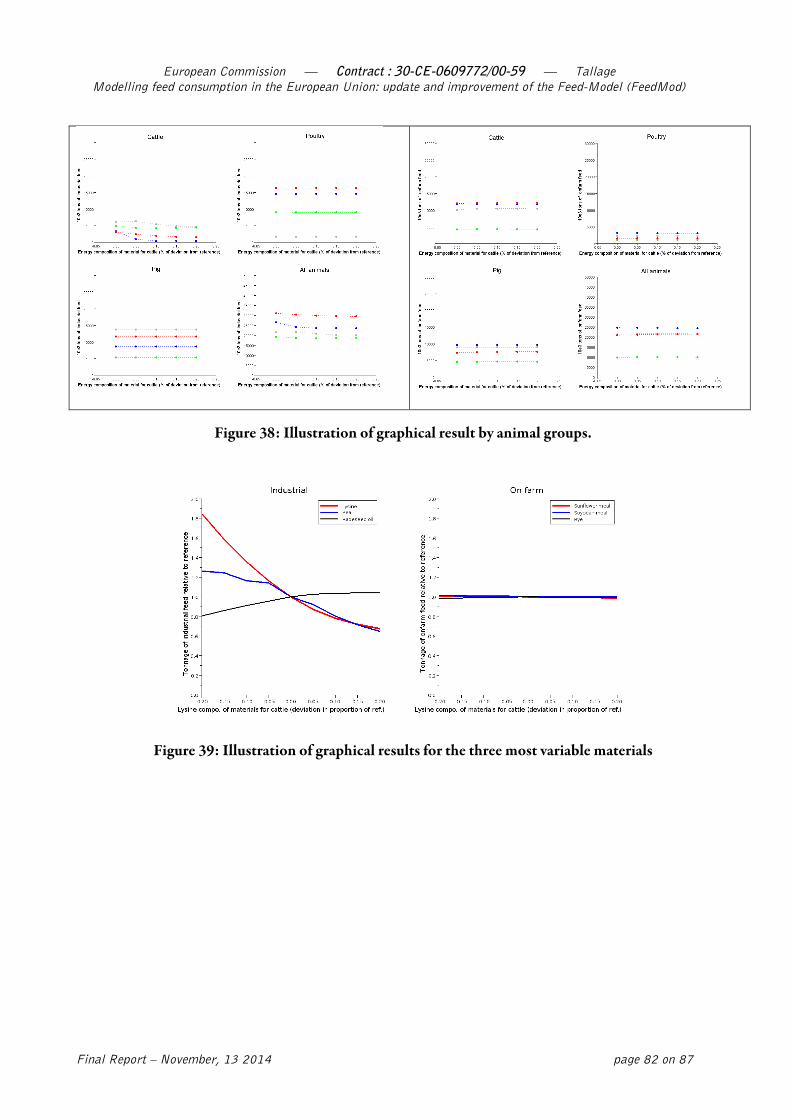
European Commission — Contract : 30-CE-0609772/00-59 — Tallage Modelling feed consumption in the European Union: update and improvement of the Feed-Model (FeedMod)
Final Report – November, 13 2014 page 82 on 87
Figure 38: Illustration of graphical result by animal groups.
Figure 39: Illustration of graphical results for the three most variable materials

European Commission — Contract : 30-CE-0609772/00-59 — Tallage Modelling feed consumption in the European Union: update and improvement of the Feed-Model (FeedMod)
Final Report – November, 13 2014 page 83 on 87
7.2.2.2 Synthesis
The comparison of the coefficients of variation of global tonnages at UE 28 scale for industrial and on-farm feeds allows the identification of the variability sources inducing the most pronounced effects on FeedMod responses (Figure 40). Therefore, the two main variability sources for industrial feed tonnages are material prices (source #2) and requirements constraints (source #5) (blue arrows in Figure 41). This result high-lights the central position of the optimization process in the FeedMod calculation chain. Parameters relat-ed to material energy composition, inclusion constraints, plant heterogeneity and parity induce variations of slower scale in FeedMod responses. Other sources of variability have no effect (as they are only used in on-farm tonnage calculation) or minor effects (lysine composition).
Because of their effects on industrial tonnages, material prices and requirement constraints have indirect ef-fect on-farm tonnages (dotted arrows in Figure 41). The two principal sources that have a direct effect on on-farm tonnages are C7 (source #7) coefficient and energy parameters (source #4; orange arrows in Figure 41). Parameters related to energy composition of materials, number of animals, inclusion constraints, virtu-al plant heterogeneity and parities induce minor variation of FeedMod outputs. As for industrial tonnages, lysine composition has minor effect on on-farm tonnages.
These results suggest that the parameters constraining the optimization process (requirements and inclu-sion) and driving on-farm calculations (inclusion rate and energy parameters) are the most relevant to focus further analysis.
Furthermore, these results open a perspective of a specific quantitative analysis on decomposing on-farm tonnages variability induced by upstream calculations (industrial tonnages calculation) and downstream calculations (specific calculations of on-farm tonnages).
Regarding the position of the sensitivity analysis sub-part within the whole FeedMod study, it should be noticed that the sensitivity analysis was not run with the final calibrated version of the model. This calibra-tion procedure provides new standard values for parameters but did not change the model structure. As the sensitivity analysis was performed by moving parameter values with relative changes around their current value, we can thus assume a minor bias arising from the sensitivity analysis not ran on final calibrated ver-sion of the model.

European Commission — Contract : 30-CE-0609772/00-59 — Tallage Modelling feed consumption in the European Union: update and improvement of the Feed-Model (FeedMod)
Final Report – November, 13 2014 page 84 on 87
Parameter family Source of variability
Modality Barley Maize Soya Wheat Total Barley Maize Soya Wheat Total
Energy composition of material for cattle
1 1 3.6% 5.2% 1.6% 2.1% 0.0% 0.9% 0.4% 1.1% 1.1% 0.4%
Energy composition of material for pigs
1 2 2.6% 9.6% 2.9% 3.6% 0.2% 0.9% 0.8% 1.9% 2.4% 0.5%
Energy composition of material for poultry
1 3 2.7% 8.2% 7.8% 3.7% 0.4% 0.5% 4.1% 6.0% 2.3% 1.4%
Lysine composition of material for cattle
1 4 0.2% 0.2% 3.4% 0.9% 0.0% 0.2% 0.1% 2.9% 0.7% 0.3%
Lysine composition of material for pigs
1 5 0.1% 0.1% 0.7% 0.1% 0.0% 0.1% 0.0% 0.5% 0.1% 0.1%
Lysine composition of material for poultry 1 6 0.3% 0.2% 0.6% 0.2% 0.0% 0.1% 0.2% 0.5% 0.2% 0.1%
Barley quotations 2 7 120.2% 12.1% 1.3% 17.6% 0.1% 7.3% 1.8% 1.9% 11.8% 1.3%Maize quotations 2 8 22.2% 85.9% 3.2% 28.1% 0.0% 4.5% 7.5% 1.8% 16.2% 4.4%Soya quotations 2 9 7.0% 5.4% 90.6% 10.8% 0.1% 1.7% 1.9% 40.9% 5.0% 3.2%Wheat quotations 2 10 25.2% 26.2% 5.7% 87.4% 0.1% 4.1% 6.1% 7.3% 25.7% 4.8%
Randomized quotations 2 11 14.6% 9.7% 7.7% 5.9% 0.1% 3.2% 2.9% 6.5% 2.9% 1.2%Cattle number 3 12 0.0% 0.0% 0.0% 0.0% 0.0% 8.6% 7.6% 7.4% 9.2% 8.3%
Dairy cows number 3 13 0.0% 0.0% 0.0% 0.0% 0.0% 0.3% 0.0% 0.1% 0.2% 0.2%Pigs number 3 14 0.0% 0.0% 0.0% 0.0% 0.0% 11.2% 10.8% 12.1% 9.6% 10.7%
Forage drought scenarios for cattle
4 15 0.0% 0.0% 0.0% 0.0% 0.0% 10.8% 8.9% 10.1% 12.5% 10.7%
Forage production system scenarios for cattle
4 16 0.0% 0.0% 0.0% 0.0% 0.0% 17.7% 14.5% 15.0% 21.7% 17.4%
Forage drought scenarios for dairy cows
4 17 0.0% 0.0% 0.0% 0.0% 0.0% 5.0% 4.9% 5.2% 6.0% 5.3%
Forage production system scenarios for dairy cows
4 18 0.0% 0.0% 0.0% 0.0% 0.0% 6.6% 8.0% 7.3% 9.1% 7.8%
Energy requirement of cattle 4 19 0.0% 0.0% 0.0% 0.0% 0.0% 24.3% 23.2% 21.9% 26.7% 24.3%
Energy requirement of pigs 4 20 0.0% 0.0% 0.0% 0.0% 0.0% 25.6% 24.4% 27.7% 22.1% 24.4%
Energy requirement of poultry 4 21 0.0% 0.0% 0.0% 0.0% 0.0% 11.1% 14.0% 10.8% 10.2% 11.5%Energy composition of
industrial feeds for cattle4 22 0.0% 0.0% 0.0% 0.0% 0.0% 10.0% 8.3% 8.7% 9.0% 8.9%
Energy composition of industrial feeds for pigs
4 23 0.0% 0.0% 0.0% 0.0% 0.0% 15.6% 15.8% 16.6% 13.8% 15.1%
Energy composition of industrial feeds for poultry
4 24 0.0% 0.0% 0.0% 0.0% 0.0% 8.3% 11.2% 8.1% 8.4% 9.1%
Energy composition of on-‐farm feeds for cattle
4 25 0.0% 0.0% 0.0% 0.0% 0.0% 17.2% 17.5% 15.7% 20.7% 18.1%
Energy composition of on-‐farm feeds for pigs
4 26 0.0% 0.0% 0.0% 0.0% 0.0% 15.2% 14.2% 16.8% 12.8% 14.5%
Energy composition of on-‐farm feeds for poultry 4 27 0.0% 0.0% 0.0% 0.0% 0.0% 4.0% 4.8% 4.0% 2.8% 3.8%
Requirement constraints scenario
5 28 61.3% 49.6% 108.0% 54.3% 2.4% 9.3% 6.6% 36.1% 18.1% 11.5%
Maximal requirement constraint value
5 29 5.2% 18.6% 36.7% 7.9% 0.4% 2.3% 3.2% 15.7% 4.4% 2.5%
Minimal requirement constraint value 5 30 2.5% 0.3% 2.4% 0.8% 0.1% 0.8% 0.3% 1.8% 0.7% 0.3%
Inclusion constraints scenario 6 31 8.1% 8.6% 15.5% 12.9% 0.2% 0.8% 2.7% 11.4% 6.7% 3.1%Maximal inclusion constraint
value6 32 0.3% 0.0% 0.0% 0.2% 0.0% 0.2% 0.0% 0.1% 0.1% 0.1%
Minimal inclusion constraint value 6 33 7.5% 2.3% 2.5% 4.0% 0.0% 0.7% 0.4% 2.2% 2.4% 0.4%
C7 7 34 0.0% 0.0% 0.0% 0.0% 0.0% 9.9% 13.8% 13.3% 5.6% 6.3%Virtual plants 8 35 9.7% 5.6% 2.2% 5.4% 0.0% 2.7% 2.5% 3.8% 1.5% 1.3%
Parities 9 36 11.5% 5.8% 2.3% 5.6% 0.0% 3.1% 2.6% 4.1% 1.5% 1.5%
Industrial tonnages On-‐farm tonnages
Figure 40: Summary of the coefficient of variation induced by the 36 modalities of the sensitivity anal-ysis on industrial and on-farm tonnages

European Commission — Contract : 30-CE-0609772/00-59 — Tallage Modelling feed consumption in the European Union: update and improvement of the Feed-Model (FeedMod)
Final Report – November, 13 2014 page 85 on 87
Figure 41: Schematic representation of the major factors, direct or indirect, affecting industrial and on-farm tonnages at the EU 28 levels

European Commission — Contract : 30-CE-0609772/00-59 — Tallage Modelling feed consumption in the European Union: update and improvement of the Feed-Model (FeedMod)
Final Report – November, 13 2014 page 86 on 87
8 Conclusions and recommendations
FeedMod 2014 model has been considerably developed: input of new data is sizeable; the parameters of the database have been updated and completed where needed; new raw materials have been added as well as one Member State (Croatia).
Regarding the estimates for feeds on the farm, the model has been quite drastically restructured, be it for tak-ing fodders into account or the calculation of farm made feeds. Fodders were calculated from the production of maize silage and from pastures. A predictive method, based on estimates of surface areas and the integra-tion of vegetation index data (fAPAR data) was suggested. It has given convincing results. Nevertheless, it will require more manipulation from the users (supply of numbered forecasts data with regards to ensilage and surface areas in pastures, inputting of fAPAR data into the model). It appeared that fAPAR data is not available for all Member States in the database supplied by JRC, especially the mask used in the study does not cover Denmark and Brittany in France.
On-farm feed is no longer considered, in FeedMod 2014, as a balance between total needs and the other feed sectors (fodders and industrial feeds), but is calculated as an absolute value on the basis of harvests and con-sumption of the other feed sectors. In a final step, this value is capped by markers, which represent min/max deviations from theoretical need of the herds.
The part of FeedMod 2014 model that deals with industrial feeds is now calibrated in a satisfactory way for the main cereals (barley, wheat and maize). These are estimated for each Member State with difference of less than 1 Mt tons in comparison to Tallage’s supply and demand figures. At EU-28 scale, the error on the sum of these 3 cereals is of 1.2 Mt or 2% of total estimated tonnage. The total prediction for the tonnage of soy-bean meal is correct.
This report contains a corpus of information on the sensitivity of the model in the form of a set of graphs. The comparison of the variation coefficients of global EU 28 tonnage for industrial and on-farm feeds allows us to identify the sources of variation with the greatest impact on the model’s answers. It would seem the two factors most affecting industrial tonnage are the price of raw materials and the constraints of minimum and maximum needs. This result underlines the central position of the optimization module in the calculating chain of the model. Through their effect on industrial tonnage, the price of raw materials and the restrictions on minimal and maximal needs indirectly affect farm tonnage. The two main sources directly affecting farm tonnage are the C7 coefficients and the energy parameters.
As recommendation for further improvement of FeedMod:
• FeedMod 2014 is a tool for decision support. The main improvement we suggest is to add a scenario tool to simulate the impact of structural events on food/feed consumption in the EU (embargoes, abolition of milk quotas).
• Adding an archiving function can also be considered; it would improve processing time of the model’s calculations.
• Further improvement could be envisaged as regards the use of fAPAR data by exploiting other masks in order to take into account missing regions.
• In any case, it would be necessary to review the model parameters in five years, as shown in Figure 1 page 9 (industrial parameters, nutritionnal datas, parities and on-farm parameters).

European Commission — Contract : 30-CE-0609772/00-59 — Tallage Modelling feed consumption in the European Union: update and improvement of the Feed-Model (FeedMod)
Final Report – November, 13 2014 page 87 on 87
Table of figures FIGURE 1: FEEDMOD CALCULATIONS 9 FIGURE 2: REFERENCE TABLES FOR NUTRITIONAL COMPOSITIONS OF RAW MATERIALS AND NUTRITIONAL NEEDS OF
ANIMALS 11 FIGURE 3: CHOICE OF TABLES FOR HUNGARY, IRELAND, ITALY, ROMANIA AND POLAND 12 FIGURE 4: LOCALISATION OF A FEEDMOD’S VIRTUAL PLANT 13 FIGURE 5: UTILISATION OF CONVERSION COEFFICIENTS IN THE ESTIMATION FOR MEAT POULTRY FEED IN THE UK IN
2007 14 FIGURE 6: QUOTATIONS TIMES SERIES TO BE REVIEWED 16 FIGURE 7: DIAGRAM OF THE CALCULATION OF FARM FEEDS IN FEEDMOD 2009 18 FIGURE 8: EXAMPLE OF SEASONALITY OF DAIRY PRODUCTION 29 FIGURE 9: SUMMARY OF QUOTATIONS SELECTED TO REPLACE THE DISCONTINUED QUOTATIONS 30 FIGURE 10: IMPACT OF THE ANNUAL VARIATIONS ON AMINO ACID AND MINERAL QUOTATIONS 31 FIGURE 11: LINKING CROATIAN COMPOUND FEED PRODUCTION TO EXISTING VIRTUAL FACTORIES 35 FIGURE 12: EVOLUTION OF ON-‐FARM FEED CONSUMPTION BETWEEN 2006/2007 AND 2012/2013 39 FIGURE 13: EVOLUTION OF THE SHARE OF CEREALS AND MEALS IN ON-‐FARM FEEDS FOR THE UE 40 FIGURE 14: COMPARISON OF THE PROGRESSION OF CONSUMPTION OF ON-‐FARM FEEDS AND INDUSTRIAL COMPOUND
FEEDS IN THE EU 40 FIGURE 15: COMPARISON OF CEREAL CONSUMPTION ON THE FARM WITH THE HARVEST LEVELS (MT) 41 FIGURE 16: EVOLUTION OF THE DISTRIBUTION OF ON-‐FARM FEED CONSUMPTION PER MS 42 FIGURE 17: REPROCESSING OF FARM FEEDS TOTAL 44 FIGURE 18: COVERAGE OF THEORETICAL NEEDS PER MS / HISTORIC GAPS 46 FIGURE 19: REAL USE RATE OF ENERGY SUPPLY FROM PASTURES 47 FIGURE 20: CORRECTED COVER OF ENERGY NEEDS 48 FIGURE 21: CALCULATION OF FORAGE ENERGY SUPPLY FOR DAIRY AND BEEF CATTLE 50 FIGURE 22: ADJUSTMENT TO ENERGY REQUIREMENTS 52 FIGURE 23: EXCEEDING/UNDER ACHIEVEMENT VERSUS TOTAL ENERGY REQUIREMENT BY SPECIES AND BY CROP
YEAR SINCE 2004/05 (EU) 53 FIGURE 24: EXCEEDING/UNDER ACHIEVEMENT VERSUS TOTAL ENERGY REQUIREMENT BY SPECIES AND BY CROP
YEAR SINCE 2004/05 (FRANCE) 54 FIGURE 25: GROSS ESTIMATION / ESTIMATION KEPT 55 FIGURE 26: COMPLETE CALCULATION PROCESS FOR ON-‐FARM FEED MATERIALS 56 FIGURE 27: QUARTELY LIMITATIONS FOR TONNAGES IN 1000 T 57 FIGURE 28: FEEDMOD 2014 RESULTS BEFORE AND AFTER CALIBRATION AND TALLAGE DATA FOR UE 28 65 FIGURE 29: FEEDMOD 2014 TONNAGES BEFORE AND AFTER CALIBRATION AND TALLAGE DATA FOR UE 28 66 FIGURE 30: LINEAR REGRESSION BETWEEN FEEDMOD AND TALLAGE TONNAGES 67 FIGURE 31: FEEDMOD CALCULATION CHAIN 71 FIGURE 32: INPUT DATA 72 FIGURE 33: CLASSIFICATION AND DIMENSION OF PARAMETER MATRIX 73 FIGURE 34: PARAMETER SELECTION 74 FIGURE 35: VARIABILITY SOURCES FOR SENSITIVITY ANALYSIS 77 FIGURE 36: DETAILS OF VARIABILITY SOURCES FOR SENSIVITY ANALYSIS 81 FIGURE 37: ILLUSTRATION OF GRAPHICAL RESULT FOR GLOBAL TONNAGES. 81 FIGURE 38: ILLUSTRATION OF GRAPHICAL RESULT BY ANIMAL GROUPS. 82 FIGURE 39: ILLUSTRATION OF GRAPHICAL RESULTS FOR THE THREE MOST VARIABLE MATERIALS 82 FIGURE 40: SUMMARY OF THE COEFFICIENT OF VARIATION INDUCED BY THE 36 MODALITIES OF THE SENSITIVITY
ANALYSIS ON INDUSTRIAL AND ON-‐FARM TONNAGES 84 FIGURE 41: SCHEMATIC REPRESENTATION OF THE MAJOR FACTORS, DIRECT OR INDIRECT, AFFECTING INDUSTRIAL
AND ON-‐FARM TONNAGES AT THE EU 28 LEVELS 85