final recommendation statistics and maps
TRANSCRIPT

Frederick County Public Schools, VA Fall 2020 Middle School Rezoning Study
Final Recommendation Statistics and Maps
FREDERICK COUNTY PUBLIC SCHOOLS, VA FALL 2020 MIDDLE SCHOOL REZONING STUDY: FINAL RECOMMENDATION STATISTICS AND MAPS
Enrollment Statistics Assumptions
The following document contains a series of maps and statistics for current schools and boundaries, as well as the for the Final Recommendation, proposed by the Rezoning Committee at their fourth and final meeting on December 8, 2020. This recommendation is the culmination of months of work by the committee, the district, and the staff at Cropper GIS. As many as seven DRAFT Options were considered during this process, and the committee feels that this recommendation best serves the needs of the district and best adheres to the rezoning criteria and objectives established by the district at the beginning of this process. The information in this handout will guide Board Members as they prepare for their final vote on the recommendation.
When estimating enrollment for the rezoning options, including the Final Recommendation, a series of assumptions were made. These assumptions helped to ensure that actual enrollments would materialize as close to the estimates as possible. The following assumptions were made:
1. The New R. E. Aylor Middle School will have a capacity of 914 students.2. Any 6th through 8th grade student living within a middle school zone is assumed to attend their zoned school.3. Any student that could not be located by the GIS is assumed to be attending the school they currently attend, per the
student database.
All student counts are based on the FCPS student database received 05/22/2020.
1 Revised: 12/10/2020

FREDERICK COUNTY PUBLIC SCHOOLS, VA FALL 2020 MIDDLE SCHOOL REZONING STUDY: FINAL RECOMMENDATION STATISTICS AND MAPS
Middle School Options Estimated Enrollment Statistics
Estimated enrollment is calculated by adding all the 6th through 8th grade students that live inside each zone, plus any unmatched students that currently attend that school. These estimates are based on the current student population and where they live. They have not been projected or forecasted into the future.
Middle School Options Free and Reduced Meals Statistics
Middle School2019-20Capacity
06 07 08Total
EnrolledEnrolled
Utilization
Admiral R. E. Byrd MS 900 354 345 333 1,032 115%Frederick County MS 880 256 301 275 832 95%James Wood MS 840 306 307 274 887 106%R. E. Aylor MS 713 194 221 212 627 88%Total 3,333 1,110 1,174 1,094 3,378 101%
Middle SchoolOption
Capacity06 07 08
Estimated Enrollment
Estimated Utilization
Admiral R. E. Byrd MS 900 299 282 296 877 97%Frederick County MS 880 257 305 287 849 96%James Wood MS 840 289 297 237 823 98%R. E. Aylor MS 914 265 290 274 829 91%Total 3,534 1,110 1,174 1,094 3,378 96%
2021-22 Recommended MS Zones
Middle SchoolFree or
Reduced Meals %
Non-Free or Reduced Meals %
Free or Reduced Meals %
Non-Free or Reduced Meals %
Admiral R. E. Byrd MS 32% 68% 30% 71%Frederick County MS 38% 62% 37% 63%James Wood MS 49% 51% 53% 47%R. E. Aylor MS 45% 55% 42% 58%Total 40% 60% 40% 60%
Enrolled MS Recommended
2 Revised: 12/10/2020
FREDERICK COUNTY PUBLIC SCHOOLS, VA FALL 2020 MIDDLE SCHOOL REZONING STUDY: FINAL RECOMMENDATION STATISTICS AND MAPS
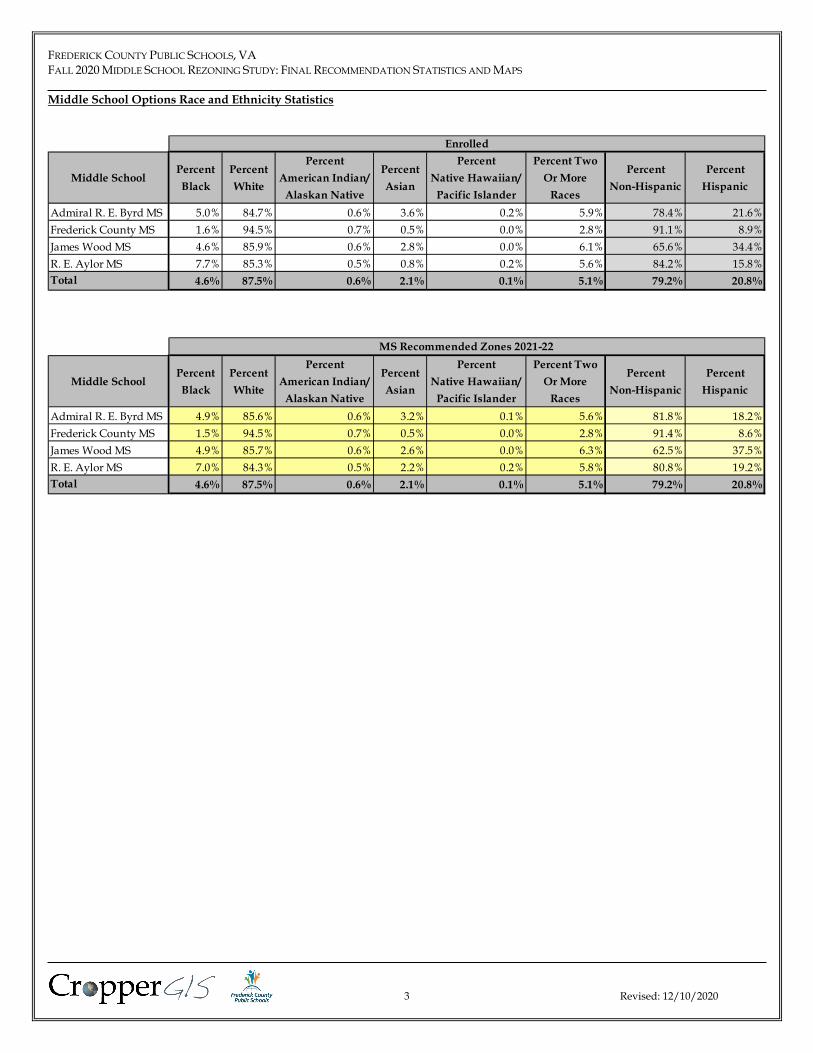
Middle School Options Race and Ethnicity Statistics
Middle SchoolPercent Black
Percent White
PercentAmerican Indian/
Alaskan Native
Percent Asian
Percent Native Hawaiian/
Pacific Islander
Percent Two Or More
Races
PercentNon-Hispanic
PercentHispanic
Admiral R. E. Byrd MS 5.0% 84.7% 0.6% 3.6% 0.2% 5.9% 78.4% 21.6%Frederick County MS 1.6% 94.5% 0.7% 0.5% 0.0% 2.8% 91.1% 8.9%James Wood MS 4.6% 85.9% 0.6% 2.8% 0.0% 6.1% 65.6% 34.4%R. E. Aylor MS 7.7% 85.3% 0.5% 0.8% 0.2% 5.6% 84.2% 15.8%Total 4.6% 87.5% 0.6% 2.1% 0.1% 5.1% 79.2% 20.8%
Enrolled
Middle SchoolPercent Black
Percent White
PercentAmerican Indian/
Alaskan Native
Percent Asian
Percent Native Hawaiian/
Pacific Islander
Percent Two Or More
Races
PercentNon-Hispanic
PercentHispanic
Admiral R. E. Byrd MS 4.9% 85.6% 0.6% 3.2% 0.1% 5.6% 81.8% 18.2%Frederick County MS 1.5% 94.5% 0.7% 0.5% 0.0% 2.8% 91.4% 8.6%James Wood MS 4.9% 85.7% 0.6% 2.6% 0.0% 6.3% 62.5% 37.5%R. E. Aylor MS 7.0% 84.3% 0.5% 2.2% 0.2% 5.8% 80.8% 19.2%Total 4.6% 87.5% 0.6% 2.1% 0.1% 5.1% 79.2% 20.8%
MS Recommended Zones 2021-22
3 Revised: 12/10/2020

FREDERICK COUNTY PUBLIC SCHOOLS, VA FALL 2020 MIDDLE SCHOOL REZONING STUDY: FINAL RECOMMENDATION STATISTICS AND MAPS
Middle School Enrollment Trends
The following tables depict the trends for current school enrollment as well as the Final Recommendation.
If there are more students in lower grade levels than the higher grade levels this indicates enrollment growth since the lower, larger student groups will move up through the school, while the higher, smaller student groups will move on to the next grade level or graduate. Enrollment growth is symbolized by a green arrow pointing up. If there are fewer students in lower grade levels than higher grade levels, this indicates enrollment decline. This negative trend is symbolized by a red arrow pointing down. If all the grade levels are approximately the same size, then there is enrollment stability, and this is symbolized by a yellow line. See the reference below for each of the symbols. This trend data helps to depict how enrollment will change with the absence of in-migration (i.e. future residential construction).
Enrollment GrowthEnrollment StabilityEnrollment Decline
Middle School 0 1 2 3 4 5 6 7 82019-20 Total
Live-In Enrollment Trend
Admiral R. E. Byrd MS 279 300 282 276 261 313 347 335 334Frederick County MS 195 233 229 214 226 260 254 300 283James Wood MS 276 309 302 295 315 290 301 296 258R. E. Aylor MS 188 190 198 183 201 207 198 228 213Total 938 1,032 1,011 968 1,003 1,070 1,100 1,159 1,088
Middle School 0 1 2 3 4 5 6 7 8
MS Recommended Zones Total
Live-In Enrollment Trend
Admiral R. E. Byrd MS 237 265 248 253 234 274 299 282 295Frederick County MS 195 232 228 213 225 260 253 300 283James Wood MS 259 288 276 271 292 268 284 287 236R. E. Aylor MS 247 247 259 231 252 268 264 290 274Total 938 1,032 1,011 968 1,003 1,070 1,100 1,159 1,088
4 Revised: 12/10/2020

FREDERICK COUNTY PUBLIC SCHOOLS, VA FALL 2020 MIDDLE SCHOOL REZONING STUDY: FINAL RECOMMENDATION STATISTICS AND MAPS
Middle School Key Developments
In addition to the trend data, we have provided the number of vacant lots and active building permits issued through the end of August 2020 for future residential development. This will help depict the growth that can be expected from future approved residential development.
Middle School Option Impacts
The cells colored in green depict the number of live-in students that are not moved, and the cells colored in tan depict the number of live-in students that are moved, where they are currently zoned, and where they will be zoned per the Final Recommendation. The first table shows a sum of live-in students impacted and the total percentage of live-in students impacted.
Middle SchoolVacant
Lots
Active 2020 Building Permits
Issued
Vacant Lots
Active 2020 Building Permits
IssuedAdmiral R. E. Byrd MS 1,180 179 1,175 141Frederick County MS 2,048 15 2,048 15James Wood MS 97 69 97 69R. E. Aylor MS 20 32 25 70Total 3,345 295 3,345 295
MS Recommended Zones 2021-22
2019-20 MS Zones
OptionTotal 6-8th Live-In Students Impacted
Percent 6-8th Live-In Students Impacted
MS Recommended 353 10.5%
Student Impact Estimates
MS Zone 2019-20MS Recommended
Zones 2021-22
Total 6-8th Live In
StudentsAdmiral R. E. Byrd MS Admiral R. E. Byrd MS 770Admiral R. E. Byrd MS James Wood MS 60Admiral R. E. Byrd MS R. E. Aylor MS 186Frederick County MS Frederick County MS 836Frederick County MS R. E. Aylor MS 1James Wood MS Admiral R. E. Byrd MS 106James Wood MS James Wood MS 747R. E. Aylor MS R. E. Aylor MS 641
5 Revised: 12/10/2020

FREDERICK COUNTY PUBLIC SCHOOLS, VA FALL 2020 MIDDLE SCHOOL REZONING STUDY: FINAL RECOMMENDATION STATISTICS AND MAPS
Elementary to Middle School Feeder Patterns Statistics
The feeder patterns represent the number of students living within the attendance boundary of both a lower grade cohort (i.e. elementary schools) and a higher-grade cohort (i.e. middle schools). The first table below depicts the number of splits from lower grade cohort schools to higher grade cohort schools in the “Schools Split” column. For example, Apple Pie Ridge ES feeds into both Frederick County MS and James Wood MS, and that is considered one split. The “Splits Less than 25%” column depicts the number of relatively small splits, a small split being one where a relatively small percentage (under 25% in this case) of students at a given school breaks away from peers upon graduating from one grade cohort to the next. The following tables show each school and each split by percentage by higher grade cohort attendance zones.
OptionElementary
Schools SplitSplits Less than
25%2019-20 MS Zones 5 3MS Recommended 5 4
ES to MS Splits by Option
2019-20 ES ZoneMS Recommended
Zones 2021-22ES
AttendanceApple Pie Ridge ES Frederick County MS 52%Apple Pie Ridge ES James Wood MS 48%Armel ES Admiral R. E. Byrd MS 50%Armel ES R. E. Aylor MS 50%Bass-Hoover ES R. E. Aylor MS 100%Evendale ES Admiral R. E. Byrd MS 100%Gainesboro ES Frederick County MS 100%Greenwood Mill ES Admiral R. E. Byrd MS 100%Indian Hollow ES Frederick County MS 95%Indian Hollow ES R. E. Aylor MS 5%Jordan Springs ES James Wood MS 100%Middletown ES R. E. Aylor MS 100%Orchard View ES Admiral R. E. Byrd MS 19%Orchard View ES Frederick County MS 18%Orchard View ES James Wood MS 57%Orchard View ES R. E. Aylor MS 6%Redbud Run ES James Wood MS 100%Stonewall ES Frederick County MS 52%Stonewall ES James Wood MS 48%
2019-20 ES Zone 2019-20 MS ZoneES
AttendanceApple Pie Ridge ES Frederick County MS 52%Apple Pie Ridge ES James Wood MS 48%Armel ES Admiral R. E. Byrd MS 100%Bass-Hoover ES R. E. Aylor MS 100%Evendale ES Admiral R. E. Byrd MS 100%Gainesboro ES Frederick County MS 100%Greenwood Mill ES Admiral R. E. Byrd MS 61%Greenwood Mill ES James Wood MS 39%Indian Hollow ES Frederick County MS 95%Indian Hollow ES R. E. Aylor MS 5%Jordan Springs ES James Wood MS 100%Middletown ES R. E. Aylor MS 100%Orchard View ES Admiral R. E. Byrd MS 44%Orchard View ES Frederick County MS 19%Orchard View ES James Wood MS 33%Orchard View ES R. E. Aylor MS 5%Redbud Run ES James Wood MS 100%Stonewall ES Frederick County MS 52%Stonewall ES James Wood MS 48%
6 Revised: 12/10/2020

FREDERICK COUNTY PUBLIC SCHOOLS, VA FALL 2020 MIDDLE SCHOOL REZONING STUDY: FINAL RECOMMENDATION STATISTICS AND MAPS
Middle to High School Feeder Patterns Statistics
OptionMiddle Schools
SplitSplits Less than
25%2019-20 MS Zones 3 2MS Recommended 2 1
MS to HS Splits by Option
2019-20 MS Zone 2019-20 HS ZoneMS
AttendanceAdmiral R. E. Byrd MS Millbrook High School 51%Admiral R. E. Byrd MS Sherando High School 49%Frederick County MS James Wood High School 100%Frederick County MS Sherando High School 0%James Wood MS James Wood High School 25%James Wood MS Millbrook High School 69%James Wood MS Sherando High School 6%R. E. Aylor MS Sherando High School 100%
MS Recommended Zones 2021-22
2019-20 HS ZoneMS
AttendanceAdmiral R. E. Byrd MS Millbrook High School 71%Admiral R. E. Byrd MS Sherando High School 29%Frederick County MS James Wood High School 100%James Wood MS James Wood High School 27%James Wood MS Millbrook High School 60%James Wood MS Sherando High School 14%R. E. Aylor MS Sherando High School 100%
7 Revised: 12/10/2020

FREDERICK COUNTY PUBLIC SCHOOLS, VA FALL 2020 MIDDLE SCHOOL REZONING STUDY: FINAL RECOMMENDATION STATISTICS AND MAPS
Glossary of Terms
Capacity – The number of students that an individual school can physically enroll.
Utilization - The enrollment divided by the capacity, described as a percentage.
Live-In students – Students that reside in a given attendance zone, regardless of actual school attendance.
Live and Attend-In students – Students that both reside in a given attendance zone and attend that zoned school.
Unmatched – Students not able to be located by the GIS by home address.
Out of District students – Students that live outside of Frederick County Public Schools’ district boundary.
Estimated Enrollment – Estimated enrollment is calculated by adding the live-in students and the unmatched students.
Option Impact – The number of live and attend-in students that change attendance zones from the 2019-20 attendance zones in each option. In other words, an estimate of the total number of students that would be impacted in each option.
Feeder Pattern – The number of students living within the attendance zone of both a given lower grade cohort (i.e. elementary school) and a given higher-grade cohort (i.e. middle school). This is presented as both the number of live-in students and as a percentage
8 Revised: 12/10/2020

