learning statistics using concept maps: effects on anxiety
TRANSCRIPT
San Jose State University San Jose State University
SJSU ScholarWorks SJSU ScholarWorks
Master's Theses Master's Theses and Graduate Research
Summer 2010
Learning Statistics using Concept Maps: Effects on Anxiety and Learning Statistics using Concept Maps: Effects on Anxiety and
Performance Performance
Patrick Francis Cravalho San Jose State University
Follow this and additional works at: https://scholarworks.sjsu.edu/etd_theses
Part of the Psychology Commons
Recommended Citation Recommended Citation Cravalho, Patrick Francis, "Learning Statistics using Concept Maps: Effects on Anxiety and Performance" (2010). Master's Theses. 3806. DOI: https://doi.org/10.31979/etd.n53p-s3fx https://scholarworks.sjsu.edu/etd_theses/3806
This Thesis is brought to you for free and open access by the Master's Theses and Graduate Research at SJSU ScholarWorks. It has been accepted for inclusion in Master's Theses by an authorized administrator of SJSU ScholarWorks. For more information, please contact [email protected].

LEARNING STATISTICS USING CONCEPT MAPS: EFFECTS ON ANXIETY AND PERFORMANCE
A Thesis
Presented to
The Faculty of the Department of Psychology
San José State University
In Partial Fulfillment
of the Requirements for the Degree
Master of Arts
by
Patrick F. Cravalho
August 2010

2010
Patrick F. Cravalho
ALL RIGHTS RESERVED

The Designated Thesis Committee Approves the Thesis Titled
LEARNING STATISTICS USING CONCEPT MAPS: EFFECTS ON ANXIETY AND PERFORMANCE
by
Patrick F. Cravalho
APPROVED FOR THE DEPARTMENT OF PSYCHOLOGY
SAN JOSE STATE UNIVERSITY
August 2010
Dr. Ronald F. Rogers Department of Psychology
Dr. Sean Laraway Department of Psychology
Dr. Mary McVey Lurie College of Education

ABSTRACT
LEARNING STATISTICS USING CONCEPT MAPS: EFFECTS ON ANXIETY AND PERFORMANCE
by Patrick F. Cravalho
The aim of this thesis was to study the use of concept mapping in an
undergraduate statistics course in order to examine the effects on statistics anxiety and
academic performance by means of a two-group quasi-experimental design. Two
undergraduate statistics classes were recruited for this study with one serving as the
treatment (concept map) group and one serving as the control (standard instruction)
group. It was hypothesized that the use of concept mapping would decrease the statistics
anxiety and improve the academic performance of students in the concept map group
when compared with the control group. The statistics anxiety of the concept map group
decreased more than that of the control group over the course of the semester, but the
group differences in anxiety were not found to be statistically significant. The academic
performance of both the concept map and control groups remained relatively stable
throughout the course of the semester, and the groups did not significantly differ on
academic performance measures. Significant differences were found between the
concept map and control group on the interpretation anxiety subscale of the statistical
anxiety measure used in this study and between the proficient and non-proficient concept
map user scores on the computational section of the third academic performance
measure. The study hypotheses were not supported. It is suggested that future research
include less concept map training, more specific instruction for concept map creation, and
investigation of particular student groups.

v
ACKNOWLEDGEMENTS
For a long time, it was my goal to graduate from San José State University with a
master’s degree in psychology. Everyone who supported me made the realization of that
goal possible. First of all, I would like to thank my graduate advisor, Dr. Ronald Rogers,
for always making time to help me with my thesis project. Thank you for pushing me to
put forth my greatest effort, not just on this project, but also throughout my time at San
Jose State University. I would also like to thank Dr. Sean Laraway for helping me
appreciate statistics and for answering my many questions with the utmost sincerity. I
appreciate you sharing your past experiences with me; you always knew how to
communicate to me that my analysis was going to be fine, no matter how confused I felt
at times. In addition, I would like to thank Dr. Mary Mcvey for her irreplaceable insight
into applied educational research. Meeting with you always helped me to balance this
project between the world of experimental psychology and educational psychology.
Moreover, I would like to thank my undergraduate mentor, Dr. Randy Isaacson, for
allowing me to work under his expert tutelage. Your lessons taught me about education
and research, but also about how to lead a good life inside and outside of the classroom.
Finally, I would like to thank some of my family members. First and foremost, I
need to thank my mother and father for always supporting my goals and for sacrificing so
much in order for me to accomplish them. Next, I would like to thank my grandmother
Gerry. You are my hero! In receiving a master’s degree I honor your life, as you
inspired me to make my dreams a reality. I love you all very much! Everyone’s support
throughout the process of completing my thesis will always be greatly appreciated.

vi
TABLE OF CONTENTS
LIST OF FIGURES ........................................................................................................... x
LIST OF TABLES ........................................................................................................... xii
INTRODUCTION ............................................................................................................. 1
Math Anxiety, Test Anxiety, and Processing Efficiency Theory .......................... 2
Statistics Anxiety ................................................................................................... 5
Parallels between Math Anxiety and Statistics Anxiety ........................................ 7
Mental Models and Academic Performance .......................................................... 8
Concept Maps as a Metacognitive Strategy ........................................................... 9
Concept Maps and Statistics Anxiety .................................................................. 12
Concept Maps and Academic Performance ......................................................... 14
Study Aims and Predictions ................................................................................. 15
METHODS ...................................................................................................................... 17
Participants ........................................................................................................... 17
Design .................................................................................................................. 17
Setting and Apparatus .......................................................................................... 18
Materials .............................................................................................................. 18
Extra credit assignments .......................................................................... 18
Demographics .......................................................................................... 19
Concept map usage .................................................................................. 20
Statistics Anxiety Rating Scale (STARS) ................................................ 20
SJSU Blackboard ..................................................................................... 22

vii
Concept map rubric and quantitative analysis ......................................... 22
Academic performance ............................................................................ 23
Procedure ............................................................................................................. 24
Experiment introduction .......................................................................... 24
Concept map training ............................................................................... 26
Original concept maps ............................................................................. 27
RESULTS ........................................................................................................................ 29
Problematic Data .................................................................................................. 29
Statistics Anxiety Findings .................................................................................. 30
STARS reliability ..................................................................................... 30
Overall statistics anxiety .......................................................................... 30
STARS part 1: Statistical anxiety ............................................................ 31
STARS part 2: General statistics ............................................................. 33
STARS subscales ..................................................................................... 34
Statistics Exam Performance Findings ................................................................ 38
Overall exam performance ....................................................................... 38
Exam performance: Conceptual questions ............................................... 39
Exam performance: Computational questions ......................................... 40
Concept Mapping Proficiency ............................................................................. 42
Concept map assessment reliability ......................................................... 42
Proficient and non-proficient ratings ....................................................... 43
Proficient and non-proficient exam performance .................................... 44

viii
Proficient concept map users and control group performance ................. 47
Concept Map Usage Questionnaire Results ......................................................... 50
End of training questionnaire summary ................................................... 50
End of semester questionnaire summary ................................................. 52
DISCUSSION .................................................................................................................. 54
Study Summary .................................................................................................... 54
Strengths and Limitations .................................................................................... 55
Significant results to consider .................................................................. 55
Validity and reliability ............................................................................. 56
Small effect sizes and insufficient statistical power ................................ 59
Implications .......................................................................................................... 59
Potential population oversight ................................................................. 59
Conceptual vs. computational advantages ............................................... 60
Modification of the Current Study ....................................................................... 61
Improvements in concept map training .................................................... 61
Suggestions for Future Research ......................................................................... 63
Investigating specific student groups ....................................................... 63
Investigating conceptual and computational learning advantages ........... 64
Working memory assessment ................................................................. 65
Metacognition assessment ...................................................................... 65
REFERENCES ................................................................................................................ 67
ix
APPENDICES
A. Concept Map Extra Credit Assignment #5: Probability Item List .................. 74
B. Demographics Questionnaire .......................................................................... 76
C. End of Training Concept Map Usage Questionnaire ...................................... 78
D. End of Semester Concept Map Usage Questionnaire ..................................... 81
E. Concept Map Rubric ........................................................................................ 83

x
LIST OF FIGURES
FIGURE 1. Example of a spoke concept map with links, with links, detailing factors
relating to motivation ....................................................................................................... 10
FIGURE 2. Example of a chain concept map detailing the steps in calculating an
analysis of variance .......................................................................................................... 11
FIGURE 3. Example of a net concept map, detailing the different types of
experimental research designs ......................................................................................... 11
FIGURE 4. Mean STARS scores for the concept map and control groups ..................... 31
FIGURE 5. Mean STARS part 1 scores for the concept map and control groups .......... 32
FIGURE 6. Mean STARS part 2 scores for the concept map and control groups .......... 34
FIGURE 7. Mean interpretation anxiety scores for the concept map and control
groups ............................................................................................................................... 36
FIGURE 8. Mean fear of statistcs teachers anxiety scores for the concept map and
control groups .................................................................................................................. 37
FIGURE 9. Mean exam performance for the concept map and control groups .............. 38
FIGURE 10. Mean exam conceptual performance for the concept map and control groups ............................................................................................................................... 40 FIGURE 11. Mean exam computational performance for the concept map and control groups ............................................................................................................................... 41
FIGURE 12. Exam 3 mean computational score for the t statistic concept map
proficient and non-proficient users .................................................................................. 46

xi
FIGURE 13. Exam 4 mean total score for the ANOVA concept map proficient and
non-proficient users ......................................................................................................... 47
FIGURE 14. Exam 3 mean computational score for the t statistic proficient concept
map users and the control participants ............................................................................. 48
FIGURE 15. Exam 4 mean conceptual score for the ANOVA proficient concept map
users and the control participants ..................................................................................... 49
FIGURE 16. Exam 4 mean performance for the ANOVA proficient concept map users and the control participants ..................................................................................... 50

xii
LIST OF TABLES
TABLE 1. Instrument and Inter-Rater Reliability Correlations ...................................... 43
TABLE 2. Descriptive Statistics for Agreement Scale Statements from the End of
Training Concept Map Usage Questionnaire.................................................................... 51
TABLE 3. Descriptive Statistics for Agreement Scale Statements from the End of
Semester Concept Map Usage Questionnaire................................................................... 53

1
Introduction
In general, anxiety can be defined as an unpleasant emotional reaction to a
threatening situation (Cheung, 2006). There is also conventional agreement that anxiety
is comprised of two components, trait anxiety and state anxiety. Schwarzer, Van de
Ploeg, and Spielberger (1982) defined trait anxiety as stable, individual differences in
proneness to anxiety and defined state anxiety as a transitory, emotional condition
characterized by subjective, conscious feelings. One study found that trait anxiety
coupled with test difficultly induces state anxiety in some undergraduate students (Head
& Lindsey, 1983). In that study, students were faced with a test situation and those with
higher trait anxiety exhibited significantly higher levels of state anxiety than did students
with low trait anxiety. These results show that test anxiety is frequent in some
undergraduate students.
Liebert and Morris (1967) suggested that test anxiety has two major mechanisms,
worry, or cognitive concern over performance, and emotionality, the automatic arousal of
anxiety in test situations. Wine (1971) speculated on the importance of the worry
component with an attentional interpretation. She believed the adverse effects of test
anxiety to be due to the division of attention between the self and the test. Wine
suggested that high test-anxious students perform poorly because their attention is
directed away from the test and directed towards self-evaluative ruminations. Students
with high levels of test anxiety are believed to have trouble attending to the relevant parts
of a test due to intrusive thoughts and emotional arousal, limiting their capacity to
perform well (Easterbrook, 1959). Studies have shown that test anxiety has negative

2
effects on academic performance (Sarason, 1960; Spielberger, 1966). In this regard, two
anxiety-inducing academic topics that have received attention by researchers are
mathematics (e.g., Adams & Holcomb, 1986; Betz, 1978; Dew, J. P. Galassi, & M. D.
Galassi, 1984) and statistics (e.g., Blalock, 1987; Caine, Centa, Doroff, Horowitz, &
Wisenbaker, 1978; Gaydosh, 1990; Lundgren & Fawcett, 1980; Schacht & Stewart 1990,
1991; Zeidner, 1991).
Math Anxiety, Test Anxiety, and Processing Efficiency Theory
Math anxiety is a negative reaction to situations involving numbers and
mathematical calculations, which ranges from minor irritation to emotional and
physiological disturbance (Ashcraft & Moore, 2009). One conceptualization of math
anxiety is that it is a response to not only mathematical content, but a reaction to
situations in which mathematical skills are evaluated, such as exams (Richardson &
Woolfolk, 1980). This conceptualization is meant to separate math anxiety from test
anxiety, to which math anxiety had previously been regarded as a subtype (Zettle &
Raines, 2000). Research has shown math anxiety measures are more strongly related to
each other than to the components of test anxiety (e.g., Dew, J. P. Galassi, & M. D.
Galassi, 1983). Other research has shown consistent, significant correlations between
measures of math anxiety and test anxiety among college students in psychology and
statistics courses (Adams & Holcomb, 1986; Betz, 1978; Dew et al., 1984).
Zettle and Raines (2000) conducted a study utilizing a measure of trait anxiety, a
measure of test anxiety, and a measure of mathematics anxiety to correlate math anxiety
with test anxiety and trait anxiety in college algebra. Measures of all three anxieties were

3
significantly correlated, but higher correlations were found between math and test
anxiety, and math and trait anxiety than had been previously reported, with the
relationship between math and test anxiety stronger than the relationship between math
and trait anxiety. These results were unexpected, but can be explained in part by the
inclusion of the Mathematics Anxiety Rating Scale (Richardson & Suinn, 1972), as this
inventory included items assessing anxiety during math exams. Zettle and Raines
concluded that maintaining a distinction between math and test anxiety is useful because
individual differences, such as gender or self-efficacy, are associated with higher levels
of math anxiety in individuals exhibiting co-morbid levels of test or trait anxiety.
Research has shown that a relationship between math anxiety and performance exists
(Adams & Holcomb, 1986, Ashcroft & Faust, 1994; Ashcraft & Kirk, 2001; Ma, 1999),
showing that some students are concerned about the effects of anxiety on their grades.
Cates and Rhymer (2003) designed a study to show a stronger relationship
between the math anxiety and math performance of undergraduate students. They found
math anxiety to be related to math performance in a more complex fashion then what was
previously shown. That is, they found that students with lower levels of math anxiety
completed more basic mathematical operations (addition, subtraction, multiplication,
division, and linear equations) correctly per minute than did students with higher levels of
math anxiety. However, they found no differences between low and high math anxiety
students in error rates of the problems completed, meaning that math anxiety is tied to
learning fluency (the ability to quickly and efficiently perform a behavior correctly)

4
rather than to overall performance accuracy (performance when time is not an issue for
the student).
According to Eysenck and Calvo (1992), processing efficiency is inferred from
performance effectiveness and anxiety can have adverse effects on both processing and
performance. As reported by Eysenck (1982), much evidence exists indicating that task
performance is affected by individual differences in trait and test anxiety in several
differing situations. After conducting 24 experiments, the typical result Eysenck found
was that high trait and test anxious individuals performed worse than did low trait and
test anxious individuals when the task was difficult. Impaired performance also became
more consistent under stressful conditions, when the task was difficult, and the
performance gap widened between high trait and test anxious individuals and low trait
and test anxious individuals. Processing efficiency theory was born out of this research,
providing an explanation for the effects of state anxiety on performance. Eysenck and
Calvo (1992) also speculated that this theory is most relevant to high anxiety in normal
populations and test or evaluative stress conditions.
According to processing efficiency theory, worry about task performance impedes
the storage of resources and the processing of one’s working memory system. This point
was illustrated by Ashcraft and Moore (2009), who elaborated on the vulnerability of
working memory to the effects of math anxiety. In that study, math-anxious students
reported trouble in remembering things during exams due to inner-worries and self-
doubts about their math abilities. When these feelings are aroused, a significant decline
in performance may occur, and this decline may worsen as math becomes more abstract,
5
placing a heavier load on working memory (LeFevre, DeStefano, Coleman, & Shanahan,
2005).
Eysenck and Calvo (1992) also purposed that the sense of worry about task
performance serves as motivation, which is exercised via the control system of one’s
working memory. The control system has two major functions, to monitor cognitive
processes for efficiency problems and to introduce corrective resources and strategies to
overcome any problems. The motivation compensates for performance impairments by
allocating the use of additional resources or strategies. High-anxious individuals use
such resources or strategies more frequently than do low-anxious individuals. Successful
processing activities can increase available working memory capacity, leading to
improvements in performance. Eysenck and Calvo (1992) concluded: (a) that state
anxiety is associated with poor processing under exam conditions; and (b) that state
anxiety affects performance based on the availability and utilization of additional
resources and the task demands on working memory. The implications of these
conclusions are relevant to undergraduate exam conditions, but may be more relevant to
more anxiety-inducing subjects, such as statistics (Blalock, 1987; Caine et al., 1978;
Gaydosh, 1990; Lundgren & Fawcett, 1980; Schacht & Stewart 1990, 1991; Zeidner,
1991).
Statistics Anxiety
Statistics anxiety is a particular form of performance anxiety marked by extensive
worry, mental disorganization, and physiological arousal when confronted with statistics
materials (Zeidner, 1991). According to Onwuegbuzie, Da Ros, and Ryan (1997),

6
statistics anxiety is defined by four component anxieties, namely instrument-, content-,
interpersonal-, and failure-anxiety. Instrument anxiety relates to feelings about one’s
ability to calculate statistical formulas. Content anxiety relates to how one feels about
using and communicating personal statistics knowledge. Interpersonal anxiety relates to
how one feels about interacting with an instructor or fellow students. Finally, failure
anxiety relates to feelings about one’s academic performance in a statistics class.
Whether statistics courses contribute to anxiety has been studied at various
universities and settings over the years, with several researchers finding these classes to
be among the most anxiety-inducing (Blalock, 1987; Caine et al., 1978; Gaydosh, 1990;
Lundgren & Fawcett, 1980; Schacht & Stewart 1990, 1991; Zeidner, 1991). Introductory
statistics courses are required for many college students, and many of these students
perceive these classes in an extremely negative manner (Onwuegbuzie, 1997). Students
with statistics anxiety often delay enrolling in courses related to their anxieties
(Onwuegbuzie & Wilson, 2003). This avoidance and other procrastination behaviors,
such as delaying assignments or delayed studying, can lead to lower academic
performance for students in undergraduate courses that emphasize statistics and research
methodology (Onwuegbuzie & Leech, 2003). Moreover, poor academic performance can
affect whether or not students with statistics anxiety continue in their chosen program and
attain a degree (Onwuegbuzie & Wilson, 2003). Onwuegbuzie (1998) found that as
many as 80% of students with high statistics anxiety regard taking a statistics class as a
major threat to degree attainment. Thus, statistics anxiety has a negative effect on
learning (Onwuegbuzie & Seaman, 1995) and is the best predictor of academic

7
achievement in statistics and research methodology courses (Onwuegbuzie & Leech,
2003).
Parallels between Math Anxiety and Statistics Anxiety
Zeidner and Safir (1989) theorized that statistics anxiety develops from a history
of success and failure experiences in situations involving mathematics and is shaped by
an overlap of affective, social, and cognitive factors. Watson, Kromrey, Lang, Hess,
Hogarty, and Dedrick (2003) found that students’ perception of statistics as heavily
mathematical causes high amounts of anxiety in college. Another study found that
psychology statistics students had higher levels of math anxiety than did math students
(Morris, 1978). As it has been theorized for math anxiety, students’ levels of statistics
anxiety, and the learning and performance consequences due to that anxiety, are shaped
by their personal background, prior educational experience, and motivational variables
related to statistics courses taken (Hendel, 1980; Richardson & Woolfolk, 1980; Tobias,
1987). Math-anxious students avoid math coursework and college majors that require
math (Ashcraft & Moore, 2009), a finding that is mirrored by statistics-anxious students
who avoid statistics coursework and college majors that require statistics (Onwuegbuzie
& Wilson, 2003). As has been shown with math anxiety, statistics anxiety is related to,
but also distinguishable from, test anxiety because it includes one’s response to statistics
material in addition to one’s response to statistics exams (Richardson & Woolfolk, 1980).
Zeidner (1991) conducted a study that investigated empirically salient
commonalities between math anxiety and statistics anxiety. His data supported a two-
factor structure for statistics anxiety composed of a statistics test anxiety component and

8
a statistics content component. This structure corresponded well with data reported by
Rounds and Hendel (1981) for a measure of math anxiety comprised of math test anxiety
and numerical anxiety factors. Zeidner also hypothesized that statistics anxiety
negatively correlates with math proficiency and self-efficacy and positively correlates
with certain background experiences, such as math anxiety experience in high school.
The data from Zeidner’s study showed that perceived math ability may play a role in the
level of statistics anxiety experienced, a finding that is consistent with previous research
showing that low math self-esteem reinforces math anxiety (Smith, 1981). Zeidner
suggested prior averse experiences with math, prior poor achievement in math, and low
math self-efficacy as antecedent correlates of statistics anxiety, and these hypotheses
were supported by his study. Finally, Zeidner found a weak relation between statistics
anxiety and statistics course performance. Overall, Zeidner’s study provides evidence
that statistics anxiety mirrors math anxiety in a sample of social science students, and that
statistics anxiety is a potential barrier to a successful college experience in studying
statistics. The question then is how can we help students overcome their statistics anxiety
and have an academically successful experience with college statistics? The answer may
be to provide students with a cognitive study strategy that allows them to more accurately
visualize and understand their internal thoughts about statistics.
Mental Models and Academic Performance
Streitz (1988) defined a mental model as a subjective, extremely personal
knowledge representation. One may have an incomplete or unstable mental model,
reflecting a partial or perhaps false understanding of a concept, or one may have an
9
expert-like mental model, reflecting a complete and useful understanding of a concept
(Hong, 1992). Mayer (1989) found that conceptual models, or words and diagrams that
are intended to help students build mental models, could improve their recall of
conceptual information. However, Mayer did not investigate if these recall
improvements lead to improved performance. Mayer, Dyck, and Cook (1984)
investigated the effects of mental models on performance after providing their
participants with node training, which involved learning the conceptual underpinnings of
key definitions relating to causal systems, and link training, which emphasized the main
relations among the node concepts. They found that the mental model group recalled
significantly more information about the main concepts and their relationships than did
the control group.
Hong and O’Neil (1992) tested the effects of mental model strategies using
students from an introductory statistics course. These researchers concluded that
providing students with mental model strategies significantly facilitated understanding of
the concepts and procedures relevant to hypothesis testing. In addition, instruction
utilizing diagrammatic representation and building personal mental models facilitated the
development of students’ representational ability, thus enhancing their acquisition of
knowledge.
Concept Maps as a Metacognitive Strategy
Concept maps represent a strategy for creating a diagrammatic representation of a
metal model. As developed by Novak (1990), concept maps are representations of one’s
ideational framework, specific to a domain of knowledge. Concept maps include nodes
10
that are filled with concept names or definitions and links that can be labeled with words
that describe interconnections between the nodes (Afamasaga-Fuata’I, 2008). Links that
include words form propositions, which are seen as units of psychological meaning,
giving the concepts represented by the links an idiosyncratic connotation to the person
who created the concept map (Novak, 1990).
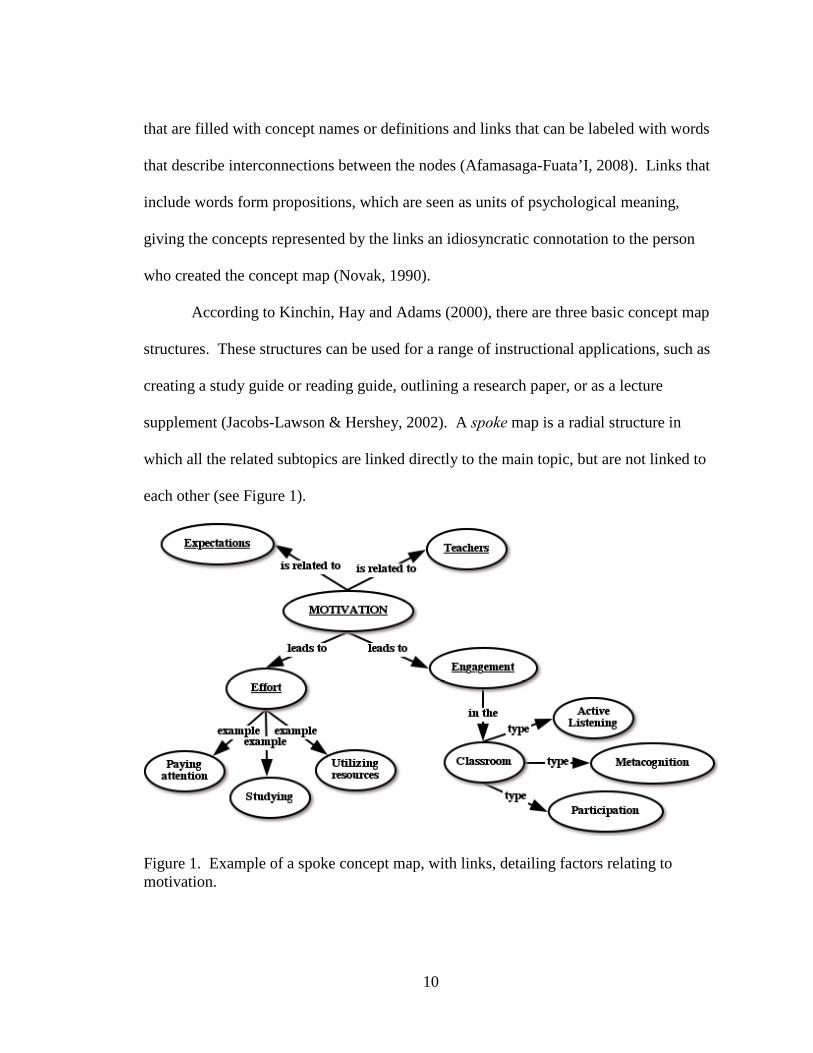
According to Kinchin, Hay and Adams (2000), there are three basic concept map
structures. These structures can be used for a range of instructional applications, such as
creating a study guide or reading guide, outlining a research paper, or as a lecture
supplement (Jacobs-Lawson & Hershey, 2002). A spoke map is a radial structure in
which all the related subtopics are linked directly to the main topic, but are not linked to
each other (see Figure 1).
Figure 1. Example of a spoke concept map, with links, detailing factors relating to motivation.

11
A chain map contains a linear sequence of concepts where each idea is only
linked to the concepts that come immediately before and after it (see Figure 2).
Figure 2. Example of a chain concept map detailing the steps in calculating an analysis of variance.
A net map is a highly integrated and hierarchical network of concepts (see Figure
3).
Figure 3. Example of a net concept map, detailing the different types of experimental research designs.
The use of concept mapping is associated with the constructivist view of learning.
Novak (1993) summarized this view as the belief that individuals construct and
reconstruct the meaning of what they observe. Thus, according to the constructivist view,
knowledge is not discovered, but is created. Novak (1990) developed the technique of
concept mapping based on the work of David Ausubel (1968), whose assimilation theory

12
stressed using prior knowledge to learn new concepts. Concept maps can be described as
a form of metacognitive learning, as they are a strategy that enables the understanding of
one’s existing knowledge (Novak, 1990). Meaningful learning is the process in which
individuals engage when relating new knowledge to existing ideas in a non-verbatim,
non-arbitrary, and substantive fashion (Ausubel, 1968). In principle, concept maps help
learners to engage in this process, which is described as the process underlying
knowledge acquisition and construction, and consequently the foundation for
constructivism (Novak, 1990). Concept maps are a powerful metacognitive strategy for
enabling meaningful learning because they can be applied to any subject and at any level
of schooling.
Concept Maps and Statistics Anxiety
Strategies for alleviating statistics anxiety, such as explaining statistics concepts
to other people (Pan & Tang, 2005), using a humorous teaching style, or addressing the
anxiety (Pan & Tang, 2004) are already in use today. These strategies are useful, but
they only address one component of statistics anxiety (i.e., interpersonal anxiety),
whereas the use of concept maps can provide a strategy for addressing all four
components of statistics anxiety (i.e., instrument, content, interpersonal, and failure
anxieties). Concept maps enable students to show their understanding of statistical
calculations and obtain feedback on possible misconceptions (i.e., instrument and content
anxieties). Concept mapping also gives students a tangible product that they can share
with instructors and other students to promote their ideas and answer their questions (i.e.,
interpersonal anxiety). A concept map is also a modifiable study aid for exams and other

13
course assignments (i.e., content and failure anxieties). Creating concept maps can also
be a collaborative process, which creates opportunities for students to display their
understanding of statistics to another person at an in-depth level and then to synthesize
that shared knowledge into a visual model (i.e., content, interpersonal, and failure
anxieties). Concept maps provide a complete approach to addressing statistics anxiety
and consequently to improving academic performance in a statistics course.
Concept maps have been shown as an effective metacognitive strategy for
reducing the anxiety of students at different levels of education. For example, the use of
concept maps was found to reduce anxiety levels in high school students (Jegede,
Alaiyemola, & Okebukola, 1990) and undergraduate students (Okebukola & Jegede,
1989) taking biology classes. These two studies show that concept maps can alleviate
anxiety about learning material that is perceived as difficult to learn. Statistics is another
set of material that is perceived as difficult to learn (Lackey, 1994). It is very common
for a student to have a limited understanding of mathematics, with this understanding
relating mostly to computational skills with little to no relation to conceptual
understanding (Perry, 2004). Such an incomplete understanding provides no mental
framework for organizing one’s mathematical knowledge, which may make it difficult
for the student to remember what was learned in the past. Given that statistics anxiety is
likely to develop from situations involving mathematics (Zeidner & Safir, 1989), it seems
likely that the same memory difficulties seen in math anxiety also apply to statistics
knowledge. Concept mapping is a metacognitive strategy that may help undergraduate
students remember more conceptual information about statistics.

14
Kesici and Erdogn (2009) found that self-regulated learning (metacognitive)
strategies are predictors of college students’ math anxiety. Specifically, they found that
students who do not consider strategies for elaboration of learning as important have a
decreased probability of academic success in math courses. This implies that a failure to
learn math or statistics stems from the use of inappropriate learning strategies, so it is
recommended that students develop more appropriate learning strategies in order to
succeed in academics (Linnenbrink & Pintrich, 2002). This recommendation is
supported by findings showing the use of metacognitive strategies, such as concept
mapping, to lead to better performance in college students (Metallidou & Viachou, 2007).
Concept Maps and Academic Performance
Lavigne (2005) found that concept maps are useful in revealing the relationships
between statistical concepts that are often not articulated by statistics faculty. In this
study, such articulation allowed the creators of the concept maps to clarify their ideas and
also allowed for an observer to evaluate the creators’ amount of underlying knowledge.
Research has also shown that concept maps allow the identification of misconceptions
held by the creator (McClure, Sonak, & Suen, 1999). Employing the use of concept
maps could make statistical concepts more salient to students, helping them to gain a
more complete, organized understanding of statistical theory and to know when to
properly apply relevant principles. Generative concept mapping (allowing students to
create their own maps) supports the effective organization of knowledge (Lee & Nelson,
2005), allowing learners to solve structured problems more efficiently than traditional
concept mapping methods (giving students a completed concept map). This benefit of

15
concept maps can improve student performance for those who skip steps or make minor
mistakes when calculating a formula or solving a challenging problem.
Torre, Kromrey, Lang, Hess, Hogarty, and Dedrick (2007) found concept
mapping to be an effective learning method and teaching methodology for medical
students. In their experiment, the use of concept maps facilitated knowledge integration
and critical thinking, which, in turn, fostered positive connections between theory and
practice. Like the medical students in Torre and colleagues study, statistics students have
trouble understanding the theoretical basis of the material they study, so statistics anxiety
is prevalent among students enrolled in statistics courses (Onwuegbuzie & Wilson,
2003). Bartz, Amato, Rasor, and O’Neil-Rasor (1981) found evidence to support the
relationship between statistics anxiety and theoretical understanding of statistics, as they
found that lowering statistics students’ anxiety led to an increase in statistics knowledge.
Studies have shown that the primary benefit of a concept map accrues to the person who
creates the map, not the person evaluating the map (e.g., Bogden, 1977; Cardemone,
1975). This being so, the intention of the present study was to teach statistics students
how to create their own maps so they receive the benefits directly. By providing statistics
students with a strategy for understanding statistics theory, we should be able to alleviate
their statistics anxiety and in turn improve their academic performance in a statistics
course.
Study Aims and Predictions
The aim of the current study was to empower statistics students to gain an
individualized understanding of statistics theory, in order to ease their statistics anxiety.

16
According to processing efficiency theory (Eysenck & Calvo, 1992), anxiety can have
negative effects on performance, thus the reduction of statistics anxiety should lead to
less negative effects on performance and, in turn, improved exam scores. By studying
the use of concept mapping in an undergraduate statistics course we could examine the
effect of concept map use on statistics anxiety and performance.
Two undergraduate statistics classes were recruited for this study with one serving
as the treatment (concept map) group and one serving as the control (i.e., standard
instruction) group. We hypothesized that the use of concept mapping would decrease the
statistics anxiety of students in the concept map group compared to those in the control
group. We also hypothesized that the use of concept mapping would improve the
academic performance of students in the concept map group, resulting in significantly
better exam performance compared to the control group.

17
Methods
Participants
In total, 101 undergraduate students attending San José State University (SJSU)
were recruited from two lower-division, introductory statistics classes to participate in
this study. Of these participants, 75 (51 female, 24 male) completed the demographics
questionnaire. Based on the demographics data, the average age was 19.34 (SD = 2.53),
with ages ranging between 18 and 32. The participants were a less experienced group in
terms of academic standing, with freshman (35) and sophomores (16) making up two
thirds of the sample and the remaining third consisting of juniors (13) and seniors (11).
A wide range of ethnicities including White (27%, n = 20), Black (7%, n = 5), Hispanic
(19%, n = 14), Asian (31%, n = 23), American Indian (1%, n = 1), as well as participants
of mixed heritage (16%, n = 12) were present in this sample, mirroring the diverse ethnic
composition of SJSU students. IRB approval was obtained prior to the recruitment of
participants. All standards for ethical treatment of participants set forth by the APA,
including obtaining informed consent and maintaining confidentiality, were followed at
all times during this study.
Design
The study utilized a 2 x 3 mixed factorial design, with concept map usage as the
between-subjects factor and time of measurement as the within-subjects factor, to
examine the effect of concept mapping on statistics anxiety. The Statistics Anxiety
Rating Scale (STARS; Cruise, 1985) was used to measure the statistics anxiety present in
the experiment participants. A 2 x 4 mixed factorial design, with concept map usage as

18
the between-subjects factor and time of measurement as the within-subjects factor, was
used to examine the effect of concept mapping on academic performance. The four
module exams administered during the semester were used to measure the academic
performance of the experiment participants.
Setting and Apparatus
The study took place in two standard university classrooms with maximal
occupancies between 48 and 62 people. The concept map room was furnished with rows
of single-occupancy student desks arranged so that students sat behind one another. The
control room was furnished with long tables arranged in rows and oriented in parallel to
the front of the class such that students sat side-by-side. Both rooms were equipped with
large whiteboards and overhead LCD projectors used for slide presentations. The
classroom whiteboards (with markers) and projectors were utilized during classroom
activities. The concept map class was held weekly on Monday and Wednesday from
9:00 a.m. to 10:15 a.m. and the control class was held weekly on Tuesday and Thursday
during the same time period. The same professor taught each class, with the participants
being recruited from each class, by the instructor, on a volunteer basis.
Materials
Extra credit assignments. Six concept map training worksheets were assigned
only to the concept map class between the beginning and 8-week point of the 16-week
semester. These worksheets included matching words and phrases to the corresponding
concept map node or link (see Appendix A). Inspiration software (V. 8; Inspiration®
Software, Inc., Beaverton, OR) was used to create the concept maps for the worksheets.

19
The participants in the concept map class were also asked to create four original concept
maps between the 8-week point and end of the 16-week semester. The concept map class
participants received extra credit for each completed concept map worksheet and each
completed map of the first three original concept map assignments. A more detailed
discussion of the concept map worksheets and original map assignments will be
presented in the Procedure section below.
Over the course of the entire 16-week semester, the participants in the control
class were assigned seven crossword puzzles containing statistics terms from the assigned
textbook (Gravetter & Wallnau, 2008). The crosswords were supplemental materials that
came with the textbook. The control class participants were also asked to complete two
additional online tutorial assignments that were created by the professor. For these
assignments, the students in the control class had to apply statistics material learned in
class to real world situations and then answer brief questions related to the situation. The
control class participants received extra credit for each completed crossword puzzle and
each completed online tutorial assignment. The first six crossword puzzles were assigned
during the first two class modules. The final crossword puzzle and the two online tutorial
assignments were completed during the third class module.
Demographics. Each class had the first two weeks of the semester to complete a
demographics questionnaire. This measure asked the participants to record their sex, age,
race, college major and minor, academic standing, their number of completed college
units, prior undergraduate statistics or research methodology course experience and high
school mathematics and statistics experience (see Appendix B).

20
Concept map usage. The concept map training for the concept map class ended
right before the 8-week point of the semester. At this point, the participants in the
concept map class completed a concept map usage questionnaire containing 14 questions.
These participants also completed a concept map usage questionnaire, containing 11
questions, at the end of the semester. Each of these inventories was based on a 5-point
Likert-type agreement scale. The questions were regarding topics such as how many
occasions per week the students used concept mapping techniques inside and outside of
class, how useful they felt the concept map lessons and activities were for learning
statistics, which type of maps they preferred (spoke, chain, or net) for statistics concept
maps, how useful they felt the maps were for increasing their theoretical understanding of
statistics, and how useful they felt the maps were for decreasing their anxiety (see
Appendices C and D).
Statistics Anxiety Rating Scale (STARS). Each class completed the STARS on
three occasions, at the beginning, midpoint, and end of the semester. This inventory is
based on a 5-point Likert-type scale and has 51 items. The first 23 questions (part 1)
pertain to situations associated with statistics anxiety. The response scale for part 1 was
anchored with a 1 (No Anxiety) and a 5 (Very Much Anxiety) and was based on level of
anxiety. The final 28 questions (part 2) pertain to statistics, but are not related to
situations associated with statistics anxiety. The response scale for part 2 was also
anchored with a 1 (Strongly Disagree) and a 5 (Strongly Agree), but was based on level
of agreement rather than level of anxiety.
21
Each part of the STARS includes three subscales of questions, meaning a total of
six subscales are included in this inventory. Part 1 includes the Interpretation Anxiety
(11 items, e.g. “Trying to decide which analysis is appropriate for your research
project.”), Test and Class Anxiety (8 items, e.g. “Doing the final examination in a
statistics course.”), and Fear of Asking for Help (4 items, e.g. “Going to ask my statistics
teacher for individual help with material I am having difficulty understanding.”)
subscales. Part 2 includes the Worth of Statistics (16 items, e.g. “I don’t see why I have
to clutter up my head with statistics. It has no significance to my life work.”),
Computational Self-concept (7 items, e.g. “Since I’ve never enjoyed mathematics, I don’t
see how I can enjoy statistics.”), and Fear of Statistics Teachers (5 items, e.g. “Statistics
teachers are so abstract they seem inhuman.”) subscales.
The STARS inventory is the most utilized measure of statistics anxiety and the
only one that has been subjected to studies of validity (Onwuegbuzie & Wilson, 2003).
Mji and Onwuegbuzie (2004) found this scale to have acceptable internal consistency,
reliability coefficients, and construct validity as a whole and for each subscale.
According to Mji and Onwuegbuzie, scores on the STARS inventory have been
correlated with scores on the Mathematics Anxiety Scale (Betz, 1978), yielding a large
statistically significant correlation coefficient, r = .76 (p < .01), which provides evidence
for the concurrent validity of the STARS inventory. Onwuegbuzie (1999) reported
coefficient alpha ranging from .78 (Worth of Statistics) to .84 (Test and Class Anxiety),
with a median of .80, on the six subscales of the STARS inventory, which shows high
internal consistency.
22
For this study, a single STARS score (out of 250) was calculated for each
participant at each time of measurement by summing the responses to each question
making up the STARS scale. A part 1 score (out of 110) was also calculated for each
participant at each time of measurement by summing the responses to each question
making up the part 1 subscales. Finally, a part 2 score (out of 140) was calculated for
each participant at each time of measurement by summing the responses to each question
making up the part 2 subscales. The higher the score, on any of these measures, the more
anxiety a respondent was reporting.
SJSU Blackboard. The demographics, concept map usage, and STARS
questionnaires were all posted on the SJSU Blackboard learning management system
(Blackboard®, Inc., Washington, DC). This system allows students to monitor their
grades, discuss course topics in online forums, and to download class materials, among
other academic functions. This website was accessible to all of the participants. Each
questionnaire was created using the survey tool found on the instructor page. It was the
responsibility of each student to log on to the SJSU Blackboard webpage and complete
each questionnaire.
Concept map rubric and quantitative analysis. The experimenter created a
qualitative scoring rubric (see Appendix E) to be used in conjunction with a quantitative
analysis of concept map structure. The rubric was developed through examining other
concept map rubrics, identifying useful segments from those rubrics, and finally
synthesizing ideas from those segments into a new rubric. This rubric was separated into
four sections of evaluation: Content Organization, Structure, Communication, and

23
Overall Presentation. For the Content Organization section, each map was assessed on
overall organization, format, and appropriateness of main topic and sub-topics. For the
Structure section, each map was assessed on the clearness of nodes and links. For the
Communication section, each map was assessed on the overall effectiveness of the map
structure in communicating the inherent relationships between the main topic and sub-
topics. For the Overall Presentation section, each map was assessed on the overall level
of discernible, understandable information presented in the map. Between 0 and 3 points
were given for each section and then each section point total was added up to form a total
rubric score, making 12 points the maximum score possible. The final structure of this
new rubric included sections covering ideas addressed in each of the other rubrics that
were examined, while leaving out ideas that were not as widely addressed. This method
was used in order to ensure the face validity and content validity of the new rubric.
For the quantitative analysis of concept map structure, the number of components
(nodes, links, etc.) was used as the basis for assigning a score to each map (Kinchin, Hay
& Adams, 2000). For our analysis, we counted the number of nodes, links, levels of
differentiation between concepts (or branches), pictures, colors, and statistical formulas,
and added those numbers together to form a total quantitative score. A point was also
awarded for using the correct concept map structure, because two of the map assignments
requested the use of the net or spoke structure rather than the chain structure.
Academic performance. The academic performance of all the participants was
measured four times over the course of the semester, with an exam at the end of each
course module. Each exam consisted of two parts, with one section containing 25

24
multiple-choice questions and a computational section typically consisting of a vignette
followed by five to seven questions requiring the student to apply and compute the
statistical procedures taught during that module. The multiple-choice questions were
written to assess the students’ conceptual and/or applied knowledge of the statistical
concepts covered within a module. Very few simple recall-type questions (e.g.,
recognizing definitions, formulas, etc) were used in the exams. These questions were
created by the instructor and were drawn from both the textbook and class lectures. A
single exam score, out of 50, was calculated for all participants by summing the correct
responses to each question making up an exam, with a separate score being calculated at
each of the four times of measurement. A conceptual exam score, out of 25, was
calculated for all participants by summing the correct responses to each question making
up the multiple-choice section, with a separate score being calculated at each of the four
times of measurement. A computational exam score, out of 25, was calculated for all
participants by summing the correct responses to each question making up a vignette
section followed by five to seven questions requiring the student to apply and compute
the statistical procedures taught during that module section, with a separate score being
calculated at each of the four times of measurement. The higher the total, conceptual, or
computational score, the more total, conceptual, or computational understanding of
statistics knowledge the participant was demonstrating.
Procedure
Experiment introduction. All of the participants shared the same professor, who
taught two introductory statistics sections during the same semester. On the first day of

25
class for both the concept map group and the control group, the experimental procedures
were explained and informed consent was obtained from the students from each group
that elected to participate in the study. In the concept map class only, the experimenter
gave an introductory concept map presentation, after the professor’s lecture. This
introductory presentation included background information on the cognitive theories
developed by Ausubel (1968), the underlying theory of concept mapping developed by
Novak (1993), and examples of the three types of concept maps outlined by Kinchin,
Hay, and Adams (2000). The initial presentation slides allowed for the examination of
sample maps, included information about the different parts of a concept map, the
function of each part, and how the flow of ideas about a particular topic can be conveyed
using a concept map. Each group was given the first few weeks of the semester to
complete the demographics questionnaire and the initial STARS inventory.
This study involved two groups, but the control group did not receive any concept
map training or any additional study skill instruction. The professor followed the same
curriculum for each group, and the experimenter conducted the concept map
presentations and activities, handed out and explained the concept map worksheets, and
explained the concept map usage surveys for the concept map group only. The
curriculum consisted of lessons on descriptive statistics during module one, lessons on
probability and sampling during module two, lessons on hypothesis testing and the t
statistic during module three, and lessons on analysis of variance (ANOVA) during
module four.

26
Concept map training. Over the course of the first 8 weeks of the semester
(modules one and two), the concept map group received instructions on how to generate
concept maps. To train the concept map class in creating and using concept maps,
sample concept maps were presented using standard presentation software. This class
listened to five concept map presentations, each lasting between 5 and 10 min., which
included the modeling of techniques for creating concept maps by the experimenter.
During this time, this class also participated in five concept map activities, creating maps
individually twice and creating maps as a group three times. Students created concept
maps for z-scores, standardizing distributions, probability, central limit theorem, and
standard error on the mean. For an individual training activity, each student created a
concept map, and then volunteers would draw their maps on the whiteboard and explain
them to the rest of the class. For a group training activity, the students formed a group of
three or four and created a concept map as a team. Then volunteers from some of the
teams drew their group maps on the whiteboard and explain them to the rest of the class.
The lectures and activities covered the following topics; (a) brainstorming ideas
using concept maps, (b) using concept maps as a memory aide, (c) summarizing a topic
using concept maps, (d) illustrating a step by step process using a concept map, (e) using
concept map links to convey ideas, (f) comparing topics using concept maps, and (g)
using concept maps to review for an exam. The concept map participants also completed
six concept map worksheets, three covering topics from the first module and three
covering topics from the second module. The concept map worksheet topics were types
of data, frequency distributions, measures of central tendency, z-scores, probability, and

27
central limit theorem. After the first concept map worksheets had been turned in, the
experimenter reviewed the assignment with the entire concept map class.
During the class period before the first exam, there was also an informal,
anonymous evaluation conducted to check how well the participants in the concept map
class understood concept maps. The experimenter asked the participants to answer yes or
no to the following statements: (a) “I understand what a concept map is,” (b) “I
understand the different types of concept maps,” (c) “I understand when to use each type
of concept map,” (d) “I use concept maps to organize my notes in class,” and (e) “I use
concept maps to organize my materials outside of class.” The experimenter also made
the following open-ended request of the students, “Write down any questions that you
have regarding concept maps.” The participants were then handed in their responses
without writing down their names. After reviewing the responses, the experimenter
created a concept map review sheet, specifically addressing all of the questions posed by
the concept map class. This sheet was then posted on the concept map group Blackboard
page, for the participants in that group to download and review. The concept map
training portion of the experiment ended with the second module exam. At the midway
point of the semester, after the second module, both the concept map and the control
groups completed a second STARS inventory. Also at this time, the concept map group
completed the first concept map usage questionnaire.
Original concept maps. Over the course of the second 8 weeks of the semester
(modules three and four), the concept map group received no further instruction and
completed only two group concept maps activities. The topics of the two group activities
28
were one- and two-tailed hypothesis tests and the independent samples t test. Each
participant also created four original concept maps, with two covering topics from the
third module and two covering topics from the forth module. The concept map topics
were hypothesis testing, the t statistic, estimation, and ANOVA. After the first original
concept map had been turned in, the experimenter reviewed the assignment with the
entire concept map group during class time.
The experimenter used a qualitative rubric and a quantitative analysis of concept
map structure to assess the four original concept maps created by the concept map group
participants. For the hypothesis testing and ANOVA concept map assignments, the only
requirement was that the students created either a spoke or net type map. Creating a
chain map was not permitted for these assignments because this type of map does not
allow for various levels of differentiation (i.e. it can only describe a sequence of events).
There were no requirements for the t statistic or estimation maps because these concepts
do not contain as many levels of differentiation as the topics of hypothesis testing and
ANOVA. At the end of the semester, both the concept map and the control groups
completed a third and final STARS inventory. The concept map group also completed a
second, modified concept map usage questionnaire. All of the concept map worksheets
and original concept maps were returned to the concept map group participants.

29
Results
Problematic Data
In preparing the demographics and concept map usage data for analysis, an
uncorrectable error in collection was detected. These questionnaires were created as
anonymous surveys and posted on the SJSU Blackboard system for the courses involved
in this study. It was the belief of the researchers that the survey set up would allow the
tracking of each participant’s assigned code number, while keeping only their name
hidden. This did not turn out to be the case, as the SJSU Blackboard system kept the
information collected from each participant completely anonymous. We attempted to
recover the identifying data, but all our attempts proved fruitless. Consequently, we were
unable to identify individual demographic, concept map usage, and anxiety data for the
study participants. As such, we were unable to use these data to conduct within group
analyses as originally proposed.
In addition, the data collected using the STARS surveys posted on the SJSU
Blackboard system was found to be problematic in the same way as the demographics
and concept map usage data. However, we were still able to include these data in the
group analyses conducted, as the STARS data for the concept map and control groups
was separated by each courses’ individual Blackboard webpage. This data error
prevented us from examining individual cases from the STARS data to see if any
interactions with the other variables existed.

30
Statistics Anxiety Findings
STARS reliability. Cronbach’s alpha (α) was used to estimate the reliability of
the STARS scale items. The subscale yielding the lowest alpha was Fear of Statistics
Teachers (α = .75), and the subscale yielding the highest alpha was Worth of Statistics (α
= .92). The remaining four subscales ranged between these low and high points,
beginning with Fear of Asking for Help (α = .82), then Interpretation Anxiety (α = .85),
next Test and Class Anxiety (α = .86), and finally Computation Self-Concept (α = .87).
All of these estimates indicate acceptable internal consistency for the STARS subscales
(Nunnally, 1994).
Overall statistics anxiety. At the beginning of the semester, the concept map
group (M = 123.73, SD = 22.82, n = 41) and the control group (M = 122.19, SD = 21.24,
n = 31) demonstrated practically equal overall anxiety scores. Then, at the midpoint of
the semester, the concept map group (M = 109.70, SD = 23.52, n = 30) produced an
overall 14-point drop in anxiety score, while the control group (M = 118.56, SD = 25.25,
n = 34) produced an approximate 4-point drop in anxiety score. Each group maintained
about the same level of anxiety until the end of the semester, with the concept map group
overall score (M = 110.31, SD = 24.35, n = 35) increasing slightly more than the control
group overall score (M = 118.95, SD = 23.88, n = 41). Figure 4 shows the patterns of
STARS scores over the semester for each condition.

31
Figure 4. Mean STARS scores for the concept map and control groups. Note. Error bars represent +/-1SE.
A mixed analysis of variance was used to analyze the overall (parts 1 and 2
combined) STARS data, with time as a repeated measures factor and the experimental
conditions as a between-subjects factor. A significant decline in anxiety scores was
observed over time for both the concept map and control groups, F(2, 94) = 3.25, p =
.043, η2 = .063, meaning the concept map and control group each felt less anxiety as the
semester progressed. However, there was no main effect of treatment condition (i.e.,
concept mapping vs. control) on anxiety, F(1, 47) = 0.20, p = .651, η2 = .004, nor was
there a significant interaction between the two groups on anxiety over time, F(2, 94) =
1.20, p = .305, η2 = .023.
STARS part 1: Statistical anxiety. At the beginning of the semester, the
concept map group (M = 62.95, SD = 15.02, n = 42) and the control group (M = 63.33,
SD = 12.48, n = 33) demonstrated practically equal levels of anxiety. Then, at the

32
midpoint of the semester, the concept map group (M = 56.00, SD = 14.12, n = 30)
produced an overall 9-point drop in anxiety score, whereas the control group (M = 62.72,
SD = 15.08, n = 35) maintained about the same level of anxiety. Each group maintained
about the same level of anxiety until the end of the semester, with the concept map group
overall score (M = 55.72, SD = 15.02, n = 36) decreasing slightly less than the control
group overall score (M = 61.59, SD = 15.36, n = 41). Figure 5 shows the patterns of
statistics anxiety subscale scores over the semester for each condition.
Figure 5. Mean STARS part 1 scores for the concept map and control groups. Note. Error bars represent +/-1SE.
A mixed analysis of variance was used to analyze part one of the STARS scale
data, with time as a repeated measures factor and the experimental conditions as a
between-subjects factor. There was no significant main effect of time for this measure,
F(2, 102) = 2.61, p = .078, η2 = .048, nor was there a significant main effect of group,
F(1, 51) = 1.43, p = .236, η2 = .0005. Also, no significant interaction was identified

33
between the two groups on part one of the STARS, F(2, 102) = 0.66, p = .518, η2 = .012.
Collectively these analyses show that concept mapping did not have a significant effect
on the Interpretation Anxiety, Test and Class Anxiety, or Fear of Asking for Help forms
of statistics anxiety.
STARS part 2: General statistics. At the beginning of the semester, the concept
map group (M = 61.29, SD = 19.06, n = 41) demonstrated more general statistics anxiety
than did the control group (M = 59.27, SD = 14.31, n = 33). Then, at the midpoint of the
semester, the concept map group (M = 53.28, SD = 16.28, n = 32) produced an overall 8-
point drop in anxiety score, whereas the control group (M = 55.71, SD = 17.07, n = 35)
produced about a 4-point drop in anxiety score. At the end of the semester, the concept
map group (M = 54.31, SD = 19.31, n = 36) anxiety level increased by a point, and the
control group (M = 57.37, SD = 17.97, n = 41) anxiety level increased by about 2 points.
Figure 6 shows the patterns of general statistics subscale scores over the semester for
each condition.

34
Figure 6. Mean STARS part 2 scores for the concept map and control groups. Note. Error bars represent +/-1SE.
A mixed analysis of variance was used to analyze part two of the STARS scale
data, with time as a repeated measures factor and the experimental conditions as a
between-subjects factor. No significant main effect of time was found for this measure,
F(2, 98) = 2.05, p = .133, η2 = .039, nor was there a significant main effect of group, F(1,
49) = 0.00, p = .933, η2 = .000006. Also, no significant interaction was identified
between the two groups on part two of the STARS, F(2, 98) = 1.38, p = .255, η2 = .026.
Collectively these analyses show that concept mapping did not have a significant effect
on the Worth of Statistics, Computation Self-Concept, or Fear of Statistics Teachers
forms of statistics anxiety.
STARS subscales. At the beginning of the semester, the concept map group (M
= 27.40, SD = 7.36, n = 42) demonstrated about a point less interpretation anxiety than
did the control group (M = 28.45, SD = 7.08, n = 33). Then, at the midpoint of the

35
semester, the concept map group (M = 25.52, SD = 6.05, n = 29) produced about a 2-
point drop in anxiety score, and the control group (M = 28.49, SD = 6.89, n = 35)
maintained about the same level of interpretation anxiety. At the end of the semester, the
concept map group’s (M = 24.31, SD = 7.00, n = 36) anxiety level decreased by a little
more than a point, where the control group (M = 28.50, SD = 7.37, n = 40) again
maintained about the same level of interpretation anxiety. For the Interpretation Anxiety
subscale there were significant differences found between the two groups, confirming an
effect of concept mapping on this form of statistics anxiety, F(1, 60) = 8.24, p = .006, η2
= .003. No other subscale displayed a main effect of group, specifically Test and Class
Anxiety, F(1, 58) = 3.76, p = .057, η2 = .001, Fear of Asking For Help, F(1, 61) = 0.51, p
= .474, η2 = .0003, Worth of Statistics, F(1, 62) = 0.91, p = .341, η2 = .0003,
Computational Self-Concept, F(1, 62) = 0.18, p = .672, η2 = .0001, and Fear of Statistics
Teachers, F(1, 63) = 2.10, p = .152, η2 = .001. Figure 7 shows the patterns of
Interpretation Anxiety scores over the semester for each condition.

36
Figure 7. Mean Interpretation Anxiety scores for the concept map and control groups. Note. Error bars represent +/-1SE.
At the beginning of the semester, the concept map group (M = 9.85, SD = 3.95, n
= 41) and the control group (M = 9.91, SD = 4.01, n = 33) demonstrated practically equal
amounts of Fear of Statistics Teachers anxiety. Then, at the midpoint of the semester, the
concept map group (M = 7.84, SD = 2.92, n = 32) produced about a 2-point drop in
anxiety score, where the control group (M = 8.66, SD = 3.46, n = 35) produced a little
more than a 1-point drop in anxiety score. At the end of the semester, the concept map
group (M = 7.89, SD = 2.71, n = 36) and the control group (M = 8.76, SD = 3.36, n = 41)
maintained about the same level of anxiety as measured during the midpoint of the
semester. For the Fear of Statistics Teachers subscale there was a significant main effect
of time, F(2, 126) = 4.49, p = .013, η2 = .066, but no significant differences were
identified between the two groups on this subscale over time, F(2, 126) = 0.07, p = .928,
η2 = .001. No other subscale displayed a main effect of time, specifically Test and Class

37
Anxiety, F(2, 116) = 1.20, p = .302, η2 = .020, Interpretation Anxiety, F(2, 120) = 1.15, p
= .318, η2 = .018, Fear of Asking For Help, F(2, 122) = 2.60, p = .078, η2 = .040, Worth
of Statistics, F(2, 124) = 0.22, p = .797, η2 = .003, and Computational Self-Concept, F(2,
124) = 1.88, p = .156, η2 = .029. No other subscale displayed a significant interaction
between the two groups, specifically Test and Class Anxiety, F(2, 116) = .376, p = .687,
η2 = .006, Interpretation Anxiety, F(2, 120) = 1.01, p = .365, η2 = .016, Fear of Asking
For Help, F(2, 122) = 0.70, p = .494, η2 = .011, Worth of Statistics, F(2, 124) = 0.22, p =
.796, η2 = .003, and Computational Self-Concept, F(2, 124) = 0.11, p = .895, η2 = .001.
Figure 8 shows the patterns of Fear of Statistics Teachers scores over the semester for
each condition.
Figure 8. Mean Fear of Statistcs Teachers anxiety scores for the concept map and control groups. Note. Error bars represent +/-1SE.

38
Statistics Exam Performance Findings
Overall exam performance. For exam 1, the concept map group (M = 41.52, SD
= 5.64, n = 49) and the control group (M = 41.55, SD = 4.93, n = 52) demonstrated equal
levels of performance. For exam 2, the concept map group (M = 39.63, SD = 8.32, n =
49) produced practically equal scores as the control group (M = 39.37, SD = 8.29, n =
52). For exam 3, the concept map group (M = 38.71, SD = 7.98, n = 47) again produced
practically equal scores as the control group (M = 38.46, SD = 7.06, n = 52). The same
pattern continued for exam 4, with the concept map group (M = 38.90, SD = 8.02, n = 47)
scoring equally well as the control group (M = 38.76, SD = 6.53, n = 51). Figure 9 shows
the patterns of overall exam scores over the semester for each condition.
Figure 9. Mean exam performance for the concept map and control groups.
Note. Error bars represent +/-1SE.
A mixed analysis of variance was used to analyze the overall (conceptual and
computational scores combined) exam data, with time as a repeated measures factor and

39
the experimental conditions as a between-subjects factor. A significant main effect of
time was found, F(3, 285) = 7.24, p < .001, η2 = .070, showing that academic
performance changed for both the treatment and control group from the beginning to the
end of the semester. However, there was no significant main effect of group, F(1, 95) =
0.05, p = .811, η2 = .00001, showing that concept mapping did not have a significant
effect on academic performance for the concept map group. There was also no
significant interaction identified between the two groups on overall performance, F(3,
285) = 0.07, p = .972, η2 = .0007.
Exam performance: Conceptual questions. For exam 1, the concept map group
(M = 18.76, SD = 3.65, n = 49) and the control group (M = 18.60, SD = 3.47, n = 52)
demonstrated practically equal levels of performance. For exam 2, the concept map
group (M = 19.00, SD = 3.94, n = 49) again produced practically equal scores as the
control group (M = 18.50, SD = 4.46, n = 52). For exam 3, the concept map group (M =
17.49, SD = 3.94, n = 47) produced slightly higher scores than the control group (M =
17.17, SD = 3.75, n = 52). For exam 4, the concept map group (M = 16.87, SD = 4.68, n
= 47) produced an overall average that was a point higher than that of the control group
(M = 15.76, SD = 4.69, n = 51). Figure 10 shows the patterns of exam conceptual scores
over the semester for each condition.
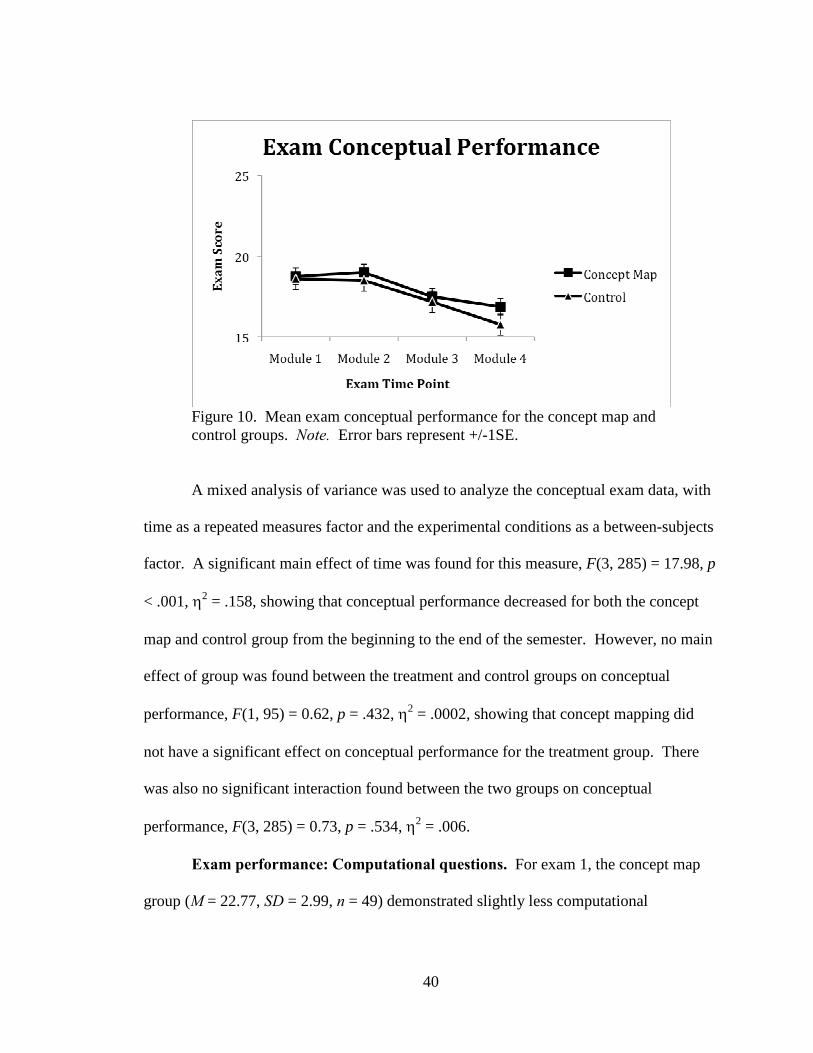
40
Figure 10. Mean exam conceptual performance for the concept map and
control groups. Note. Error bars represent +/-1SE.
A mixed analysis of variance was used to analyze the conceptual exam data, with
time as a repeated measures factor and the experimental conditions as a between-subjects
factor. A significant main effect of time was found for this measure, F(3, 285) = 17.98, p
< .001, η2 = .158, showing that conceptual performance decreased for both the concept
map and control group from the beginning to the end of the semester. However, no main
effect of group was found between the treatment and control groups on conceptual
performance, F(1, 95) = 0.62, p = .432, η2 = .0002, showing that concept mapping did
not have a significant effect on conceptual performance for the treatment group. There
was also no significant interaction found between the two groups on conceptual
performance, F(3, 285) = 0.73, p = .534, η2 = .006.
Exam performance: Computational questions. For exam 1, the concept map
group (M = 22.77, SD = 2.99, n = 49) demonstrated slightly less computational

41
understanding than the control group (M = 22.95, SD = 2.72, n = 52). For exam 2, the
concept map group (M = 20.63, SD = 5.38, n = 49) again produced lower scores than the
control group (M = 20.87, SD = 4.64, n = 52). For exam 3, the concept map group (M =
21.22, SD = 4.81, n = 47) produced approximately equal scores as the control group (M =
21.29, SD = 4.05, n = 52). For exam 4, the concept map group (M = 22.03, SD = 4.64, n
= 47) overall score was a point higher than that of the control group (M = 23.00, SD =
2.96, n = 51). Figure 11 shows the patterns of exam computational scores over the
semester for each condition.
Figure 11. Mean exam computational performance for the concept map and control groups. Note. Error bars represent +/-1SE.
A mixed analysis of variance was used to analyze the computational exam data,
with time as a repeated measures factor and the experimental conditions as a between-
subjects factor. A significant main effect of time was found for this measure, F(3, 285) =
9.70, p < .001, η2 = .092, showing that computational performance initially decreased,

42
then slightly increased for both the concept map and control groups from the beginning to
the end of the semester. However, no main effect of group was found between the
treatment and control groups on computational performance, F(1, 95) = 0.16, p = .685, η2
= .00003, showing that concept mapping did not have a significant effect on
computational performance for the treatment group. There were also no significant
interaction found between the two groups on computational performance, F(3, 285) =
0.28, p = .834, η2 = .002.
Concept Mapping Proficiency
Concept map assessment reliability. The proficiency of a participant’s concept
mapping was assessed using two approaches, namely, the quantitative map scoring and
the qualitative concept map rubric (which were combined to form a single concept map
score). In order to assess the reliability of these measures, Pearson correlations were
conducted in order to compare the concept map quantitative scores and the concept map
qualitative (rubric) scores for each of the four sets of concept maps. The correlation for
the third concept map on estimation approached significance with a p value of .055. The
lack of significance between the quantitative and rubric scores for the estimation map
may be due to small sample size, as only 25 maps were included in the analysis, opposed
to between 30 and 37 maps being included in the analyses of the other three concept map
quantitative and rubric scores. All of the three remaining correlations were significant.
These correlations are listed in Table 1.

43
Table 1
Instrument and Inter-Rater Reliability Correlations
Concept Map Set Assessment Instruments
Inter-Rater Reliability
1. Hypothesis Testing .58*** .98***
2. t statistic .47** .97***
3. Estimation .39 .98***
4. ANOVA .44* .99***
Note. Two-tailed significance tests were used. * p < .05, ** p < .01, *** p < .001
To examine the inter-rater reliability of the concept map scoring method used in
this experiment, an independent rater scored 10 maps from each of the four original
concept map assignment pools of participant maps. The 10 maps from each pool were
randomly chosen (http://www.random.org/). The independent rater was taught to score
the maps using the quantitative and rubric techniques and then to combine those scores
into a single concept map score. Pearson correlations between the experimenter and
independent rater concept map scores were computed. These correlations are also listed
in Table 1. All four of the inter-rate correlations were significant, providing evidence for
the reliability of the concept maps scoring techniques used in this experiment.
Proficient and non-proficient ratings. In order to categorize the treatment
participants into concept map usage groups (proficient users and non-proficient users), a
median split was conducted for each of the four original map assignment pools. The
median score for the hypothesis testing map was 35, so any participant creating a map

44
with a score of 35 or higher was classified as proficient on this map topic and any
participant creating a map with a score lower than 35 was classified as non-proficient on
this map topic. For the hypothesis testing map, the proficient group (M = 47.83, SD =
13.37, n = 18) represented a range of scores between 35 and 81, whereas the non-
proficient group (M = 26.09, SD = 5.66, n = 17) represented a range of scores between 15
and 34. The median score for the t statistic map was 35. For the t statistic map, the
proficient group (M = 43.95, SD = 6.46, n = 19) represented a range of scores between 35
and 58.5, where the non-proficient group (M = 24.67, SD = 6.21, n = 18) represented a
range of scores between 13 and 32. The median score for the estimation map was 38.5.
For the estimation map, the proficient group (M = 43.42, SD = 3.45, n = 13) represented a
range of scores between 38.5 and 50, whereas the non-proficient group (M = 24.75, SD =
6.22, n = 12) represented a range of scores between 17 and 37.5. The median score for
the ANOVA map was 35.5. For the ANOVA map, the proficient group (M = 46.84, SD
= 11.89, n = 16) represented a range of scores between 35.5 and 71.5, where the non-
proficient group (M = 26.10, SD = 6.96, n = 14) represented a range of scores between 16
and 34.
Proficient and non-proficient exam performance. Independent-samples t-tests
were used to analyze the concept map usage data. The proficient and non-proficient
ratings from the map on the t statistic were to test for differences in performance on exam
3, whereas the proficient and non-proficient ratings from the map on ANOVA were used
to test for differences in performance on exam 4. The ratings from these two maps were
used because their creation occurred closest in time to the given exam and are therefore

45
the most indicative map of the participants’ knowledge regarding the given exam. This
ensured that the most current measure of concept map proficiency would be used, so that
anyone who was non-proficient on a prior map had the opportunity to improve. Exam 3
covered hypothesis testing, the t statistic, and the different types of t-tests. Exam 4
covered estimation, confidence intervals, and ANOVA. Each test contained conceptual
and computational questions.
For exam 3, the proficient group (M = 41.97, SD = 4.98, n = 18) produced about a
4-point higher overall score than the non-proficient group (M = 38.03, SD = 9.13, n = 18).
No significant differences were found among the proficient and non-proficient concept
map users on exam 3 conceptual score, t(34) = 0.70, p = .486, d = 0.23, or total score,
t(34) = 1.61, p = .117, d = 0.53. However, for the computational section of exam 3, the
proficient group (M = 23.58, SD = 2.05, n = 18) produced a 3-point higher score than the
non-proficient group (M = 20.58, SD = 5.07, n = 18). A significant difference in
computational score on exam 3 (see Figure 12) was revealed among the proficient and
non-proficient concept map users, t(34) = 2.33, p = .026, d = 0.77.

46
Figure 12. Exam 3 mean computational score for the t statistic concept map proficient and non-proficient users. Note. Error bars represent +/-1SE. For exam 4, the proficient group (M = 43.09, SD = 4.47, n = 16) again produced
about a 5-point higher overall score that the non-proficient group (M = 38.25, SD = 7.50,
n = 14), yielding a significant difference between the proficient and non-proficient
concept map users, t(28) = 2.18, p = .038, d = 0.78 (see Figure 13). No significant
differences were found among proficient and non-proficient users on exam 4
computational score, t(28) = 1.49, p = .146, d = 0.45, or conceptual score, t(28) = 1.92, p
= .065, d = 0.70.
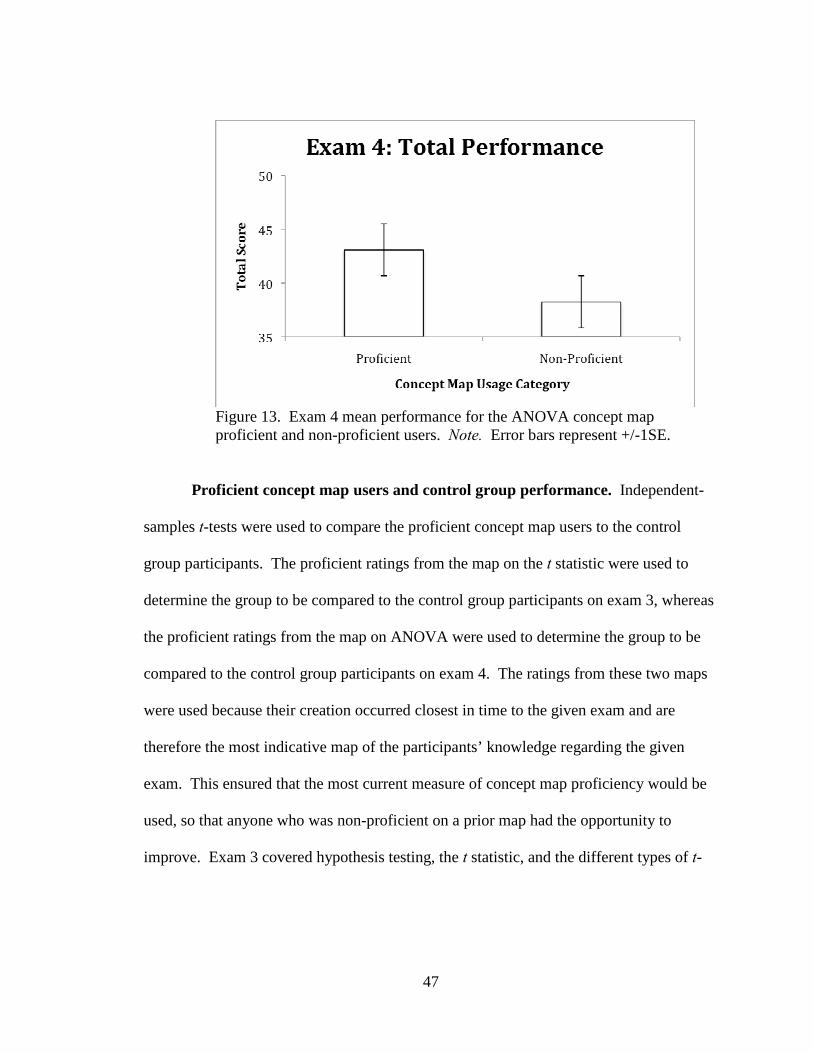
47
Figure 13. Exam 4 mean performance for the ANOVA concept map proficient and non-proficient users. Note. Error bars represent +/-1SE.
Proficient concept map users and control group performance. Independent-
samples t-tests were used to compare the proficient concept map users to the control
group participants. The proficient ratings from the map on the t statistic were used to
determine the group to be compared to the control group participants on exam 3, whereas
the proficient ratings from the map on ANOVA were used to determine the group to be
compared to the control group participants on exam 4. The ratings from these two maps
were used because their creation occurred closest in time to the given exam and are
therefore the most indicative map of the participants’ knowledge regarding the given
exam. This ensured that the most current measure of concept map proficiency would be
used, so that anyone who was non-proficient on a prior map had the opportunity to
improve. Exam 3 covered hypothesis testing, the t statistic, and the different types of t-

48
tests. Exam 4 covered estimation, confidence intervals, and ANOVA. Each test
contained conceptual and computational questions.
For exam 3, the proficient group (M = 23.58, SD = 2.05, n = 18) produced over a
2-point higher computational score than the control group (M = 21.29, SD = 4.05, n =
52). A significant difference was found between the proficient concept map users and the
control participants on exam 3 computational score, t(68) = 2.29, p = .025, d = 0.71 (see
Figure 14). No significant differences were found among the proficient concept map
users and the control participants on exam 3 conceptual score, t(68) = 1.22, p = .225, d =
0.34, or total score, t(68) = 1.94, p = .056, d = 0.57.
Figure 14. Exam 3 mean computational score for the t statistic proficient concept map users and the control participants. Note. Error bars represent +/-1SE.
For exam 4, the proficient group (M = 19.06, SD = 3.79, n = 16) produced over a
3-point higher conceptual score than the control group (M = 15.76, SD = 4.69, n = 51). A

49
significant difference was found between the proficient concept map users and the control
participants on exam 4 conceptual score, t(65) = 2.56, p = .013, d = 0.77 (see Figure 15).
Figure 15. Exam 4 mean conceptual score for the ANOVA proficient concept map users and the control participants. Note. Error bars represent +/-1SE.
For exam 4 total score, the proficient group (M = 43.09, SD = 4.47, n = 16)
produced over a 4-point higher score than the control group (M = 38.76, SD = 6.53, n =
51). A significant difference was found between the proficient concept map users and the
control participants on exam 4 total score, t(65) = 2.47, p = .016, d = 0.77 (see Figure 16).
No significant difference was found between the proficient concept map users and the
control participants on exam 4 computational score, t(65) = 1.34, p = .184, d = 0.44.
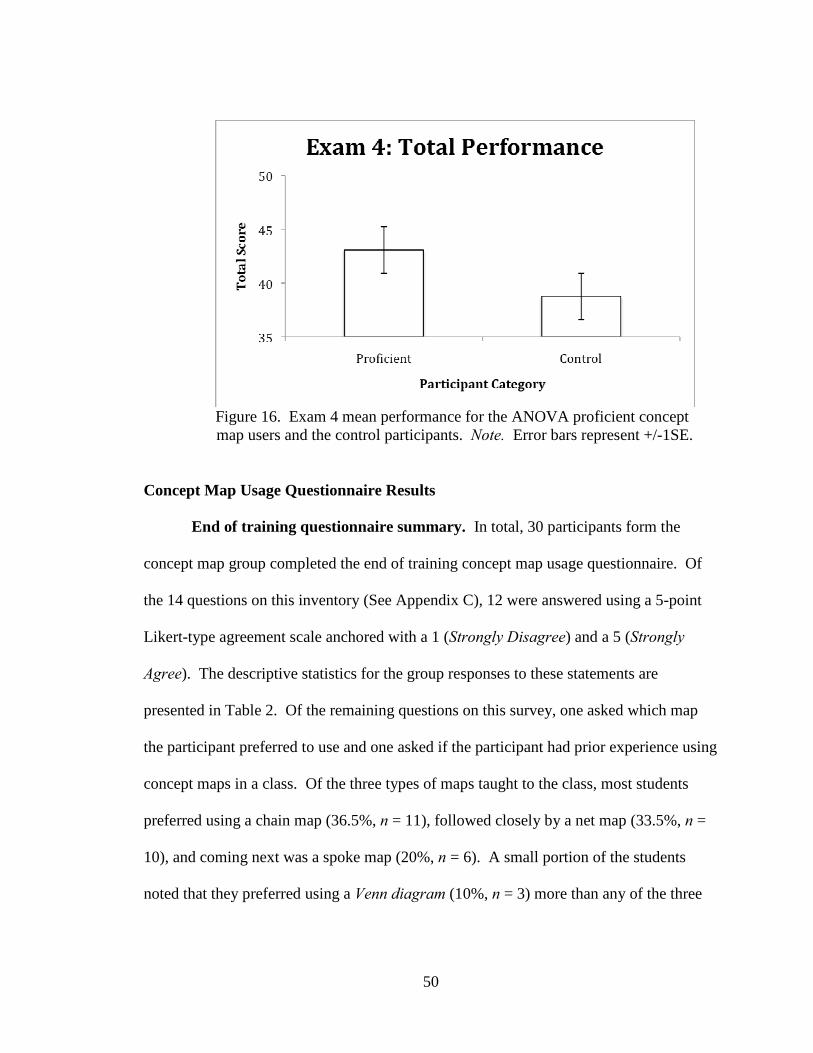
50
Figure 16. Exam 4 mean performance for the ANOVA proficient concept
map users and the control participants. Note. Error bars represent +/-1SE.
Concept Map Usage Questionnaire Results
End of training questionnaire summary. In total, 30 participants form the
concept map group completed the end of training concept map usage questionnaire. Of
the 14 questions on this inventory (See Appendix C), 12 were answered using a 5-point
Likert-type agreement scale anchored with a 1 (Strongly Disagree) and a 5 (Strongly
Agree). The descriptive statistics for the group responses to these statements are
presented in Table 2. Of the remaining questions on this survey, one asked which map
the participant preferred to use and one asked if the participant had prior experience using
concept maps in a class. Of the three types of maps taught to the class, most students
preferred using a chain map (36.5%, n = 11), followed closely by a net map (33.5%, n =
10), and coming next was a spoke map (20%, n = 6). A small portion of the students
noted that they preferred using a Venn diagram (10%, n = 3) more than any of the three
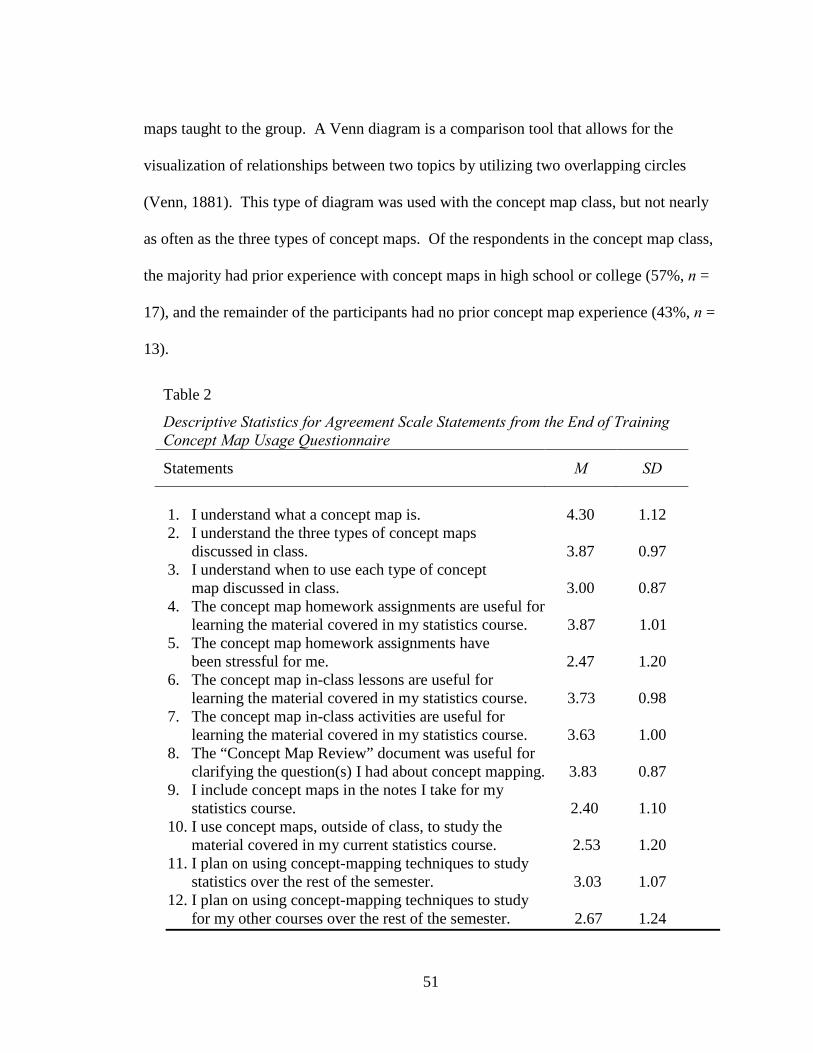
51
maps taught to the group. A Venn diagram is a comparison tool that allows for the
visualization of relationships between two topics by utilizing two overlapping circles
(Venn, 1881). This type of diagram was used with the concept map class, but not nearly
as often as the three types of concept maps. Of the respondents in the concept map class,
the majority had prior experience with concept maps in high school or college (57%, n =
17), and the remainder of the participants had no prior concept map experience (43%, n =
13).
Table 2
Descriptive Statistics for Agreement Scale Statements from the End of Training
Concept Map Usage Questionnaire
Statements M SD
1. I understand what a concept map is. 4.30 1.12 2. I understand the three types of concept maps
discussed in class. 3.87 0.97 3. I understand when to use each type of concept
map discussed in class. 3.00 0.87 4. The concept map homework assignments are useful for
learning the material covered in my statistics course. 3.87 1.01 5. The concept map homework assignments have
been stressful for me. 2.47 1.20 6. The concept map in-class lessons are useful for
learning the material covered in my statistics course. 3.73 0.98 7. The concept map in-class activities are useful for
learning the material covered in my statistics course. 3.63 1.00 8. The “Concept Map Review” document was useful for
clarifying the question(s) I had about concept mapping. 3.83 0.87 9. I include concept maps in the notes I take for my
statistics course. 2.40 1.10 10. I use concept maps, outside of class, to study the
material covered in my current statistics course. 2.53 1.20 11. I plan on using concept-mapping techniques to study
statistics over the rest of the semester. 3.03 1.07 12. I plan on using concept-mapping techniques to study
for my other courses over the rest of the semester. 2.67 1.24
52
End of semester questionnaire summary. In total, 34 participants form the
concept map group completed the end of semester concept map usage questionnaire. Of
the 11 questions on this inventory (See Appendix D), 7 were answered using a 5-point
Likert-type agreement scale anchored with a 1 (Strongly Disagree) and a 5 (Strongly
Agree). The descriptive statistics for the group responses to these statements are
presented in Table 3. Of the remaining questions on this survey, the participants were
again asked which map they preferred to use and if they had prior experience using
concept maps. For this inventory, most students noted that they preferred using a net
map (32%, n = 11), followed by a spoke map (26%, n = 9), coming next was a chain map
(24%, n = 8), and finally a portion of the sample reported having no preference (18%, n =
6). This pattern differed from the end of training questionnaire, showing a more balanced
distribution of preferred map usage among the different types of concept maps. The
majority of the concept map group respondents again reported having prior experience
with concept maps in high school or college (65%, n = 22), and the remainder of the
participants had no prior concept map experience (32%, n = 11) or did not provide and
answer (3%, n = 1). The last two questions on this inventory were dichotomous items
requiring a yes or no answer to indicate if a participant included concept maps in their
statistics notes and if a participant used concept maps outside of class to study statistics.
The majority of the respondents reported that they did not use concept maps in their
statistics notes (65%, n = 22), and the remaining students indicated that they did include
concept maps in their statistics notes (35%, n = 12). The majority of the respondents also
reported that they did not use concept maps to study statistics (71%, n = 24), and the

53
remaining students indicated that they did use concept maps to study statistics (29%, n =
10).
Table 3
Descriptive Statistics for Agreement Scale Statements from the End of Semester
Concept Map Usage Questionnaire
Statements M SD
1. The concept map homework assignments were useful
for learning the material covered in this statistics course. 3.85 0.86
2. The concept map homework assignments were stressful for me. 2.06 0.89
3. I plan on using concept-mapping techniques to study for any future statistics course that I may take. 3.24 0.89
4. I plan on using concept-mapping techniques to study for other future courses, besides statistics courses, that I may take. 3.29 0.91
5. I feel that using concept-mapping strategies was useful For increasing my theoretical understanding of statistics. 3.65 0.92
6. I feel that using concept-mapping strategies was useful for improving my academic performance in this statistics course. 3.50 0.90
7. I feel that using concept-mapping strategies was useful for decreasing my anxiety towards statistics. 3.35 0.98

54
Discussion
Study Summary
The statistics anxiety of the concept map group decreased more than that of the
control group over the course of the semester, but none of the group differences on
anxiety were found to be statistically significant. The anxiety prediction for this study
was that the use of concept mapping would significantly decrease the overall statistics
anxiety of students in the concept map group and that these students would have less
statistics anxiety over the semester than the students in the control group. The results do
not support this hypothesis.
The academic performance of the concept map group remained relatively stable
and similar to the control group throughout the course of the semester. None of the small
group differences on academic performance were found to be statistically significant.
However, for exam 3, a significant difference was found between the proficient concept
map users and the control participants on computational score. For exam 4, a significant
difference was found between the proficient concept map users and the control
participants on conceptual score and total score. These performance patterns suggest that
the use of concept mapping provided the proficient concept map users with academic
advantages over the control group participants. The performance prediction for this study
was that the use of concept mapping would significantly improve the academic
performance of students in the concept map group and that these students would improve
more academically over the semester than the students in the control group. The results
support this hypothesis.

55
Strengths and Limitations
Significant results to consider. A significant difference was found between the
concept map group and the control group on the STARS subscale of Interpretation
Anxiety. This type of statistics anxiety is related to trying to understand another person’s
interpretation of statistics as well as having to make one’s own interpretations of
statistics. Interpretation anxiety appears to be related to one’s conceptual understanding
of statistics, so the use of concept mapping may have made those in the concept map
group feel less anxious about interpreting statistics and more confident about their
conceptual understanding of statistics. However, this speculative logic does not explain
why any newfound participant confidence did not translate to significantly higher
conceptual performance on their exams. According to the logic of processing efficiency
theory (e.g., Eysenck & Calvo, 1992), such an improvement in conceptual performance
would be expected, as working memory space should have been freed up by having less
worry over one’s interpretation of statistics.
It is worthy to note that the only significant difference in performance found
between members of the concept map group was on computational performance on the
third exam. According to processing efficiency theory (e.g., Eysenck & Calvo, 1992),
impaired performance is more consistent during stressful conditions, so the significant
difference between the proficient concept map users and the non-proficient users in a test
situation implies that making better maps lead to better computational performance. This
significant difference may be a function of the topic for the map they created before the
test. They mapped out their thoughts on the topic of the t statistic, showing that the
56
proficient users understood more about how to compute this statistic than did the non-
proficient users. This result mirrors the assertion that creating a personal concept map
supports the effective organization of knowledge and allows students to solve structured
problems more efficiently than if they were just given a concept map made by an teacher
(Lee & Nelson, 2005). Therefore, by creating a more robust, individual concept maps,
including how to compute the t statistic, it appears the proficient user’s computational
organization translated into less calculation errors and higher computational exam scores
than the non-proficient users on exam 3.
A significant difference on exam 3 computational score was also found between
the proficient concept map users and the control group. In addition, significant
differences were found between the proficient concept map users and the control group
on exam 4 conceptual score and total score. These exam 4 results differ from the
between-group findings comparing the entire concept map group (proficient and non-
proficient users) to the control group, which did not yield any significant performance
results. The lack of significance in the between-group performance analyses may be
explained by the presence of the non-proficient concept map users. This group may have
washed out any significant effect between the proficient concept map users and the
control group.
Validity and reliability. According to Lavigne (2005), the majority of
researchers have used a quantitative analysis of concept map structure to assign scores to
the maps they study. It has also been recommended that a qualitative analysis of concept
map structure be used rather than a quantitative analysis because it can provide more

57
analytic value (Kinchin, Hay, & Adams, 2000). In order to provide concurrent validity to
this study, it was decided to use both the more established method of quantitative analysis
of map structure and the more diagnostic method of qualitative analysis of map structure.
For our quantitative analysis, we counted the number of nodes, links, branches,
pictures, colors, statistical formulas, and awarded a point for correct concept map
structure. The qualitative analysis was the scoring rubric (see Appendix E) developed by
the experimenter through examining other concept map rubrics, identifying useful
segments from those rubrics, and finally synthesizing ideas from those segments into a
new rubric. The structure of the rubric included sections covering ideas addressed in
each of the other rubrics that were examined, ensuring face validity and content validity,
while leaving out ideas that were not widely addressed, in order to strengthen the content
validity of the measure. Concurrent validity was shown through significant correlations
between the quantitative and qualitative analysis of map structure on three of the four sets
of original maps created by the concept map group (see Table 1). The set of maps
covering the topic of estimation did not yield a significant correlation. However, with a p
value of .055, the correlation was approaching significance for this set, with significance
most likely prevented by small sample size.
Providing a measure of concurrent validity also allows for a discussion of the
convergent validity of the quantitative and qualitative analyses of map structure used in
this experiment. The two constructs used to assess the concept maps created by the
concept map group were correlated with each other despite small sample sizes, showing
that the two different methods did indeed measure the same construct. The establishment
58
of concurrent and convergent validity reinforces the construct validity of the assessment
methods used for this experiment.
In using both a quantitative scoring method and a qualitative scoring method, then
combining each of these scores to form a single concept map score, Pearson correlations
were conducted in order to compare the reliability of these measures. As previously
mentioned, three of the four sets of original maps created by the treatment group yielded
significant correlations, showing reliability between the two measures. Only the
estimation map failed to yield a significant correlation, but this is believed to be due to
small sample size.
An independent rater was recruited to score ten maps from each of the four
original concept map assignment pools of participant maps, allowing for the examination
of the inter-rater reliability of the scoring methods used in this experiment. Pearson
correlations between the experimenter and independent rater concept map scores were
conducted (see Table 1), yielding significant correlations and providing further evidence
for the reliability of the concept maps scoring techniques used in this experiment.
Finally, Cronbach’s alpha (α) was used to estimate the reliability of the STARS scale
items, yielding acceptable estimates of internal consistency (Nunnally, 1994) for each of
the STARS subscales. These estimates coincide with past studies showing the STARS as
a reliable measure of statistics anxiety (Mji & Onwuegbuzie, 2004; Onwuegbuzie, 1999).
In showing the reliability of the measures used in this study, the argument for the validity
of the experiment is strengthened further.

59
Small effect sizes insufficient statistical power. One constant throughout each
analysis conducted was the presence of small effect sizes of concept mapping on the
concept map group. Even the largest of the differences maintained between the concept
map group and the control group only accounted for less than four percent of a decrease
in feelings of anxiety. A similar pattern was present between the concept map and
control groups for academic performance, as less than a two percent increase in
performance was the achievement ceiling. When looking for a medium effect with an
estimated power of .80 at a p value of .05, the recommended amount of participants for
the study was 128 (Cohen, 1992). In total, only 101 participants were attained for the
experiment, missing the required number for sufficient statistical power by 27
participants.
Implications
Potential population oversight. The results of this study may reflect differences
between the general undergraduate student population and specific populations of
undergraduate students (e.g. math or business majors). In this study, the use of concept
mapping did not significantly reduce the anxiety of the participants in the concept map
group, which was made up of a variety of majors. Although it was our intention to
investigate if subgroups of students, stratified by major, had their anxiety significantly
reduced by the use of concept mapping, we were not able to conduct such an
investigation due to problematic data. Past studies have shown concept mapping to have
a positive effect on students at the graduate level, including medical students (Torre et al.,
2007) and social science students (Pan & Tang, 2004). In the future, it may be important

60
to consider if the general constitution of the study population concealed any
subpopulations of undergraduates that were more greatly affected by the use of concept
mapping.
Conceptual vs. computational advantages. From the outset of this experiment,
it was believed that the use of concept mapping would have more of an impact on
conceptual exam performance than on computational exam performance. This belief was
based on prior research showing conceptual models to improve recall of conceptual
information (Mayer, 1989) and the use of metacognitive strategies to lead to improved
academic performance (Metallidou & Viachou, 2007). In addition, processing efficiency
theory states that successful processing activities can increase available working memory
capacity and lead to improved performance (e.g. Eysenck & Calvo, 1992). Concept
mapping has been shown to be a successful processing activity for college students (Pan
& Tang, 2004; Torre et al., 2007), and therefore it was believed to be a possible strategy
for improving working memory in college statistics students.
The conceptual and computational performance of proficient and non-proficient
concept map users was tracked for exams 3 and 4. The only significant difference
between these groups was on the exam 3 computational, where the proficient users
performed three points better than the non-proficient users. In addition, a significant
difference was found between the proficient concept map users and the control
participants on exam 3 computational score. For exam 4, a significant difference was
found between the proficient concept map users and the control participants on
conceptual score and total score. These performance patterns suggest that the use of

61
concept mapping provided the proficient concept map users with computational and
conceptual academic advantages over the control group participants.
Modification of the Current Study
It may be worthwhile to replicate the current study with some specific
modifications in order to strengthen the experimental design and show the original
anxiety hypothesis to be valid. First, any replication should include more participants, at
least 128 in order to meet the recommended amount to reach sufficient statistical power.
That way there will be no question if null results are found again.
Improvements in concept map training. Other issues to be addressed when
modifying the current study are the length and the strength of the concept map training
portion of this study. A more concise and intense concept map training regime may
produce a stronger treatment and larger effect sizes then those in the current study. It
may have been that the concept map training for the current study concentrated on
understanding concepts maps at the expense of taking away valuable time that could have
been used on learning more about statistics. Condensed, precise training sessions would
allow participants to spend more time applying concept map techniques to statistics,
giving the concept map training more of a chance to work in improving the students
conceptual understanding of statistics. The participants may have shown a greater
amount of reduced statistics anxiety and improved academic performance if they learned
the minimum amount necessary to create their own maps and then spent the majority of
their time honing their concept map skills by creating maps about statistics topics.

62
The concept map training for the current experiment also may have lasted too
long. The participants were still learning about concept maps until the midpoint of the
semester, and the original concept map assignments did not begin until after the second
exam. The graph of exam conceptual performance clearly shows the concept map group
and the control group were practically even as far as score on exam 3, but the concept
map group clearly performed better than the control group on exam 4. This improvement
may have been due to the creation of personal maps that the concept map class had begun
after exam 2. They may have performed even with the control group on exam 3 because
they were still learning how to best create their own maps, but by exam 4 they were done
making adjustments and were performing better than the control group. If the training
were to last only a few weeks and then the participants began creating their own maps,
one might predict a pattern of even performance with the control group on exam 1 but
steady improvement over the control group on the next three exams. It would also be
interesting to see the pattern that would ensue with exam computational performance
with the outlined changes made. The graph of exam computational performance shows
the concept map group and the control group were practically even as far as exam score
on exam 3, but the control group clearly performed better than the concept map group on
exam 4. This pattern may be a product of chance, and having more time to create
personal maps might lead to higher computational performance for the concept map
group.
Spending less time practicing and spending more time creating personal maps
may also help to reduce statistics anxiety because less time would be spent trying to

63
understand concept maps and more would be spend trying to understand statistics. The
belief is that the advantages of concept mapping, such as making misconceptions easier
to identify (McClure et al., 1999) and providing the articulation of more relationships
between statistical concepts (Lavigne, 2005), will lead to a deeper conceptual
understanding of statistics, which will lead to less statistics anxiety and in turn create
more confidence in one’s statistics abilities. The significant differences in Interpretation
Anxiety between the concept map group and the control group illustrate this point,
showing that the concept map group felt more confident in its understanding of statistics
and its ability to explain statistics due to concept mapping. An increase in the amount of
time dedicated to creating concept maps is recommended for any replication attempt, but
the key is to make the suggested modifications in order to maintain a proper balance
between learning concept mapping and learning statistics.
Suggestions for Future Research
Investigating specific student groups. Once the discussed improvements have
been made to the experiment design, it may be beneficial to study specific groups of
undergraduate students to see if concept maps are more effective for any particular group.
It has been found that statistics-anxious students avoid statistics coursework and college
majors that require statistics (Onwuegbuzie & Wilson, 2003), so one might hypothesize
that math or business majors who have chosen subject areas that will involve more math
or statistics classes than other majors may be more willing to utilize concept mapping as
a strategy because they are not as statistics-anxious. The motivation to try concept

64
mapping may be greater for students who are more secure about their math or statistics
abilities than most in the general population.
Investigating conceptual and computational learning advantages. Proficient
concept map users performed significantly better on the computational section of exam 3
than the non-proficient concept map users. Proficiency status in this situation was based
on the t statistic concept map, so it may be that the participants created maps that focused
on how to compute this statistic that facilitated improved computational performance. It
is also possible that the participants performed significantly better on the computational
section of the exam 3 because the typical student has a limited understanding of
mathematics mostly related to computational skills, with little to no relation to conceptual
understanding (Perry, 2004). Therefore, the participants may have performed better on
the computational section because their conceptual understanding was not as developed
as their computational understanding of statistics. Creating concept map assignments
with more specific instructions, geared toward computational or conceptual
understanding, may help facilitate greater overall academic improvements.
In order to understand the conceptual and computational learning advantages that
may be gained from using concept maps, future research can include the use of map
directions designed specifically to provide one learning advantage over the other. For
instance, participants in one group could create maps outlining the steps in calculating an
ANOVA and participants in another group could create maps outlining the conceptual
underpinnings of ANOVA. A third group could even be included that creates a map with
both conceptual and computational information. It would be interesting to see if the

65
groups differ significantly in the conceptual and computational scores from an exam
covering ANOVA. It may be that more directed mapping instructions produce distinct
advantages that open-ended mapping instructions, like the ones used in this study, do not.
Working memory assessment. In future research, it may be necessary to
measure and track certain cognitive functions that previous research has shown to be
related to anxiety and academic performance. As discussed in this document, working
memory is impeded by feelings of worry (Eysenck & Calvo, 1992), and math-anxious
students have been found to encounter working memory difficulties (Ashcraft & Moore,
2009). Eysenck and Calvo (1992) stated that when working memory is hindered by
anxiety it has negative effects on performance, and this type of performance decline due
to working memory interference has been found to worsen for math students as the
material becomes more abstract and a heavier load is placed on working memory
(LeFevre, DeStefano, Coleman, & Shanahan, 2005). In studying statistics anxiety,
working memory should also be assessed and then the two measures can be correlated to
see if they are related. If working memory function is related to statistics anxiety, then it
could be included as a covariate in any future analysis of statistics anxiety data. Such
action would produce a more statistically powerful study of statistics anxiety.
Metacognition assessment. Another cognitive function that may be related to
statistics anxiety is metacognition, which is defined as awareness of one’s personal
thinking processes and one’s ability to control his or her thinking processes (Flavell,
1979). Metacognitive strategies have been found to be predictors of college student math
anxiety (Kesici & Erdogn, 2009). Specifically, students who do not consider

66
metacognitive strategies as important have a decreased probability of academic success in
math courses. Other findings show that the use of metacognitive strategies, such as
concept mapping, leads to better performance in college students (Metallidou & Viachou,
2007). Concept mapping is a metacognitive skill because it facilitates the process of
thinking about one’s thinking. Metacognitive skills are difficult for college students to
master (Mattick & Knight, 2007), so it is recommended that the measurement of these
abilities is coupled with more intense training methods as were described above. More
intense training would involve detailed feedback for each participant about the content of
their map, including inaccuracies in interpretation and affirmation of valid lines of
thought. Being that this type of feedback was lacking from the current study and
individual metacognitive ability, the ranges of differences in metacognitive abilities
among the participants may have contributed to the lack of findings. By not separating
the participants with more metacognitive skill and combining them with the participants
with less metacognitive skill in the analysis, it would be difficult to see the advantages of
having honed metacognitive skills in a statistics class. In studying statistics anxiety,
metacognition should also be assessed and then the two measures can be correlated with
one another to see if they are related. Then if metacognitive function is related to
statistics anxiety, it could be included as a covariate in any analysis of future statistics
anxiety data, which would produce a more statistically powerful study of statistics
anxiety.

67
References
Adams, N. A., & Holcomb, W. R. (1986). Analysis of the relationship between anxiety about mathematics and performance. Psychological Reports, 59, 943-948.
Afamasaga-Fuata’I, K. (2008). Students’ conceptual understanding and critical thinking: A case for concept maps and vee-diagrams in mathematics problem solving. Australian Mathematics Teacher, 64(2), 8-17.
Ashcraft, M. H., & Faust, M. (1994). Mathematics anxiety and mental arithmetic performance: An exploratory investigation. Cognition and Emotion, 8, 97-125.
Ashcraft, M. H., & Kirk, E. P. (2001). The relationships among working memory, math anxiety, and performance. Journal of Experimental Psychology: General, 130, 224-237.
Ashcraft, M. H., & Moore, A. M. (2009). Mathematics anxiety and the affective drop in performance. Journal of Psychoeducational Assessment, 27, 197-205.
Ausubel, D. (1968). Educational psychology: A cognitive view. New York: Holt, Rinehart & Winston. Bartz, W. R., Amato, P. R., Rasor, R. A., & O’Neil-Rasor, M. (1981). Effects of reducing
student anxiety in a statistics course. Australian Psychologist, 16(3), 347-353.
Betz, N. E. (1978). Prevalence, distribution, and correlates of math anxiety in college students. Journal of Counseling Psychology, 25, 441-448.
Blalock, H. M. (1987). Some general goals in teaching statistics. Teaching Sociology, 15, 164-172. Bogden, C. A. (1977). The use of concept mapping as a possible strategy for
instructional design and evaluation in college genetics. Unpublished master’s thesis, Cornell University.
Caine, R. D., Centa, D., Doroff, C., Horowitz, J. H. & Wisenbaker, V. (1978). Statistics from who? Teaching Sociology, 6, 37-46. Cardemone, P. F. (1975). Concept mapping: A technique of analyzing a discipline and
its use in the curriculum and instruction in a portion of a college level
mathematics skills course. Unpublished master’s thesis, Cornell University.

68
Cates, G. L., & Rhymer, K. N. (2003). Examing the relationship between mathematics anxiety and mathematics performance: An instructional hierarchy perspective. Journal of Behavioral Education, 12(1), 23-34.
Cheung, H. Y. (2006). Factors affecting the state anxiety level of higher education students in Macau: The impact of trait anxiety and self-esteem. Assessment and
Evaluation in Higher Education, 31(6), 709-725.
Cohen, J. (1992). A power primer. Psychological Bulletin, 112, 155-159. Cruise, R. J., Cash, R. W. & Bolton, D. L. (1985, August). Development and validation
of an instrument to measure statistical anxiety. Paper presented at the annual meeting of the Statistical Education Section, Proceedings of the American Statistical Association, Chicago, IL.
Dew, K. M. H., Galassi, J. P., & Galassi, M. D. (1983). Mathematics anxiety: Some basic issues. Journal of Counseling Psychology, 30, 443-446.
Dew, K. M. H., Galassi, J. P., & Galassi, M. D. (1984). Math anxiety: Relation with situational test anxiety, performance, physiological arousal, and math avoidance behavior. Journal of Counseling Psychology, 31, 583-590.
Driscoll, M. P. (2000). Psychology of learning for instruction. Needham Heights, MA: Allyn & Bacon.
Easterbrook, J. (1959). The effect of emotion on due utilization and the organization of behavior. Psychological Review, 66, 83-101.
Eysenck, M. W. (1982). Attention and arousal: Cognition and performance. Berlin: Springer.
Eysenck, M. W., & Calvo, M. G. (1992). Anxiety and performance: The processing efficiency theory. Cognition and Emotion, 6(6), 409-434.
Flavell, J. H. (1979). Metacognitive and cognitive monitoring: A new area of cognitive developmental inquiry. American Psychologist, 34, 906-911.
Gaydosh, L. R. (1990). Syllabi and instructional materials for social statistics. Washington, DC: American Sociological Association.
Gravetter, F. J., & Wallnau, L. B. (2008). Essentials of statistics for the behavioral
sciences (6th ed.). Belmont, CA: Thomson/Wadsworth.

69
Head, L. Q., & Lindsey, J. D. (1983). The effects of trait anxiety and test difficulty on undergraduates’ state anxiety. The Journal of Psychology, 113, 289-293.
Hendel, D. D. (1980). Experiental and affective correlates of math anxiety in adult women. Psychology Women Quarterly, 5, 219-289.
Hong, E., & O’Neil, H. F. (1992). Instructional strategies to help learners build relevant mental models in inferential statistics. Journal of Educational Psychology, 84(2), 150-159.
Hong, E. (1992, February). Effects of instructional design with mental model analysis on learning. Paper presented at the Convention of the Association for Educational Communications and Technology, Washington, D.C.
Jacobs-Lawson, J. M., & Hershey, D. A. (2002). Concept maps as an assessment tool in psychology courses. Teaching of Psychology, 29(1), 25-29.
Jegede, O. J., Alaiyemola, F. F., & Okebukola, P. A. (1990). The effect of concept mapping on students’ anxiety and achievement in biology. Journal of Research in
Science Teaching, 27(10), 951-960.
Kesici, A., & Erdogan, A. (2009). Predicting college students’ mathematics anxiety by motivational beliefs and self-regulated learning strategies. College Student
Journal, 43(2), 631-642.
Kinchin, I. M., Hay, D. B., & Adams, A. (2000). How a qualitative approach to concept map analysis can be used to aid learning by illustrating patterns of conceptual development. Educational Research, 42(1), 43-57.
Lackey, J. R. (1994, April). Identifying and alleviating problems novices have while learning formulae. Paper presented at the Annual Meeting of the American Educational Research Association, New Orleans, LA.
Lavigne, N. C. (2005). Mutually informative measures of knowledge: Concept maps plus problem sorts in statistics. Educational Assessment, 10, 39-71.
Lee, Y., & Nelson, D. W. (2005). Viewing or visualizing—which concept map strategy works best on problem-solving performance? British Journal of Educational
Technology, 36(2), 193-203.
LeFevre, T., DeStefano, D., Coleman, B., & Shanahan, T. (2005). Mathematical cognition and working memory. In J. I. D. Campbell (Ed.), Handbook of
mathematical cognition (pp. 361-377). New York: Psychology Press.

70
Liebert, R., & Morris, L. (1967). Cognitive and emotional components of test anxiety: A distinction and some initial data. Psychological Reports, 20, 975-978.
Linnenbrink, E. A., & Pintrich, P. R. (2002). Motivation as an enabler for academic success. School Psychology Review, 31(3), 313-327.
Lundgren, T. D., & Fawcett, R. (1980). Statistics from statisticians. Teaching Sociology,
7, 191-201.
Ma, X. (1999). A meta-analysis of the relationship between anxiety toward mathematics and achievement in mathematics. Journal for Research in Mathematics
Education, 30, 502-540.
Mattick, K., & Knight, L. (2007). High-quality learning: Harder to achieve than we think? Medical Education, 41, 638-644.
Mayer, R. E., Dyck, J. L, & Cook, L. K. (1984). Techniques that help readers build mental models from scientific test: Definitions pretraining and signaling. Journal of Educational Psychology, 76(6), 1089-1105.
Mayer, R. E. (1989). Models for understanding. Review of Educational Research, 59(1), 43-64.
McClure, J. R., Sonak, B., & Suen, H. K. (1999). Concept map assessment of classroom learning: Reliability, validity, and logistical practicality. Journal of Research in
Science Teaching, 36, 475-492.
Metallidou, P., & Viachou, A. (2007). Motivational beliefs, cognitive engagement, and achievement in language and mathematics in elementary school children. International Journal of Psychology, 42(1), 2-15.
Mji, A., & Onwuegbuzie, A. J. (2004). Evidence of score reliability and validity of the statistical anxiety rating scale among technikon students in South Africa. Measurement and Evaluation in Counseling and Development, 36, 238-251.
Moreira, M. (1977). An Ausubelian approach to physics instruction: An experiment in an introductory college course in electromagnetism. Unpublished doctoral dissertation, Cornell University.
Morris, H. W. (1978). Mathematics anxiety rating scale: Predicting anxiety experience and academic performance in two groups of students. Journal of Educational
Psychology, 70, 589-594.

71
Novak, J. D. (1990). Concept maps and vee diagrams: Two metacognitive tools to facilitate meaningful learning. Instructional Science, 19, 29-52.
Novak, J. D. (1993). Human constructivism: A unification of psychological and epistemological phenomena in meaning making. International Journal of
Personal Construct Psychology, 6, 167-193.
Nunnally, J. C. (1994). Psychometric theory. New York: McGraw-Hill. Okebukola, P. A., & Jegede, O. J. (1989). Students’ anxiety towards and perception of
difficulty of some biological concepts under the concept-mapping heuristic. Research in Science & Technological Education, 7(1), 85-92.
Onwuegbuzie, A. J., & Seaman, M. (1995). The effect of time constraints and statistics test anxiety on test performance in a statistics course. Journal of Experimental
Education, 63, 115-124.
Onwuegbuzie, A. J. (1997). Writing a research proposal: The role of library anxiety, statistics anxiety, and composition anxiety. Library and Information Science
Research, 19, 5-33.
Onwuegbuzie, A. J., Da Ros, D., & Ryan, J. (1997). The components of statistics anxiety: A phenomenological study. Focus on Learning Problems in Mathematics, 19(4), 11-35.
Onwuegbuzie, A. J. (1998). The dimensions of statistics anxiety: A comparison of prevalence rates among mid-southern university students. Louisiana Educational
Research Journal, 23, 23-40.
Onwuegbuzie, A. J. (1999). Statistics anxiety among African-American graduate students: An affective filter? Journal of Black Psychology, 25, 189-209.
Onwuegbuzie, A. J. (2001). Statistics anxiety and the role of self-perceptions. The
Journal of Educational Research, 93(5), 323-330.
Onwuegbuzie, A. J., & Leech, N. L. (2003). Assessment in statistics courses: More than a tool for evaluation. Assessment & Evaluation in Higher Education, 28(2), 115-127.
Onwuegbuzie, A. J., & Wilson, V. A. (2003). Statistics anxiety: Nature, etiology, antecedents, effects, and treatments--a comprehensive review of the literature. Teaching in Higher Education, 8(2), 195-209.

72
Pan, W., & Tang, M. (2004). Examining the effectiveness of innovative instructional methods on reducing statistics anxiety for graduate students in the social sciences. Journal of Instructional Psychology, 31(2), 149-159.
Pan, W., & Tang, M. (2005). Students’ perceptions on factors of statistics anxiety and instructional strategies. Journal of Instructional Psychology, 32(3), 205-214.
Perry, A. B. (2004). Decreasing math anxiety in college students. College Student
Journal, 38(2), 321-324.
Richardson, F. C., & Suinn, R. M. (1972). The Mathematics Anxiety Rating Scale: Psychometric data. Journal of Counseling Psychology, 19, 551-554.
Richardson, F. C., & Woolfolk, R. L. (1980). Mathematics anxiety. In I. G. Sarason (Ed.), Test anxiety: Theory, research, and application (pp. 271-288). Hillsdale, NJ: Erlbaum.
Rounds, J. B., & Hendel, D. D., (1981). Measurement and dimensionality of mathematics anxiety. Journal of Counseling Psychology, 27, 138-149.
Sarason, I. (1960). Empirical findings and theoretical problems in the use of anxiety scales. Psychological Bulletin, 57, 403-415.
Schacht, S., & Stewart, B. J. (1990). What’s funny about statistics? A technique for reducing student anxiety. Teaching Sociology, 18, 52-56.
Schacht, S., & Stewart, B. J. (1991). What’s funny about statistics? Interactive/user- friendly gimmicks for teaching statistics. Teaching Sociology, 20, 329-332.
Schwarzer, R., Van de Ploeg, H. M., & Spielberger, C. C. (1982). Test anxiety: An
overview of theory and research. Hillsdale, NJ: Lawrence Erlbaum Associates, Inc.
Smith, J. B. (1981). Math anxiety and the student of the ‘80s. Middleton, CT: Middlesex Community College. (ERIC Document Reproduction Service No. ED200296)
Spielberger, C. (1966). The effects of anxiety on complex learning and academic achievement. In C. Spielberger (Ed.), Anxiety and behavior (pp. 361-398). New York: Academic Press.
Streitz, N. A. (1988). Mental models and metaphors: Implications for the design of adaptive user-system interfaces. In H. Mandi & A. Lesgold (Eds.), Learning
issues for intelligent tutoring systems (pp. 164-186). New York: Springer-Verlag.
73
Tobias, S. (1987). Math anxiety. Science, 237, 1556. Torre, D. M., Daley, B., Stark-Schweitzer, T., Siddartha, S., Petkova, J., & Ziebert, M.
(2007). A qualitative evaluation of medical student learning with concept maps. Medical Teacher, 29, 949-955.
Venn, J. (1881). Symbolic Logic. London: Macmillan and Company. Watson, F. S., Kromrey, J. D., Lang, T., Hess, M. R., Hogarty, K. Y., & Dedrick, R. D.
(2003, April). Multifaceted foci: The antecedents of statistics anxiety and negative attitudes toward statistics. Paper presented at the Annual Meeting of the American Educational Research Association, Chicago, IL.
Wine, J. (1971). Test anxiety and direction of attention. Psychological Bulletin, 76, 92- 104.
Zeidner, M., & Safir, M. (1989). Sex, ethnic, and social differences in test anxiety among Israeli adolescents. Journal of Genetic Psychology, 150, 175-185.
Zeidner, M. (1991). Statistics and mathematics anxiety in social science students--some interesting parallels. British Journal of Educational Psychology, 61, 319-328.
Zettle, R. D., & Raines, S. J. (2000). The relationship of trait and test anxiety with mathematics anxiety. College Student Journal, 34(2), 246-258.

74
Appendix A
Concept Map Extra Credit Assignment #5: Probability Item List Node Instructions: Match each of the terms/definitions below with the node number they belong to on the Probability Map Worksheet. A. correspond to z-scores B. Each individual in the population has an equal chance of being selected C. no bias D. Probability E. proportion F. Random Sampling G. The Normal Distribution H. When several different outcomes are possible, the probability of any particular outcome N1. __________ N5. __________ N2. __________ N6. __________ N3. __________ N7. __________ N4. __________ N8. __________ Link Instructions: Match each of the words/phrases below with the link number they belong to on the Probability Map Worksheet. I. can be described by J. definition K. insuring L. is a M. or N. ranges O. requires P. these sections L1. __________ L5. __________ L2. __________ L6. __________ L3. __________ L7. __________ L4. __________ L8. __________

75

76
Appendix B
Demographics Questionnaire Please answer the following questions about you and your background. Circle the answer that best describes you or fill in the blank with the requested information. 1. What is your age? (In years.) __________ 2. What is your sex? (Circle one.)
1. Male 2. Female 3. Transsexual
3. What is (are) your major(s)? _________________________________________________________ 4. What is (are) your minor(s)? _________________________________________________________ 5. What is your college grade level? (Circle one.) 1. Freshman 2. Sophomore 3. Junior 4. Senior 5. Post-baccalaureate 6. Graduate student 7. Other (please name): ____________________ 6. What is your race/ethnicity? (Circle one.) 1. Hispanic, Latino, or Spanish 2. White
3. Asian (e.g., Asian Indian, Chinese, Filipino, Japanese, Korean, Vietnamese) 4. Black/African American
5. American Indian (North, Central, or South American) or Alaskan Native 6. Native Hawaiian 7. Other Pacific Islander
8. Other (please name): ____________________
7. How many undergraduate units have you already completed? __________

77
8. How many undergraduate statistics and/or research methodology courses have you taken before this class? (Circle one.)
1. 0 courses 2. 1 course 3. 2 courses 4. Other (please fill in how many) __________
9. Which undergraduate statistics and/or research methodology courses have you taken? (Please list all.) ________________________________________________________________________
________________________________________________________________________
________________________________________________________________________
10. How many math classes did you take in high school? (Circle one.) 1. 2 classes 2. 3 classes 3. 4 classes 4. Other (please fill in how many) __________
11. Which math classes did you take in high school? (Please list all.)
________________________________________________________________________
________________________________________________________________________
________________________________________________________________________
12. How many statistics classes did you take in high school? (Circle one.)
1. 0 classes 2. 1 class 3. 2 classes 4. Other (please fill in how many) __________ 13. Which statistics classes did you take in high school? (Please list all.)
________________________________________________________________________
________________________________________________________________________
________________________________________________________________________
THANK YOU VERY MUCH FOR COMPLETING THIS SURVEY!

78
Appendix C
End of Training Concept Map Usage Questionnaire This is an inventory of your concept map use over the first half of this semester. There are no right or wrong responses, only different ones. You can indicate whether or not you agree with the following statements by choosing the appropriate response. The last two questions are multiple-choice and not based on an agreement scale. Please respond to all of the items. Please respond honestly, your participation is important. Strongly Strongly Disagree Agree
1 2 3 4 5 ________________________________________________________________________ 1. I understand what a concept map is.
1 2 3 4 5 2. I understand the three types of concept maps discussed in class.
1 2 3 4 5 3. I understand when to use each type of concept map discussed in class.
1 2 3 4 5 4. The concept map homework assignments are useful for learning the material covered in my statistics course.
1 2 3 4 5 5. The concept map homework assignments have been stressful for me.
1 2 3 4 5 6. The concept map in-class lessons are useful for learning the material covered in my statistics course.
1 2 3 4 5

79
Strongly Strongly Disagree Agree
1 2 3 4 5
________________________________________________________________________ 7. The concept map in-class activities are useful for learning the material covered in my statistics course. 1 2 3 4 5 8. The “Concept Map Review” document was useful for clarifying the question(s) I had about concept mapping.
1 2 3 4 5 9. I include concept maps in the notes I take for my current statistics course.
1 2 3 4 5 10. I use concept maps, outside of class, to study the material covered in my statistics course.
1 2 3 4 5
11. I plan on using concept-mapping techniques to study statistics over the rest of the semester.
1 2 3 4 5
12. I plan on using concept-mapping techniques to study for my other courses over the rest of the semester.
1 2 3 4 5 ________________________________________________________________________
13. The type of concept map I prefer using is a __________. a. chain map b. net map c. spoke map

80
14. Before learning about concept maps during this semester, I had already been taught concept-mapping techniques in another class. a. Yes, in a prior high school class. b. Yes, in a prior college class. c. No.
THANK YOU VERY MUCH FOR COMPLETING THIS INVENTORY!

81
Appendix D
End of Semester Concept Map Usage Questionnaire This is an inventory of your feelings toward using concept maps. There are no right or wrong responses - only different ones. You can indicate whether or not you agree with the following statements by choosing the appropriate response. There are also two multiple-choice questions and two yes/no questions that are not based on an agreement scale. Please respond honestly, your participation is important. Strongly Strongly Disagree Agree
1 2 3 4 5
________________________________________________________________________ 1. The concept map homework assignments were useful for learning the material covered in this statistics course.
1 2 3 4 5 2. The concept map homework assignments were stressful for me.
1 2 3 4 5 3. I plan on using concept-mapping techniques to study for any future statistics courses that I may take.
1 2 3 4 5 4. I plan on using concept-mapping techniques to study for other future courses, besides statistics courses, that I may take.
1 2 3 4 5 5. I feel that using concept-mapping strategies was useful for increasing my theoretical understanding of statistics.
1 2 3 4 5 6. I feel that using concept-mapping strategies was useful for improving my academic performance in this statistics course.
1 2 3 4 5

82
Strongly Strongly Disagree Agree
1 2 3 4 5
________________________________________________________________________ 7. I feel that using concept-mapping strategies was useful for decreasing my anxiety towards statistics.
1 2 3 4 5 ________________________________________________________________________
8. The type of concept map I prefer using is a __________. a. chain map b. net map c. spoke map 9. Before learning about concept maps during this semester, I had already been taught concept-mapping techniques in another class. a. Yes, in a prior high school class. b. Yes, in a prior college class. c. No. 10. I included concept maps in the notes that I took in this statistics course. a. Yes b. No 11. I used concept maps, outside of class, to study the material covered over the course of the semester in this statistics course. a. Yes b. No
THANK YOU VERY MUCH FOR COMPLETING THIS INVENTORY!

83
Appendix E
Concept Map Rubric
Exemplary 3
Exceeds Standard 2
Adequately Meets
Standard 1
Below Standard 0
Con
tent
O
rgan
izat
ion
-Well organized. -Logical format that is easy to follow all of the time. -The main topic/concept is clear. -Contains appropriate sub-topics/concepts.
-Thoughtfully organized. -Format is easy to follow most of the time. -The main topic/concept is clear. -Contains appropriate sub-topics/concepts.
-Somewhat organized. -Format is difficult to follow. -The main topic/concept is unclear. -Contains inappropriate sub-topics/concepts.
-Confusing. -Format is very difficult to follow. -The main topic/concept is not clear at all. -Contains inappropriate sub-topics/concepts.
Stru
ctur
e
-Nodes demonstrate conceptual understanding. -Links are precisely labeled.
-Nodes are easy to follow but at times ideas are unclear. -Links are labeled.
-Nodes are difficult to follow. -Links are not labeled.
-Nodes are very difficult to follow. -No links.
C
omm
unic
atio
n -The structure provides a clear picture of the relationships between many ideas (5 or more).
-The structure provides a clear picture of the relationships between some ideas (between 3-4).
-The structure provides an unclear picture of few relationships between ideas (between 1-2).
-The structure is inappropriate.
Ove
rall
Pre
sent
atio
n
-Presentation of information is clear and a high level of understanding can be achieved.
-Presentation of information is clear and a basic level of understanding can be achieved.
-Presentation of information is not totally clear, but a basic level of understanding can be achieved.
-Presentation of information is unclear and difficult to understand.

84