final report - city of oakland
TRANSCRIPT

Economic &
Planning Systems Real Estate Economics Regional Economics Public Finance Land Use Policy
B E R K E L E Y 2501 Ninth St., Suite 200 Berkeley, CA 94710-2515 www.epsys.com
Phone: 510-841-9190 Fax: 510-841-9208
S A C R A M E N T O Phone: 916-649-8010 Fax: 916-649-2070
D E N V E R Phone: 303-623-3557 Fax: 303-623-9049
FINAL REPORT
OAK TO 9TH MIXED‐USE PROJECT FISCAL IMPACT ANALYSIS Prepared for: City of Oakland Community & Economic Development Agency Prepared by: Economic & Planning Systems, Inc. July 2005 EPS #14115

TABLE OF CONTENTS
I. INTRODUCTION AND SUMMARY OF FINDINGS...........................................................1
II. PROJECT DESCRIPTION ...............................................................................................4
III. FISCAL IMPACT METHODOLOGY................................................................................7
General Fund Revenues ...........................................................................................7 General Fund Expenditures...................................................................................10 Other Revenues.......................................................................................................11 Other Economic Effects ..........................................................................................12
APPENDIX A: Maximum Proposed Project LIST OF TABLES AND FIGURES
Table 1: Annual Fiscal Impact Summary at Project Buildout ...........................................2 Table 2: Project Description at Buildout .............................................................................5 Table 3: General Fund 2004‐05 and Estimating Factors ....................................................8
Figure 1: Vicinity Map—Oak to 9th Mixed‐Use Project .....................................................6
1 P:\14000s\14115Oakto9th\Fiscal\14115fiscal6.doc
I. INTRODUCTION AND SUMMARY OF FINDINGS
Oakland Harbor Partners, LLC, has plans to redevelop 13 parcels between Oak and 9th Streets along the Oakland Estuary south of Jack London Square. Economic & Planning Systems, Inc. (EPS), has analyzed the fiscal impacts to the City of Oakland’s General Fund in regards to the Developer’s residential and retail development at the Oak to 9th Mixed‐Use Project (the Project). The objective of the Project is to redevelop this traditionally industrial site into a network of open space, recreational uses, local‐serving retail, and housing along the scenic shoreline. This underutilized site within the Central City East District Redevelopment Area (Redevelopment Area) would become a mixed‐use residential/retail project that provides housing opportunities in close proximity to local and regional transportation and job opportunities. The Summary of Findings is provided below. Chapter II provides a description of the Project, and Chapter III provides a detailed explanation of the methodology and assumptions. Appendix A provides the complete fiscal model for the development scenario evaluated.
SUMMARY OF FINDINGS
1. The Project will generate sufficient revenues to cover the cost of providing public services to the City. The fiscal impacts of the Project on the City’s General Fund will be positive and are estimated to be greater than the cost of providing additional public services. By buildout, the Project is expected to generate net revenue of almost $2.1 million each year to the City’s General Fund as shown in Table 1.
2. General Fund revenues will come from a number of sources, with property tax
and transfer taxes making up the majority of the City’s revenues. Property transfer taxes are expected to generate almost $2.4 million each year following Project buildout. An additional $22.3 million of transfer tax is estimated to accrue to the City prior to buildout, upon initial sale of both the residential and commercial components of the Project. Property taxes, sales taxes, and utility user fees all also make significant contributions to the new stream of General Fund revenues. Motor vehicle in‐lieu fees (VLF) are estimated based on recent legislation; actual amounts will depend on the manner in which the VLF changes are implemented.
3. The Project would not only generate revenue to the City, but would also
generate revenue to the Redevelopment Agency, support construction jobs, and result in additional resident expenditures in the City. In addition to the revenues generated to the City, the Project would also generate $5.7 million in revenue at buildout to the Redevelopment Agency after housing set‐asides and pass‐throughs. The number of temporary (e.g., annual) construction jobs is

Table 1Annual Fiscal Impact SummaryOak to Ninth Mixed Use Project Fiscal Impact Analysis; EPS #14115
Item Total
CITY GENERAL FUNDRevenues (Annual)
Property Tax $1,225,949Property Transfer Tax $2,373,262Sales Tax $767,849Vehicle License Fee (VLF) $24,222
VLF Property Tax Return (3) $266,389Business License Tax $123,762Utility Users Tax $483,825Fines & Penalties $83,300
Total $5,348,558
Expenditures (Annual)
General Government $60,997Finance & Management $85,448Police Services $1,893,328Fire Services $1,084,578Parks & Recreation $68,231Library Services $63,567
Total $3,256,150
Net General Fund $2,092,409
OTHER CITY REVENUES (At Buildout in 2017)
Transfer Tax From Initial Sale $22,329,698
Redevelopment Agency RevenuePass-Throughs to other Agencies (excluding City's General Fund) $4,445,064Housing Set-Asides $4,050,987Net to RDA $5,752,858Total $14,248,909
OTHER ECONOMIC EFFECTS (At Buildout in 2017)
New Household ExpendituresTaxable Retail $109,594,743Other Non-Retail Expenditures $171,983,357Total Household Expenditures $281,578,100
Construction Value $826,500,000Construction Jobs 6,603
Source: Economic & Planning Systems, Inc.
Economic & Planning Systems, Inc. 7/15/2005 P:\14000s\14115Oakto9th\Fiscal\14115Fiscal6.xls2

Final Report Oak to 9th Mixed‐Use Project Fiscal Impact Analysis
July 15, 2005
3 P:\14000s\14115Oakto9th\Fiscal\14115fiscal6.doc
expected to be approximately 6,600. Total expenditures by new households are estimated at $281.6 million, of which a portion will generate sales tax to the City of Oakland.
4. Public safety is expected to be the highest service cost items in the General Fund
associated with the Project, followed by finance and management, parks and recreation, and library services. New public safety costs (e.g., police and fire services) will make up about 91 percent of the new General Fund costs, at almost $3.0 million each year at buildout. Finance and management costs are estimated at $85,400 each year at buildout. Parks and recreation costs are estimated at $68,200 per year at buildout. Library services costs are estimated at $63,600 per year.

4 P:\14000s\14115Oakto9th\Fiscal\14115fiscal6.doc
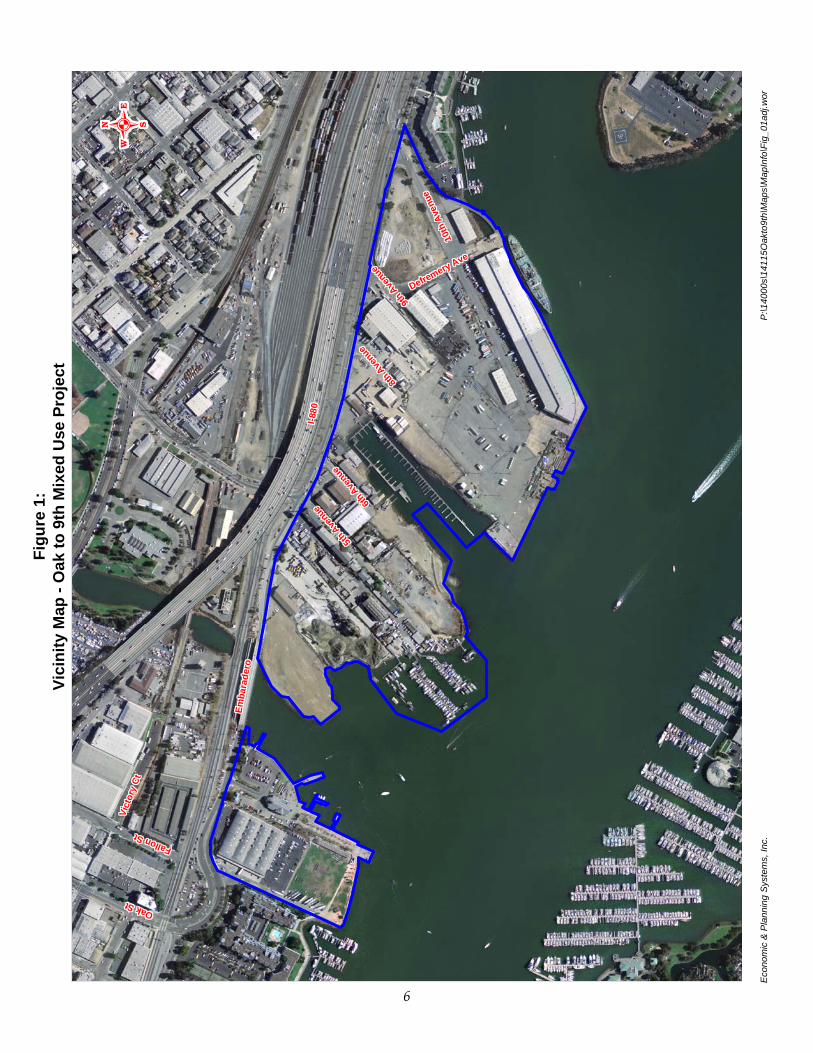
II. PROJECT DESCRIPTION
The Project encompasses approximately 62 acres and is bounded by Oak Street to the north, Embarcadero to the east, 10th Avenue to the south, and the Oakland Estuary to the west. The Project site is directly accessible by Embarcadero and the Interstate 880 highway (I‐880). The Project site encompasses Estuary Park, Clinton Basin, and the western portion of Lake Merritt Channel, but does not include two sites totaling approximately six acres of privately held land along 5th Avenue. Figure 1 shows the Project Site and existing structures. The Maximum Project as proposed by the Developer includes up to 3,100 residential units, up to 182,000 square feet of retail space, and 27 acres of open space at buildout, as shown in Table 2. Within the site, there is one historic building, the Ninth Avenue Terminal. This existing structure is approximately 300,000 square feet, but the Maximum Project would rehabilitate 18,000 square feet, which would become a visitor and cultural center. A combination of one‐, two‐, and three‐bedroom flats, townhomes, and lofts and neighborhood and visitor‐serving retail uses are planned for the site. The average household size for the residential units is assumed to be 1.7 persons, based on average household size typical of this product type.1 At Project buildout, the development will accommodate approximately 5,050 residents and 550 employees (see Table 2). Oakland Harbor Partners, LLC, expects the residential units to sell and rent at market rates. Assumptions concerning the development concept, population growth, and household characteristics as well as citywide demographics are shown in Appendix A, which corresponds to the Maximum Project.
1 It is assumed that smaller units will accommodate an average of 1.4 persons and the larger units an average of 2.2 persons.

Tabl
e 2
Proj
ect D
escr
iptio
n at
Bui
ldou
tO
ak to
Nin
th M
ixed
Use
Pro
ject
Fis
cal I
mpa
ct A
naly
sis;
EPS
#14
115
Max
imum
Pro
ject
Tota
l
Res
iden
tial
Uni
ts3,
100
Res
iden
ts (1
)5,
050
Ret
ail
Nin
th A
venu
e Te
rmin
al (s
q. ft
.)18
,000
Oth
er N
ew R
etai
l (sq
. ft.)
182,
000
Empl
oyee
s
Tota
l (2)
550
Ope
n Sp
ace
Tota
l (ac
res)
27
(1)
Ass
umes
:
1.7
pers
ons
per h
ouse
hold
4.17
%ho
usin
g va
canc
y ra
te
(2)
Ass
umes
:10
.0%
reta
il va
canc
y ra
te30
0sq
. ft.
per e
mpl
oyee
4em
ploy
ees
(mai
nten
ance
and
sta
ff) a
t the
Nin
th A
venu
e Te
rmin
al v
isito
r and
cul
tura
l cen
ter
Sou
rce:
Sig
natu
re P
rope
rties
; Eco
nom
ic &
Pla
nnin
g S
yste
ms,
Inc.
Eco
nom
ic P
lann
ing
Sys
tem
s, In
c.
7/15
/200
5P
:\140
00s\
1411
5Oak
to9t
h\Fi
scal
\141
15Fi
scal
6.xl
s
5
9th A
venu
e
9th A
venu
e
9th A
venu
e
9th A
venu
e
9th A
venu
e
9th A
venu
e
9th A
venu
e
9th A
venu
e
9th A
venu
e
10th
Ave
nue
10th
Ave
nue
10th
Ave
nue
10th
Ave
nue
10th
Ave
nue
10th
Ave
nue
10th
Ave
nue
10th
Ave
nue
10th
Ave
nue
Defremery Ave
Defremery Ave
Defremery Ave
Defremery Ave
Defremery Ave
Defremery Ave
Defremery Ave
Defremery Ave
Defremery Ave
I-880
I-880
I-880
I-880
I-880
I-880
I-880
I-880
I-880
8th A
venu
e
8th A
venu
e
8th A
venu
e
8th A
venu
e
8th A
venu
e
8th A
venu
e
8th A
venu
e
8th A
venu
e
8th A
venu
e6th
Ave
nue
6th A
venu
e
6th A
venu
e
6th A
venu
e
6th A
venu
e
6th A
venu
e
6th A
venu
e
6th A
venu
e
6th A
venu
e5th
Ave
nue
5th A
venu
e
5th A
venu
e
5th A
venu
e
5th A
venu
e
5th A
venu
e
5th A
venu
e
5th A
venu
e
5th A
venu
e
Fallon StFallon StFallon StFallon StFallon StFallon StFallon StFallon StFallon St
Emba
rade
roEm
bara
dero
Emba
rade
roEm
bara
dero
Emba
rade
roEm
bara
dero
Emba
rade
roEm
bara
dero
Emba
rade
ro
Vict
ory
CtVi
ctor
y Ct
Vict
ory
Ct
Vict
ory
CtVi
ctor
y Ct
Vict
ory
CtVi
ctor
y Ct
Vict
ory
CtVi
ctor
y Ct
Oak StOak StOak StOak StOak StOak StOak StOak StOak St
Figu
re 1
:Vi
cini
ty M
ap -
Oak
to 9
th M
ixed
Use
Pro
ject
Eco
nom
ic &
Pla
nnin
g S
yste
ms,
Inc.
P:\1
4000
s\14
115O
akto
9th\
Map
s\M
apIn
fo\F
ig_0
1adj
.wor
6

7 P:\14000s\14115Oakto9th\Fiscal\14115fiscal6.doc
III. FISCAL IMPACT METHODOLOGY
This chapter describes the methodology and key assumptions used in estimating the fiscal impacts of the Oak to 9th Mixed‐Use Project. The analysis is based on a number of sources, including the City of Oakland’s 2004‐05 Mid‐Cycle Amended Budget, City, County, and State data sources, and EPS’s experience with similar projects in other jurisdictions. The analysis describes annual operating costs and revenue impacts on the City of Oakland. All revenue and expenditure forecasts are in constant 2005 dollars. For the purpose of evaluating the potential fiscal impact of the Project, this analysis considers impacts at buildout. Key assumptions and calculations are shown in Appendix A.
GENERAL FUND REVENUES
This section describes the methodology and assumptions used for each General Fund revenue item. Table 3 provides a summary of the City’s current General Fund revenues as estimated in the 2004‐05 Mid‐Cycle Amended Budget. Some items are not forecast because they are not expected to be significantly affected by the Oak to 9th Mixed‐Use Project (e.g., transient occupancy tax, licenses and permits).
PROPERTY TAX
Annual property tax is 1 percent of assessed value based on total estimated sales value for the Project. Since the Project is within a redevelopment area, property tax collected is allocated to pass‐throughs, of which the City receives 27.6 percent (net of the Educational Revenue Augmentation Funds shift). The annual property tax forecast at Project buildout is illustrated in Table A‐8.
TRANSFER TAX
The City will receive property transfer tax for any units that are sold. The City receives $15.00 for every $1,000 of value transferred. The City will receive transfer tax revenue for the initial sale of all the residential and commercial units. Furthermore, EPS assumes that in any given year, an average of 10 percent of the residential units will be resold and an average of 2 percent of the commercial units will be resold. The annual property transfer tax forecast is illustrated in Table A‐5.
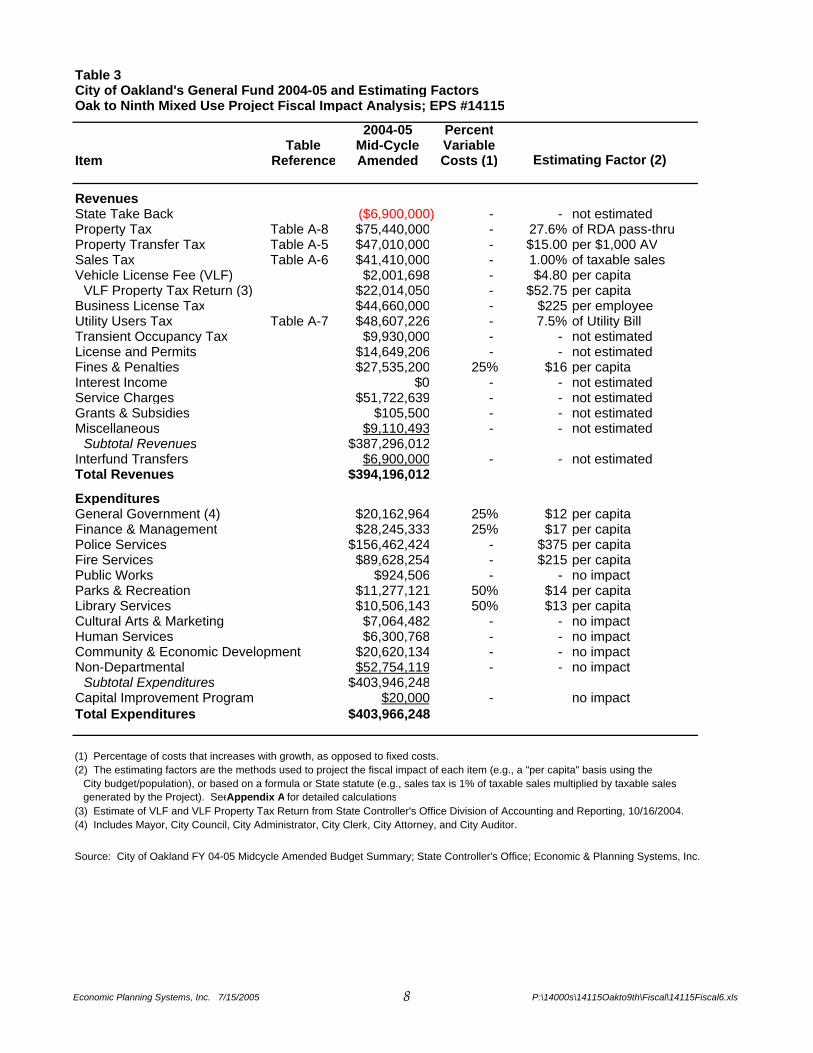
Table 3City of Oakland's General Fund 2004-05 and Estimating FactorsOak to Ninth Mixed Use Project Fiscal Impact Analysis; EPS #14115
2004-05 PercentTable Mid-Cycle Variable
Item Reference Amended Costs (1)
RevenuesState Take Back ($6,900,000) - - not estimatedProperty Tax Table A-8 $75,440,000 - 27.6% of RDA pass-thruProperty Transfer Tax Table A-5 $47,010,000 - $15.00 per $1,000 AVSales Tax Table A-6 $41,410,000 - 1.00% of taxable salesVehicle License Fee (VLF) $2,001,698 - $4.80 per capita
VLF Property Tax Return (3) $22,014,050 - $52.75 per capitaBusiness License Tax $44,660,000 - $225 per employeeUtility Users Tax Table A-7 $48,607,226 - 7.5% of Utility BillTransient Occupancy Tax $9,930,000 - - not estimatedLicense and Permits $14,649,206 - - not estimatedFines & Penalties $27,535,200 25% $16 per capitaInterest Income $0 - - not estimatedService Charges $51,722,639 - - not estimatedGrants & Subsidies $105,500 - - not estimatedMiscellaneous $9,110,493 - - not estimated
Subtotal Revenues $387,296,012Interfund Transfers $6,900,000 - - not estimatedTotal Revenues $394,196,012
ExpendituresGeneral Government (4) $20,162,964 25% $12 per capitaFinance & Management $28,245,333 25% $17 per capitaPolice Services $156,462,424 - $375 per capitaFire Services $89,628,254 - $215 per capitaPublic Works $924,506 - - no impactParks & Recreation $11,277,121 50% $14 per capitaLibrary Services $10,506,143 50% $13 per capitaCultural Arts & Marketing $7,064,482 - - no impactHuman Services $6,300,768 - - no impactCommunity & Economic Development $20,620,134 - - no impactNon-Departmental $52,754,119 - - no impact
Subtotal Expenditures $403,946,248Capital Improvement Program $20,000 - no impactTotal Expenditures $403,966,248
(1) Percentage of costs that increases with growth, as opposed to fixed costs.(2) The estimating factors are the methods used to project the fiscal impact of each item (e.g., a "per capita" basis using the
City budget/population), or based on a formula or State statute (e.g., sales tax is 1% of taxable sales multiplied by taxable salesgenerated by the Project). SeeAppendix A for detailed calculations
(3) Estimate of VLF and VLF Property Tax Return from State Controller's Office Division of Accounting and Reporting, 10/16/2004.(4) Includes Mayor, City Council, City Administrator, City Clerk, City Attorney, and City Auditor.
Source: City of Oakland FY 04-05 Midcycle Amended Budget Summary; State Controller's Office; Economic & Planning Systems, Inc.
Estimating Factor (2)
Economic Planning Systems, Inc. 7/15/2005 P:\14000s\14115Oakto9th\Fiscal\14115Fiscal6.xls8

Final Report Oak to 9th Mixed‐Use Project Fiscal Impact Analysis
July 15, 2005
9 P:\14000s\14115Oakto9th\Fiscal\14115fiscal6.doc
SALES TAX
The commercial development proposed for the Oak to 9th Mixed‐Use Project will include up to 182,000 square feet of commercial space, of which 100 percent is assumed to be sales tax generating retail space. Project retail is assumed to achieve average sales of approximately $150 per square foot. The City receives a 1 percent sales tax on taxable retail items. Revenues from Project retail sales are estimated in Table A‐6. Furthermore, based on household income estimates and consumer spending patterns, it is expected that each new Project household will spend on average approximately $36,900 annually on taxable retail items. EPS assumes that Oakland can expect to capture 65 percent of these purchases, with 35 percent “leaking” to neighboring jurisdictions. The City will receive sales tax revenue from these purchases, as illustrated in Table A‐6.
UTILITY USER TAX
Oakland’s Utility User Tax is 7.5 percent of utility bills for cable, telephone, gas, and electric service (excluding water and garbage). Utility User Tax is charged of both residential and commercial development. Assumptions regarding typical monthly household utility bills and commercial utility bills are illustrated in Table A‐7.
FINES AND PENALTIES
The 2004‐05 City budget indicates that the City will receive approximately $27.5 million, or roughly $67 per capita, in revenue from fines and fees. This analysis assumes that 25 percent of these fines and fees are variable and may increase with the addition of new residents (see Table A‐3). The annual fines and penalties forecast at Project buildout are estimated in Table A‐2.
MOTOR VEHICLE IN‐LIEU FEE
The City of Oakland will receive an estimated $4.86 per capita in VLF from the State. Recent changes in the distribution of the VLF have resulted in cities receiving additional property tax in‐lieu of approximately $55 per capita of VLF; this in‐lieu amount is estimated based on the Project’s addition to City population. Actual increases to the City’s VLF‐property tax exchange will depend on growth in City assessed value; implementation of these changes is still in the process of being defined.
Final Report Oak to 9th Mixed‐Use Project Fiscal Impact Analysis
July 15, 2005
10 P:\14000s\14115Oakto9th\Fiscal\14115fiscal6.doc
GENERAL FUND EXPENDITURES
This section describes the methodology and assumptions used for the General Fund expenditure items. Table A‐3 provides a summary of the City’s current General Fund expenditures as estimated in the 2004‐05 Mid‐Cycle Amended Budget as well as impact estimating factors. A general description of the methods used for this analysis is provided for each item. Some items are not forecast because they are not expected to be affected by the Project (e.g., police, fire, and public works).
GENERAL GOVERNMENT
Currently, the City spends $20.2 million to provide general government services, including budgets for the offices of the Mayor, City Council, City Administrator, City Clerk, City Attorney, and City Auditor divisions. This analysis assumes that 25 percent of General Government costs are variable and may increase with the addition of new residents. The estimates for increased expenditures are provided in Table A‐2.
FINANCE AND MANAGEMENT
Oakland spends $28.2 million to provide finance and management services. Similar to General Government spending, 25 percent of finance and management costs are assumed to be variable. The Project, at buildout, is anticipated to increase the City’s finance and management costs by approximately $17 per new resident (see Table A‐2).
POLICE SERVICES
The City of Oakland presently spends $375 per capita for police services. This analysis assumes that the citywide per capita spending rate is maintained. This is a conservative estimate because the police department will not actually need to expand every service it provides (e.g., administration costs probably will not increase). Therefore, new police costs will likely be less than what is presented here.
FIRE SERVICES
The City of Oakland presently spends $215 per capita for fire services. This analysis assumes that the citywide per capita spending rate is maintained. This is a conservative estimate because the fire department will not actually need to expand every service it provides (e.g., the department will not necessarily require a new fire station and/or company to serve the new development). Therefore, new fire costs will likely be less than what is presented here.

Final Report Oak to 9th Mixed‐Use Project Fiscal Impact Analysis
July 15, 2005
11 P:\14000s\14115Oakto9th\Fiscal\14115fiscal6.doc
PARKS AND RECREATION
Oakland Harbor Partners, LLC, plans to incorporate and maintain 27 acres of public open space within the Project. Therefore, City and the new Project residents are expected to affect the City’s Parks and Recreation budget by increasing demand for recreational programs. Oakland’s 2004‐05 Budget allocates $11.3 million for Parks and Recreation. Assuming 50 percent of costs are variable, the new Project would result in an estimated $14 per capita increase (see Table A‐2).
LIBRARY SERVICES
In 2004‐05, Oakland’s budget allocated $10.5 million for the City’s public library system. Assuming 50 percent of library costs are variable, this corresponds to an approximate cost of $13 per resident. The new Project residents would increase demand on the library system accordingly. See Table A‐2 for an estimate at project buildout.
OTHER REVENUES
TRANSFER TAX FROM INITIAL SALE
The property transfer tax is based on the Project’s total assessed value. In this case, the Project’s total assessed value includes the residential, retail, and rehabilitated historic building portions of the site. The Project’s residential assessed value was calculated based on the market rate average sales price (assuming all units are for sale) in constant 2005 dollars and appreciated at 2 percent annually through buildout in 2017. The retail and rehabilitated historic building’s assessed value were also calculated in constant 2005 dollars, but were not appreciated over buildout. Oakland charges a property transfer tax of $15.00 per $1,000 value. The amount on Table A‐5 represents the transfer tax collected from the initial sale of all new units. After the initial sale of the units, the calculation of ongoing transfer tax revenues from the resale of the units is illustrated in Table A‐2, and shown as an annual General Fund revenue item.
REDEVELOPMENT AGENCY REVENUE
Since the Project area is within the City of Oakland’s Central City East District Redevelopment Area (Redevelopment Area), property tax goes to the City’s Redevelopment Agency (RDA). Twenty‐five percent of the property tax goes to the City’s Low and Moderate Income Housing Fund (Housing Set‐Aside). Twenty percent of property tax goes to pass‐throughs (Tier 1) over the life of the Redevelopment Area (45 years), an additional 16.8 percent of property tax goes to pass‐throughs (Tier 2) in

Final Report Oak to 9th Mixed‐Use Project Fiscal Impact Analysis
July 15, 2005
12 P:\14000s\14115Oakto9th\Fiscal\14115fiscal6.doc
years 11‐45, and another 11.2 percent of property tax goes to pass‐throughs (Tier 3) in years 31‐45, which distribute revenues among eligible taxing entities. One of these entities is the City itself. Oakland’s General Fund receives 27.6 percent of the pass‐throughs (net of the Educational Revenue Augmentation Funds [ERAF] shift). The remainder of the pass‐through revenue is distributed to the other taxing agencies. The amount remaining after the Housing Set‐Aside and pass‐throughs go to the RDA and is shown in Table A‐8.
TAX INCREMENT FINANCING
The Redevelopment Area was adopted on July 29, 2003 and is effective for 30 years after adoption, or 2033, but may continue to pay debt service for previously incurred debt through the 45th year. The tax increment amounts over the remaining life of the Redevelopment Area from 2008 to 2048 are shown in Table A‐8. The gross tax increment for the Project, which includes the residential (appreciated at a rate of 2 percent “real” growth rate each year above inflation), retail, and historic portions within the Project, is calculated by adding all of the tax revenue (1 percent of assessed value per year) generated in years 2008 (start of construction) through 2048 (remaining life of Redevelopment Area) in constant 2005 dollars. However, this amount will be reduced by pass‐throughs to the City’s General Fund and other taxing agencies, the Housing Set‐Aside, ERAF shift, and Agency administrative fees, resulting in net tax increment proceeds. This revenue may support bonds for improvements or housing, or the increment could be used as “pay‐as‐you‐go” funding.
OTHER ECONOMIC EFFECTS
CONSTRUCTION VALUE AND CONSTRUCTION JOBS
Rehabilitation of historic buildings and construction of new residential, commercial, and parking structures will generate a construction value, calculated in Table A‐9. It is assumed that approximately half of the construction costs will be for labor. Based on an average yearly wage for construction workers in the Oakland area, the construction job‐years created by the Project were estimated. These calculations are also illustrated in Table A‐9.
TOTAL NEW HOUSEHOLD EXPENDITURES
New project households are expected to spend approximately 72 percent of their household incomes on taxable and non‐taxable goods and services, including housing, based on data collected by the U.S. Bureau of Labor Statistics Consumer Expenditure Survey. Non‐taxable expenditures such as groceries, housing, health care, education, and insurance are estimated by multiplying a household’s average annual income by

Final Report Oak to 9th Mixed‐Use Project Fiscal Impact Analysis
July 15, 2005
13 P:\14000s\14115Oakto9th\Fiscal\14115fiscal6.doc
72 percent and subtracting the household’s estimated taxable expenditures. Although none of these non‐taxable expenditures has a direct impact on the City’s General Fund, expenditures within the City of Oakland will have indirect effects on the economy of the City and the region. Approximately 28 percent of household expenditures are taxable; annual sales tax revenue to the City’s General Fund is estimated in Table A‐2.

Economic &
Planning Systems Real Estate Economics Regional Economics Public Finance Land Use Policy
APPENDIX A:
MAXIMUM PROPOSED PROJECT

Appendix ATable of ContentsOak to Ninth Mixed Use Project Fiscal Impact Analysis; EPS #14115
Table # Name
Impact Estimating MethodologyTable A-1 Project DescriptionTable A-2 Annual Fiscal Impact SummaryTable A-3 City of Oakland's General Fund 2004-05 and Estimating FactorsTable A-4 Citywide Demographic Data
RevenuesTable A-5 Transfer Tax CalculationTable A-6 Sales Tax CalculationTable A-7 Utility Tax CalculationTable A-8 Redevelopment Agency Property Tax CollectionTable A-9 Construction Value and Jobs
Economic & Planning Systems, Inc. 7/15/2005 P:\14000s\14115Oakto9th\Fiscal\14115Fiscal6.xls

Table A-1Project DescriptionOak to Ninth Mixed Use Project Fiscal Impact Analysis; EPS #14115
Total at Buildout 2008 2009 2010 2011 2012 2013 2014 2015 2016 2017
ResidentialResidential Units 3,100 310 310 310 310 310 310 310 310 310 310Cumulative 3,100 310 620 930 1,240 1,550 1,860 2,170 2,480 2,790 3,100
Residents (1) 5,050 505 505 505 505 505 505 505 505 505 505Cumulative 5,050 505 1,010 1,515 2,020 2,525 3,030 3,535 4,040 4,545 5,050
Non-Residential9th Ave. Terminal Rehabilitation 18,000 18,000 0 0 0 0 0 0 0 0 0Cumulative 18,000 18,000 18,000 18,000 18,000 18,000 18,000 18,000 18,000 18,000 18,000
New Retail 182,000 0 0 60,667 0 60,667 0 60,667 0 0 0Cumulative 182,000 0 0 60,667 60,667 121,333 121,333 182,000 182,000 182,000 182,000
Employees (2) 550 4 0 182 0 182 0 182 0 0 0Cumulative 550 4 4 186 186 368 368 550 550 550 550
(1) Assumes: 1.7 persons per household4.17% housing vacancy rate
(2) Assumes: 10.0% retail vacancy rate300 sq. ft. per employee
4 employees at 9th St. Terminal
Source: Signature Properties; Economic & Planning Systems, Inc.
Economic & Planning Systems, Inc. 7/15/2005 P:\14000s\14115Oakto9th\Fiscal\14115Fiscal6.xls

Table A-2Annual Fiscal Impact SummaryOak to Ninth Mixed Use Project Fiscal Impact Analysis; EPS #14115
Item Total 2008 2009 2010 2011
CITY GENERAL FUNDRevenues (Annual)
Property Tax $1,225,949 $72,585 $148,073 $235,336 $316,895Property Transfer Tax $2,373,262 $197,385 $402,665 $620,855 $842,642Sales Tax $767,849 $47,686 $96,326 $227,838 $278,443Vehicle License Fee (VLF) $24,222 $2,422 $4,844 $7,267 $9,689
VLF Property Tax Return (3) $266,389 $26,639 $53,278 $79,917 $106,555Business License Tax $123,762 $900 $900 $41,854 $41,854Utility Users Tax $483,825 $45,987 $91,974 $137,961 $191,933Fines & Penalties $83,300 $8,330 $16,660 $24,990 $33,320
Total $5,348,558 $401,934 $814,720 $1,376,017 $1,821,332
Expenditures (Annual)
General Government $60,997 $6,100 $12,199 $18,299 $24,399Finance & Management $85,448 $8,545 $17,090 $25,634 $34,179Police Services $1,893,328 $189,333 $378,666 $567,998 $757,331Fire Services $1,084,578 $108,458 $216,916 $325,373 $433,831Parks & Recreation $68,231 $6,823 $13,646 $20,469 $27,293Library Services $63,567 $6,357 $12,713 $19,070 $25,427
Total $3,256,150 $325,615 $651,230 $976,845 $1,302,460
Net General Fund $2,092,409 $76,319 $163,490 $399,173 $518,872
OTHER CITY REVENUES (At Buildout in 2017)
Transfer Tax From Initial Sale $22,329,698 $1,973,847 $2,013,324 $2,292,465 $2,094,662
Redevelopment Agency RevenuePass-Throughs to other Agencies (excluding City's General Fund $4,445,064 $263,180 $536,886 $853,286 $1,149,003Housing Set-Asides $4,050,987 $328,974 $671,108 $1,066,608 $1,436,254Net to RDA $5,752,858 $550,309 $1,122,629 $1,784,221 $2,402,566Total $14,248,909 $1,142,463 $2,330,624 $3,704,115 $4,987,823
OTHER ECONOMIC EFFECTS (At Buildout in 2017)
Construction Value $826,500,000 $81,440,000 $78,740,000 $90,873,333 $78,740,000Construction Jobs 6,603 651 629 726 629New Household Expenditures
Taxable Retai $109,594,743 $9,170,398 $18,707,612 $28,622,646 $38,926,798Other $171,983,357 $14,390,798 $29,357,228 $44,916,559 $61,086,520Total $281,578,100 $23,561,196 $48,064,839 $73,539,204 $100,013,318
Source: Economic & Planning Systems, Inc.
Economic & Planning Systems, Inc. 7/15/2005 P:\14000a\14115Oakto9th\Fiscal\14115Fiscal6.xls

Table A-2Annual Fiscal Impact SummaryOak to Ninth Mixed Use Project Fiscal Impact Analysis; EPS #14115
Item
CITY GENERAL FUNDRevenues (Annual)
Property Tax Property Transfer TaxSales TaxVehicle License Fee (VLF)
VLF Property Tax Return (3)Business License TaxUtility Users TaxFines & Penalties
Total
Expenditures (Annual)
General GovernmentFinance & ManagementPolice ServicesFire ServicesParks & RecreationLibrary Services
Total
Net General Fund
OTHER CITY REVENUES (At Buildout in 2017)
Transfer Tax From Initial Sale
Redevelopment Agency RevenuePass-Throughs to other Agencies (excluding City's General FundHousing Set-AsidesNet to RDATotal
OTHER ECONOMIC EFFECTS (At Buildout in 2017)
Construction ValueConstruction JobsNew Household Expenditures
Taxable RetaiOtherTotal
Source: Economic & Planning Systems, Inc.
2012 2013 2014 2015 2016 2017
$410,410 $498,406 $682,670 $857,141 $1,038,170 $1,225,949$1,077,833 $1,317,127 $1,570,343 $1,828,196 $2,095,741 $2,373,262
$411,960 $464,609 $600,212 $654,988 $710,860 $767,849$12,111 $14,533 $16,956 $19,378 $21,800 $24,222
$133,194 $159,833 $186,472 $213,111 $239,750 $266,389$82,808 $82,808 $123,762 $123,762 $123,762 $123,762
$237,920 $291,892 $337,879 $391,851 $437,838 $483,825$41,650 $49,980 $58,310 $66,640 $74,970 $83,300
$2,407,886 $2,879,189 $3,576,604 $4,155,067 $4,742,891 $5,348,558
$30,499 $36,598 $42,698 $48,798 $54,898 $60,997$42,724 $51,269 $59,814 $68,359 $76,903 $85,448
$946,664 $1,135,997 $1,325,330 $1,514,663 $1,703,995 $1,893,328$542,289 $650,747 $759,205 $867,662 $976,120 $1,084,578$34,116 $40,939 $47,762 $54,585 $61,408 $68,231$31,783 $38,140 $44,497 $50,853 $57,210 $63,567
$1,628,075 $1,953,690 $2,279,305 $2,604,920 $2,930,535 $3,256,150
$779,811 $925,500 $1,297,299 $1,550,148 $1,812,356 $2,092,409
$2,375,430 $2,179,286 $2,461,747 $2,267,330 $2,312,676 $2,358,930
$1,488,070 $1,807,129 $2,475,236 $3,107,836 $3,764,213 $4,445,064$1,860,088 $2,258,911 $2,712,788 $3,142,544 $3,588,452 $4,050,987$3,111,555 $3,778,707 $4,278,698 $4,752,116 $5,243,329 $5,752,858$6,459,713 $7,844,748 $9,466,722 $11,002,496 $12,595,993 $14,248,909
$90,873,333 $78,740,000 $90,873,333 $78,740,000 $78,740,000 $78,740,000726 629 726 629 629 629
$49,631,668 $60,749,161 $72,291,502 $84,271,237 $96,701,244 $109,594,743$77,885,313 $95,331,623 $113,444,631 $132,244,027 $151,750,021 $171,983,357
$127,516,980 $156,080,784 $185,736,133 $216,515,264 $248,451,265 $281,578,100
Economic & Planning Systems, Inc. 7/15/2005 P:\14000a\14115Oakto9th\Fiscal\14115Fiscal6.xls

Table A-3City of Oakland's General Fund 2004-05 and Estimating FactorsOak to Ninth Mixed Use Project Fiscal Impact Analysis; EPS #14115
2004-05 PercentTable Mid-Cycle Variable
Item Reference Amended Costs (1)
RevenuesState Take Back ($6,900,000) - - not estimatedProperty Tax Table A-8 $75,440,000 - 27.6% of RDA pass-thruProperty Transfer Tax Table A-5 $47,010,000 - $15.00 per $1,000 AVSales Tax Table A-6 $41,410,000 - 1.00% of taxable salesVehicle License Fee (VLF) $2,001,698 - $4.80 per capita
VLF Property Tax Return (3) $22,014,050 - $52.75 per capitaBusiness License Tax $44,660,000 - $225 per employeeUtility Users Tax Table A-7 $48,607,226 - 7.5% of Utility BillTransient Occupancy Tax $9,930,000 - - not estimatedLicense and Permits $14,649,206 - - not estimatedFines & Penalties $27,535,200 25% $16 per capitaInterest Income $0 - - not estimatedService Charges $51,722,639 - - not estimatedGrants & Subsidies $105,500 - - not estimatedMiscellaneous $9,110,493 - - not estimated
Subtotal Revenues $387,296,012Interfund Transfers $6,900,000 - - not estimatedTotal Revenues $394,196,012
ExpendituresGeneral Government (4) $20,162,964 25% $12 per capitaFinance & Management $28,245,333 25% $17 per capitaPolice Services $156,462,424 - $375 per capitaFire Services $89,628,254 - $215 per capitaPublic Works $924,506 - - no impactParks & Recreation $11,277,121 50% $14 per capitaLibrary Services $10,506,143 50% $13 per capitaCultural Arts & Marketing $7,064,482 - - no impactHuman Services $6,300,768 - - no impactCommunity & Economic Development $20,620,134 - - no impactNon-Departmental $52,754,119 - - no impact
Subtotal Expenditures $403,946,248Capital Improvement Program $20,000 - - no impactTotal Expenditures $403,966,248
(1) Percentage of costs that increase with growth, as opposed to fixed costs.(2) The estimating factors are the methods used to project the fiscal impact of each item (e.g., a "per capita" basis using the
City budget/population), or based on a formula or State statute (e.g., sales tax is 1% of taxable sales multiplied by taxable salesgenerated by the Project). See Appendix A for detailed calculations.
(3) Estimate of VLF and VLF Property Tax Return from State Controller's Office Division of Accounting and Reporting, 10/16/2004.(4) Includes Mayor, City Council, City Administrator, City Clerk, City Attorney, and City Auditor.
Source: City of Oakland FY 2004-2005 Midcycle Amended Budget Summary; Economic & Planning Systems, Inc.
Estimating Factor (2)
Economic & Planning Systems, Inc. 7/15/2005 P:\14000a\14115Oakto9th\Fiscal\14115Fiscal6.xls

Table A-4Citywide Demographic DataOak to Ninth Mixed Use Project Fiscal Impact Analysis; EPS #14115
Item Amount Source
Households (2004) 155,402 Oak to 9th Project EIR (2005)Mean Household Income (2004$) $66,696 ABAG Projections 2005 (1)Single-Family Housing Units 78,752 DoFMultifamily Housing Units 81,380 DoFPersons per Household 1.7 Oak to 9th Project EIR (2005)Housing Vacancy 4.17% DoFPopulation 417,346 Oak to 9th Project EIR (2005)Employees 198,469 Oak to 9th Project EIR (2005)Square Feet per Employee 300 EPSRetail Vacancy 10% EPSDaytime Population 516,581 Residents plus 0.5 employees
(1) Adjusted for inflation based on BLS San Francisco Area "All Expenditures" Consumer Price Index (CPI).
Sources: California DoF; Oak to 9th Project EIR, 11/15/04; ABAG Projections 2005; Hausrath Economics Group;Economic & Planning Systems, Inc.
Economic Planning Systems, Inc. 7/15/2005 P:\14000s\14115Oakto9th\Fiscal\14115Fiscal6.xls

Table A-5Transfer Tax CalculationOak to Ninth Mixed Use Project Fiscal Impact Analysis; EPS #14115
Total atBuildout 2008 2009 2010 2011
6 7 8 9
Assessed Value
Residential (1)Annual 3,100 310 310 310 310AV - Annual $1,440,871,509 $131,589,792 $134,221,588 $136,906,020 $139,644,140Cumulative 3,100 310 620 930 1,240AV - Cumulative $1,572,619,825 $131,589,792 $268,443,176 $410,718,059 $558,576,560
Retail (2)Annual 0 0 60,667 0AV - Annual $47,775,000 $0 $0 $15,925,000 $0Cumulative 182,000 0 0 60,667 60,667
$1.75 per Sq. Ft. lease rate $1.75 $1.75 $1.75 $1.75 $1.75AV - Cumulative $47,775,000 $0 $0 $15,925,000 $15,925,000
Rehabilitated Historic Building (3)Annual 18,000 0 0 0AV - Annual $0 $0 $0 $0 $0Cumulative 18,000 18,000 18,000 18,000 18,000
$0.00 per Sq. Ft. value $0.00 $0.00 $0.00 $0.00 $0.00AV - Cumulative $0 $0 $0 $0 $0
Total Project AV (Cumulative) $1,620,394,825 $131,589,792 $268,443,176 $426,643,059 $574,501,560
Transfer Tax at Initial Sale $15.00 per $1,000 AV $22,329,698 $1,973,847 $2,013,324 $2,292,465 $2,094,662
Annual Transfer Tax Revenue to 10% residential turnover rate $2,358,930 $197,385 $402,665 $616,077 $837,865City's General Fund (4) 2% commercial turnover rate $14,333 $0 $0 $4,778 $4,778
Total Annual Transfer Tax $2,373,262 $197,385 $402,665 $620,855 $842,642
(1) Assumes a 2% "real" growth rate (i.e. 2% appreciation above inflation)(2) Assumes a $1.75 lease rate and an 8% cap rate.(3) Assumes the rehabilitated Historic Building has no market value.(4) Assumes that, on average, 10% of the residences and 2% of
commercial properties are sold in a given year.
Source: City of Oakland; County of Alameda; Signature Properties, Inc.; Economic & Planning Systems, Inc.
Value
Economic & Planning Systems, Inc. 7/15/2005 P:\14000s\14115Oakto9th\Fiscal\14115Fiscal6.xls

Table A-5Transfer Tax CalculationOak to Ninth Mixed Use Project Fiscal Impact Analysis; EPS #14115
Assessed Value
Residential (1)AnnualAV - AnnualCumulativeAV - Cumulative
Retail (2)AnnualAV - AnnualCumulative
AV - Cumulative
Rehabilitated Historic Building (3)AnnualAV - AnnualCumulative
AV - Cumulative
Total Project AV (Cumulative)
Transfer Tax at Initial Sale
Annual Transfer Tax Revenue toCity's General Fund (4)
Total Annual Transfer Tax
(1) Assumes a 2% "real" growth rate (i.e. 2% appreciation above inflation)(2) Assumes a $1.75 lease rate and an 8% cap rate.(3) Assumes the rehabilitated Historic Building has no market value.(4) Assumes that, on average, 10% of the residences and 2% of
commercial properties are sold in a given year.
Source: City of Oakland; County of Alameda; Signature Properties, Inc.; Economic & Planning Systems, Inc.
2012 2013 2014 2015 2016 201710 11 12 13 14 15
310 310 310 310 310 310$142,437,023 $145,285,763 $148,191,479 $151,155,308 $154,178,414 $157,261,983
1,550 1,860 2,170 2,480 2,790 3,100$712,185,114 $871,714,579 $1,037,340,350 $1,209,242,465 $1,387,605,728 $1,572,619,825
60,667 0 60,667 0 0 0$15,925,000 $0 $15,925,000 $0 $0 $0
121,333 121,333 182,000 182,000 182,000 182,000$1.75 $1.75 $1.75 $1.75 $1.75 $1.75
$31,850,000 $31,850,000 $47,775,000 $47,775,000 $47,775,000 $47,775,000
0 0 0 0 0 0$0 $0 $0 $0 $0 $0
18,000 18,000 18,000 18,000 18,000 18,000$0.00 $0.00 $0.00 $0.00 $0.00 $0.00
$0 $0 $0 $0 $0 $0
$744,035,114 $903,564,579 $1,085,115,350 $1,257,017,465 $1,435,380,728 $1,620,394,825
$2,375,430 $2,179,286 $2,461,747 $2,267,330 $2,312,676 $2,358,930
$1,068,278 $1,307,572 $1,556,011 $1,813,864 $2,081,409 $2,358,930$9,555 $9,555 $14,333 $14,333 $14,333 $14,333
$1,077,833 $1,317,127 $1,570,343 $1,828,196 $2,095,741 $2,373,262
Economic & Planning Systems, Inc. 7/15/2005 P:\14000s\14115Oakto9th\Fiscal\14115Fiscal6.xls

Table A-6Sales Tax CalculationOak to Ninth Mixed Use Project Fiscal Impact Analysis; EPS #14115
Item Total atBuildout 2008 2009 2010 2011
Average HH Taxable Retail Exp. (1) 28% of income $36,892 $30,869 $31,487 $32,116 $32,759
Total HH Exp. Captured by Oakland (2) 65% of taxable exp. $23,979 $20,065 $20,466 $20,876 $21,293
New Occupied Homes (3) 2,971 297 594 891 1,188New Taxable Sales in Oakland, attributable to New Homes $65,268,644 $5,960,759 $12,040,732 $18,242,306 $24,567,910Total New Sales Tax 1% of taxable sales $652,686 $59,608 $120,407 $182,423 $245,679
Total New Sales Tax outside Project Area Retail (4) 80% of new sales tax $522,149 $47,686 $96,326 $145,938 $196,543
Sales Tax Generated From New Project Retail (5)
New Occupied Retail Sq. Ft. 163,800 0 0 54,600 54,600New Retail Sales $150 Sales per Sq. Ft. $24,570,000 $0 $0 $8,190,000 $8,190,000Sales Tax Generated by Project Area Retail 1% of taxable sales $245,700 $0 $0 $81,900 $81,900
Total Sales Tax Generated by Project $767,849 $47,686 $96,326 $227,838 $278,443
(1) The U.S. Bureau of Labor Statistics Consumer Expenditure Survey indicates that Bay Area households with average incomes approximately $75,000 spend 28% of income on taxable expenditures.
(2) Assumes 65% of taxable expenditures made by Oakland households are made within Oakland.(3) Assumes a residential vacancy rate of 4.17%.(4) Assumes 80% of taxable expenditures made by new project households are made outside the project's new retail development.(5) Assumes 10% retail vacancy rate; retail uses achieve $150 in sales per square foot.
Source: U.S. Bureau of Labor Statistics, City of Oakland; Economic & Planning Systems, Inc.
Assumptions
Economic Planning Systems, Inc. 7/15/2005 P:\14000s\14115Oakto9th\Fiscal\14115Fiscal6.xls

Table A-6Sales Tax CalculationOak to Ninth Mixed Use Project Fiscal Impact Analysis; EPS #14115
Item
Average HH Taxable Retail Exp. (1)
Total HH Exp. Captured by Oakland (2)
New Occupied Homes (3)New Taxable Sales in Oakland, attributable to New HomesTotal New Sales Tax
Total New Sales Tax outside Project Area Retail (4)
Sales Tax Generated From New Project Retail (5)
New Occupied Retail Sq. Ft. New Retail Sales Sales Tax Generated by Project Area Retail
Total Sales Tax Generated by Project
(1) The U.S. Bureau of Labor Statistics Consumer Expenditure Survey indicates that Bay Area households with average incomes approximately $75,000 spend 28% of income on taxable expenditures.
(2) Assumes 65% of taxable expenditures made by Oakland households are made within Oakland.(3) Assumes a residential vacancy rate of 4.17%.(4) Assumes 80% of taxable expenditures made by new project households are made outside the project's new retail development.(5) Assumes 10% retail vacancy rate; retail uses achieve $150 in sales per square foot.
Source: U.S. Bureau of Labor Statistics, City of Oakland; Economic & Planning Systems, Inc.
2012 2013 2014 2015 2016 2017
$33,414 $34,082 $34,764 $35,459 $36,168 $36,892
$21,719 $22,153 $22,596 $23,048 $23,509 $23,979
1,485 1,782 2,080 2,377 2,674 2,971$31,020,027 $37,601,186 $44,313,969 $51,161,007 $58,144,985 $65,268,644
$310,200 $376,012 $443,140 $511,610 $581,450 $652,686
$248,160 $300,809 $354,512 $409,288 $465,160 $522,149
109,200 109,200 163,800 163,800 163,800 163,800$16,380,000 $16,380,000 $24,570,000 $24,570,000 $24,570,000 $24,570,000
$163,800 $163,800 $245,700 $245,700 $245,700 $245,700
$411,960 $464,609 $600,212 $654,988 $710,860 $767,849
Economic Planning Systems, Inc. 7/15/2005 P:\14000s\14115Oakto9th\Fiscal\14115Fiscal6.xls
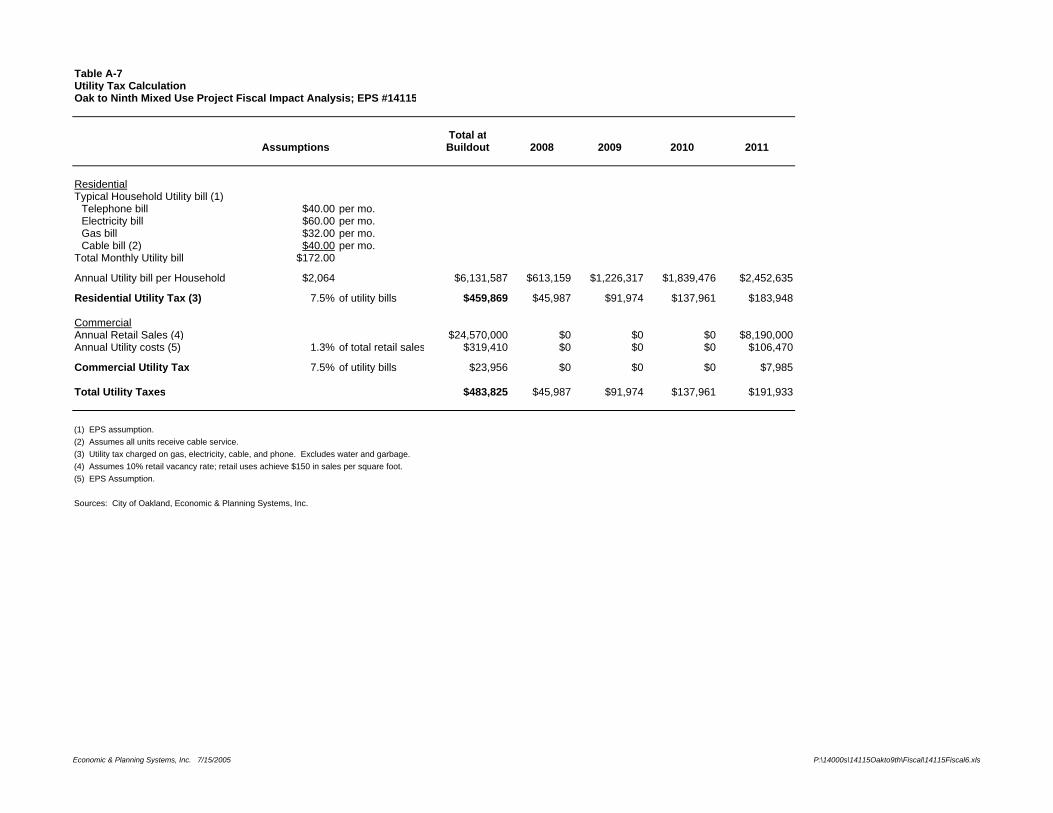
Table A-7Utility Tax CalculationOak to Ninth Mixed Use Project Fiscal Impact Analysis; EPS #14115
Total atAssumptions Buildout 2008 2009 2010 2011
ResidentialTypical Household Utility bill (1)
Telephone bill $40.00 per mo.Electricity bill $60.00 per mo.Gas bill $32.00 per mo.Cable bill (2) $40.00 per mo.
Total Monthly Utility bill $172.00
Annual Utility bill per Household $2,064 $6,131,587 $613,159 $1,226,317 $1,839,476 $2,452,635
Residential Utility Tax (3) 7.5% of utility bills $459,869 $45,987 $91,974 $137,961 $183,948
CommercialAnnual Retail Sales (4) $24,570,000 $0 $0 $0 $8,190,000Annual Utility costs (5) 1.3% of total retail sales $319,410 $0 $0 $0 $106,470
Commercial Utility Tax 7.5% of utility bills $23,956 $0 $0 $0 $7,985
Total Utility Taxes $483,825 $45,987 $91,974 $137,961 $191,933
(1) EPS assumption.(2) Assumes all units receive cable service.(3) Utility tax charged on gas, electricity, cable, and phone. Excludes water and garbage.(4) Assumes 10% retail vacancy rate; retail uses achieve $150 in sales per square foot.(5) EPS Assumption.
Sources: City of Oakland, Economic & Planning Systems, Inc.
Economic & Planning Systems, Inc. 7/15/2005 P:\14000s\14115Oakto9th\Fiscal\14115Fiscal6.xls

Table A-7Utility Tax CalculationOak to Ninth Mixed Use Project Fiscal Impact Analysis; EPS #14115
Assumptions
ResidentialTypical Household Utility bill (1)
Telephone bill $40.00 per mo.Electricity bill $60.00 per mo.Gas bill $32.00 per mo.Cable bill (2) $40.00 per mo.
Total Monthly Utility bill $172.00
Annual Utility bill per Household $2,064
Residential Utility Tax (3) 7.5% of utility bills
CommercialAnnual Retail Sales (4)Annual Utility costs (5) 1.3% of total retail sale
Commercial Utility Tax 7.5% of utility bills
Total Utility Taxes
(1) EPS assumption.(2) Assumes all units receive cable service.(3) Utility tax charged on gas, electricity, cable, and phone. Excludes water and garbage.(4) Assumes 10% retail vacancy rate; retail uses achieve $150 in sales per square foot.(5) EPS Assumption.
Sources: City of Oakland, Economic & Planning Systems, Inc.
2012 2013 2014 2015 2016 2017
$3,065,793 $3,678,952 $4,292,111 $4,905,269 $5,518,428 $6,131,587
$229,935 $275,921 $321,908 $367,895 $413,882 $459,869
$8,190,000 $16,380,000 $16,380,000 $24,570,000 $24,570,000 $24,570,000$106,470 $212,940 $212,940 $319,410 $319,410 $319,410
$7,985 $15,971 $15,971 $23,956 $23,956 $23,956
$237,920 $291,892 $337,879 $391,851 $437,838 $483,825
Economic & Planning Systems, Inc. 7/15/2005 P:\14000s\14115Oakto9th\Fiscal\14115Fiscal6.xls

Table A-8Redevelopment Agency Property Tax CollectionOak to Ninth Mixed Use Project Fiscal Impact Analysis; EPS #14115
Total OverTotal at Remaining Life 2008 2009 2010 2011
Item Buildout of Redev. Area 5 6 7 8
Gross Tax Increment 1.0% of AV $16,203,948 $779,073,944 $1,315,898 $2,684,432 $4,266,431 $5,745,016New Base Yr. 11 to 30New Base Yr. 31 to 45
Tier 1 Pass-Through Obligations (1) 20.0% of Total Tax Revenue $3,240,790 $155,814,789 $263,180 $536,886 $853,286 $1,149,003Tier 2 Pass-Through Obligations (1) 16.8% of Total Tax Revenue $1,204,275 $72,632,879 $0 $0 $0 $0Tier 3 Pass-Through Obligations (1) 11.2% of Total Tax Revenue $0 $6,381,619 $0 $0 $0 $0
Subtotal Pass-Throughs $4,445,064 $234,829,287 $263,180 $536,886 $853,286 $1,149,003
Percent of Pass-Throughs to the City's General Fund 27.6% of Pass-Throughs $1,225,949 $64,765,917 $72,585 $148,073 $235,336 $316,895
Low-Moderate Income Housing Fund (2) 25.0% of Total Tax Revenue $4,050,987 $194,768,486 $328,974 $671,108 $1,066,608 $1,436,254
ERAF Shift (3) 5.8% of Total Tax Revenue $939,829 $45,186,289 $76,322 $155,697 $247,453 $333,211
Tax Increment Available $6,768,068 $304,289,882 $647,422 $1,320,740 $2,099,084 $2,826,548
Agency Admin (4) 15.0% of Total Tax Revenue $1,015,210 $24,329,642 $97,113 $198,111 $314,863 $423,982
Net Tax Increment $5,752,858 $279,960,240 $550,309 $1,122,629 $1,784,221 $2,402,566
(1) AB 1290 Pass-Throughs. Tier 2 commences in year 11, and Tier 3 commences in year 31.(2) According to Patrick Lane of the City of Oakland Redevelopment Agency, the
Low-Moderate Income Housing Fund percentage increased from 20% to 25% in 2001.(3) According to Patrick Lane of the City of Oakland Redevelopment Agency, the ERAF shift will
end in FY '05-06, but the City is anticipating that the deductions could continue. For our estimates, we are assuming the Agency's deduction of 5.8% for FY '06-07 for the life of the project.
(4) Administration of the Project Area is funded over the 30-year effective life of the Redevelopment Plan.
Source: City of Oakland; County of Alameda; Economic & Planning Systems, Inc.
Assumptions
Fiscal Year Ending
Economic & Planning Systems, Inc. 7/15/2005 P:\14000s\14115Oakto9th\Fiscal\14115Fiscal6.xls
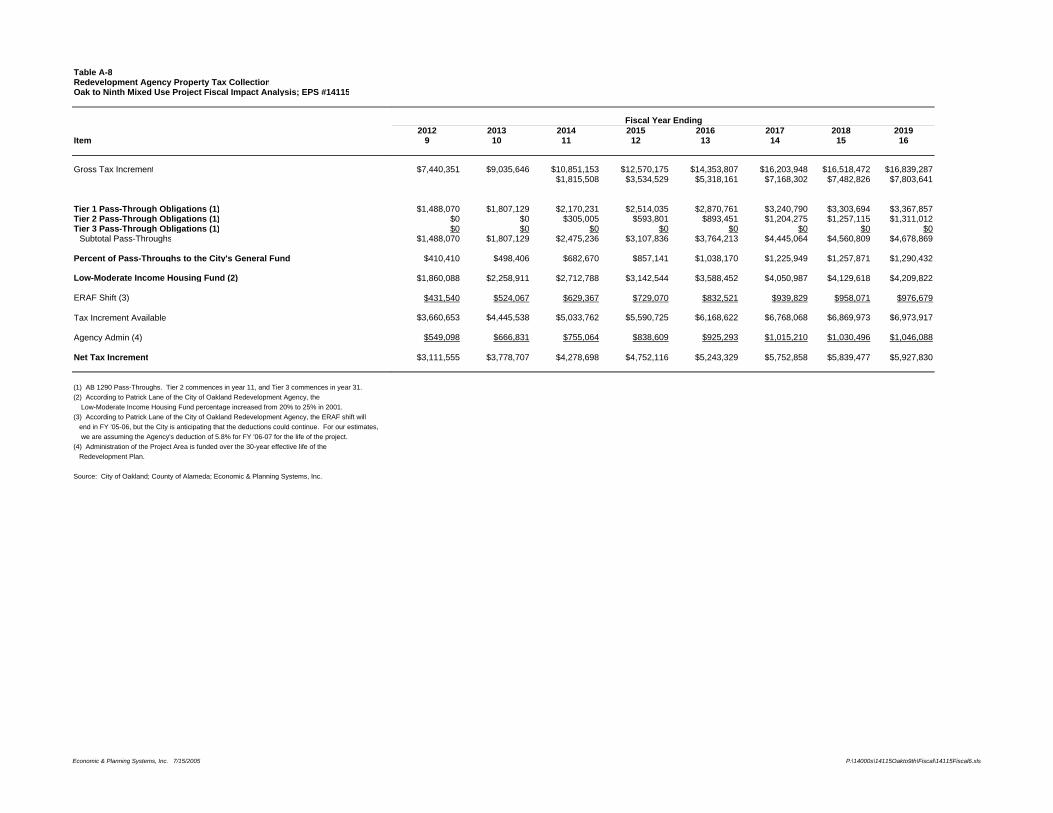
Table A-8Redevelopment Agency Property Tax CollectionOak to Ninth Mixed Use Project Fiscal Impact Analysis; EPS #14115
Item
Gross Tax Increment
Tier 1 Pass-Through Obligations (1)Tier 2 Pass-Through Obligations (1)Tier 3 Pass-Through Obligations (1)
Subtotal Pass-Throughs
Percent of Pass-Throughs to the City's General Fund
Low-Moderate Income Housing Fund (2)
ERAF Shift (3)
Tax Increment Available
Agency Admin (4)
Net Tax Increment
(1) AB 1290 Pass-Throughs. Tier 2 commences in year 11, and Tier 3 commences in year 31.(2) According to Patrick Lane of the City of Oakland Redevelopment Agency, the
Low-Moderate Income Housing Fund percentage increased from 20% to 25% in 2001.(3) According to Patrick Lane of the City of Oakland Redevelopment Agency, the ERAF shift will
end in FY '05-06, but the City is anticipating that the deductions could continue. For our estimates, we are assuming the Agency's deduction of 5.8% for FY '06-07 for the life of the project.
(4) Administration of the Project Area is funded over the 30-year effective life of the Redevelopment Plan.
Source: City of Oakland; County of Alameda; Economic & Planning Systems, Inc.
2012 2013 2014 2015 2016 2017 2018 20199 10 11 12 13 14 15 16
$7,440,351 $9,035,646 $10,851,153 $12,570,175 $14,353,807 $16,203,948 $16,518,472 $16,839,287$1,815,508 $3,534,529 $5,318,161 $7,168,302 $7,482,826 $7,803,641
$1,488,070 $1,807,129 $2,170,231 $2,514,035 $2,870,761 $3,240,790 $3,303,694 $3,367,857$0 $0 $305,005 $593,801 $893,451 $1,204,275 $1,257,115 $1,311,012$0 $0 $0 $0 $0 $0 $0 $0
$1,488,070 $1,807,129 $2,475,236 $3,107,836 $3,764,213 $4,445,064 $4,560,809 $4,678,869
$410,410 $498,406 $682,670 $857,141 $1,038,170 $1,225,949 $1,257,871 $1,290,432
$1,860,088 $2,258,911 $2,712,788 $3,142,544 $3,588,452 $4,050,987 $4,129,618 $4,209,822
$431,540 $524,067 $629,367 $729,070 $832,521 $939,829 $958,071 $976,679
$3,660,653 $4,445,538 $5,033,762 $5,590,725 $6,168,622 $6,768,068 $6,869,973 $6,973,917
$549,098 $666,831 $755,064 $838,609 $925,293 $1,015,210 $1,030,496 $1,046,088
$3,111,555 $3,778,707 $4,278,698 $4,752,116 $5,243,329 $5,752,858 $5,839,477 $5,927,830
Fiscal Year Ending
Economic & Planning Systems, Inc. 7/15/2005 P:\14000s\14115Oakto9th\Fiscal\14115Fiscal6.xls

Table A-8Redevelopment Agency Property Tax CollectionOak to Ninth Mixed Use Project Fiscal Impact Analysis; EPS #14115
Item
Gross Tax Increment
Tier 1 Pass-Through Obligations (1)Tier 2 Pass-Through Obligations (1)Tier 3 Pass-Through Obligations (1)
Subtotal Pass-Throughs
Percent of Pass-Throughs to the City's General Fund
Low-Moderate Income Housing Fund (2)
ERAF Shift (3)
Tax Increment Available
Agency Admin (4)
Net Tax Increment
(1) AB 1290 Pass-Throughs. Tier 2 commences in year 11, and Tier 3 commences in year 31.(2) According to Patrick Lane of the City of Oakland Redevelopment Agency, the
Low-Moderate Income Housing Fund percentage increased from 20% to 25% in 2001.(3) According to Patrick Lane of the City of Oakland Redevelopment Agency, the ERAF shift will
end in FY '05-06, but the City is anticipating that the deductions could continue. For our estimates, we are assuming the Agency's deduction of 5.8% for FY '06-07 for the life of the project.
(4) Administration of the Project Area is funded over the 30-year effective life of the Redevelopment Plan.
Source: City of Oakland; County of Alameda; Economic & Planning Systems, Inc.
2020 2021 2022 2023 2024 2025 2026 202717 18 19 20 21 22 23 24
$17,166,517 $17,500,293 $17,840,744 $18,188,003 $18,542,209 $18,903,498 $19,272,013 $19,647,898$8,130,872 $8,464,647 $8,805,098 $9,152,358 $9,506,563 $9,867,852 $10,236,367 $10,612,252
$3,433,303 $3,500,059 $3,568,149 $3,637,601 $3,708,442 $3,780,700 $3,854,403 $3,929,580$1,365,986 $1,422,061 $1,479,256 $1,537,596 $1,597,103 $1,657,799 $1,719,710 $1,782,858
$0 $0 $0 $0 $0 $0 $0 $0$4,799,290 $4,922,119 $5,047,405 $5,175,197 $5,305,544 $5,438,499 $5,574,112 $5,712,438
$1,323,644 $1,357,520 $1,392,074 $1,427,319 $1,463,269 $1,499,938 $1,537,340 $1,575,490
$4,291,629 $4,375,073 $4,460,186 $4,547,001 $4,635,552 $4,725,874 $4,818,003 $4,911,974
$995,658 $1,015,017 $1,034,763 $1,054,904 $1,075,448 $1,096,403 $1,117,777 $1,139,578
$7,079,940 $7,188,083 $7,298,389 $7,410,902 $7,525,664 $7,642,722 $7,762,121 $7,883,907
$1,061,991 $1,078,213 $1,094,758 $1,111,635 $1,128,850 $1,146,408 $1,164,318 $1,182,586
$6,017,949 $6,109,871 $6,203,631 $6,299,266 $6,396,814 $6,496,313 $6,597,803 $6,701,321
Fiscal Year Ending
Economic & Planning Systems, Inc. 7/15/2005 P:\14000s\14115Oakto9th\Fiscal\14115Fiscal6.xls

Table A-8Redevelopment Agency Property Tax CollectionOak to Ninth Mixed Use Project Fiscal Impact Analysis; EPS #14115
Item
Gross Tax Increment
Tier 1 Pass-Through Obligations (1)Tier 2 Pass-Through Obligations (1)Tier 3 Pass-Through Obligations (1)
Subtotal Pass-Throughs
Percent of Pass-Throughs to the City's General Fund
Low-Moderate Income Housing Fund (2)
ERAF Shift (3)
Tax Increment Available
Agency Admin (4)
Net Tax Increment
(1) AB 1290 Pass-Throughs. Tier 2 commences in year 11, and Tier 3 commences in year 31.(2) According to Patrick Lane of the City of Oakland Redevelopment Agency, the
Low-Moderate Income Housing Fund percentage increased from 20% to 25% in 2001.(3) According to Patrick Lane of the City of Oakland Redevelopment Agency, the ERAF shift will
end in FY '05-06, but the City is anticipating that the deductions could continue. For our estimates, we are assuming the Agency's deduction of 5.8% for FY '06-07 for the life of the project.
(4) Administration of the Project Area is funded over the 30-year effective life of the Redevelopment Plan.
Source: City of Oakland; County of Alameda; Economic & Planning Systems, Inc.
2028 2029 2030 2031 2032 2033 2034 203525 26 27 28 29 30 31 32
$20,031,301 $20,422,372 $20,821,264 $21,228,135 $21,643,142 $22,066,450 $22,498,224 $22,938,634$10,995,655 $11,386,726 $11,785,619 $12,192,489 $12,607,497 $13,030,804 $13,462,578 $13,902,988
$431,774 $872,183
$4,006,260 $4,084,474 $4,164,253 $4,245,627 $4,328,628 $4,413,290 $4,499,645 $4,587,727$1,847,270 $1,912,970 $1,979,984 $2,048,338 $2,118,059 $2,189,175 $2,261,713 $2,335,702
$0 $0 $0 $0 $0 $0 $48,359 $97,685$5,853,530 $5,997,444 $6,144,237 $6,293,965 $6,446,688 $6,602,465 $6,809,717 $7,021,113
$1,614,404 $1,654,095 $1,694,581 $1,735,876 $1,777,997 $1,820,960 $1,878,120 $1,936,423
$5,007,825 $5,105,593 $5,205,316 $5,307,034 $5,410,786 $5,516,613 $5,624,556 $5,734,658
$1,161,815 $1,184,498 $1,207,633 $1,231,232 $1,255,302 $1,279,854 $1,304,897 $1,330,441
$8,008,130 $8,134,837 $8,264,078 $8,395,904 $8,530,367 $8,667,518 $8,759,054 $8,852,421
$1,201,219 $1,220,226 $1,239,612 $1,259,386 $1,279,555 $1,300,128 $0 $0
$6,806,910 $6,914,611 $7,024,466 $7,136,518 $7,250,812 $7,367,391 $8,759,054 $8,852,421
Fiscal Year Ending
Economic & Planning Systems, Inc. 7/15/2005 P:\14000s\14115Oakto9th\Fiscal\14115Fiscal6.xls

Table A-8Redevelopment Agency Property Tax CollectionOak to Ninth Mixed Use Project Fiscal Impact Analysis; EPS #14115
Item
Gross Tax Increment
Tier 1 Pass-Through Obligations (1)Tier 2 Pass-Through Obligations (1)Tier 3 Pass-Through Obligations (1)
Subtotal Pass-Throughs
Percent of Pass-Throughs to the City's General Fund
Low-Moderate Income Housing Fund (2)
ERAF Shift (3)
Tax Increment Available
Agency Admin (4)
Net Tax Increment
(1) AB 1290 Pass-Throughs. Tier 2 commences in year 11, and Tier 3 commences in year 31.(2) According to Patrick Lane of the City of Oakland Redevelopment Agency, the
Low-Moderate Income Housing Fund percentage increased from 20% to 25% in 2001.(3) According to Patrick Lane of the City of Oakland Redevelopment Agency, the ERAF shift will
end in FY '05-06, but the City is anticipating that the deductions could continue. For our estimates, we are assuming the Agency's deduction of 5.8% for FY '06-07 for the life of the project.
(4) Administration of the Project Area is funded over the 30-year effective life of the Redevelopment Plan.
Source: City of Oakland; County of Alameda; Economic & Planning Systems, Inc.
2036 2037 2038 2039 2040 2041 2042 204333 34 35 36 37 38 39 40
$23,387,851 $23,846,053 $24,313,419 $24,790,133 $25,276,380 $25,772,353 $26,278,245 $26,794,255$14,352,206 $14,810,408 $15,277,774 $15,754,487 $16,240,735 $16,736,707 $17,242,599 $17,758,609$1,321,401 $1,779,603 $2,246,969 $2,723,683 $3,209,930 $3,705,903 $4,211,795 $4,727,805
$4,677,570 $4,769,211 $4,862,684 $4,958,027 $5,055,276 $5,154,471 $5,255,649 $5,358,851$2,411,171 $2,488,148 $2,566,666 $2,646,754 $2,728,443 $2,811,767 $2,896,757 $2,983,446
$147,997 $199,316 $251,661 $305,052 $359,512 $415,061 $471,721 $529,514$7,236,738 $7,456,675 $7,681,010 $7,909,833 $8,143,232 $8,381,299 $8,624,127 $8,871,812
$1,995,892 $2,056,551 $2,118,423 $2,181,532 $2,245,903 $2,311,562 $2,378,534 $2,446,846
$5,846,963 $5,961,513 $6,078,355 $6,197,533 $6,319,095 $6,443,088 $6,569,561 $6,698,564
$1,356,495 $1,383,071 $1,410,178 $1,437,828 $1,466,030 $1,494,796 $1,524,138 $1,554,067
$8,947,655 $9,044,794 $9,143,876 $9,244,939 $9,348,024 $9,453,170 $9,560,419 $9,669,813
$0 $0 $0 $0 $0 $0 $0 $0
$8,947,655 $9,044,794 $9,143,876 $9,244,939 $9,348,024 $9,453,170 $9,560,419 $9,669,813
Fiscal Year Ending
Economic & Planning Systems, Inc. 7/15/2005 P:\14000s\14115Oakto9th\Fiscal\14115Fiscal6.xls

Table A-8Redevelopment Agency Property Tax CollectionOak to Ninth Mixed Use Project Fiscal Impact Analysis; EPS #14115
Item
Gross Tax Increment
Tier 1 Pass-Through Obligations (1)Tier 2 Pass-Through Obligations (1)Tier 3 Pass-Through Obligations (1)
Subtotal Pass-Throughs
Percent of Pass-Throughs to the City's General Fund
Low-Moderate Income Housing Fund (2)
ERAF Shift (3)
Tax Increment Available
Agency Admin (4)
Net Tax Increment
(1) AB 1290 Pass-Throughs. Tier 2 commences in year 11, and Tier 3 commences in year 31.(2) According to Patrick Lane of the City of Oakland Redevelopment Agency, the
Low-Moderate Income Housing Fund percentage increased from 20% to 25% in 2001.(3) According to Patrick Lane of the City of Oakland Redevelopment Agency, the ERAF shift will
end in FY '05-06, but the City is anticipating that the deductions could continue. For our estimates, we are assuming the Agency's deduction of 5.8% for FY '06-07 for the life of the project.
(4) Administration of the Project Area is funded over the 30-year effective life of the Redevelopment Plan.
Source: City of Oakland; County of Alameda; Economic & Planning Systems, Inc.
2044 2045 2046 2047 204841 42 43 44 45
$27,320,585 $27,857,442 $28,405,036 $28,963,581 $29,533,298$18,284,939 $18,821,796 $19,369,390 $19,927,936 $20,497,652$5,254,135 $5,790,992 $6,338,586 $6,897,131 $7,466,848
$5,464,117 $5,571,488 $5,681,007 $5,792,716 $5,906,660$3,071,870 $3,162,062 $3,254,057 $3,347,893 $3,443,606
$588,463 $648,591 $709,922 $772,479 $836,287$9,124,450 $9,382,141 $9,644,986 $9,913,088 $10,186,552
$2,516,523 $2,587,595 $2,660,087 $2,734,030 $2,809,451
$6,830,146 $6,964,360 $7,101,259 $7,240,895 $7,383,325
$1,584,594 $1,615,732 $1,647,492 $1,679,888 $1,712,931
$9,781,395 $9,895,209 $10,011,298 $10,129,710 $10,250,490
$0 $0 $0 $0 $0
$9,781,395 $9,895,209 $10,011,298 $10,129,710 $10,250,490
Fiscal Year Ending
Economic & Planning Systems, Inc. 7/15/2005 P:\14000s\14115Oakto9th\Fiscal\14115Fiscal6.xls
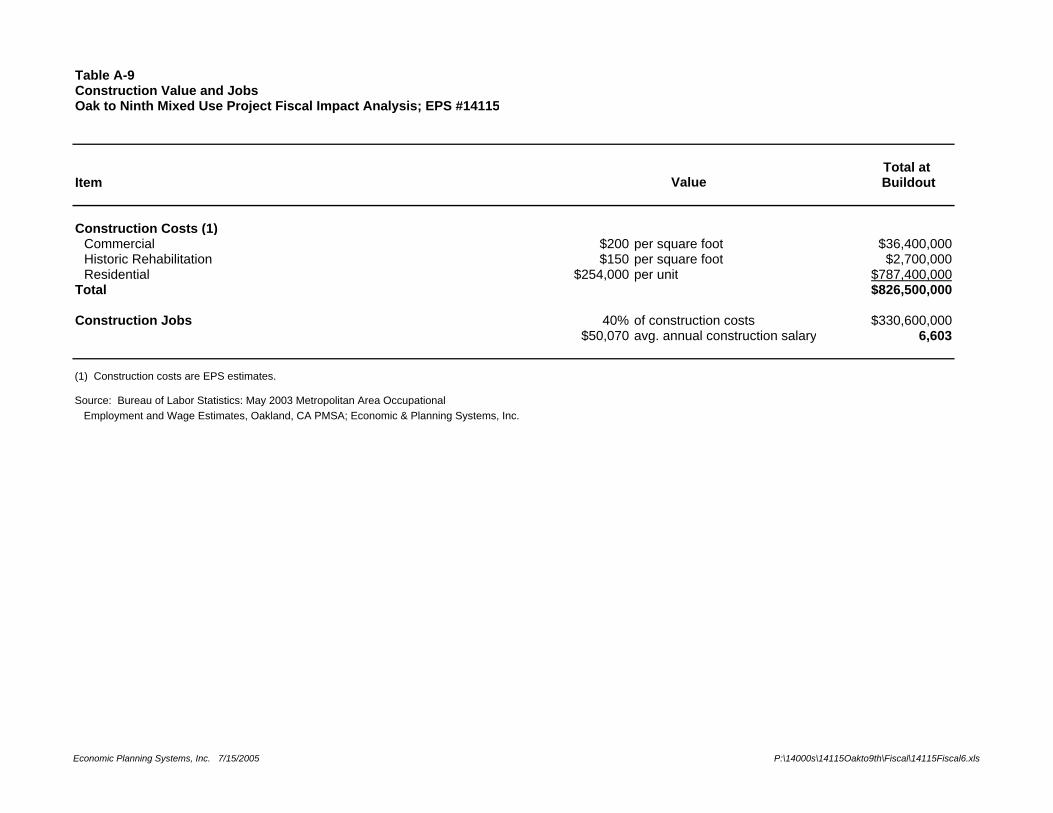
Table A-9Construction Value and JobsOak to Ninth Mixed Use Project Fiscal Impact Analysis; EPS #14115
Total at Item Buildout
Construction Costs (1)Commercial $200 per square foot $36,400,000Historic Rehabilitation $150 per square foot $2,700,000Residential $254,000 per unit $787,400,000
Total $826,500,000
Construction Jobs 40% of construction costs $330,600,000$50,070 avg. annual construction salary 6,603
(1) Construction costs are EPS estimates.
Source: Bureau of Labor Statistics: May 2003 Metropolitan Area Occupational Employment and Wage Estimates, Oakland, CA PMSA; Economic & Planning Systems, Inc.
Value
Economic Planning Systems, Inc. 7/15/2005 P:\14000s\14115Oakto9th\Fiscal\14115Fiscal6.xls

Table A-9Construction Value and JobsOak to Ninth Mixed Use Project Fiscal Impact Analysis; EPS #14115
Item
Construction Costs (1)CommercialHistoric RehabilitationResidential
Total
Construction Jobs
(1) Construction costs are EPS estimates.
Source: Bureau of Labor Statistics: May 2003 Metropolitan Area Occupational Employment and Wage Estimates, Oakland, CA PMSA; Economic & Planning Systems, Inc
2008 2009 2010 2011 2012
$0 $0 $12,133,333 $0 $12,133,333$2,700,000 $0 $0 $0 $0
$78,740,000 $78,740,000 $78,740,000 $78,740,000 $78,740,000$81,440,000 $78,740,000 $90,873,333 $78,740,000 $90,873,333
$32,576,000 $31,496,000 $36,349,333 $31,496,000 $36,349,333651 629 726 629 726
Economic Planning Systems, Inc. 7/15/2005 P:\14000s\14115Oakto9th\Fiscal\14115Fiscal6.xls

Table A-9Construction Value and JobsOak to Ninth Mixed Use Project Fiscal Impact Analysis; EPS #14115
Item
Construction Costs (1)CommercialHistoric RehabilitationResidential
Total
Construction Jobs
(1) Construction costs are EPS estimates.
Source: Bureau of Labor Statistics: May 2003 Metropolitan Area Occupational Employment and Wage Estimates, Oakland, CA PMSA; Economic & Planning Systems, Inc
2013 2014 2015 2016 2017
$0 $12,133,333 $0 $0 $0$0 $0 $0 $0 $0
$78,740,000 $78,740,000 $78,740,000 $78,740,000 $78,740,000$78,740,000 $90,873,333 $78,740,000 $78,740,000 $78,740,000
$31,496,000 $36,349,333 $31,496,000 $31,496,000 $31,496,000629 726 629 629 629
Economic Planning Systems, Inc. 7/15/2005 P:\14000s\14115Oakto9th\Fiscal\14115Fiscal6.xls