financial accounting(1201) 2-_#444.pptx;_#1020
TRANSCRIPT

FINANCIAL ACCOUNTING
INSURANCE COMPANY
2008111347 WANG HOLIM

[ CONTENTS ]
INTRODUCTION
CHOICE OF COMPANIES
ANALYSIS
CHOOSING THE BEST CO.
CONCLUSION

INTRODUCTION

INSURANCE COMPANY ?
INTRO CHOICE ANALYSIS CONCLUSIONBEST CO.
- Life Insurance
Pay the benefits upon the death of
the insured person
- Property Insurance
Protection against most risks to property

INTRO CHOICE ANALYSIS CONCLUSIONBEST CO.
PROPERTY INSURANCE VS.
LIFE INSURANCE

INTRO CHOICE ANALYSIS CONCLUSIONBEST CO.
PROPERTY INSURANCE VS.
LIFE INSURANCE
출처 : 금융감독원 (보험회사업무자료)

CHOICE OF THE COMPANIES
INTRO CHOICE ANALYSIS CONCLUSIONBEST CO.
< TOP 3 COMPANIES >

INTRO CHOICE ANALYSIS CONCLUSIONBEST CO.
Market share (Assets)
Samsung
Kyobo
Daehan
ING
Shinhan
Others
65.6%
Market
Share
These three companies accounted for 65.6% of total market share.

ANALYSIS

INTRO CHOICE ANALYSIS CONCLUSIONBEST CO.
THE RECENT TREND OF INSURANCE
INDUSTRY
Growth : decreased growth rate because of financial crisis
Profitability : FY08 Financial crisis → Net income ↓
Financial quality : Weak small companies’ financial quality
Competition : Big 3 companies’ market shares ↓
Small companies’ and foreign companies’
market shares are continuously↑

INTRO CHOICE ANALYSIS CONCLUSIONBEST CO.
The largest insurance company in Korea
Dongbang Life insurance company in 1957
Assets : 145 trillion won in 2011 (\ 145,000,000,000,000)
Target : private customer and institution
Insurance
Loan
Investment – funds
Pensions
Established
Services
May, 1957
Insurance to
pension

INTRO CHOICE ANALYSIS CONCLUSIONBEST CO.
Key accounts of
Samsung LIFE Insurance
FY2010FY2009

INTRO CHOICE ANALYSIS CONCLUSIONBEST CO.
The first insurance company in Korea
Bankrupt in 1969, and acquired by Shindonga
Built 63 building in 1985
Acquired by Hanhwa group in 1997
Established Sep, 9, 1946

INTRO CHOICE ANALYSIS CONCLUSIONBEST CO.
Key accounts of
Daehan LIFE Insurance
41,304
61,602
FY2009
FY2010
Stockholders
’
Equity

INTRO CHOICE ANALYSIS CONCLUSIONBEST CO.
Founded in 1958 / Korean Education Insurance
Promotion of education and
formation of national capital
The first education insurance
13 different subsidiaries

INTRO CHOICE ANALYSIS CONCLUSIONBEST CO.
Key accounts of
Kyobo LIFE Insurance
FY2007 FY2008 FY2009 FY2010
Net profit margin
2007~2010 Growing flawlessly

CHOOSING THE BEST COMPANY

INTRO CHOICE ANALYSIS CONCLUSIONBEST CO.
1. Return on equity (ROE) =
Net Income / Book value of shareholders’ Equity
Choosing “The Best Company”
2. Earnings per share (EPS) =
Net income / Number of common stock shares outstanding
3. Net profit margin = net income/revenues
4. Return on Invested Assets = [Investment Profit / {(Invested Asset
during the term+ Invested Asset during last term - Investment Profit)/2}]
5. Debt/equity ratio = Total Liabilities/shareholders Equity
6. Required Solvency Margin Ratio =
Prepared Solvency/Required Solvency
ROE
EPS
Net profit margin
Return on
Investment Assets
Debt/Equity Ratio
Required Solvency

INTRO CHOICE ANALYSIS CONCLUSIONBEST CO.
1st : 3 points / 2nd : 2 points
3rd : 1 points
① High level of growth
② High level of Required Solvency
SCORE
Extra
Points
(1 point)
We compared each of the six areas
And gave Extra Points
Evaluation Method

1. Return On Equity

INTRO CHOICE ANALYSIS CONCLUSIONBEST CO.
1. Return on Equity (ROE)
Kyobo
Samsung
(unit : Percentage, %)
Daehan
12.5%
7.7%
15.1%
7.5%
9.2%
19.31%
FY2009 FY2010
Kybo showed the highest

INTRO CHOICE ANALYSIS CONCLUSIONBEST CO.
FY2010FY2009
12.5%
7.5%
We gave them one extra point for large amount of growth
67%
Growth !
↓
Extra
Point !
1. Return on Equity (ROE)

2. Earnings Per Share

INTRO CHOICE ANALYSIS CONCLUSIONBEST CO.
DaehanKyoboSamsung
FY2010
(Unit : Won)
FY2009
2. Earning per share (EPS)
5,000
10,000
20,000
30,000
12 3
Daehan is 3rd in EPS session.
But, how about the amount of
Growth?

INTRO CHOICE ANALYSIS CONCLUSIONBEST CO.
FY2010FY2009
9,295
2,638
We gave them one extra point for large amount of growth
352%
Growth !
↓
Extra
Point !
2. Earning per share (EPS)

3. Net Profit Margin

INTRO CHOICE ANALYSIS CONCLUSIONBEST CO.
3. Net profit margin
3.5%
7.35%
4.24%5.54%
2.8%
0 42 6 8
3.9%
(%)
FY2009
FY2010
1
2
3
210% growth in 1 year !
How they can do that?

INTRO CHOICE ANALYSIS CONCLUSIONBEST CO.
3. Net profit margin
The reason is..
Profit-driven policies of the product
portfolio
Principal repayments
Make
High
Performance

4. Return On Invested Assets

INTRO CHOICE ANALYSIS CONCLUSIONBEST CO.
4. Return on Invested Assets
Kyobo
Samsung
Daehan
6.38%
5.83%5.79%
5.2%
5.86%5.59%
FY2009 FY2010
(unit : Percentage, %)
There is no big difference between
each company.
.1 2 3

5. Debt to Equity Ratio

INTRO CHOICE ANALYSIS CONCLUSIONBEST CO.
5. Debt / Equity Ratio
0
996.6%
1301.9%
851.1%
1259.9%1268.3%
936.1%
FY2009
FY2010
1,000%
200
400
600
800
1,200
INTRO CHOICE ANALYSIS CONCLUSIONBEST CO.
FY2010
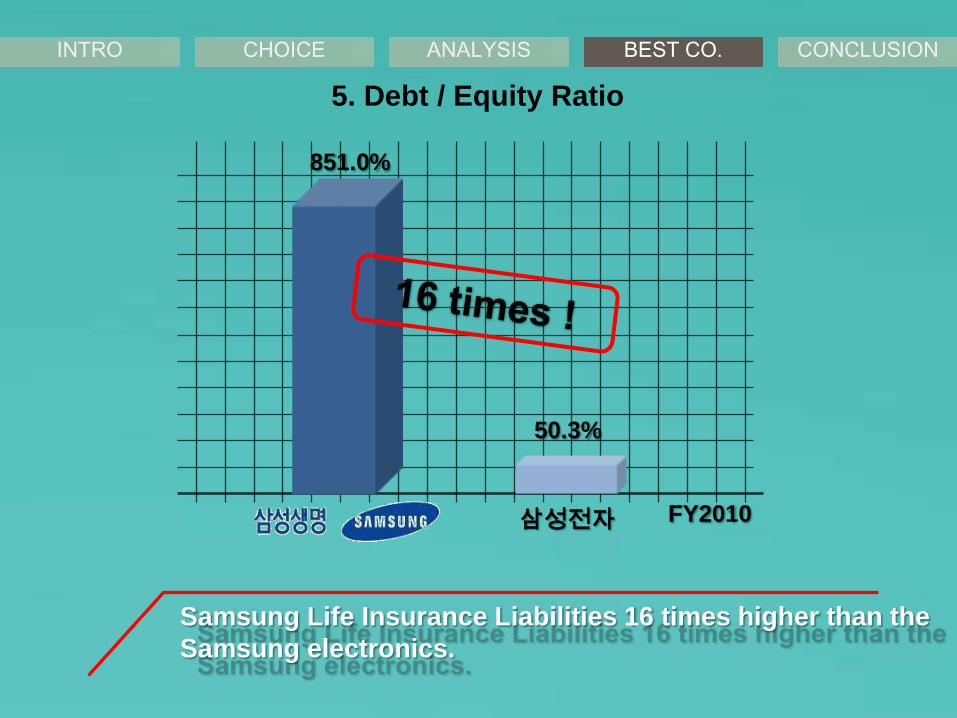
50.3%
851.0%
Samsung Life Insurance Liabilities 16 times higher than the
Samsung electronics.
삼성전자
5. Debt / Equity Ratio

INTRO CHOICE ANALYSIS CONCLUSIONBEST CO.
5. Debt / Equity Ratio
120,912,253,000,000
÷ 12,132,820,000,000
×100 = 996.6%
Why these companies' debt equity
ratio is so high?
INTRO CHOICE ANALYSIS CONCLUSIONBEST CO.
5. Debt / Equity Ratio
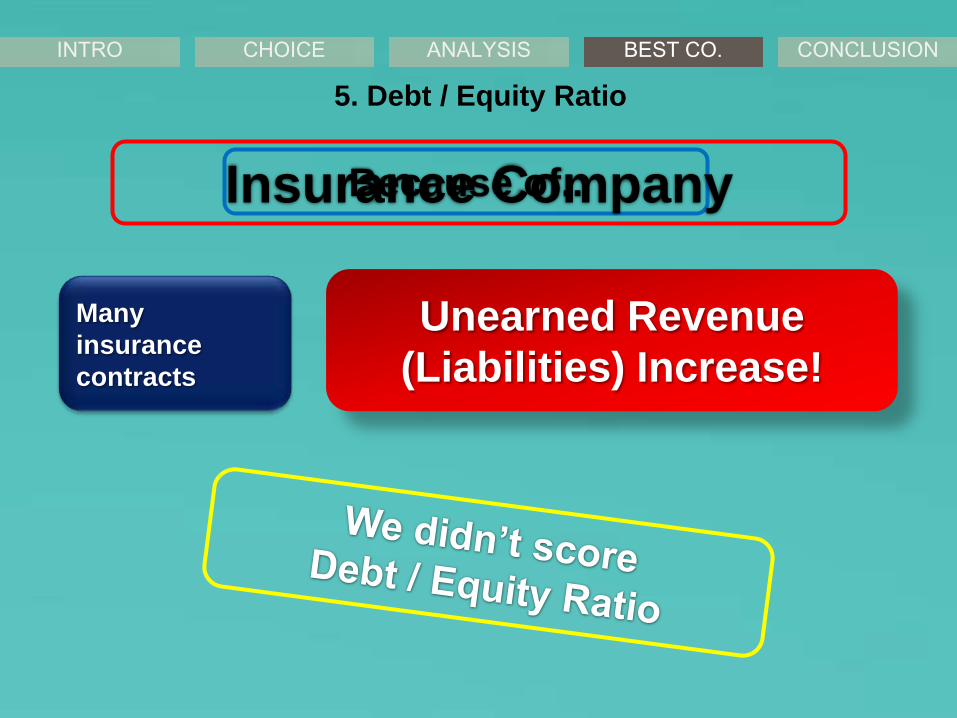
Because of..Insurance Company
Many
insurance
contracts
Unearned Revenue
(Liabilities) Increase!

6. Required Solvency Margin Ratio

INTRO CHOICE ANALYSIS CONCLUSIONBEST CO.
6. Required Solvency Margin Ratio
FY2009
FY2010
0
332.79%
261,71%
380.13%
224.72%
299.1%
267.24%300
100
200
400
%

CONCLUSION

INTRO CHOICE ANALYSIS CONCLUSIONBEST CO.
ROE (%)(+1 for high growth)
Net profit
margin(+1 for high growth)
Cash
reserve ratio(+1 for high level)
1st
(3 points)
2nd
(2 points)
3rd
(1 points)
Return on
invested
assets
EPS(+1 for high growth)
+1
+1
+1
+1 +1
Let’s check the score!

INTRO CHOICE ANALYSIS CONCLUSIONBEST CO.
The score is..
16 Points
10 Points
9Points
Got the highest score !

INTRO CHOICE ANALYSIS CONCLUSIONBEST CO.
Is the best insurance company !

Dart System http://dart.fss.or.kr/
통계청 http://www.index.go.kr/egams/stts/jsp/potal/st
생명보험협회 http://www.klia.or.kr/
삼성생명 http://www.samsunglife.com/
삼성생명 관련 기사
http://www.etoday.co.kr/news/section/newsview.php?TM=news&SM=0202&idxno=377271
http://www.asiae.co.kr/news/view.htm?idxno=2010111515090164284
교보생명 http://kyobo.co.kr/
대한생명 http://www.korealife.com/
대한생명 관련 기사
http://www.newspim.com/view.jsp?newsId=20101110000124
http://www.sisaseoul.com/news/articleView.html?idxno=26231
ING생명 http://www.inglife.co.kr/
ING생명 관련 기사
http://www.fnnews.com/view?ra=Sent0701m_View&corp=fnnews&arcid=101117145959&cDateYear=2010&cDate
Month=11&cDateDay=17
신한생명 http://shinhanlife.co.kr/
Reference

Q & A

THANK YOU