financial market outlook q4 2016 investment …bsbm.biz/database/docu/jb/20160921_q4_outlook.pdf ·...
TRANSCRIPT

Zurich, September 2016
FINANCIAL MARKET OUTLOOK Q4 2016 INVESTMENT OPPORTUNITIES
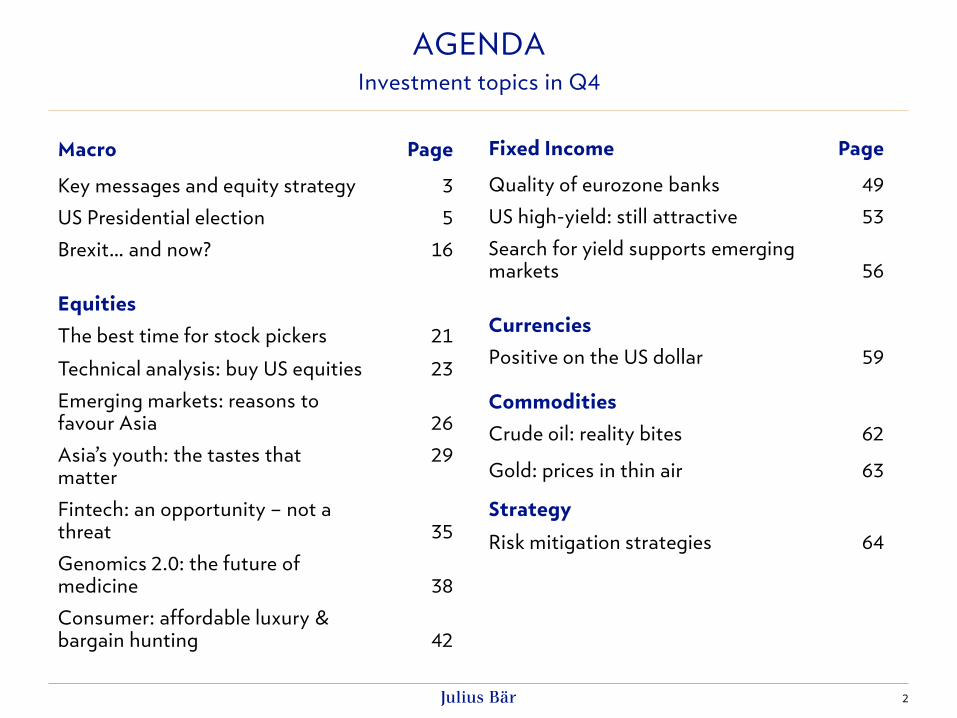
AGENDA
Investment topics in Q4
2
Macro Page
Key messages and equity strategy 3
US Presidential election 5
Brexit… and now? 16
Equities
The best time for stock pickers 21
Technical analysis: buy US equities 23
Emerging markets: reasons to favour Asia
26
Asia’s youth: the tastes that matter
29
Fintech: an opportunity – not a threat
35
Genomics 2.0: the future of medicine
38
Consumer: affordable luxury & bargain hunting
42
Fixed Income Page
Quality of eurozone banks 49
US high-yield: still attractive 53
Search for yield supports emerging markets
56
Currencies
Positive on the US dollar Commodities
59
Crude oil: reality bites 62
Gold: prices in thin air 63
Strategy
Risk mitigation strategies 64

3
Global cyclical backdrop improving at a modest pace
• Economic activity to accelerate in the US, robust momentum in most of Europe. Brexit now
negatively impacting the UK. Slowdown decelerating in China and Japan. Major emerging
markets are a mixed bag, with many economies looking rather fragile.
Brexit, other geopolitical risks and latent cyclical risks do not allow monetary restriction –
fiscal reflation re-emerging as an additional policy option
• The Bank of England has loosened monetary policy in response to the Brexit referen-dum.
Apart from the US Fed, no major central bank is considering policy tightening.
• With major central banks running out of options to stimulate growth, ruling authorities are
eroding fiscal austerity for deficit and even debt-financed spending: major examples are China
and Japan. Both US presidential candidates argue for additional fiscal stimulus. The new UK
government is expected to implement fiscal reflation to counter negative post-Brexit impacts.
Even in the eurozone, the pressure is on to undo the fiscal stability pact constraints.
Inflationary risks remain negligible until fiscal reflation materialises
• In the current environment of strong central bank stimuli, inflation risks appear low until fiscal
reflation becomes widespread, which is not very likely in the near to medium term.
ECONOMICS: KEY MESSAGES

4
OVERVIEW Equity Strategy Ratings
Global sector/industry group Rating Global sector/ind. group Rating Investment styles USA Europe Emerging markets Rating
Energy OW Info Tech OW Quality OW OW South Africa UW
Materials neutral Software OW Value UW UW Russia UW
Industrials neutral Hardware neutral Growth OW OW Turkey neutral
Capital Goods neutral Semiconductors OW Small caps neutral neutral Poland OW
Commercial & Professional Services neutral Telecom neutral Mid caps neutral neutral Brazil neutral
Transportation neutral Utilities UW Large caps neutral neutral Mexico neutral
Consumer Discretionary neutral High dividends neutral OW Chile OW
Automobiles neutral Developed markets Rating Dividend growers neutral neutral Colombia neutral
Consumer Durables UW USA neutral High Beta neutral neutral China * OW
Consumer Services neutral Canada neutral Low Beta neutral neutral South Korea * neutral
Media neutral Eurozone neutral Taiwan * OW
Retailing OW Germany neutral India * OW
Consumer Staples UW France neutral Malaysia * OW
Food & Staples Retailing neutral Netherlands OW Indonesia * OW
Food, Beverage & Tobacco UW Spain UW Thailand * neutral
Household & Personal Products UW Italy UW Philippines * neutral
Healthcare OW UK OW Vietnam (frontier market)
OW
Healthcare Equipment & Services neutral Switzerland neutral
Pharma, Biotech & Life Science OW Sweden neutral
Financials neutral Japan * neutral
Banks neutral Australia * neutral
Diversified Financials neutral Hong Kong * OW
Insurance neutral Singapore * UW
Real Estate neutral Emerging markets OW
OW = Overweight; UW = Underweight Columbia and Vietnam: Julius Baer makes no offering in local markets.
Source: Strategy Research, * Research Asia Taiwan: Julius Baer’s offering in the local market is restricted.

THE NEXT UNCERTAINTY: US PRESIDENTIAL ELECTION USD well-supported by various election outcomes. Clinton’s steady policy would
deliver cyclical support, Trump’s disruptive policy would give safe-haven support.
Source: Julius Baer; GDP = Gross domestic product
US presidential election 2016 and possible outcomes with estimated probabilities
5
GDP
Inflation
US presidential
election
Hillary R. Clinton
1.8% 1.3% 1.3% 2.1%
Donald Trump
Aggressive policy
2.4% 1.9% 1.5% 2.8%
‘Unguided missile’
0.5% 1.0% 1.8% 2.5%
85%
70%
30%
15%
2017 2018 2017 2018
70%
25%
5%
6
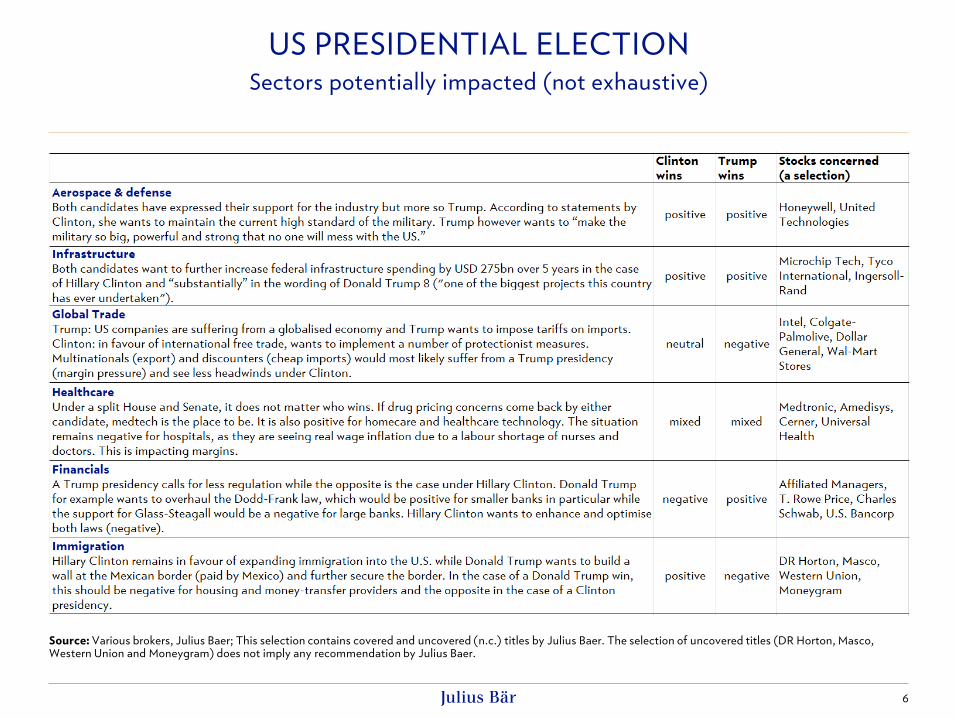
US PRESIDENTIAL ELECTION Sectors potentially impacted (not exhaustive)
Source: Various brokers, Julius Baer; This selection contains covered and uncovered (n.c.) titles by Julius Baer. The selection of uncovered titles (DR Horton, Masco, Western Union and Moneygram) does not imply any recommendation by Julius Baer.

7
Infrastructure to profit as both candidates intend to increase fiscal spending
• Both candidates for the US presidency have announced to further increase federal
infrastructure spending in case of being elected. While Clinton intends stemming an
additional USD 275bn package, Trump has communicated a ‘substantial’ ramp-up of
spending. Our take is that - in both cases - infrastructure stands to profit.
• Looking at the broader picture, too, infrastructure is set to receive a boost, in our view. As
monetary policy has by and large reached its limits across the globe, more expansionary fiscal
policy has become the only policy instrument left.
• Infrastructure is generally seen as a defensive investment. Applicable to large- and small-scale
organisational frameworks, infrastructure can include a variety of systems and structures as
long as there are physical components required.
• As infrastructure companies can be found across several sectors, it is challenging to make an
assessment in terms of valuation. Based on our recommended infrastructure equities,
however, valuations are fair.
• Infrastructure in the US has performed well since the beginning of the year, up by 18%
according to LPX group’s NMX Infrastructure America index.
• We advise buying exposure via diversified direct investments or actively managed funds.
US PRESIDENTIAL ELECTION - INFRASTRUCTURE
US infrastructure stands to profit from a renaissance of fiscal policies
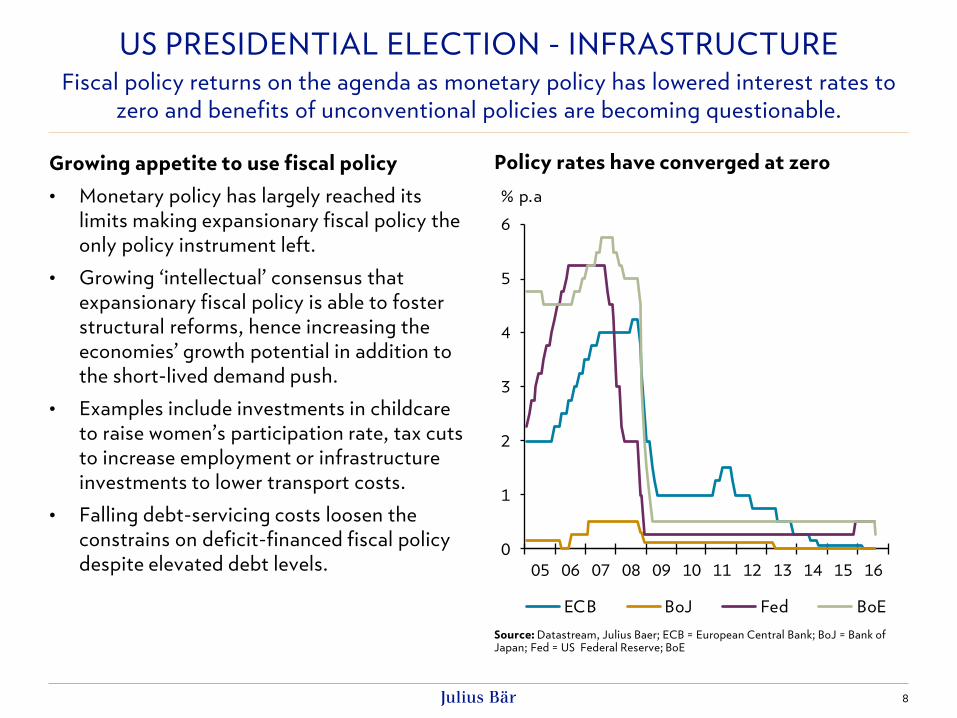
Growing appetite to use fiscal policy
• Monetary policy has largely reached its
limits making expansionary fiscal policy the
only policy instrument left.
• Growing ‘intellectual’ consensus that
expansionary fiscal policy is able to foster
structural reforms, hence increasing the
economies’ growth potential in addition to
the short-lived demand push.
• Examples include investments in childcare
to raise women’s participation rate, tax cuts
to increase employment or infrastructure
investments to lower transport costs.
• Falling debt-servicing costs loosen the
constrains on deficit-financed fiscal policy
despite elevated debt levels.
US PRESIDENTIAL ELECTION - INFRASTRUCTURE Fiscal policy returns on the agenda as monetary policy has lowered interest rates to
zero and benefits of unconventional policies are becoming questionable.
Source: Datastream, Julius Baer; ECB = European Central Bank; BoJ = Bank of Japan; Fed = US Federal Reserve; BoE
Policy rates have converged at zero
8
05 06 07 08 09 10 11 12 13 14 15 16
0
1
2
3
4
5
6
% p.a
ECB BoJ Fed BoE
9
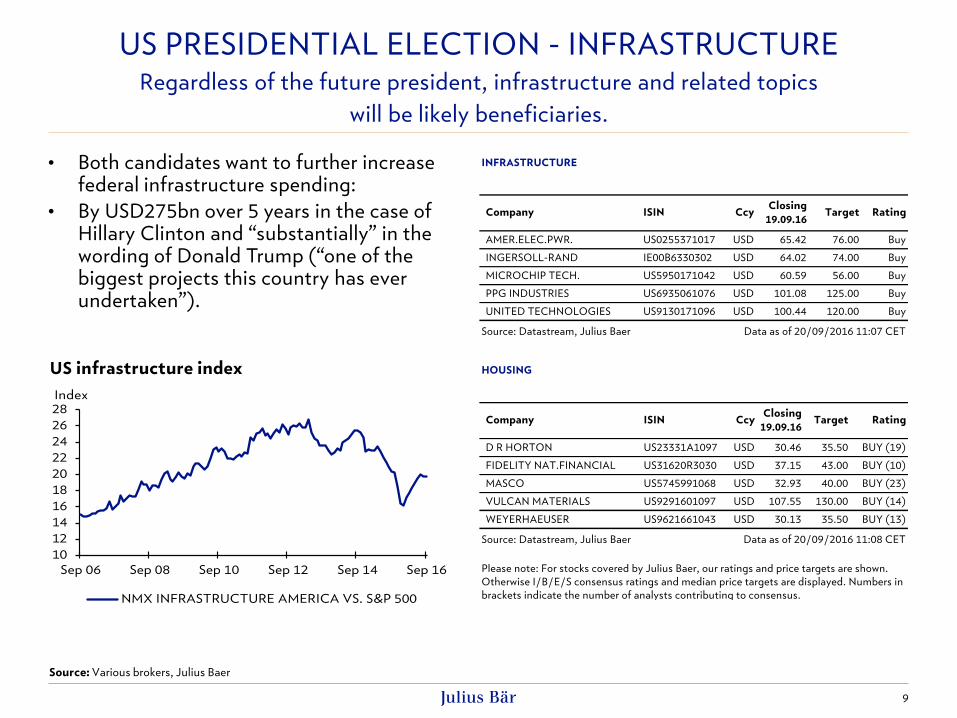
US PRESIDENTIAL ELECTION - INFRASTRUCTURE Regardless of the future president, infrastructure and related topics
will be likely beneficiaries.
Source: Various brokers, Julius Baer
• Both candidates want to further increase federal infrastructure spending:
• By USD275bn over 5 years in the case of Hillary Clinton and “substantially” in the wording of Donald Trump (“one of the biggest projects this country has ever undertaken”).
US infrastructure index
INFRASTRUCTURE
Closing
19.09.16
AMER.ELEC.PWR. US0255371017 USD 65.42 76.00 Buy
INGERSOLL-RAND IE00B6330302 USD 64.02 74.00 Buy
MICROCHIP TECH. US5950171042 USD 60.59 56.00 Buy
PPG INDUSTRIES US6935061076 USD 101.08 125.00 Buy
UNITED TECHNOLOGIES US9130171096 USD 100.44 120.00 Buy
Source: Datastream, Julius Baer Data as of 20/09/2016 11:07 CET
Company RatingTargetCcyISIN
HOUSING
Closing
19.09.16
D R HORTON US23331A1097 USD 30.46 35.50 BUY (19)
FIDELITY NAT.FINANCIAL US31620R3030 USD 37.15 43.00 BUY (10)
MASCO US5745991068 USD 32.93 40.00 BUY (23)
VULCAN MATERIALS US9291601097 USD 107.55 130.00 BUY (14)
WEYERHAEUSER US9621661043 USD 30.13 35.50 BUY (13)
Source: Datastream, Julius Baer Data as of 20/09/2016 11:08 CET
Please note: For stocks covered by Julius Baer, our ratings and price targets are shown.
Otherwise I/B/E/S consensus ratings and median price targets are displayed. Numbers in
brackets indicate the number of analysts contributing to consensus.
Company RatingTargetCcyISIN
10
12
14
16
18
20
22
24
26
28
Sep 06 Sep 08 Sep 10 Sep 12 Sep 14 Sep 16
Index
NMX INFRASTRUCTURE AMERICA VS. S&P 500

US PRESIDENTIAL ELECTION - INFRASTRUCTURE
10
Partners Group Invest Infrastructure
Fund description
• The fund provides access a global portfolio of companies that make infrastructure investments and are listed on major stock exchanges.
• Targeted sectors include Transport (e.g. toll roads), transmission and distribution, pipelines, airports, ports, railways as well as satellites ramp towers.
• The fund has a global allocation to infrastructure with approx. 40% US, 30% Europe and a sizeable allocation of 30% to growth markets.
• Core infrastructure should act as a stabilizing factor within the equity allocation.
• Due to its exclusive focus on core infrastructure, the fund can be characterised by low volatility and limited draw down risk when compared to equity or other infrastructure funds.
• In a negative market environment, the fund is expected to outperform its peers due to its exclusive focus on core infrastructure and the lack of exposure to more cyclical stocks.
Fund performance 5-year performance, in percentage (net)
Additional information Provider: MultiConcept Fund Mgmt. SA.; paying agent: Credit Suisse, Paradeplatz 8, CH-8001 Zürich; representative: ACOLIN Fund Services AG, Affolternstrasse 56, CH-8050 Zürich Please find supporting documents (fund fact sheet, prospectus, annual report, etc.) on www.fundinfo.com, or contact your Julius Baer representative for further information
As of 20.09.2016; Source: Datastream, Julius Baer, Morningstar
Low Moderate Considerable High
Lower risk Higher risk
Julius Baer product risk classification
Benchmark MSCI World (NR)
Base Currency EUR
Other Currencies USD, CHF
ISIN (USD Share Class) LU0617149793
ISIN (EUR Share Class) LU0949730401
ISIN (CHF Share Class) LU0661297050
NAV as of 19.09. 2016 USD 140.50
Size as of 31.08.2016 EUR 536.18 mln
Domicile Luxembourg
Launch Date 28.06.2012
TER 2.19%
Sales Registrations CH, DE, UK, IT, SG, others
Supporting Documents http://www.fundinfo.com/PG Infrastructure
Product facts
US PRESIDENTIAL ELECTION - INFRASTRUCTURE
11
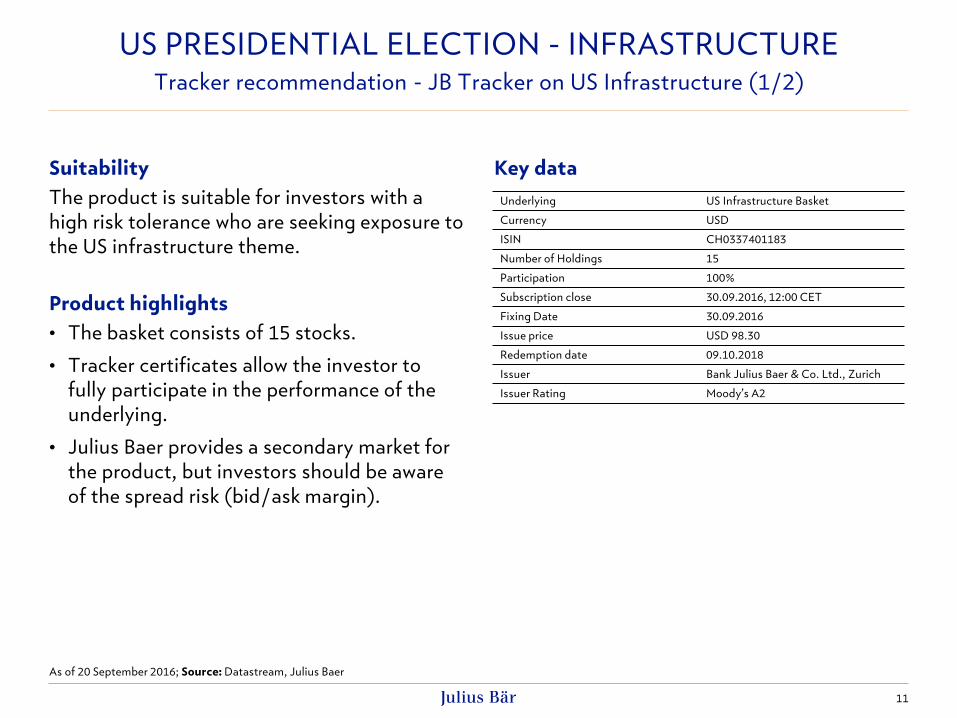
Tracker recommendation - JB Tracker on US Infrastructure (1/2)
Suitability
The product is suitable for investors with a
high risk tolerance who are seeking exposure to
the US infrastructure theme.
Product highlights
• The basket consists of 15 stocks.
• Tracker certificates allow the investor to
fully participate in the performance of the
underlying.
• Julius Baer provides a secondary market for
the product, but investors should be aware
of the spread risk (bid/ask margin).
Key data
As of 20 September 2016; Source: Datastream, Julius Baer
Underlying US Infrastructure Basket
Currency USD
ISIN CH0337401183
Number of Holdings 15
Participation 100%
Subscription close 30.09.2016, 12:00 CET
Fixing Date 30.09.2016
Issue price USD 98.30
Redemption date 09.10.2018
Issuer Bank Julius Baer & Co. Ltd., Zurich
Issuer Rating Moody’s A2
US PRESIDENTIAL ELECTION - INFRASTRUCTURE
12
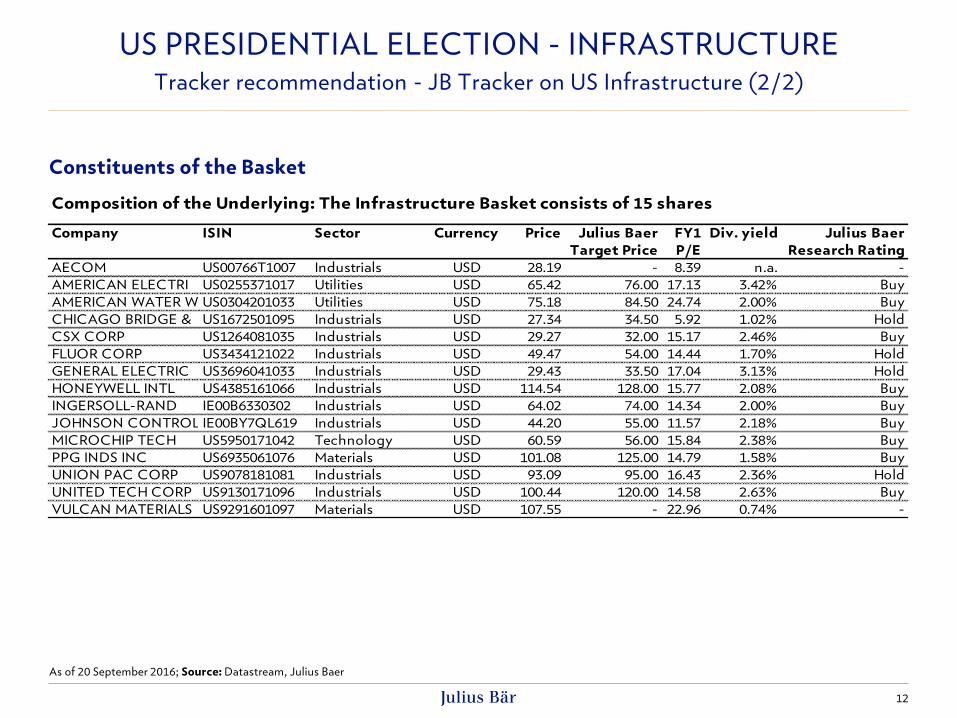
Tracker recommendation - JB Tracker on US Infrastructure (2/2)
Constituents of the Basket
Company ISIN Sector Currency Price Julius Baer
Target Price
FY1
P/E
Div. yield Julius Baer
Research Rating
AECOM US00766T1007 Industrials USD 28.19 - 8.39 n.a. -
AMERICAN ELECTRI US0255371017 Utilities USD 65.42 76.00 17.13 3.42% Buy
AMERICAN WATER W US0304201033 Utilities USD 75.18 84.50 24.74 2.00% Buy
CHICAGO BRIDGE & US1672501095 Industrials USD 27.34 34.50 5.92 1.02% Hold
CSX CORP US1264081035 Industrials USD 29.27 32.00 15.17 2.46% Buy
FLUOR CORP US3434121022 Industrials USD 49.47 54.00 14.44 1.70% Hold
GENERAL ELECTRIC US3696041033 Industrials USD 29.43 33.50 17.04 3.13% Hold
HONEYWELL INTL US4385161066 Industrials USD 114.54 128.00 15.77 2.08% Buy
INGERSOLL-RAND IE00B6330302 Industrials USD 64.02 74.00 14.34 2.00% Buy
JOHNSON CONTROLSIE00BY7QL619 Industrials USD 44.20 55.00 11.57 2.18% Buy
MICROCHIP TECH US5950171042 Technology USD 60.59 56.00 15.84 2.38% Buy
PPG INDS INC US6935061076 Materials USD 101.08 125.00 14.79 1.58% Buy
UNION PAC CORP US9078181081 Industrials USD 93.09 95.00 16.43 2.36% Hold
UNITED TECH CORP US9130171096 Industrials USD 100.44 120.00 14.58 2.63% Buy
VULCAN MATERIALS US9291601097 Materials USD 107.55 - 22.96 0.74% -
Composition of the Underlying: The Infrastructure Basket consists of 15 shares
As of 20 September 2016; Source: Datastream, Julius Baer
13
Medtech – ‘hiding place’ if drug pricing concerns return to the market
• Hillary Clinton becoming the next US president is generally perceived as a less positive
outcome for the healthcare sector as a whole. However, for the medtech segment, it does not
matter that much who wins the presidential election. If drug pricing concerns return, medtech
is the place to be.
• Healthcare is one of three sectors which we currently rate ‘overweight’ (the others are energy
and information technology). Medtech represents the most defensive segment of the
healthcare sector.
• Medtech encompasses a wide range of healthcare products and is generally used to diagnose,
monitor or treat diseases or medical conditions. The basic goal of medtech is to improve the
quality of healthcare delivered through earlier diagnosis, less invasive treatment options and
reductions in hospital stays and rehabilitation times.
• Like its peers of the other healthcare segments, medtech profits from positive socio-
demographics. In addition, it has a low exposure to US healthcare spend pressure, generally
provides stable growth with low exposure to R&D binary events and pays medium dividends.
• Despite its outperformance this year, medtech has by no means become expensive (based on
P/E ratios), relative to the rest of the sector. Our analysts believe that current uncertainties
with regard to drug pricing debates in the run up to the presidential elections will keep the
segment underpinned.
US PRESIDENTIAL ELECTION - MEDTECH
Medtech is relatively unaffected, no matter who will become US president

14
US PRESIDENTIAL ELECTION - MEDTECH Under a split House and Senate, it does not matter for medtech who wins the
presidential election. If drug pricing concerns return, medtech is the place to be.
Source: Datastream, Julius Baer
Medtech remaining outperformers US MEDTECH COMPANIES
Closing
19.09.16
BECTON DICKINSON US0758871091 USD 175.66 192.00 Buy
INTUITIVE SURGICAL US46120E6023 USD 693.55 765.00 Buy
MEDTRONIC IE00BTN1Y115 USD 85.99 94.00 Buy
ZIMMER BIOMET HDG. US98956P1021 USD 124.97 146.00 Buy
Source: Datastream, Julius Baer Data as of 20/09/2016 11:05 CET
Company RatingTargetCcyISIN
80
100
120
140
160
180
200
220
240
260
Sep 11 Sep 12 Sep 13 Sep 14 Sep 15 Sep 16
Index
MORGAN STANLEY MEDICAL TECH INDEX
S&P 500

US PRESIDENTIAL ELECTION - MEDTECH
15
Fund recommendation – Variopartner SICAV – MIV Global Medtech Fund
Fund description
• The fund invests primarily in a portfolio of global medical technology equity securities.
• The fund is expected to move in line with the underlying market and to outperform its benchmark over an investment cycle (Julius Baer fund label: Market Exposure).
• The research effort is focused on finding devices with the highest commercial potential regardless of the domicile of their producers. Inception-to-date performance has benefited from MIV's research analysts' track record of identifying M&A targets.
• Security selection favours companies with an above-average revenue growth potential.
Fund performance 5-year performance, in percentage (net)
Low Moderate Considerable High
Lower risk Higher risk
Julius Baer product risk classification
Additional information Provider: Vontobel Asset Management S.A.; paying agent: Bank Vontobel AG; representative: Vontobel Fonds Services AG. Please find supporting documents (fund fact sheet, prospectus, annual report, etc.) on www.fundinfo.com, or contact your Julius Baer representative for further information.
As of 20.09.2016; Source: Datastream, Julius Baer, Morningstar
Product facts Benchmark MSCI World / HC Equip & Supl NR USD
Base Currency CHF
Other Currencies (unhedged) USD, EUR
ISIN (USD Share Class) LU0969575561
ISIN (CHF Share Class) LU0329630999
ISIN (EUR Share Class) LU0329630130
NAV as of 16.09.2016 CHF 1’391.43
Size as of 31.08.2016 CHF 753.61 mln
Domicile Luxembourg
Launch Date 11.03.2008
TER 1.61%
Sales Registrations LI, LUX, CH, DE, AT
Supporting documents http://www.fundinfo.com/Variopartner

16
The weakening GBP turns into a tailwind for internationally exposed UK companies
• Despite some solid fundamental data releases since the UK vote on Brexit, our Research
expects the UK economy to weaken over the coming months.
• The Bank of England (BoE) has released a comprehensive set of further quantitative easing
measures to mitigate the potentially adverse impact of Brexit. A GBP-related inflation
overshoot will be tolerated by the BoE, implying negative consequences for the currency.
• Slowing foreign direct investments and trade disruptions will increase the current account
deficit.
• We expect the British pound to weaken further over the coming months – however, the
weakening currency will turn into a tailwind for those large and internationally exposed UK
companies having their cost base mostly in the UK.
• The impact of Brexit on the majority of stocks we cover and on their growth prospects should
be limited given that many UK companies have a globally well-diversified footprint and derive
only a low-to-mid-single digit percentage of their sales from the UK.
• By sector, we particularly see no major negative impact in general for UK consumer staples,
healthcare, business services and utility equities we cover.
BREXIT… AND NOW?
Large internationally exposed UK companies to profit
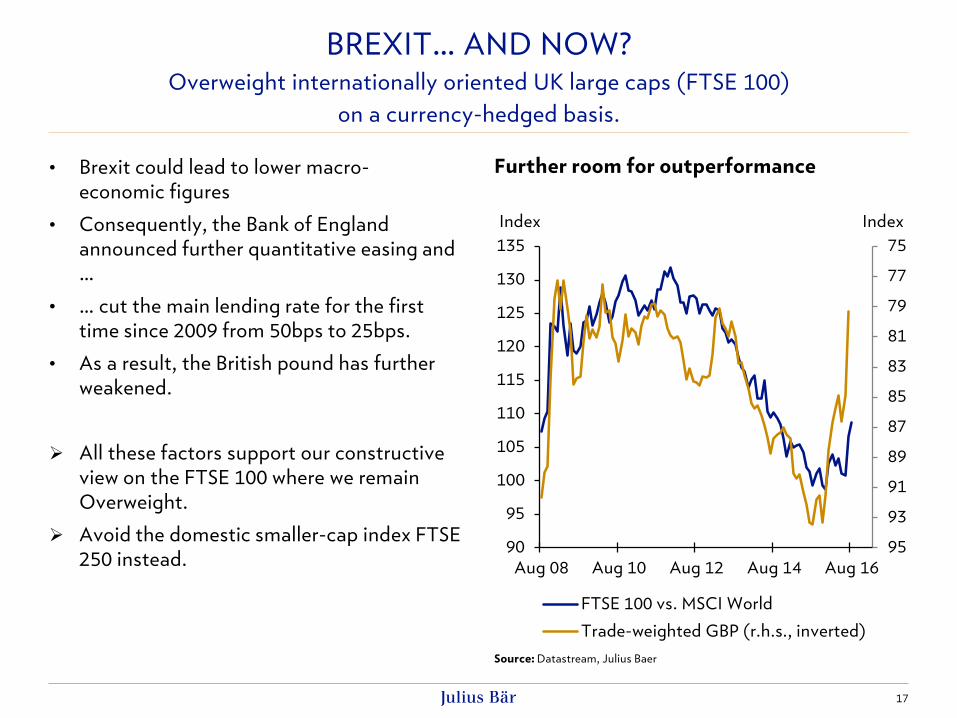
• Brexit could lead to lower macro-
economic figures
• Consequently, the Bank of England
announced further quantitative easing and
…
• … cut the main lending rate for the first
time since 2009 from 50bps to 25bps.
• As a result, the British pound has further
weakened.
All these factors support our constructive
view on the FTSE 100 where we remain
Overweight.
Avoid the domestic smaller-cap index FTSE
250 instead.
17
BREXIT… AND NOW? Overweight internationally oriented UK large caps (FTSE 100)
on a currency-hedged basis.
Source: Datastream, Julius Baer
Further room for outperformance
75
77
79
81
83
85
87
89
91
93
9590
95
100
105
110
115
120
125
130
135
Aug 08 Aug 10 Aug 12 Aug 14 Aug 16
IndexIndex
FTSE 100 vs. MSCI World
Trade-weighted GBP (r.h.s., inverted)
2017
2016
2018
2014
2015
-0.5
0.0
0.5
1.0
1.5
2.0
2.5
3.0
-1 0 1 2 3 4
Julius Baer forecast
Bloomberg consensus
Bank of England forecast
CPI inflation*
Real GDP growth*
Inflationary bust ("stagflation")
Inflationary boom
Deflationary bust
Deflationary boom
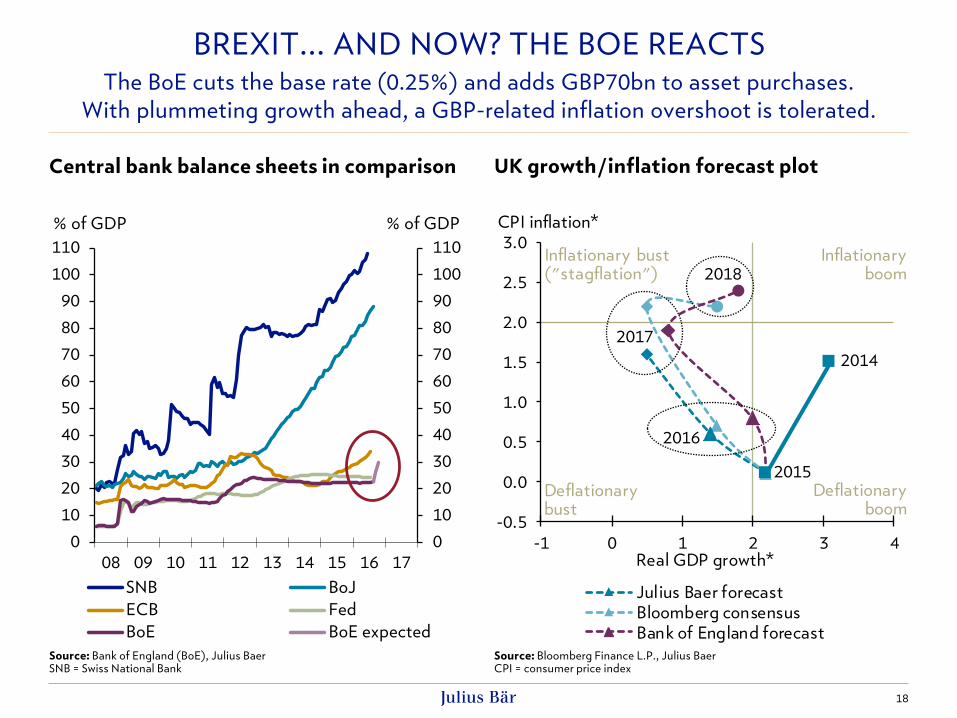
BREXIT... AND NOW? THE BOE REACTS The BoE cuts the base rate (0.25%) and adds GBP70bn to asset purchases.
With plummeting growth ahead, a GBP-related inflation overshoot is tolerated.
Source: Bank of England (BoE), Julius Baer SNB = Swiss National Bank
Source: Bloomberg Finance L.P., Julius Baer CPI = consumer price index
Central bank balance sheets in comparison UK growth/inflation forecast plot
18
0
10
20
30
40
50
60
70
80
90
100
110
0
10
20
30
40
50
60
70
80
90
100
110
08 09 10 11 12 13 14 15 16 17
SNB BoJ
ECB Fed
BoE BoE expected
% of GDP % of GDP
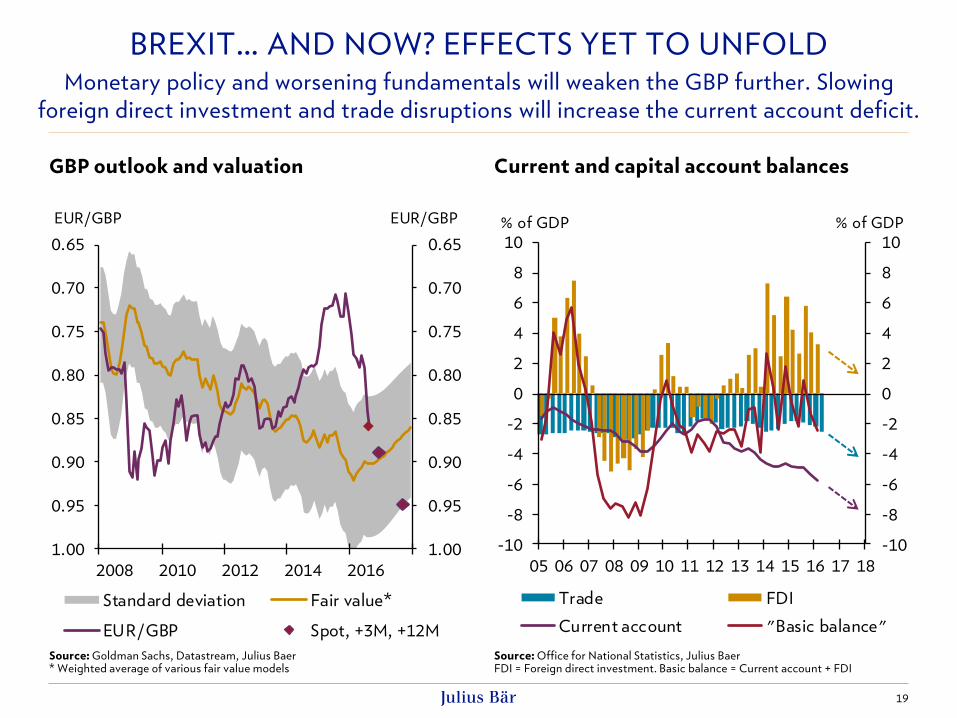
BREXIT… AND NOW? EFFECTS YET TO UNFOLD Monetary policy and worsening fundamentals will weaken the GBP further. Slowing
foreign direct investment and trade disruptions will increase the current account deficit.
Source: Goldman Sachs, Datastream, Julius Baer * Weighted average of various fair value models
Source: Office for National Statistics, Julius Baer FDI = Foreign direct investment. Basic balance = Current account + FDI
GBP outlook and valuation Current and capital account balances
19
0.65
0.70
0.75
0.80
0.85
0.90
0.95
1.00
2008 2010 2012 2014 2016
0.65
0.70
0.75
0.80
0.85
0.90
0.95
1.00
EUR/GBPEUR/GBP
Standard deviation Fair value*
EUR/GBP Spot, +3M, +12M
-10
-8
-6
-4
-2
0
2
4
6
8
10
05 06 07 08 09 10 11 12 13 14 15 16 17 18
-10
-8
-6
-4
-2
0
2
4
6
8
10
% of GDP% of GDP
Trade FDI
Current account "Basic balance"
BREXIT… AND NOW?
20
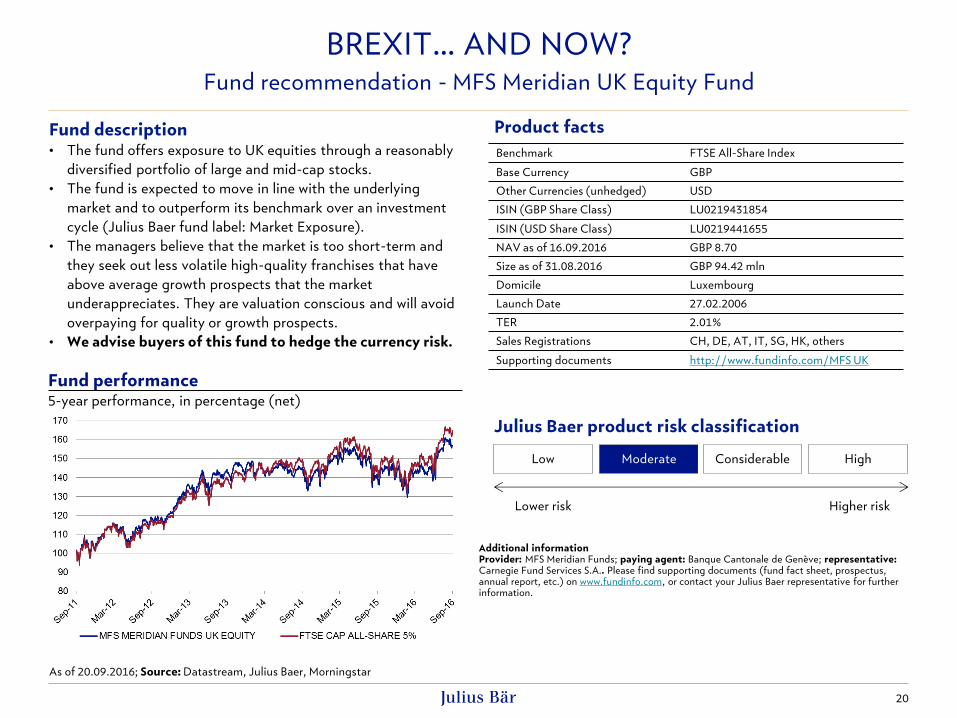
Fund recommendation - MFS Meridian UK Equity Fund
Fund description • The fund offers exposure to UK equities through a reasonably
diversified portfolio of large and mid-cap stocks.
• The fund is expected to move in line with the underlying
market and to outperform its benchmark over an investment
cycle (Julius Baer fund label: Market Exposure).
• The managers believe that the market is too short-term and
they seek out less volatile high-quality franchises that have
above average growth prospects that the market
underappreciates. They are valuation conscious and will avoid
overpaying for quality or growth prospects.
• We advise buyers of this fund to hedge the currency risk.
Fund performance 5-year performance, in percentage (net)
Low Moderate Considerable High
Lower risk Higher risk
Julius Baer product risk classification
Additional information Provider: MFS Meridian Funds; paying agent: Banque Cantonale de Genève; representative: Carnegie Fund Services S.A.. Please find supporting documents (fund fact sheet, prospectus, annual report, etc.) on www.fundinfo.com, or contact your Julius Baer representative for further information.
As of 20.09.2016; Source: Datastream, Julius Baer, Morningstar
Product facts
Benchmark FTSE All-Share Index
Base Currency GBP
Other Currencies (unhedged) USD
ISIN (GBP Share Class) LU0219431854
ISIN (USD Share Class) LU0219441655
NAV as of 16.09.2016 GBP 8.70
Size as of 31.08.2016 GBP 94.42 mln
Domicile Luxembourg
Launch Date 27.02.2006
TER 2.01%
Sales Registrations CH, DE, AT, IT, SG, HK, others
Supporting documents http://www.fundinfo.com/MFS UK
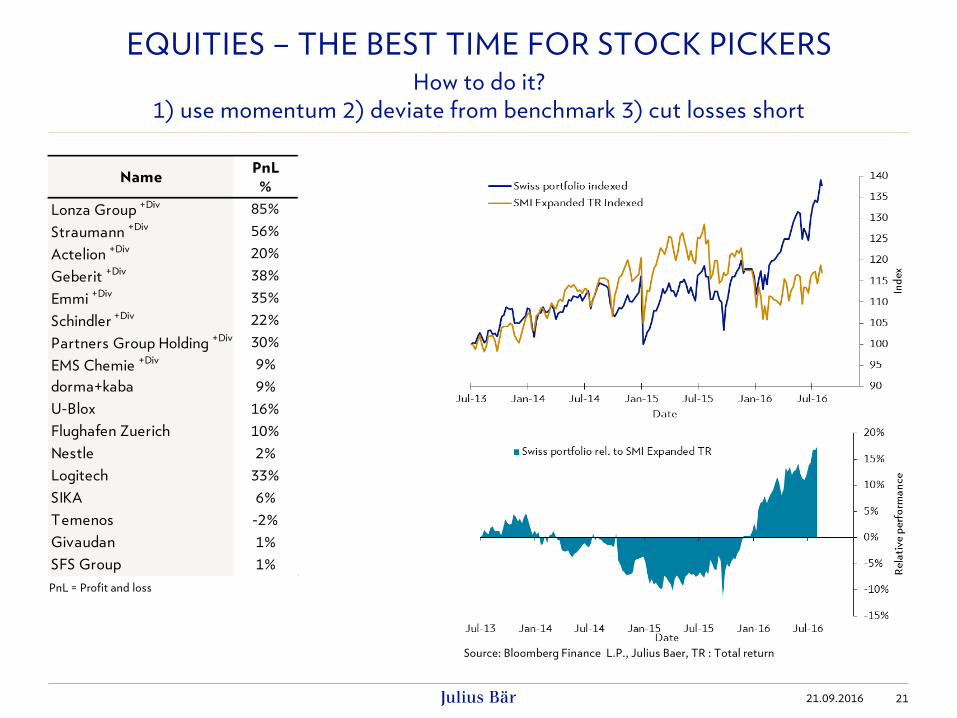
EQUITIES – THE BEST TIME FOR STOCK PICKERS
21.09.2016 21
How to do it?
1) use momentum 2) deviate from benchmark 3) cut losses short
NamePnL
%
Lonza Group +Div 85%
Straumann +Div 56%
Actelion +Div 20%
Geberit +Div 38%
Emmi +Div 35%
Schindler +Div 22%
Partners Group Holding +Div 30%
EMS Chemie +Div 9%
dorma+kaba 9%
U-Blox 16%
Flughafen Zuerich 10%
Nestle 2%
Logitech 33%
SIKA 6%
Temenos -2%
Givaudan 1%
SFS Group 1%
Source: Bloomberg Finance L.P., Julius Baer, TR : Total return
PnL = Profit and loss
EQUITIES – THE BEST TIME FOR STOCK PICKERS
22
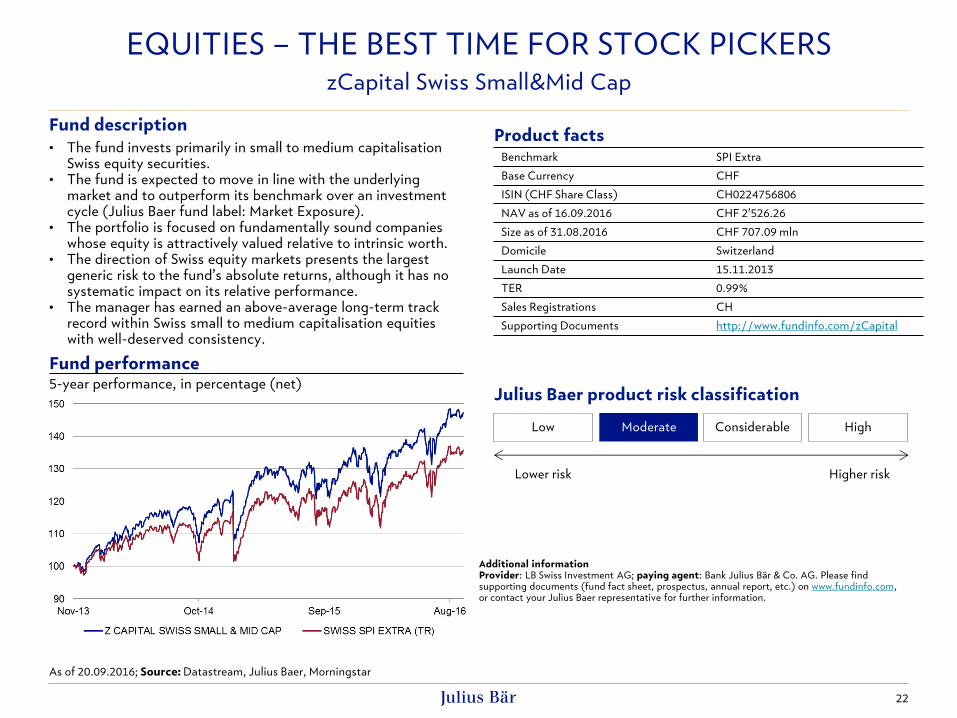
zCapital Swiss Small&Mid Cap
Fund description
• The fund invests primarily in small to medium capitalisation Swiss equity securities.
• The fund is expected to move in line with the underlying market and to outperform its benchmark over an investment cycle (Julius Baer fund label: Market Exposure).
• The portfolio is focused on fundamentally sound companies whose equity is attractively valued relative to intrinsic worth.
• The direction of Swiss equity markets presents the largest generic risk to the fund’s absolute returns, although it has no systematic impact on its relative performance.
• The manager has earned an above-average long-term track record within Swiss small to medium capitalisation equities with well-deserved consistency.
Fund performance 5-year performance, in percentage (net)
Additional information Provider: LB Swiss Investment AG; paying agent: Bank Julius Bär & Co. AG. Please find supporting documents (fund fact sheet, prospectus, annual report, etc.) on www.fundinfo.com, or contact your Julius Baer representative for further information.
Low Moderate Considerable High
Lower risk Higher risk
Julius Baer product risk classification
Benchmark SPI Extra
Base Currency CHF
ISIN (CHF Share Class) CH0224756806
NAV as of 16.09.2016 CHF 2’526.26
Size as of 31.08.2016 CHF 707.09 mln
Domicile Switzerland
Launch Date 15.11.2013
TER 0.99%
Sales Registrations CH
Supporting Documents http://www.fundinfo.com/zCapital
Product facts
As of 20.09.2016; Source: Datastream, Julius Baer, Morningstar

1980 1990 2000 2010 2020
-40
-30
-20
-10
0
10
20
30
40
500
1000
1500
2000
2500
TECHNICAL ANALYSIS – BUY US EQUITIES Long-term buy signal for S&P 500 – secular bull resuming
Source: Bloomberg Finance L.P., Julius Baer
9/21/2016
Comments
Towards the end of May, the
long-term momentum indicator
gave a new buy signal.
Historically, the S&P 500 gained
on average 21% after 12 months.
S&P 500 12-month forward return
Date Return
31.07.1942 38.4%
29.08.1947 4.2%
30.09.1949 24.8%
29.01.1954 40.5%
30.04.1958 32.6%
30.12.1960 23.1%
31.01.1967 6.5%
31.08.1970 21.5%
31.01.1975 31.0%
28.04.1978 5.1%
31.08.1982 37.6%
31.12.1984 26.3%
30.09.1988 28.4%
28.02.1991 12.4%
31.01.1995 35.2%
31.12.2001 -23.4%
29.05.2009 18.5%
Average 21.3%
S&P 500
Momentum
23
TECHNICAL ANALYSIS – BUY US EQUITIES
24
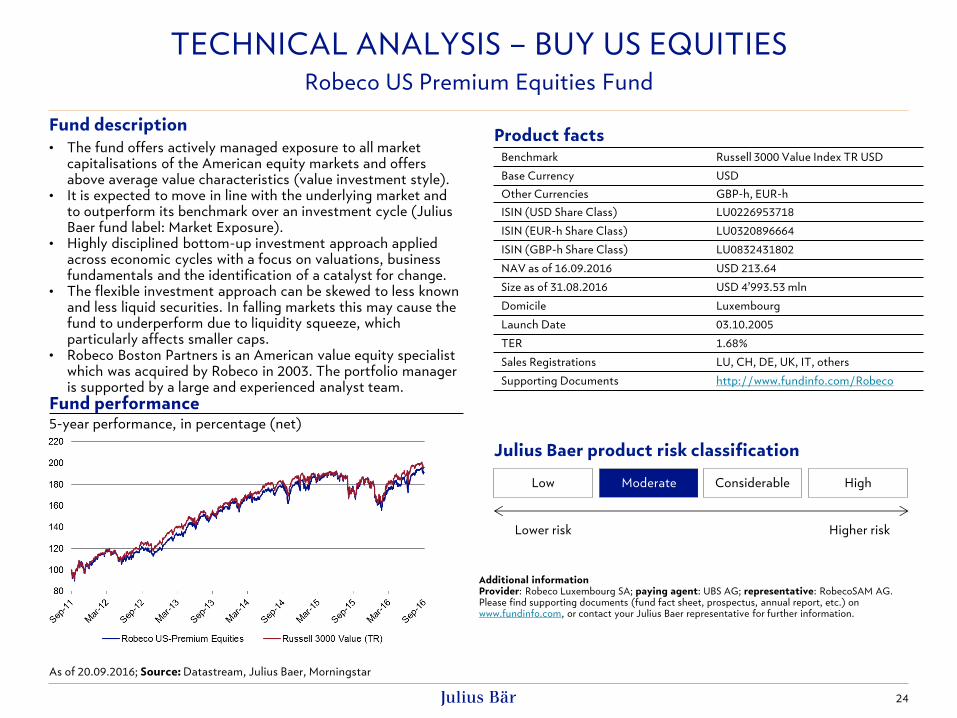
Robeco US Premium Equities Fund
Fund description
• The fund offers actively managed exposure to all market capitalisations of the American equity markets and offers above average value characteristics (value investment style).
• It is expected to move in line with the underlying market and to outperform its benchmark over an investment cycle (Julius Baer fund label: Market Exposure).
• Highly disciplined bottom-up investment approach applied across economic cycles with a focus on valuations, business fundamentals and the identification of a catalyst for change.
• The flexible investment approach can be skewed to less known and less liquid securities. In falling markets this may cause the fund to underperform due to liquidity squeeze, which particularly affects smaller caps.
• Robeco Boston Partners is an American value equity specialist which was acquired by Robeco in 2003. The portfolio manager is supported by a large and experienced analyst team.
Fund performance 5-year performance, in percentage (net)
Additional information Provider: Robeco Luxembourg SA; paying agent: UBS AG; representative: RobecoSAM AG. Please find supporting documents (fund fact sheet, prospectus, annual report, etc.) on www.fundinfo.com, or contact your Julius Baer representative for further information.
Low Moderate Considerable High
Lower risk Higher risk
Julius Baer product risk classification
Benchmark Russell 3000 Value Index TR USD
Base Currency USD
Other Currencies GBP-h, EUR-h
ISIN (USD Share Class) LU0226953718
ISIN (EUR-h Share Class) LU0320896664
ISIN (GBP-h Share Class) LU0832431802
NAV as of 16.09.2016 USD 213.64
Size as of 31.08.2016 USD 4’993.53 mln
Domicile Luxembourg
Launch Date 03.10.2005
TER 1.68%
Sales Registrations LU, CH, DE, UK, IT, others
Supporting Documents http://www.fundinfo.com/Robeco
Product facts
As of 20.09.2016; Source: Datastream, Julius Baer, Morningstar
TECHNICAL ANALYSIS – BUY US EQUITIES
25
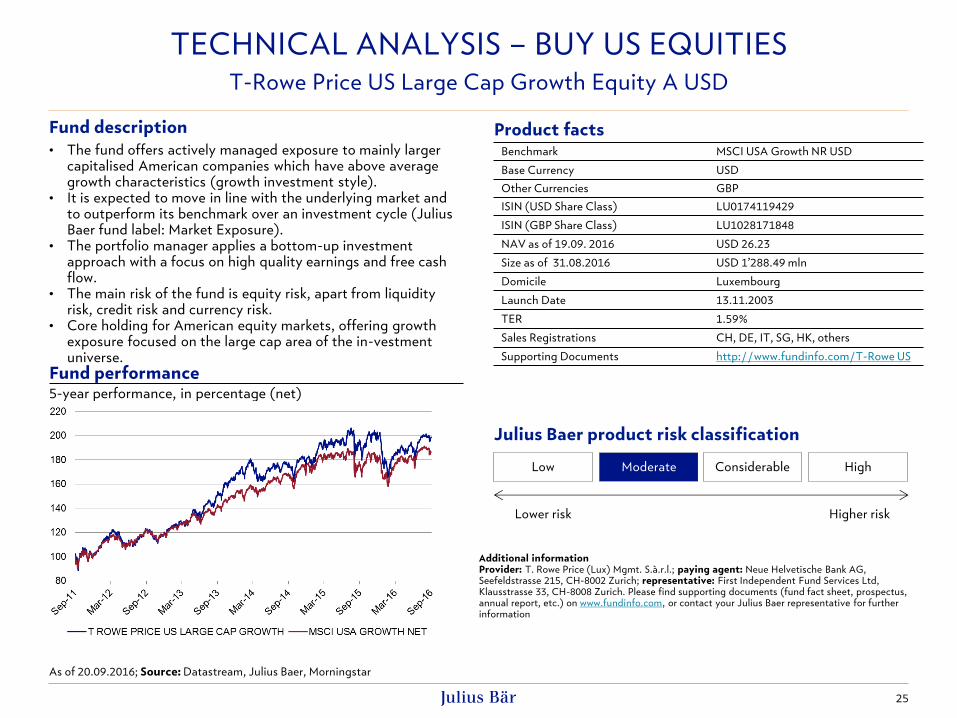
T-Rowe Price US Large Cap Growth Equity A USD
Fund description
• The fund offers actively managed exposure to mainly larger capitalised American companies which have above average growth characteristics (growth investment style).
• It is expected to move in line with the underlying market and to outperform its benchmark over an investment cycle (Julius Baer fund label: Market Exposure).
• The portfolio manager applies a bottom-up investment approach with a focus on high quality earnings and free cash flow.
• The main risk of the fund is equity risk, apart from liquidity risk, credit risk and currency risk.
• Core holding for American equity markets, offering growth exposure focused on the large cap area of the in-vestment universe.
Fund performance 5-year performance, in percentage (net)
Additional information Provider: T. Rowe Price (Lux) Mgmt. S.à.r.l.; paying agent: Neue Helvetische Bank AG, Seefeldstrasse 215, CH-8002 Zurich; representative: First Independent Fund Services Ltd, Klausstrasse 33, CH-8008 Zurich. Please find supporting documents (fund fact sheet, prospectus, annual report, etc.) on www.fundinfo.com, or contact your Julius Baer representative for further information
Low Moderate Considerable High
Lower risk Higher risk
Julius Baer product risk classification
Benchmark MSCI USA Growth NR USD
Base Currency USD
Other Currencies GBP
ISIN (USD Share Class) LU0174119429
ISIN (GBP Share Class) LU1028171848
NAV as of 19.09. 2016 USD 26.23
Size as of 31.08.2016 USD 1’288.49 mln
Domicile Luxembourg
Launch Date 13.11.2003
TER 1.59%
Sales Registrations CH, DE, IT, SG, HK, others
Supporting Documents http://www.fundinfo.com/T-Rowe US
Product facts
As of 20.09.2016; Source: Datastream, Julius Baer, Morningstar
26
Emerging market equities – favour Asia over Latam and EMEA
• Our Strategy Research has turned tactically more optimistic and has recently upgraded
emerging market equities from neutral to overweight.
• Our top-down investment rationale is that first, the US central bank will not raise rates in H2
2016, second, more funds will flow from Europe to emerging markets (due to political
uncertainty) and third, the earnings recovery will continue while valuations are attractive.
• Within Emerging Markets, Asia remains our favourite region for several reasons:
Asian governments have still room for fiscal and monetary stimulus measures.
Asia would be relatively less affected if the Fed raised rates over the coming months.
Political and structural reforms are under way.
Many of the emerging Asia countries are beneficiaries of lower commodity prices.
Valuation and earnings dynamics have turned positive over the last quarters.
Relative to the rally in other emerging markets, the region is lagging and valuations are
cheaper.
• We see most positive risk/return in China, Taiwan, India, Indonesia, Malaysia and Vietnam.
• We recommend investors buy into a broad-based emerging Asia investment vehicle to profit
from the current investment opportunity which we consider a short-term call (3-6 months).
EMERGING MARKETS (EM) – REASONS TO FAVOUR ASIA
Emerging Asian markets remain our favourite region

Investment rationale
Emerging Asian markets remain our
favourite region
1) Asian governments have room for fiscal
and monetary stimulus measures
2) Reforms are under way
3) Beneficiaries of lower commodity prices
4) Valuations and earnings dynamics
5) The region is lagging and valuations
have room to expand
Positive risk/return
• China, Taiwan, India, Indonesia,
Malaysia, Vietnam
27
EMERGING MARKETS (EM) – REASONS TO FAVOUR ASIA Focus on countries with a sound macroeconomic backdrop, less vulnerable to US
interest-rate increases, with attractive valuations and positive earnings dynamics.
Source: Bloomberg Finance L.P., Julius Baer; Ccy = Currency
Since 2012, the JP Morgan EM ccy index is -27%, the JPM Asia Dollar -7% and oil -60%
20
30
40
50
60
70
80
90
100
110
120
Dec 11 Oct 12 Aug 13 Jun 14 Apr 15 Feb 16
Index
Generic ICE brent futures -60.8%JPMorgan EM ccy index -26.6%JPMorgan Asia Dollar index -6.6%
Vietnam: Julius Baer makes no offering in local markets.
Taiwan: Julius Baer’s offering in the local market is restricted.
EMERGING MARKETS (EM) ASIA – RECOMMENDED FUND
28
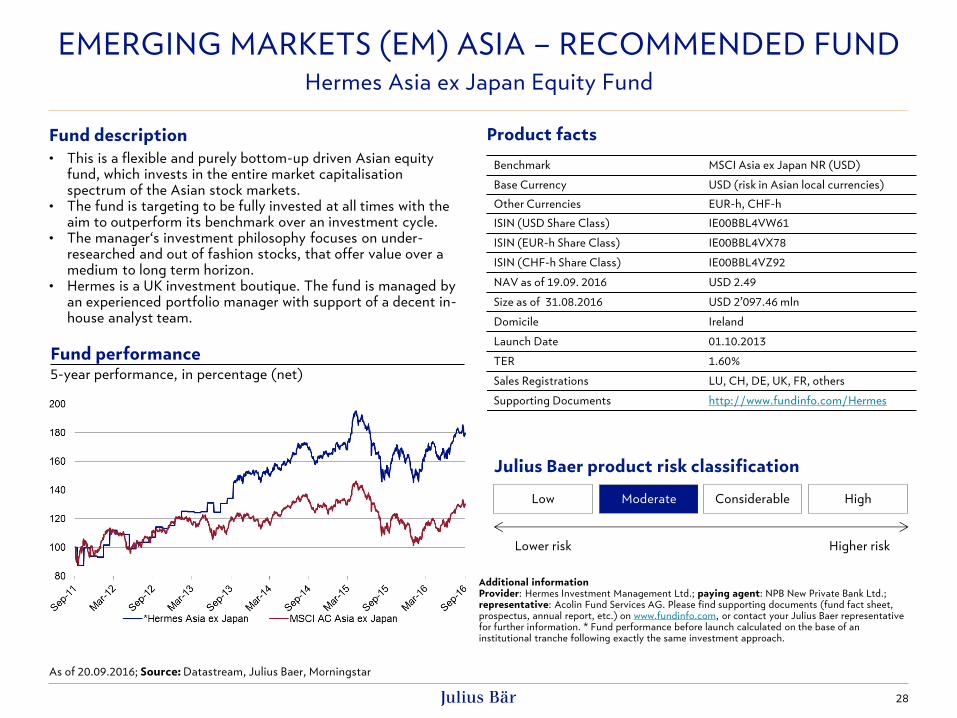
Hermes Asia ex Japan Equity Fund
Fund description
• This is a flexible and purely bottom-up driven Asian equity fund, which invests in the entire market capitalisation spectrum of the Asian stock markets.
• The fund is targeting to be fully invested at all times with the aim to outperform its benchmark over an investment cycle.
• The manager‘s investment philosophy focuses on under-researched and out of fashion stocks, that offer value over a medium to long term horizon.
• Hermes is a UK investment boutique. The fund is managed by an experienced portfolio manager with support of a decent in-house analyst team.
Fund performance 5-year performance, in percentage (net)
Low Moderate Considerable High
Lower risk Higher risk
Julius Baer product risk classification
Product facts
Benchmark MSCI Asia ex Japan NR (USD)
Base Currency USD (risk in Asian local currencies)
Other Currencies EUR-h, CHF-h
ISIN (USD Share Class) IE00BBL4VW61
ISIN (EUR-h Share Class) IE00BBL4VX78
ISIN (CHF-h Share Class) IE00BBL4VZ92
NAV as of 19.09. 2016 USD 2.49
Size as of 31.08.2016 USD 2’097.46 mln
Domicile Ireland
Launch Date 01.10.2013
TER 1.60%
Sales Registrations LU, CH, DE, UK, FR, others
Supporting Documents http://www.fundinfo.com/Hermes
Additional information Provider: Hermes Investment Management Ltd.; paying agent: NPB New Private Bank Ltd.; representative: Acolin Fund Services AG. Please find supporting documents (fund fact sheet, prospectus, annual report, etc.) on www.fundinfo.com, or contact your Julius Baer representative for further information. * Fund performance before launch calculated on the base of an institutional tranche following exactly the same investment approach.
As of 20.09.2016; Source: Datastream, Julius Baer, Morningstar

• By 2030, more than a quarter (26%) of global
consumption growth will be generated by the
working-age population of emerging Asia
(15–59 years old).
• Chinese and Indian millennials will represent most
of this essential consumer cohort. They are young,
digital natives, technologically savvy, disloyal to
brands and endlessly adaptable.
• We believe understanding this generation – which
will be at its peak consumption and household
formation point in 15 years – will be crucial for
investors in order to reap the fruits of the next two
decades’ worth of global consumption growth.
• We highlight six key trends on which they will
focus their consumption expenditure: premium
consumer goods, digital commerce, media &
entertainment, travel & tourism, banking &
insurance, fitness & sportswear.
• Companies, which are able to cater and adapt to
Chinese and Indian millennials’ consumption
preferences, will be the leaders of tomorrow.
29
ASIA’S YOUTH – THE TASTES THAT MATTER Scale, weight, changing tastes: Understanding the essential consumer of the future
Source: United Nations, US Census Bureau, Bank of America Merrill Lynch, Goldman Sachs, Julius Baer; bn=billion, EMs=emerging markets, DMs=developed markets; Note: Generation Z, 2000–present, Millennials, 1980–2000; Generation X, 1965–79; Baby Boomers, 1945–64; Greatest Generation, 1931–44.
86% of millennials in EMs, 34% in China and India: world population by generation (2015)
0.8
1.1
0.4
2.0
1.4
1.2
0.3
0%
20%
40%
60%
80%
100%
Population (bn)
GreatestGeneration
Baby Boomers
Gen-X
Gen-Z
Millennials(DMs)
Millennials(other EMs)
Millennials(China & India)
2.3bn millennials
Share (%)
ASIA’S YOUTH – THE TASTES THAT MATTER
30
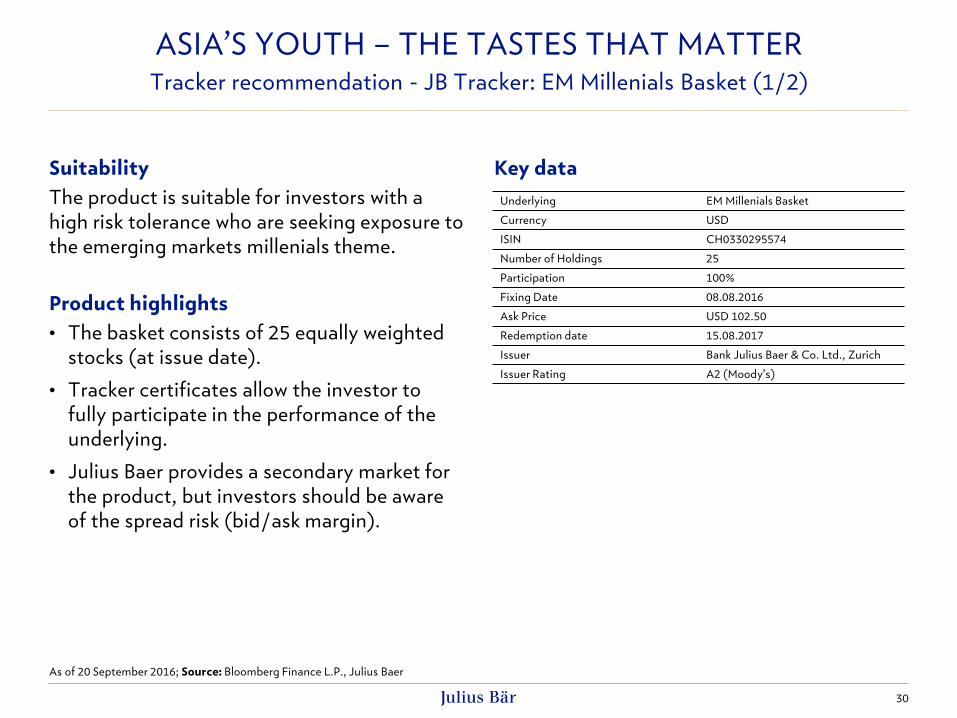
Tracker recommendation - JB Tracker: EM Millenials Basket (1/2)
Suitability
The product is suitable for investors with a
high risk tolerance who are seeking exposure to
the emerging markets millenials theme.
Product highlights
• The basket consists of 25 equally weighted
stocks (at issue date).
• Tracker certificates allow the investor to
fully participate in the performance of the
underlying.
• Julius Baer provides a secondary market for
the product, but investors should be aware
of the spread risk (bid/ask margin).
Key data
As of 20 September 2016; Source: Bloomberg Finance L.P., Julius Baer
Underlying EM Millenials Basket
Currency USD
ISIN CH0330295574
Number of Holdings 25
Participation 100%
Fixing Date 08.08.2016
Ask Price USD 102.50
Redemption date 15.08.2017
Issuer Bank Julius Baer & Co. Ltd., Zurich
Issuer Rating A2 (Moody’s)

ASIA’S YOUTH – THE TASTES THAT MATTER
31
Tracker recommendation - JB Tracker: EM Millennials Basket (2/2)
Constituents of the Basket
As of 20 September 2016; Source: Bloomberg Finance L.P., Julius Baer
Company ISIN Sector Currency Price Julius Baer
Target Price
FY1
P/E
Div. yield Julius Baer
Research Rating
Alibaba Grp-Adr US01609W1027 Information Technology USD 103.03 108.00 31.5 - Buy
Baidu Inc-Sp Adr US0567521085 Information Technology USD 184.74 190.00 39.7 - Buy
Naspers Ltd-N ZAE000015889 Consumer Discretionary ZAr 239,931 - 44.7 0.29% not rated
Tencent KYG875721634 Information Technology HKD 209.00 210.00 38.2 0.30% Buy
Yandex Nv-A NL0009805522 Information Technology USD 20.77 - 32.0 - not rated
Amorepacific Gro KR7002790004 Consumer Staples KRW 158,000 - 32.9 - not rated
Cp All Pcl-Nvdr TH0737010R15 Consumer Staples THB 60.00 - 33.1 - not rated
Imax China Holdi KYG476341030 Consumer Discretionary HKD 39.00 - 35.2 0.42% Hold
Lg Household & H KR7051900009 Consumer Staples KRW 973,000 - 25.8 0.62% not rated
Matahari Dept ID1000113301 Consumer Discretionary IDR 18,900 - 25.1 2.50% not rated
Universal Robina PHY9297P1004 Consumer Staples PHP 184.80 210.00 28.2 1.85% Hold
Ambev Sa BRABEVACNOR1 Consumer Staples BRL 19.45 - 21.9 4.06% not rated
Coca-Cola Icecek TRECOLA00011 Consumer Staples TRY 37.66 - 24.9 0.92% not rated
Fomento Econ-Ubd MXP320321310 Consumer Staples MXN 168.77 - 27.5 1.52% not rated
Anta Sports Prod KYG040111059 Consumer Discretionary HKD 20.40 - 18.6 3.73% not rated
Eclat Textile Co TW0001476000 Consumer Discretionary TWD 363.50 - 24.3 2.76% not rated
Hdfc Bank-Adr US40415F1012 Financials USD 71.58 - 34.3 0.79% not rated
Ping An-H CNE1000003X6 Financials HKD 42.40 49.00 11.2 1.46% Buy
Qualicorp Sa BRQUALACNOR6 Health Care BRL 19.88 - 14.6 3.05% not rated
Kroton BRKROTACNOR9 Consumer Discretionary BRL 15.10 - 13.3 2.52% not rated
New Oriental-Adr US6475811070 Consumer Discretionary USD 46.56 - 26.1 0.39% not rated
Airports of Thailand TH0765010R16 Industrials THB 395.00 400.0 30.8 - Hold
TAV Havalimanlari Holding AS TRETAVH00018 Industrials TRY 11.23 - 7.7 6.69% not rated
Minor Inter-Nvdr TH0128010R17 Consumer Discretionary THB 39.00 - 29.8 - not rated
Ctrip.Com-Adr US22943F1003 Consumer Discretionary USD 43.77 50.00 146.2 - Buy

ASIA’S YOUTH – THE TASTES THAT MATTER
32
Mirae Asset Asia Great Consumer Equity
Fund description
• This is a flexible and unconstrained managed Asian equity fund, which invests in Asian consumer related stocks across the market capitalisation spectrum.
• The fund is expected to move in line with the underlying market and to outperform its benchmark over an investment cycle (Julius Baer fund label: Market Exposure).
• The manager‘s investment philosophy focuses on bottom up stock selection to identify areas in Asia, which profit form the fast growing domestic consumption and deliver above average returns.
• Since the manager intends to be fully invested in Asian stocks at all times, the fund is exposed to market risk.
• The high conviction portfolio of around 30 to 40 names is mainly composed by a bottom up investment approach with a sector / macro overlay.
Fund performance 5-year performance, in percentage (net)
Low Moderate Considerable High
Lower risk Higher risk
Julius Baer product risk classification
Additional information Provider: Mirae Asset Global Investments Co Ltd; paying agent: Notenstein Privatbank AG; representative: 1741 Asset Management AG. Please find supporting documents (fund fact sheet, prospectus, annual report, etc.) on www.fundinfo.com, or contact your Julius Baer representative for further information.
Benchmark MSCI Asia ex Japan NR USD
Base Currency USD
Other Currencies EUR-h, EUR, GBP
ISIN (USD Share Class) LU0593848301
ISIN (EUR-h Share Class) LU0593848723
ISIN (GBP-h Share Class) LU0853239118
NAV as 19.09.2016 USD 12.91
Size as of 31.07.2016 USD 737.95 mln
Domicile Luxembourg
Launch Date 07.06.2011
TER 1.73%
Sales Registration CH, DE, UK, IT, SG, HK, others
Supporting Documents https://www.fundinfo.com/Mirae
Product facts
As of 20.09.2016; Source: Datastream, Julius Baer, Morningstar

33
GLOBAL EMERGING MARKETS WMP EM Established Leaders Fund
Fund performance 5-year performance, in percentage (net)
Product facts
Additional information Provider: WMPartners Vermögensverwaltungs AG; paying agent: Bank Julius Baer & Co. AG; representative: Swiss & Global Asset Mgmt. AG. Please find supporting documents (fund fact sheet, prospectus, annual report, etc.) on www.fundinfo.com, or contact your Julius Baer representative for further information.
Fund highlights
• The fund’s focus is mainly on subsidiaries of high-quality
multinational concerns (MNCs) or companies with strong ties
or joint ventures with MNCs based in emerging markets.
• The approach combines the growth opportunities in emerging
markets with the quality of multinationals.
• By applying this approach the fund managed to substantially
reduce the downside participation while achieving decent
upside since inception.
• The fund is always fully invested and therefore volatile stock
markets can lead to declines in the fund.
Benchmark MSCI EM PR USD
Base Currency CHF (local EM currencies)
Other Currencies USD, EUR
ISIN (USD Share Class) LU1328691545
ISIN (EUR Share Class) LU1144941785
ISIN (CHF Share Class) LU0469452717
NAV as of 16.09.2016 CHF 124.70
Size as of 31.08.2016 CHF 86.94 mln
Domicile Luxembourg
Launch Date 31.05.2010
TER 1.83%
Sales Registrations LU, CH, DE, AT
Supporting Documents http://www.fundinfo.com/WMP EM
Julius Baer product risk classification
Low Moderate Considerable High
Lower risk Higher risk
As of 20.09.2016; Source: Datastream, Julius Baer, Morningstar

GLOBAL EMERGING MARKETS
34
Fund recommendations - Polar Emerging Markets Income Fund
Fund description
• The fund offers actively managed exposure to global emerging market equities managed with a focus on high dividend payments.
• Combination of a bottom-up based investment approach with a macroeconomic overlay aims for a portfolio dividend yield in excess of 3.5%.
• The investment approach tends to be skewed to less known and less liquid securities. In falling markets, this may cause the fund to underperform due to the liquidity squeeze, which particularly affects companies in emerging markets or with smaller market capitalisation.
• The basis of the portfolio (60%) consists of growth companies with an established dividend culture. Up to 25% of the portfolio will be allocated to pure high dividend stocks and up to 15% will be allocated to the most undervalued stocks.
Low Moderate Considerable High
Lower risk Higher risk
Julius Baer product risk classification
Fund performance 5-year performance, in percentage (net)
Additional information Provider: Polar Capital LLP; paying agent: BNP Paribas Securities Services, Paris, succursale de Zurich; representative: BNP Paribas Securities Services, Paris, succursale de Zurich. Please find supporting documents (fund fact sheet, prospectus, annual report, etc.) on www.fundinfo.com, or contact your Julius Baer representative for further information.
Product facts
Benchmark MSCI EM TR USD
Base Currency USD (local EM currencies)
Other Currencies GBP, EUR
ISIN (USD Share Class) IE00B4VVWP88
ISIN (EUR Share Class) IE00B4WZTL41
ISIN (GBP Share Class) IE00B4YDSX18
NAV as of 16.09.2016 USD 9.88
Size as of 31.08.2016 USD 309.44 mln
Domicile Ireland
Launch Date 21.11.2011
TER 1.71%
Sales Registrations CH, UK, DE, IT, SG, others
Supporting Documents http://www.fundinfo.com/Polar EM
As of 20.09.2016; Source: Datastream, Julius Baer, Morningstar

• The continued evolution of finance and
technology is providing an opportunity-filled
investment landscape in payments, lending,
capital markets and asset and wealth
management.
• FinTech (financial technology) companies are a
growing threat to slow-moving financials, but
incumbents are fighting back with increasing in-
house development and external investments.
• From a risk/return perspective, we favour:
Payment networks, which are central to
expanding electronic payments penetration.
Payment processors, which help merchants
to drive better returns by expanding their
payments solutions.
Solutions providers (software &
information) to financial companies, since
financials need to leverage technology and
information services to remain competitive.
• Avoid marketplace lending at this juncture,
given risk/return profile.
35
FINTECH – AN OPPORTUNITY, NOT A THREAT The global financial industry is embarking on a new cycle of innovation. We favour
payments networks & processors, and solutions providers to financial institutions.
Source: CB Insights, KPMG, Credit Suisse, Citigroup, Julius Baer;
P2P=peer-to-peer, SME=Small and medium-sized enterprises
Ballooning investments into FinTech
Fintech
Payments
E.g. mobile payments, P2P money transfer
Lending
E.g. P2P lending, SME
financing
Asset & Wealth
Management
e.g. Robo-advisory
Capital Markets
e.g. Crowdfunding
Software and information providers
1.8 2.4 2.83.9
12.2
19.1
0
200
400
600
800
1'000
1'200
1'400
0
5
10
15
20
25
2010 2011 2012 2013 2014 2015
DealsUSD bn
Overall global FinTech investments (l.h.s.)
Overall FinTech deals (r.h.s.)
FINTECH – AN OPPORTUNITY, NOT A THREAT
36
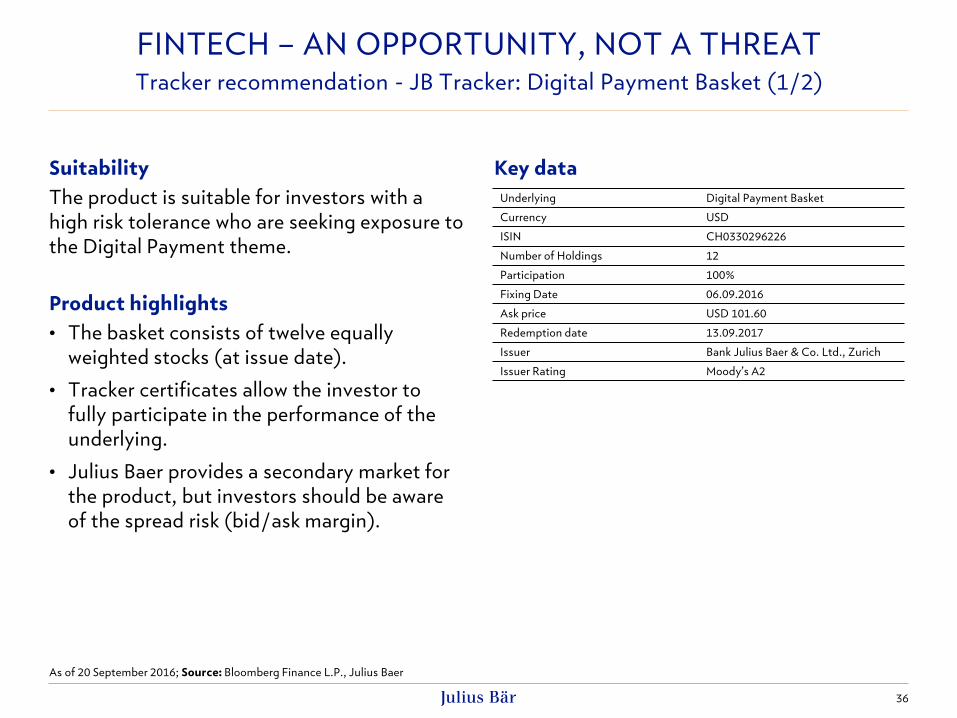
Tracker recommendation - JB Tracker: Digital Payment Basket (1/2)
Suitability
The product is suitable for investors with a
high risk tolerance who are seeking exposure to
the Digital Payment theme.
Product highlights
• The basket consists of twelve equally
weighted stocks (at issue date).
• Tracker certificates allow the investor to
fully participate in the performance of the
underlying.
• Julius Baer provides a secondary market for
the product, but investors should be aware
of the spread risk (bid/ask margin).
Key data
As of 20 September 2016; Source: Bloomberg Finance L.P., Julius Baer
Underlying Digital Payment Basket
Currency USD
ISIN CH0330296226
Number of Holdings 12
Participation 100%
Fixing Date 06.09.2016
Ask price USD 101.60
Redemption date 13.09.2017
Issuer Bank Julius Baer & Co. Ltd., Zurich
Issuer Rating Moody’s A2

FINTECH – AN OPPORTUNITY, NOT A THREAT
37
Tracker recommendation - JB Tracker: Digital Payment Basket (2/2)
Constituents of the Basket
As of 20 September 2016; Source: Bloomberg Finance L.P., Julius Baer
Company ISIN Country Currency Price Julius Baer
Target Price
FY1
P/E
Div. yield Julius Baer
Research Rating
Alibaba US01609W1027 China USD 101.64 108.00 31.1 - Buy
Alphabet Inc. US02079K3059 United States USD 799.78 910.00 23.4 - Buy
Apple US0378331005 United States USD 113.76 95.00 13.8 1.92% Hold
Global Payments US37940X1028 United States USD 74.33 - 21.4 0.05% -
Ingenico FR0000125346 France EUR 80.19 106.00 19.1 1.71% Hold
Mastercard US57636Q1040 United States USD 100.24 110.00 27.7 0.76% Buy
NXP Semiconductors NL0009538784 Netherlands USD 82.67 98.00 14.5 - Buy
PayPal Holdings US70450Y1038 United States USD 40.00 39.00 26.8 - Hold
Vantiv US92210H1059 United States USD 54.08 57.00 20.3 - Hold
Visa US92826C8394 United States USD 82.54 90.00 29.6 0.68% Buy
Worldline FR0011981968 France EUR 28.09 28.80 28.1 0.73% Hold
Worldpay Group GB00BYYK2V80 United Kingdom GBp 303.50 310.00 25.9 0.69% Buy
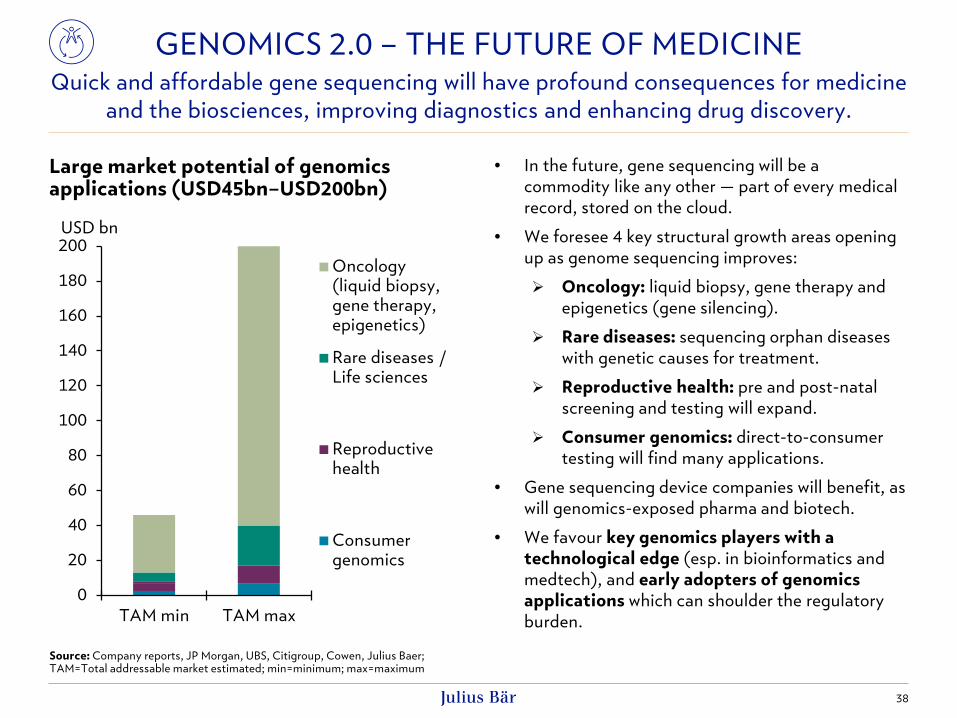
• In the future, gene sequencing will be a
commodity like any other — part of every medical
record, stored on the cloud.
• We foresee 4 key structural growth areas opening
up as genome sequencing improves:
Oncology: liquid biopsy, gene therapy and
epigenetics (gene silencing).
Rare diseases: sequencing orphan diseases
with genetic causes for treatment.
Reproductive health: pre and post-natal
screening and testing will expand.
Consumer genomics: direct-to-consumer
testing will find many applications.
• Gene sequencing device companies will benefit, as
will genomics-exposed pharma and biotech.
• We favour key genomics players with a
technological edge (esp. in bioinformatics and
medtech), and early adopters of genomics
applications which can shoulder the regulatory
burden.
38
GENOMICS 2.0 – THE FUTURE OF MEDICINE Quick and affordable gene sequencing will have profound consequences for medicine
and the biosciences, improving diagnostics and enhancing drug discovery.
Source: Company reports, JP Morgan, UBS, Citigroup, Cowen, Julius Baer; TAM=Total addressable market estimated; min=minimum; max=maximum
Large market potential of genomics applications (USD45bn–USD200bn)
0
20
40
60
80
100
120
140
160
180
200
TAM min TAM max
USD bn
Oncology(liquid biopsy,gene therapy,epigenetics)
Rare diseases /Life sciences
Reproductivehealth
Consumergenomics

GENOMICS 2.0 – THE FUTURE OF MEDICINE
39
Tracker recommendation - JB Tracker: Genomics Basket (1/2)
Suitability
The product is suitable for investors with a
high risk tolerance who are seeking exposure to
the Genomics theme.
Product highlights
• The basket consists of fifteen equally
weighted stocks (at issue date).
• Tracker certificates allow the investor to
fully participate in the performance of the
underlying.
• Julius Baer provides a secondary market for
the product, but investors should be aware
of the spread risk (bid/ask margin).
Key data
As of 20 September 2016; Source: Bloomberg Finance L.P., Julius Baer
Underlying Genomics Basket
Currency USD
ISIN CH0330296028
Number of Holdings 15
Participation 100%
Fixing Date 25.08.2016
Ask price USD 108.20
Redemption date 01.09.2017
Issuer Bank Julius Baer & Co. Ltd., Zurich
Issuer Rating A2 (Moody’s)
GENOMICS 2.0 – THE FUTURE OF MEDICINE
40
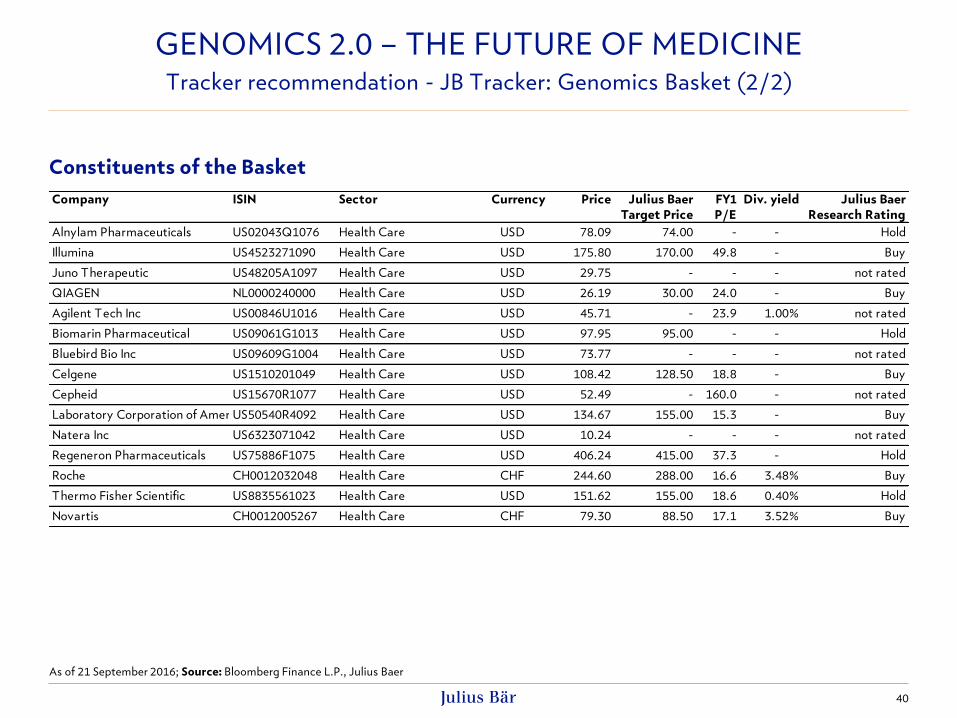
Tracker recommendation - JB Tracker: Genomics Basket (2/2)
Constituents of the Basket
As of 21 September 2016; Source: Bloomberg Finance L.P., Julius Baer
Company ISIN Sector Currency Price Julius Baer
Target Price
FY1
P/E
Div. yield Julius Baer
Research Rating
Alnylam Pharmaceuticals US02043Q1076 Health Care USD 78.09 74.00 - - Hold
Illumina US4523271090 Health Care USD 175.80 170.00 49.8 - Buy
Juno Therapeutic US48205A1097 Health Care USD 29.75 - - - not rated
QIAGEN NL0000240000 Health Care USD 26.19 30.00 24.0 - Buy
Agilent Tech Inc US00846U1016 Health Care USD 45.71 - 23.9 1.00% not rated
Biomarin Pharmaceutical US09061G1013 Health Care USD 97.95 95.00 - - Hold
Bluebird Bio Inc US09609G1004 Health Care USD 73.77 - - - not rated
Celgene US1510201049 Health Care USD 108.42 128.50 18.8 - Buy
Cepheid US15670R1077 Health Care USD 52.49 - 160.0 - not rated
Laboratory Corporation of AmericaUS50540R4092 Health Care USD 134.67 155.00 15.3 - Buy
Natera Inc US6323071042 Health Care USD 10.24 - - - not rated
Regeneron Pharmaceuticals US75886F1075 Health Care USD 406.24 415.00 37.3 - Hold
Roche CH0012032048 Health Care CHF 244.60 288.00 16.6 3.48% Buy
Thermo Fisher Scientific US8835561023 Health Care USD 151.62 155.00 18.6 0.40% Hold
Novartis CH0012005267 Health Care CHF 79.30 88.50 17.1 3.52% Buy
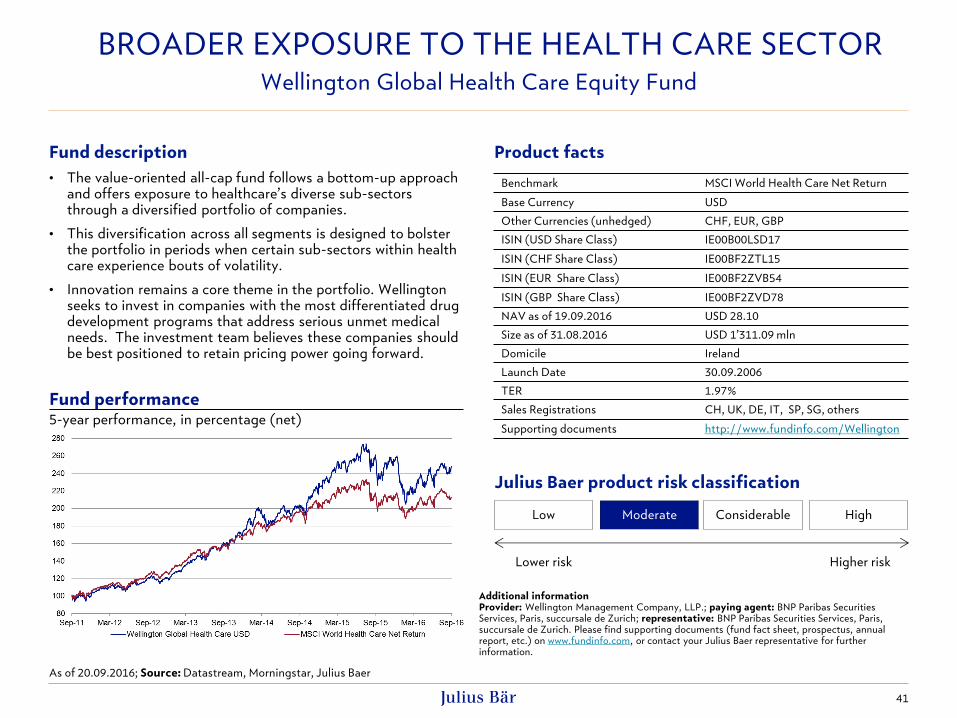
41
Fund description
• The value-oriented all-cap fund follows a bottom-up approach and offers exposure to healthcare’s diverse sub-sectors through a diversified portfolio of companies.
• This diversification across all segments is designed to bolster the portfolio in periods when certain sub-sectors within health care experience bouts of volatility.
• Innovation remains a core theme in the portfolio. Wellington seeks to invest in companies with the most differentiated drug development programs that address serious unmet medical needs. The investment team believes these companies should be best positioned to retain pricing power going forward.
Fund performance 5-year performance, in percentage (net)
Benchmark MSCI World Health Care Net Return
Base Currency USD
Other Currencies (unhedged) CHF, EUR, GBP
ISIN (USD Share Class) IE00B00LSD17
ISIN (CHF Share Class) IE00BF2ZTL15
ISIN (EUR Share Class) IE00BF2ZVB54
ISIN (GBP Share Class) IE00BF2ZVD78
NAV as of 19.09.2016 USD 28.10
Size as of 31.08.2016 USD 1’311.09 mln
Domicile Ireland
Launch Date 30.09.2006
TER 1.97%
Sales Registrations CH, UK, DE, IT, SP, SG, others
Supporting documents http://www.fundinfo.com/Wellington
BROADER EXPOSURE TO THE HEALTH CARE SECTOR Wellington Global Health Care Equity Fund
Additional information Provider: Wellington Management Company, LLP.; paying agent: BNP Paribas Securities Services, Paris, succursale de Zurich; representative: BNP Paribas Securities Services, Paris, succursale de Zurich. Please find supporting documents (fund fact sheet, prospectus, annual report, etc.) on www.fundinfo.com, or contact your Julius Baer representative for further information.
Product facts
As of 20.09.2016; Source: Datastream, Morningstar, Julius Baer
Low Moderate Considerable High
Lower risk Higher risk
Julius Baer product risk classification
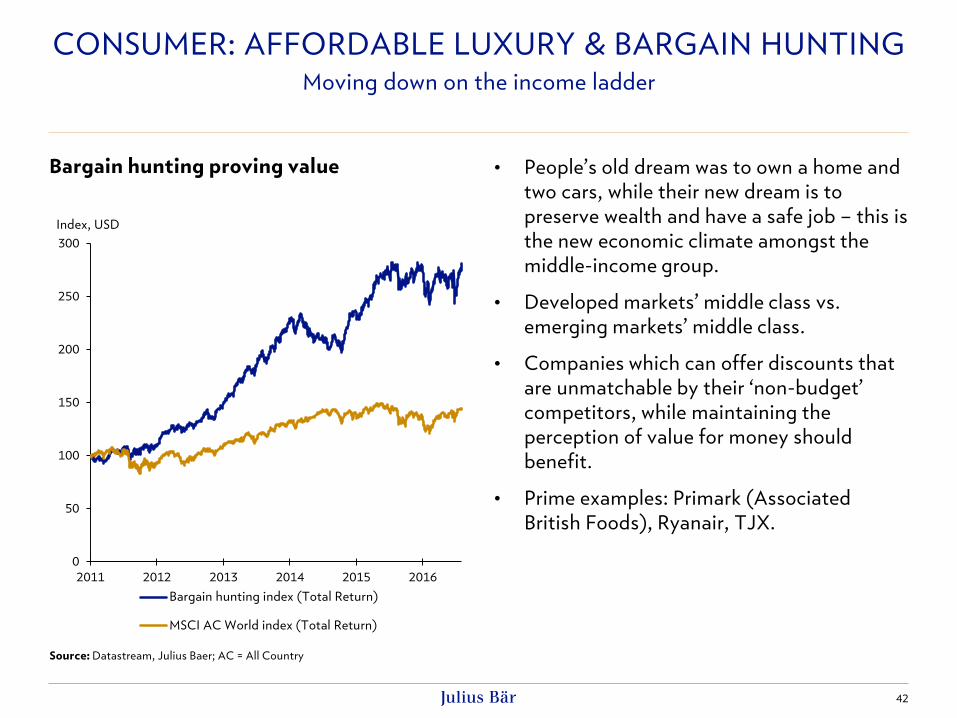
• People’s old dream was to own a home and
two cars, while their new dream is to
preserve wealth and have a safe job – this is
the new economic climate amongst the
middle-income group.
• Developed markets’ middle class vs.
emerging markets’ middle class.
• Companies which can offer discounts that
are unmatchable by their ‘non-budget’
competitors, while maintaining the
perception of value for money should
benefit.
• Prime examples: Primark (Associated
British Foods), Ryanair, TJX.
42
CONSUMER: AFFORDABLE LUXURY & BARGAIN HUNTING Moving down on the income ladder
Source: Datastream, Julius Baer; AC = All Country
Bargain hunting proving value
0
50
100
150
200
250
300
2011 2012 2013 2014 2015 2016
Index, USD
Bargain hunting index (Total Return)
MSCI AC World index (Total Return)

• The exponentially growing middle class,
fuelled by lower oil prices, coupled with
globalisation and technological changes,
boosts the consumption of premium goods
and services.
• Both established and new companies with
an appealing image should profit from
these developments through even greater
brand awareness and sales.
• Prime examples: L’Oreal, Heineken or Lindt
& Sprüngli
43
CONSUMER: AFFORDABLE LUXURY & BARGAIN HUNTING Moving up on the income ladder
Source: Datastream, Julius Baer
Affordable luxury on the loose
0
50
100
150
200
250
300
2011 2012 2013 2014 2015 2016
Index, USD
Affordable luxury index (Total Return)
MSCI AC World index (Total Return)
Affordable luxury (Total Return)
CONSUMER: AFFORDABLE LUXURY & BARGAIN HUNTING
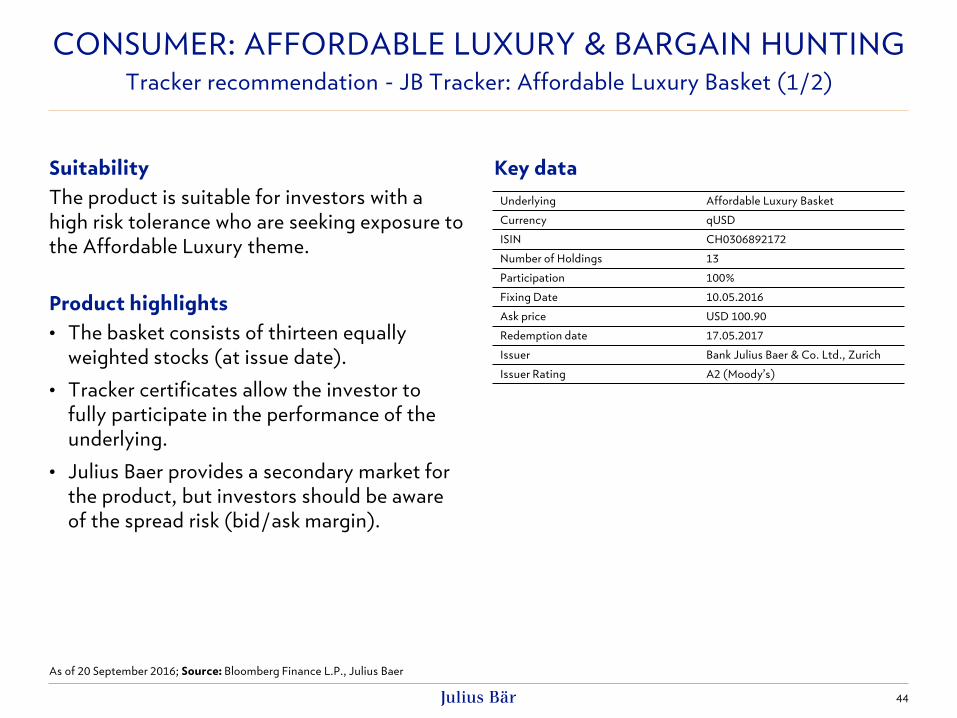
44
Tracker recommendation - JB Tracker: Affordable Luxury Basket (1/2)
Suitability
The product is suitable for investors with a
high risk tolerance who are seeking exposure to
the Affordable Luxury theme.
Product highlights
• The basket consists of thirteen equally
weighted stocks (at issue date).
• Tracker certificates allow the investor to
fully participate in the performance of the
underlying.
• Julius Baer provides a secondary market for
the product, but investors should be aware
of the spread risk (bid/ask margin).
Key data
As of 20 September 2016; Source: Bloomberg Finance L.P., Julius Baer
Underlying Affordable Luxury Basket
Currency qUSD
ISIN CH0306892172
Number of Holdings 13
Participation 100%
Fixing Date 10.05.2016
Ask price USD 100.90
Redemption date 17.05.2017
Issuer Bank Julius Baer & Co. Ltd., Zurich
Issuer Rating A2 (Moody’s)

CONSUMER: AFFORDABLE LUXURY & BARGAIN HUNTING
45
Tracker recommendation - JB Tracker: Affordable Luxury Basket (2/2)
Constituents of the Basket
As of 20 September 2016; Source: Bloomberg Finance L.P., Julius Baer
Company ISIN Country Currency Price Julius Baer
Target Price
FY1
P/E
Div. yield Julius Baer
Research Rating
Adidas DE000A1EWWW0 Germany EUR 151.70 150.00 31.3 1.32% Hold
British American Tobacco GB0002875804 United Kingdom GBp 4,814 5,300 19.7 3.44% Buy
Comcast US20030N1019 United States USD 65.85 75.00 18.8 1.68% Buy
Constellation Brands US21036P1084 United States USD 162.68 180.00 25.9 0.97% Buy
Estée Lauder US5184391044 United States USD 87.38 100.00 25.2 1.51% Buy
H&M SE0000106270 Sweden SEK 247.10 310.00 21.4 3.93% Buy
Heineken NL0000009165 Netherlands EUR 78.82 91.00 21.5 1.71% Buy
Lindt & Sprüngli CH0010570767 Switzerland CHF 5650.00 6500.00 32.1 1.57% Buy
L'Oreal FR0000120321 France EUR 167.25 195.00 26.0 1.98% Buy
Pernod Ricard FR0000120693 France EUR 104.30 110.00 19.1 1.88% Hold
Reckitt Benckiser GB00B24CGK77 United Kingdom GBp 7,252 7,500 24.7 2.07% Hold
Starbucks US8552441094 United States USD 53.01 60.00 28.0 1.54% Hold
Under Armour US9043111072 United States USD 38.74 48.00 65.5 - Buy

CONSUMER: AFFORDABLE LUXURY & BARGAIN HUNTING
46
Tracker recommendation - JB Tracker: Bargain Hunting Basket (1/2)
Suitability
The product is suitable for investors with a
high risk tolerance who are seeking exposure to
the Bargain Hunting theme.
Product highlights
• The basket consists of ten equally weighted
stocks (at issue date).
• Tracker certificates allow the investor to
fully participate in the performance of the
underlying.
• Julius Baer provides a secondary market for
the product, but investors should be aware
of the spread risk (bid/ask margin).
Key data
As of 20 September 2016; Source: Bloomberg Finance L.P., Julius Baer
Underlying Bargain Hunting Basket
Currency Composite USD
ISIN CH0330296143
Number of Holdings 10
Participation 100%
Fixing Date 02.09.2016
Ask price USD 96.25
Redemption date 10.09.2018
Issuer Bank Julius Baer & Co. Ltd., Zurich
Issuer Rating A2 (Moody’s)
CONSUMER: AFFORDABLE LUXURY & BARGAIN HUNTING
47
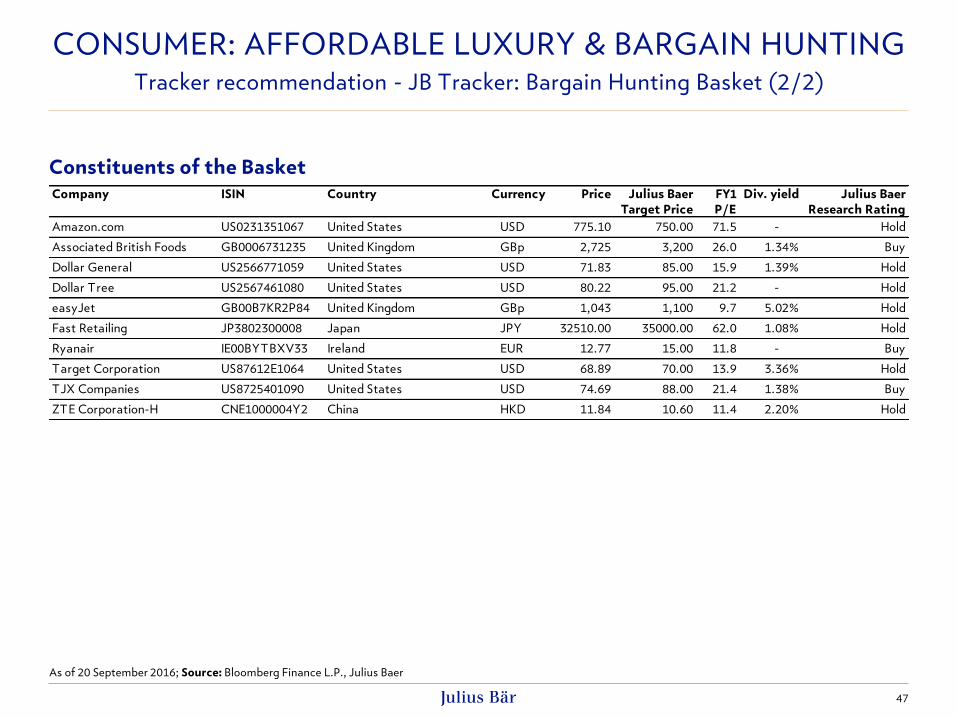
Tracker recommendation - JB Tracker: Bargain Hunting Basket (2/2)
Constituents of the Basket
As of 20 September 2016; Source: Bloomberg Finance L.P., Julius Baer
Company ISIN Country Currency Price Julius Baer
Target Price
FY1
P/E
Div. yield Julius Baer
Research Rating
Amazon.com US0231351067 United States USD 775.10 750.00 71.5 - Hold
Associated British Foods GB0006731235 United Kingdom GBp 2,725 3,200 26.0 1.34% Buy
Dollar General US2566771059 United States USD 71.83 85.00 15.9 1.39% Hold
Dollar Tree US2567461080 United States USD 80.22 95.00 21.2 - Hold
easyJet GB00B7KR2P84 United Kingdom GBp 1,043 1,100 9.7 5.02% Hold
Fast Retailing JP3802300008 Japan JPY 32510.00 35000.00 62.0 1.08% Hold
Ryanair IE00BYTBXV33 Ireland EUR 12.77 15.00 11.8 - Buy
Target Corporation US87612E1064 United States USD 68.89 70.00 13.9 3.36% Hold
TJX Companies US8725401090 United States USD 74.69 88.00 21.4 1.38% Buy
ZTE Corporation-H CNE1000004Y2 China HKD 11.84 10.60 11.4 2.20% Hold
CONSUMER: AFFORDABLE LUXURY & BARGAIN HUNTING
48
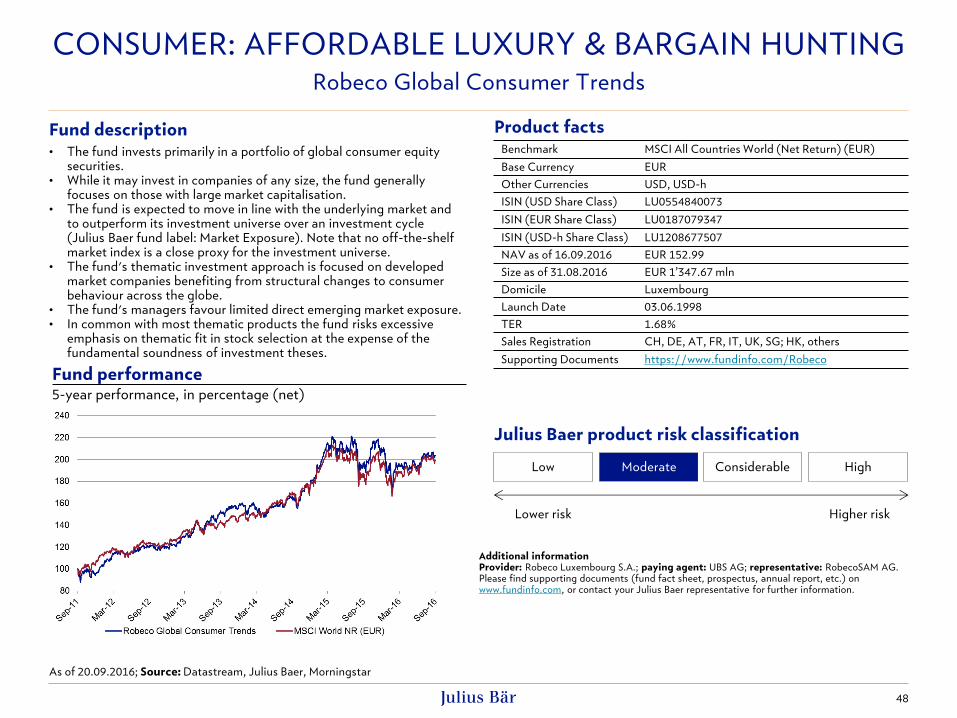
Robeco Global Consumer Trends
Fund description
• The fund invests primarily in a portfolio of global consumer equity securities.
• While it may invest in companies of any size, the fund generally focuses on those with large market capitalisation.
• The fund is expected to move in line with the underlying market and to outperform its investment universe over an investment cycle (Julius Baer fund label: Market Exposure). Note that no off-the-shelf market index is a close proxy for the investment universe.
• The fund's thematic investment approach is focused on developed market companies benefiting from structural changes to consumer behaviour across the globe.
• The fund's managers favour limited direct emerging market exposure. • In common with most thematic products the fund risks excessive
emphasis on thematic fit in stock selection at the expense of the fundamental soundness of investment theses.
Fund performance 5-year performance, in percentage (net)
Low Moderate Considerable High
Lower risk Higher risk
Julius Baer product risk classification
Additional information Provider: Robeco Luxembourg S.A.; paying agent: UBS AG; representative: RobecoSAM AG. Please find supporting documents (fund fact sheet, prospectus, annual report, etc.) on www.fundinfo.com, or contact your Julius Baer representative for further information.
Benchmark MSCI All Countries World (Net Return) (EUR)
Base Currency EUR
Other Currencies USD, USD-h
ISIN (USD Share Class) LU0554840073
ISIN (EUR Share Class) LU0187079347
ISIN (USD-h Share Class) LU1208677507
NAV as of 16.09.2016 EUR 152.99
Size as of 31.08.2016 EUR 1’347.67 mln
Domicile Luxembourg
Launch Date 03.06.1998
TER 1.68%
Sales Registration CH, DE, AT, FR, IT, UK, SG; HK, others
Supporting Documents https://www.fundinfo.com/Robeco
Product facts
As of 20.09.2016; Source: Datastream, Julius Baer, Morningstar
49
Contingent convertible (CoCo) bonds – our preferred investment in bank debt
• Contingent convertible (CoCo) bonds have become one of the fastest-growing segments in
the fixed income asset class over the last few years as Basel III and its accompanying directives
force banks to improve their balance sheets materially.
• This in turn will make them less vulnerable to adverse financial shocks and a safer place to
invest for fixed-income investors.
• With the implementation of the European Bank Recovery and Resolution Directive (BRRD) in
2016, even senior creditors will be bailed-in in case of financial distress of the debt-issuing
bank.
• Despite the banks’ uncomfortable situation in terms of profitability, it therefore makes sense
to invest in CoCo-bonds of fundamentally sound banks, which are systemically important and
have to build up additional capital under the coming TLAC (total loss-absorbing capacity)
regime until 2019. The TLAC regime will make the banks safer, from a fixed-income investor’s
point of view.
• Please note that CoCo’s are highly sophisticated and complicated financial products and
include multiple variables which need to be taken into consideration before investing
(potential loss of capital in case certain conditions are met).
• We have put together a selection of CoCo’s of our analysts’ favourite issuers (see page 52).
FIXED INCOME – QUALITY OF EUROZONE BANKS
Deeply subordinated bonds of solid banks offer value to the risk friendly
50
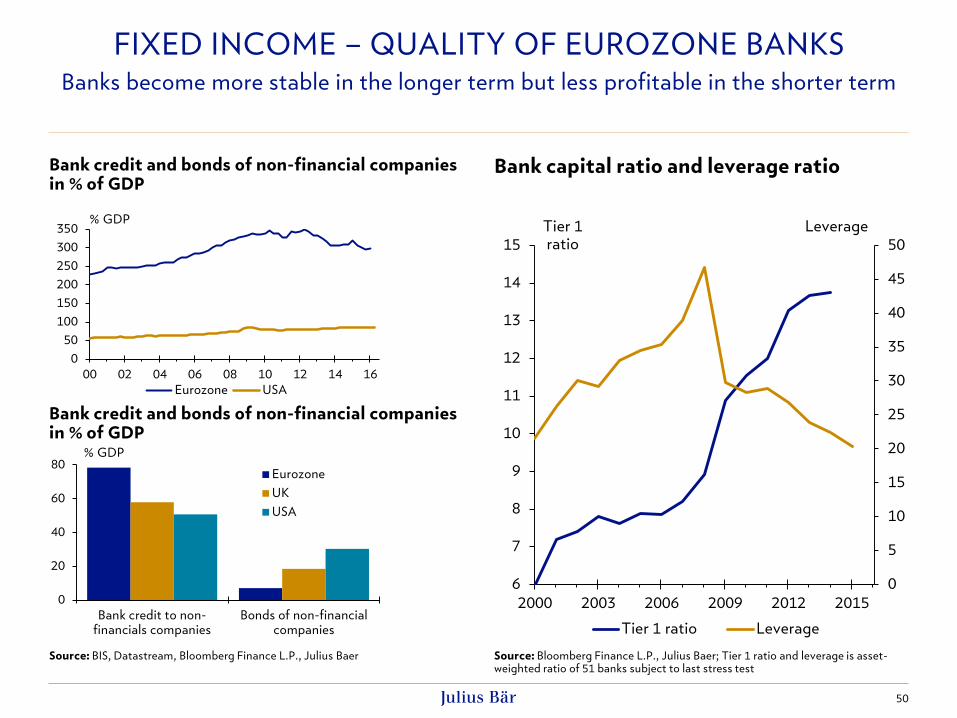
FIXED INCOME – QUALITY OF EUROZONE BANKS Banks become more stable in the longer term but less profitable in the shorter term
Source: BIS, Datastream, Bloomberg Finance L.P., Julius Baer
Source: Bloomberg Finance L.P., Julius Baer; Tier 1 ratio and leverage is asset-weighted ratio of 51 banks subject to last stress test
Bank credit and bonds of non-financial companies in % of GDP
Bank capital ratio and leverage ratio
0
5
10
15
20
25
30
35
40
45
50
6
7
8
9
10
11
12
13
14
15
2000 2003 2006 2009 2012 2015
Leverage Tier 1 ratio
Tier 1 ratio Leverage
0
20
40
60
80
Bank credit to non-financials companies
Bonds of non-financialcompanies
% GDP
Eurozone
UK
USA
Bank credit and bonds of non-financial companies in % of GDP
0
50
100
150
200
250
300
350
00 02 04 06 08 10 12 14 16
% GDP
Eurozone USA

Volume to increase
New issue activity slumped in period of
financial stress in February.
Market is recovering from temporary weakness
and capital intake will resume.
Decent yield
In case of financial stress, regulators can also
induce losses on holders of senior unsecured
bonds which have a very low yield.
It is more attractive to focus on deeply
subordinated bonds of solid banks than on
senior debt of second-tier issuers.
51
FIXED INCOME – QUALITY OF EUROZONE BANKS Deeply subordinated bonds of solid banks offer a better return
than traditional high-yield bonds.
Source: Bank of America Merrill Lynch, Julius Baer; Contingent Convertible (CoCo) bond index inception date 31 Dec 2013
Volume and performance of deeply subordinated bank debt
Yield of financial bonds
40
60
80
100
120
140
160
180
95
100
105
110
115
120
2014 2015 2016
USD bn Total return
CoCo total return index, right
CoCo index volume
0
2
4
6
8
10
2011 2012 2013 2014 2015 2016
%
CoCo index EUR non-investment grade
EUR senior banks
*According to the Product Intervention (Contingent Convertible Instruments and Mutual Society Shares) Instrument 2015, enacted by the U.K. Financial Conduct Authority (“FCA”), this/these product(s) must not be distributed to retail investors domiciled in the European Economic Area (“EEA” – EU, Liechtenstein, Norway and Iceland). Investors who intend to buy this/these product(s) must have an annual income of at least GBP 100,000 (or equivalent) or net assets (excluding property, insurance and other benefits) of at least GBP 250,000 (or equivalent) at their disposal.

52
FIXED INCOME – QUALITY OF EUROZONE BANKS
Deeply subordinated bonds of solid banks offer value to the risk friendly
Source: Bloomberg Finance L.P., Julius Baer, prices as of 20 September .2016
ISIN Issuer Cpn Maturity
First Call
Date Crncy Loss Absorption
Trigger
Level Price YtC
Cpn Reset
Date
Reset
Spread
Rep.
CET1
JB Research
Issuer Rating Min. Inv.
Tier2 Bonds
CH0236733827 UBS AG 4.75 12.02.2026 12.02.2021 EUR Permanent Write Down 5 107.25 2.87 12.02.2021 340 14.5 Buy/Quality 100,000
CH0244100266 UBS AG 5.125 15.05.2024 USD Permanent Write Down 5 103.75 14.5 Buy/Quality 200,000
Additional T1 Bonds
EUR
XS1033661866 BANCO BILBAO VIZCAYA ARG 7 PERPETUAL 19.02.2019 EUR Equity Conversion 5.125 95.61 8.85 19.02.2019 616 10.3 Buy/Opportunistic 200,000
XS1043535092 BANCO SANTANDER SA 6.25 PERPETUAL 12.03.2019 EUR Equity Conversion 5.125 90.82 10.33 12.03.2019 541 10.05 Buy/Quality 100,000
XS1190663952 BANCO BILBAO VIZCAYA ARG 6.75 PERPETUAL 18.02.2020 EUR Equity Conversion 5.125 94.29 8.56 18.02.2020 660 10.3 Buy/Opportunistic 200,000
XS0867620725 SOCIETE GENERALE 6.75 PERPETUAL 07.04.2021 EUR Temporary Write Down 5.125 99.28 6.84 07.04.2021 554 10.9 Buy/Opportunistic 100,000
XS1394911496 BANCO BILBAO VIZCAYA ARG 8.875 PERPETUAL 14.04.2021 EUR Equity Conversion 5.125 105.95 7.23 14.04.2021 918 10.3 Buy/Opportunistic 200,000
XS1055037177 CREDIT AGRICOLE SA 6.5 PERPETUAL 23.06.2021 EUR Temporary Write Down 5.125 100.29 6.34 23.06.2021 512 10.7 Buy/Opportunistic 100,000
XS1107291541 BANCO SANTANDER SA 6.25 PERPETUAL 11.09.2021 EUR Equity Conversion 5.125 90.88 8.41 11.09.2021 564 10.05 Buy/Quality 100,000
CH0271428309 UBS GROUP AG 5.75 PERPETUAL 19.02.2022 EUR Permanent Write Down 5.125 103.72 4.86 19.02.2022 529 14.5 Buy/Quality 200,000
XS1247508903 BNP PARIBAS 6.125 PERPETUAL 17.06.2022 EUR Temporary Write Down 5.125 102.27 5.59 17.06.2022 523 10.9 Buy/Quality 200,000
XS1111123987 HSBC HOLDINGS PLC 5.25 PERPETUAL 16.09.2022 EUR Equity Conversion 7 98.34 5.50 16.09.2022 438 11.9 Buy/Opportunistic 200,000
XS1298431104 HSBC HOLDINGS PLC 6 PERPETUAL 29.09.2023 EUR Equity Conversion 7 104.43 5.17 29.09.2023 534 11.9 Buy/Opportunistic 200,000
GBP
XS1055037920 CREDIT AGRICOLE SA 7.5 PERPETUAL 23.06.2026 GBP Temporary Write Down 5.125 99.64 7.47 23.06.2026 454 10.7 Buy/Opportunistic 100,000
USD
XS0926832907 BANCO BILBAO VIZCAYA ARG 9 PERPETUAL 09.05.2018 USD Equity Conversion 5.125 103.50 6.24 09.05.2018 826 10.3 Buy/Opportunistic 200,000
XS0867614595 SOCIETE GENERALE 8.25 PERPETUAL 29.11.2018 USD Temporary Write Down 5.125 102.00 6.99 29.11.2018 639 10.9 Buy/Opportunistic 200,000
XS1066553329 BANCO SANTANDER SA 6.375 PERPETUAL 19.05.2019 USD Equity Conversion 5.125 90.50 10.17 19.05.2019 479 10.05 Buy/Quality 200,000
USF22797YK86 CREDIT AGRICOLE SA 6.625 PERPETUAL 23.09.2019 USD Temporary Write Down 5.125 96.00 7.85 23.09.2019 470 10.7 Buy/Opportunistic 200,000
US404280AR04 HSBC HOLDINGS PLC 5.625 PERPETUAL 17.01.2020 USD Equity Conversion 7 99.13 5.75 17.01.2020 363 11.9 Buy/Opportunistic 200,000
USF8586CXG25 SOCIETE GENERALE 6 PERPETUAL 27.01.2020 USD Temporary Write Down 5.125 90.50 9.09 27.01.2020 407 10.9 Buy/Opportunistic 200,000
CH0271428317 UBS GROUP AG 7.125 PERPETUAL 19.02.2020 USD Permanent Write Down 7 101.88 6.31 19.02.2020 546 14.5 Buy/Quality 200,000
US456837AE31 ING GROEP NV 6 PERPETUAL 16.04.2020 USD Equity Conversion 7 97.75 6.48 16.04.2020 445 12.7 Buy/Opportunistic 200,000
USF1R15XK441 BNP PARIBAS 7.625 PERPETUAL 30.03.2021 USD Temporary Write Down 5.125 103.00 6.65 30.03.2021 631 10.9 Buy/Quality 200,000
US404280BC26 HSBC HOLDINGS PLC 6.875 PERPETUAL 01.06.2021 USD Equity Conversion 7 104.50 5.67 01.06.2021 551 11.9 Buy/Opportunistic 200,000
CH0331455318 UBS GROUP AG 7.125 PERPETUAL 10.08.2021 USD Permanent Write Down 7 102.00 6.54 10.08.2021 588 14.5 Buy/Quality 200,000
USF8586CRW49 SOCIETE GENERALE 7.875 PERPETUAL 18.12.2023 USD Temporary Write Down 5.125 97.75 8.15 18.12.2023 498 10.9 Buy/Opportunistic 200,000
USF22797RT78 CREDIT AGRICOLE SA 7.875 PERPETUAL 23.01.2024 USD Temporary Write Down 5.125 101.50 7.46 23.12.2023 490 10.7 Buy/Opportunistic 200,000
US404280AS86 HSBC HOLDINGS PLC 6.375 PERPETUAL 17.09.2024 USD Equity Conversion 7 98.25 6.58 17.09.2024 371 11.9 Buy/Opportunistic 200,000
US404280AT69 HSBC HOLDINGS PLC 6.375 PERPETUAL 30.03.2025 USD Equity Conversion 7 99.00 6.45 30.03.2025 437 11.9 Buy/Opportunistic 200,000
US456837AF06 ING GROEP NV 6.5 PERPETUAL 16.04.2025 USD Equity Conversion 7 97.25 6.85 16.04.2025 445 12.7 Buy/Opportunistic 200,000
CH0286864027 UBS GROUP AG 6.875 PERPETUAL 07.08.2025 USD Permanent Write Down 7 98.00 7.07 07.08.2025 459 14.5 Buy/Quality 200,000
USF1R15XK367 BNP PARIBAS 7.375 PERPETUAL 19.08.2025 USD Temporary Write Down 5.125 100.25 7.26 19.08.2025 515 10.9 Buy/Quality 200,000
USF43628B413 SOCIETE GENERALE 8 PERPETUAL 29.09.2025 USD Temporary Write Down 5.125 100.25 7.84 29.09.2025 587 10.9 Buy/Opportunistic 200,000
CH0271428333 UBS GROUP AG 7 PERPETUAL 19.02.2025 USD Permanent Write Down 5.125 106.13 5.97 19.02.2025 487 14.5 Buy/Quality 200,000
USF2R125CD54 CREDIT AGRICOLE SA 8.125 PERPETUAL 23.12.2025 USD Temporary Write Down 5.125 106.38 7.11 23.12.2025 619 10.7 Buy/Opportunistic 200,000

53
US high yield bonds – investors are compensated well for the risk
• The US high yield segment has been one of the best performing assets in 2016, returning c.
14.50% in USD year-to-date according to the Bank of America Merrill Lynch US High Yield
Index.
• Recovering commodity prices and reassuring data in regard to the overall economic
environment in the US have helped the segment to perform well over the past months.
• The segment has been quite resilient and the result of the Brexit referendum has led only to
limited spread widening, keeping investors well compensated for a potential surge of defaults.
• The rise of defaults in the US this year has been boosted by lower energy and industrial metal
prices but this effect should peter out over the coming months.
• Although leverage in the segment is high, we believe that it is manageable given our
expectations for acceleration of US nominal growth and higher revenues in the segment.
• Although spreads have tightened significantly over the past months, we still consider them
attractive – historically, spreads have crossed the 6% handle to the upside only prior to and
during recessions in the US -> a US recession is not our baseline scenario.
• Consequently, we consider the average spread of about 5% for US high-yield bonds over US
Treasuries as attractive. Our research department believes that spreads have the potential to
further tighten considerably.
FIXED INCOME – US HIGH YIELD: STILL ATTRACTIVE
USD non-investment grade bonds still offer decent income in low-yield world
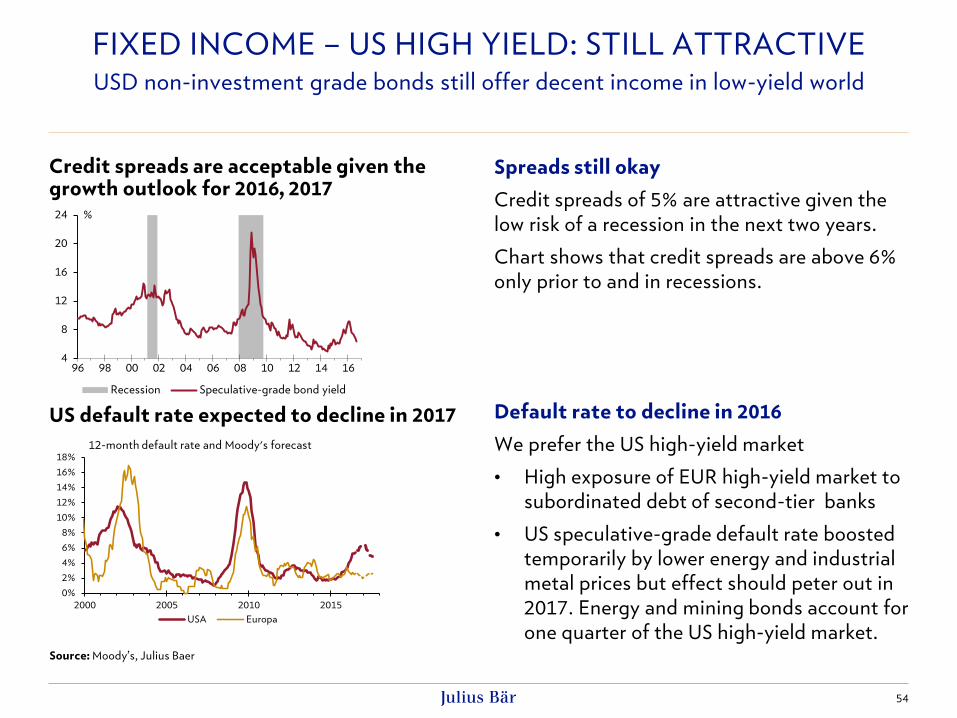
Spreads still okay
Credit spreads of 5% are attractive given the
low risk of a recession in the next two years.
Chart shows that credit spreads are above 6%
only prior to and in recessions.
Default rate to decline in 2016
We prefer the US high-yield market
• High exposure of EUR high-yield market to
subordinated debt of second-tier banks
• US speculative-grade default rate boosted
temporarily by lower energy and industrial
metal prices but effect should peter out in
2017. Energy and mining bonds account for
one quarter of the US high-yield market.
54
FIXED INCOME – US HIGH YIELD: STILL ATTRACTIVE USD non-investment grade bonds still offer decent income in low-yield world
Source: Moody’s, Julius Baer
Credit spreads are acceptable given the growth outlook for 2016, 2017
US default rate expected to decline in 2017
4
8
12
16
20
24
96 98 00 02 04 06 08 10 12 14 16
Recession Speculative-grade bond yield
%
0%
2%
4%
6%
8%
10%
12%
14%
16%
18%
2000 2005 2010 2015
12-month default rate and Moody's forecast
USA Europa

55
FIXED INCOME – US HIGH YIELD: STILL ATTRACTIVE Nomura US High Yield Bond Fund
Fund highlights
• Nomura (Corporate and Asset Management) believes that a credit research driven process and a solid team based approach is the best way to generate alpha in high yield.
• The core of this strategy is the so called "Strong Horse" investment philosophy. “Strong Horse” companies can carry their debt loads through the economic cycle, generating strong, sustainable cash flows that enable them to de-lever their balance sheets and improve their ratings.
• Historically, fund management’s value added has come mainly from the issuer selection and the avoidance of defaults.
• Derivatives are not use at all, the fund steers duration and beta exposure only through cash bonds.
Additional information Provider: Nomura Asset Management U.K. Limited; paying agent: Nomura Bank (Schweiz) AG; representative: Nomura Bank (Schweiz) AG. Please find supporting documents (fund fact sheet, prospectus, annual report, etc.) on www.fundinfo.com, or contact your Julius Baer representative for further information.
Fund performance
5-year performance, in percentage (net)
Julius Baer product risk classification
Low Moderate Considerable High
Lower risk Higher risk
Benchmark BofAML US HY Master II Constant TR USD
Base Currency USD
Other Currencies EUR-h
ISIN (EUR-h Share Class) IE00B78CQ196
ISIN (USD Share Class) IE00B3RW7J78
NAV as of 19.09.2016 USD 147.47
Size as of 31.08.2016 USD 3’102.44 mln
Domicile Ireland
Launch Date 14.11.2011
TER 1.11%
Sales Registrations CH, UK, DE, IT, SG, others
Supporting documents http://www.fundinfo.com/Nomura US HY
Product facts
As of 20.09.2016; Source: Datastream, Julius Baer, Morningstar
56
EM market bonds – we remain positive but less than before
• We maintain our positive view on emerging market (EM) hard currency bonds as we still prefer
credit to rate risk in the fixed income space. However, our research department has recently
downgraded the EM local currency debt segment to neutral, following its outstanding
performance this year.
• Fundamentally, we note concrete improvements at the macro and corporate levels, with data
this year showing some improvements in current accounts, growth expectations and slightly
stronger credit metrics, particularly in terms of corporate leverage.
• However, valuations have moved higher very fast and often ahead of fundamentals, reducing
the attractiveness of many bonds.
• One of the main factors supporting EM bonds currently is the search-for-yield behaviour of
fixed income investors. Record inflows over the past months prove the relative attractiveness
of the segment. Within this scenario, we still maintain an overweight stance on EM hard
currency debt but encourage investors to be more selective.
• From a risk-reward perspective, we still believe opportunities exist in the energy sector and in
BB-rated issuers from Latin America and Eastern Europe.
FIXED INCOME – SEARCH FOR YIELD SUPPORTS EM
Emerging market (EM) bonds – risk-reward now less attractive
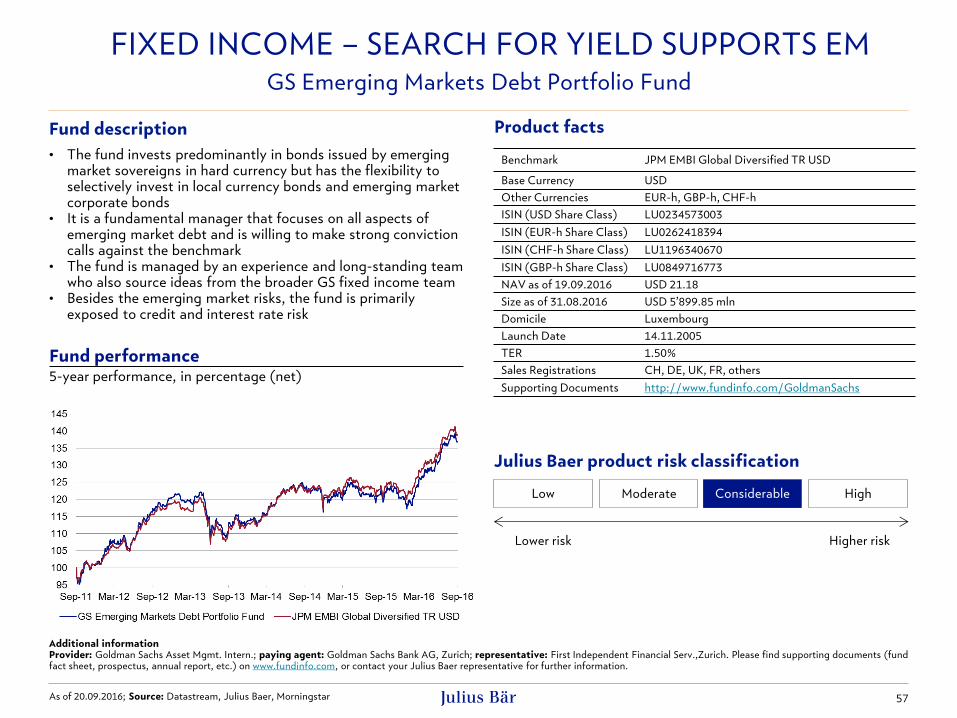
57
Fund description
• The fund invests predominantly in bonds issued by emerging market sovereigns in hard currency but has the flexibility to selectively invest in local currency bonds and emerging market corporate bonds
• It is a fundamental manager that focuses on all aspects of emerging market debt and is willing to make strong conviction calls against the benchmark
• The fund is managed by an experience and long-standing team who also source ideas from the broader GS fixed income team
• Besides the emerging market risks, the fund is primarily exposed to credit and interest rate risk
Fund performance 5-year performance, in percentage (net)
Benchmark JPM EMBI Global Diversified TR USD
Base Currency USD
Other Currencies EUR-h, GBP-h, CHF-h
ISIN (USD Share Class) LU0234573003
ISIN (EUR-h Share Class) LU0262418394
ISIN (CHF-h Share Class) LU1196340670
ISIN (GBP-h Share Class) LU0849716773
NAV as of 19.09.2016 USD 21.18
Size as of 31.08.2016 USD 5’899.85 mln
Domicile Luxembourg
Launch Date 14.11.2005
TER 1.50%
Sales Registrations CH, DE, UK, FR, others
Supporting Documents http://www.fundinfo.com/GoldmanSachs
FIXED INCOME – SEARCH FOR YIELD SUPPORTS EM GS Emerging Markets Debt Portfolio Fund
Additional information Provider: Goldman Sachs Asset Mgmt. Intern.; paying agent: Goldman Sachs Bank AG, Zurich; representative: First Independent Financial Serv.,Zurich. Please find supporting documents (fund fact sheet, prospectus, annual report, etc.) on www.fundinfo.com, or contact your Julius Baer representative for further information.
Product facts
Julius Baer product risk classification
Low Moderate Considerable High
Lower risk Higher risk
As of 20.09.2016; Source: Datastream, Julius Baer, Morningstar
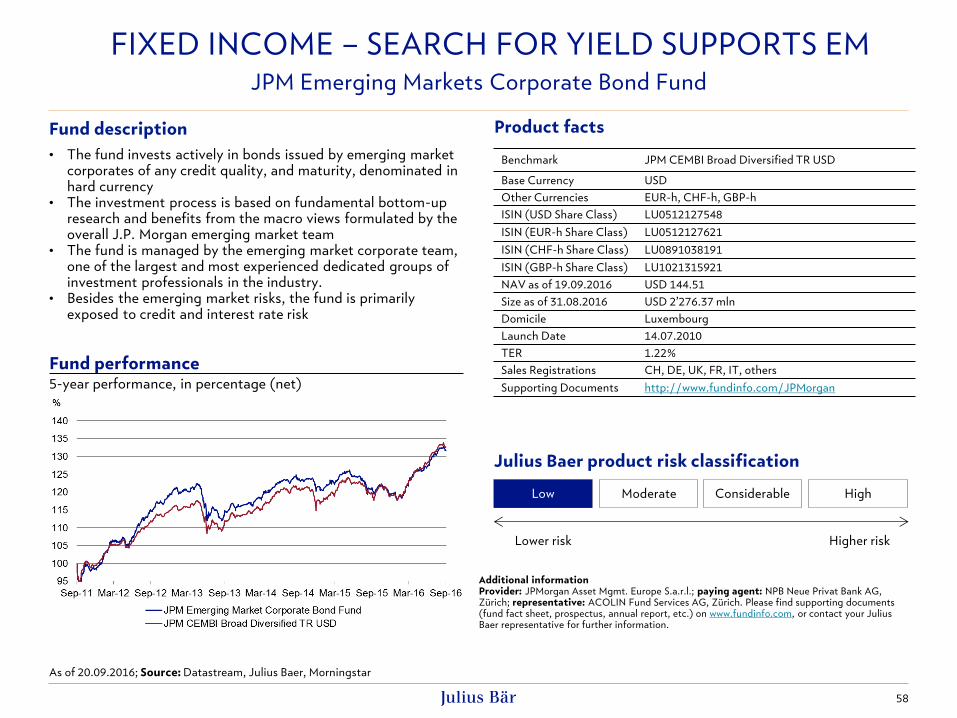
58
Fund description
• The fund invests actively in bonds issued by emerging market corporates of any credit quality, and maturity, denominated in hard currency
• The investment process is based on fundamental bottom-up research and benefits from the macro views formulated by the overall J.P. Morgan emerging market team
• The fund is managed by the emerging market corporate team, one of the largest and most experienced dedicated groups of investment professionals in the industry.
• Besides the emerging market risks, the fund is primarily exposed to credit and interest rate risk
Fund performance 5-year performance, in percentage (net)
Benchmark JPM CEMBI Broad Diversified TR USD
Base Currency USD
Other Currencies EUR-h, CHF-h, GBP-h
ISIN (USD Share Class) LU0512127548
ISIN (EUR-h Share Class) LU0512127621
ISIN (CHF-h Share Class) LU0891038191
ISIN (GBP-h Share Class) LU1021315921
NAV as of 19.09.2016 USD 144.51
Size as of 31.08.2016 USD 2’276.37 mln
Domicile Luxembourg
Launch Date 14.07.2010
TER 1.22%
Sales Registrations CH, DE, UK, FR, IT, others
Supporting Documents http://www.fundinfo.com/JPMorgan
FIXED INCOME – SEARCH FOR YIELD SUPPORTS EM JPM Emerging Markets Corporate Bond Fund
Additional information Provider: JPMorgan Asset Mgmt. Europe S.a.r.l.; paying agent: NPB Neue Privat Bank AG, Zürich; representative: ACOLIN Fund Services AG, Zürich. Please find supporting documents (fund fact sheet, prospectus, annual report, etc.) on www.fundinfo.com, or contact your Julius Baer representative for further information.
Product facts
Julius Baer product risk classification
Low Moderate Considerable High
Lower risk Higher risk
As of 20.09.2016; Source: Datastream, Julius Baer, Morningstar

59
Improving data and rise of political uncertainty are positive for the USD
• US economic data is improving despite an already strong currency, justifying more currency
strength.
• The US Federal Reserve (Fed) has begun to acknowledge that better economic data allow
further rate hikes. Going forward, even more aggressive rate-hiking expectations will support
the US dollar.
• The increase of political uncertainty ahead of landmark elections is positive for the USD due to
the currency’s safe-heaven’s characteristics.
• Both candidates for the US presidency hold out the prospect of more expansionary fiscal
policy. In contrast to stimulating monetary policy, growth-supportive fiscal policy tends to be
positive for a currency.
• There is growing ‘intellectual’ consensus that expansionary fiscal policy is able to foster
structural reforms, hence increasing the economies’ growth potential in addition to the short-
lived demand push.
• By increasing the potential growth rate of the US economy via federal spending, the Federal
Reserve (Fed) will find it easier to normalise monetary policy, further supporting the US dollar.
CURRENCIES – POSITIVE ON THE US DOLLAR
The US dollar interest-rate advantage is expected to increase
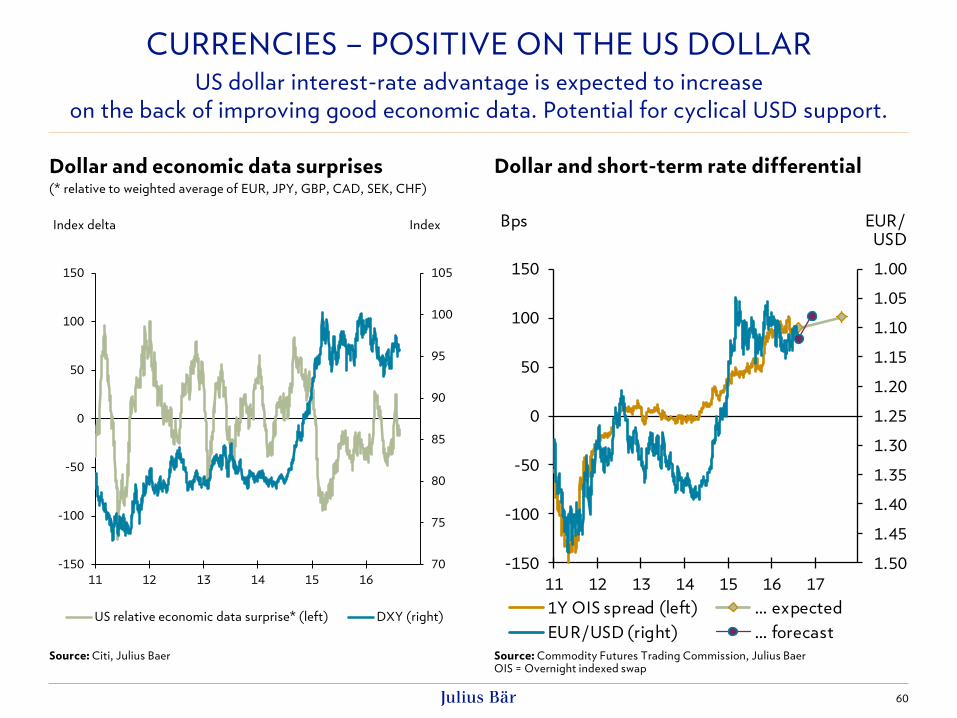
CURRENCIES – POSITIVE ON THE US DOLLAR US dollar interest-rate advantage is expected to increase
on the back of improving good economic data. Potential for cyclical USD support.
Source: Citi, Julius Baer Source: Commodity Futures Trading Commission, Julius Baer OIS = Overnight indexed swap
Dollar and economic data surprises (* relative to weighted average of EUR, JPY, GBP, CAD, SEK, CHF)
Dollar and short-term rate differential
60
1.00
1.05
1.10
1.15
1.20
1.25
1.30
1.35
1.40
1.45
1.50
11 12 13 14 15 16 17
-150
-100
-50
0
50
100
150
EUR/ USD
Bps
1Y OIS spread (left) … expected
EUR/USD (right) … forecast
70
75
80
85
90
95
100
105
11 12 13 14 15 16
-150
-100
-50
0
50
100
150
Index Index delta
US relative economic data surprise* (left) DXY (right)

CURRENCIES – POSITIVE ON THE US DOLLAR The rise in policy uncertainty, which is expected to accelerate ahead of the US
presidential elections, is driving Treasury yields lower and the US dollar higher.
Source: Economic Policy Uncertainty, Datastream, Julius Baer Source: Economic Policy Uncertainty; Datastream, Julius Baer DXY = US dollar index
Policy uncertainty and Treasury yields (* inverted; weighted average of G7 plus China, India and Spain)
Policy uncertainty and US dollar (* weighted average of G7 plus China, India and Spain)
61
60
62
64
66
68
70
72
74
76
78
95 97 99 01 03 05 07 09 11 13 15 17
4.0
4.2
4.4
4.6
4.8
5.0
5.2
5.4
5.6
IndexIndex in ln
Global policy uncertainty* (left scale)
DXY (right scale)
1
2
3
4
5
6
7
8
95 97 99 01 03 05 07 09 11 13 15 17
4.0
4.2
4.4
4.6
4.8
5.0
5.2
5.4
5.6
% p.a.Index in ln
Global policy uncertainty* (left scale)
10y Treasuries (right scale)
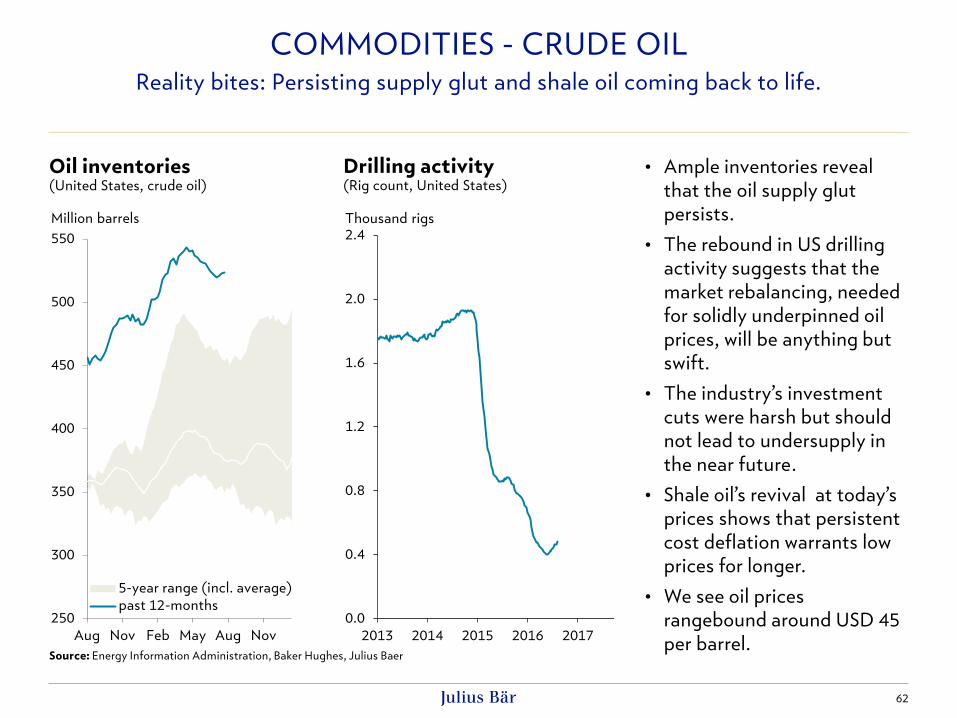
62
COMMODITIES - CRUDE OIL Reality bites: Persisting supply glut and shale oil coming back to life.
Source: Energy Information Administration, Baker Hughes, Julius Baer
Oil inventories (United States, crude oil)
Drilling activity (Rig count, United States)
• Ample inventories reveal
that the oil supply glut
persists.
• The rebound in US drilling
activity suggests that the
market rebalancing, needed
for solidly underpinned oil
prices, will be anything but
swift.
• The industry’s investment
cuts were harsh but should
not lead to undersupply in
the near future.
• Shale oil’s revival at today’s
prices shows that persistent
cost deflation warrants low
prices for longer.
• We see oil prices
rangebound around USD 45
per barrel.
250
300
350
400
450
500
550
Aug Nov Feb May Aug Nov
5-year range (incl. average)
past 12-months
Million barrels
0.0
0.4
0.8
1.2
1.6
2.0
2.4
2013 2014 2015 2016 2017
Thousand rigs

63
COMMODITIES - GOLD Record investor buying and bullish sentiment pushed prices into thin air.
Source: Bloomberg Finance L.P., Julius Baer
Investment demand (Physical product flows, global)
Futures market positions (Non-commercial net-length)
• Record gold investment
demand made headlines.
Flows into gold products
topped those during the
financial crisis.
• Financial market wobbles,
investment demand and
bullish sentiment fuelled the
rally.
• Sentiment mirrored in futures
positions remains at very
bullish levels warranting
some caution.
• Gold’s insurance benefits
come at a price not least
because growth risks
decrease and inflation
remains distant.
• We see gold prices trending
towards USD 1,300 per ounce
before year-end.
-10
-8
-6
-4
-2
0
2
4
6
8
10
2009 2011 2013 2015
Monthly Quarterly
Tonnes per day
-10
0
10
20
30
40
50
60
1000
1050
1100
1150
1200
1250
1300
1350
1400
1450
Nov 13 Nov 14 Nov 15 Nov 16
Gold price Net-length (r.S.)
% of open interestUSD per ounce

64
The risk-on behaviour on financial markets might be put to the test
• Volatility on equity markets has picked up recently but, overall, is still on relatively low levels.
This can be interpreted as investors being (too) complacent with respect to risk going
forward.
• While the economic risks should see a further decline in the months ahead, the same cannot
be said about politics.
• Apart from the ‘traditional’ political hotspots, we believe the real landmark events will likely be
the vote on the constitutional referendum in Italy in November/December and of course the
US presidential election in early November. Another important event on the agenda is the
Basque parliamentary election in November.
• All of those events hold the chance to derail financial markets in the coming months.
• Consequently, investors are well advised to think about locking-in performance or hedge
against potential disruptions later this year, simply because the insurance premium is cheap.
• Investors might deflate portfolio risk by selling pure equity exposure for long/short equity
funds.
STRATEGY – RISK MITIGATION
Plenty of (political) risks remain with potential to derail markets
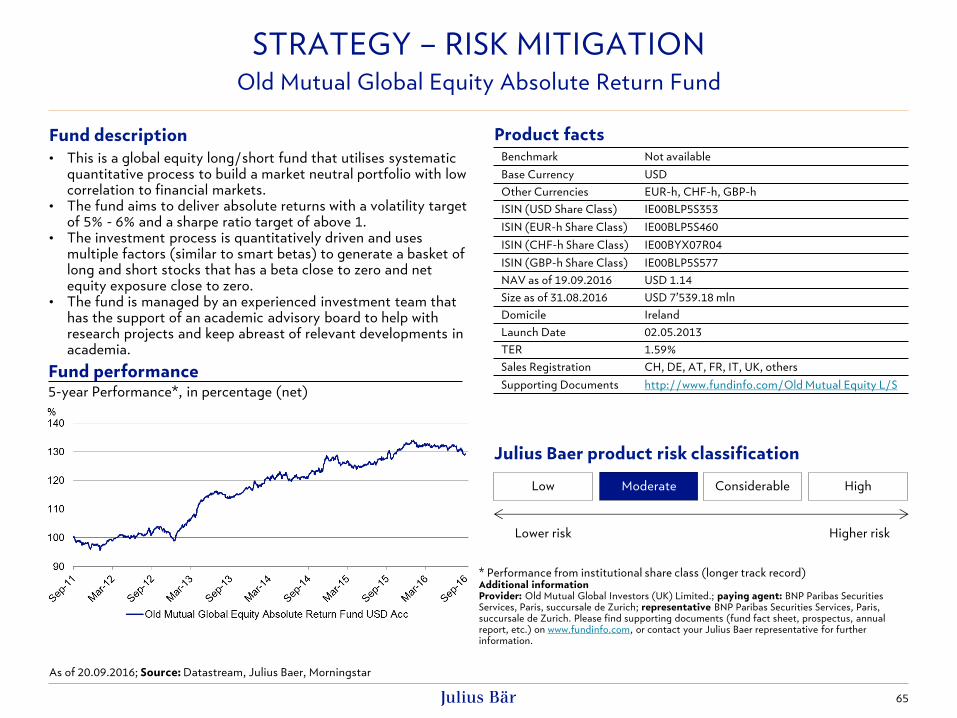
65
STRATEGY – RISK MITIGATION Old Mutual Global Equity Absolute Return Fund
Fund description
• This is a global equity long/short fund that utilises systematic quantitative process to build a market neutral portfolio with low correlation to financial markets.
• The fund aims to deliver absolute returns with a volatility target of 5% - 6% and a sharpe ratio target of above 1.
• The investment process is quantitatively driven and uses multiple factors (similar to smart betas) to generate a basket of long and short stocks that has a beta close to zero and net equity exposure close to zero.
• The fund is managed by an experienced investment team that has the support of an academic advisory board to help with research projects and keep abreast of relevant developments in academia.
Fund performance 5-year Performance*, in percentage (net)
* Performance from institutional share class (longer track record) Additional information Provider: Old Mutual Global Investors (UK) Limited.; paying agent: BNP Paribas Securities Services, Paris, succursale de Zurich; representative BNP Paribas Securities Services, Paris, succursale de Zurich. Please find supporting documents (fund fact sheet, prospectus, annual report, etc.) on www.fundinfo.com, or contact your Julius Baer representative for further information.
Benchmark Not available
Base Currency USD
Other Currencies EUR-h, CHF-h, GBP-h
ISIN (USD Share Class) IE00BLP5S353
ISIN (EUR-h Share Class) IE00BLP5S460
ISIN (CHF-h Share Class) IE00BYX07R04
ISIN (GBP-h Share Class) IE00BLP5S577
NAV as of 19.09.2016 USD 1.14
Size as of 31.08.2016 USD 7’539.18 mln
Domicile Ireland
Launch Date 02.05.2013
TER 1.59%
Sales Registration CH, DE, AT, FR, IT, UK, others
Supporting Documents http://www.fundinfo.com/Old Mutual Equity L/S
Product facts
Low Moderate Considerable High
Lower risk Higher risk
Julius Baer product risk classification
As of 20.09.2016; Source: Datastream, Julius Baer, Morningstar
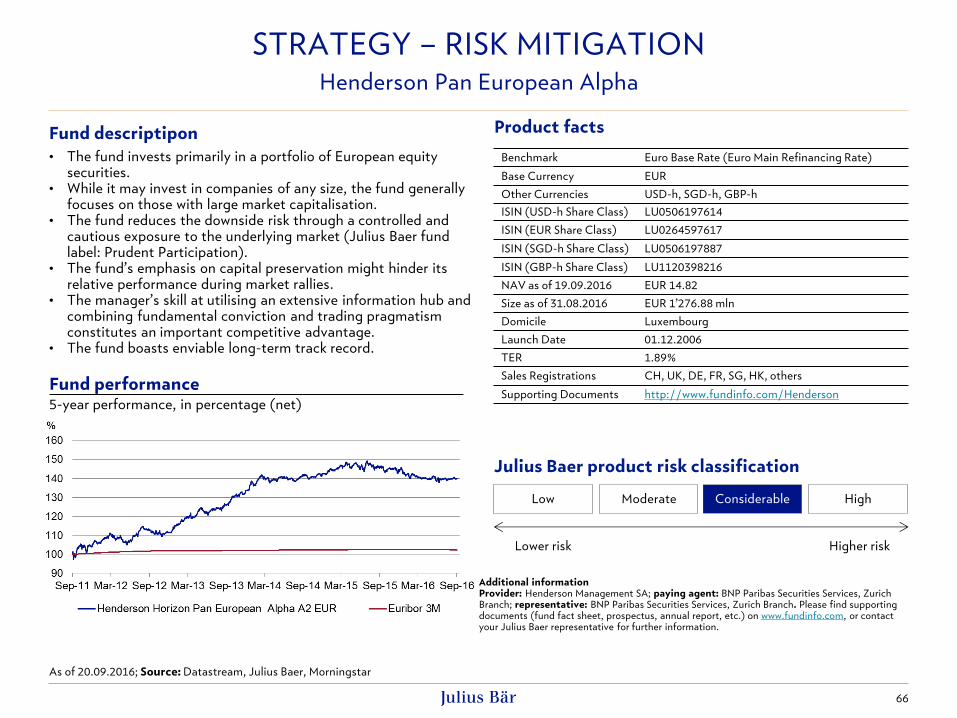
STRATEGY – RISK MITIGATION
66
Henderson Pan European Alpha
Fund descriptipon
• The fund invests primarily in a portfolio of European equity securities.
• While it may invest in companies of any size, the fund generally focuses on those with large market capitalisation.
• The fund reduces the downside risk through a controlled and cautious exposure to the underlying market (Julius Baer fund label: Prudent Participation).
• The fund’s emphasis on capital preservation might hinder its relative performance during market rallies.
• The manager’s skill at utilising an extensive information hub and combining fundamental conviction and trading pragmatism constitutes an important competitive advantage.
• The fund boasts enviable long-term track record.
Low Moderate Considerable High
Lower risk Higher risk
Julius Baer product risk classification
Fund performance 5-year performance, in percentage (net)
Benchmark Euro Base Rate (Euro Main Refinancing Rate)
Base Currency EUR
Other Currencies USD-h, SGD-h, GBP-h
ISIN (USD-h Share Class) LU0506197614
ISIN (EUR Share Class) LU0264597617
ISIN (SGD-h Share Class) LU0506197887
ISIN (GBP-h Share Class) LU1120398216
NAV as of 19.09.2016 EUR 14.82
Size as of 31.08.2016 EUR 1’276.88 mln
Domicile Luxembourg
Launch Date 01.12.2006
TER 1.89%
Sales Registrations CH, UK, DE, FR, SG, HK, others
Supporting Documents http://www.fundinfo.com/Henderson
Product facts
As of 20.09.2016; Source: Datastream, Julius Baer, Morningstar
Additional information Provider: Henderson Management SA; paying agent: BNP Paribas Securities Services, Zurich Branch; representative: BNP Paribas Securities Services, Zurich Branch. Please find supporting documents (fund fact sheet, prospectus, annual report, etc.) on www.fundinfo.com, or contact your Julius Baer representative for further information.
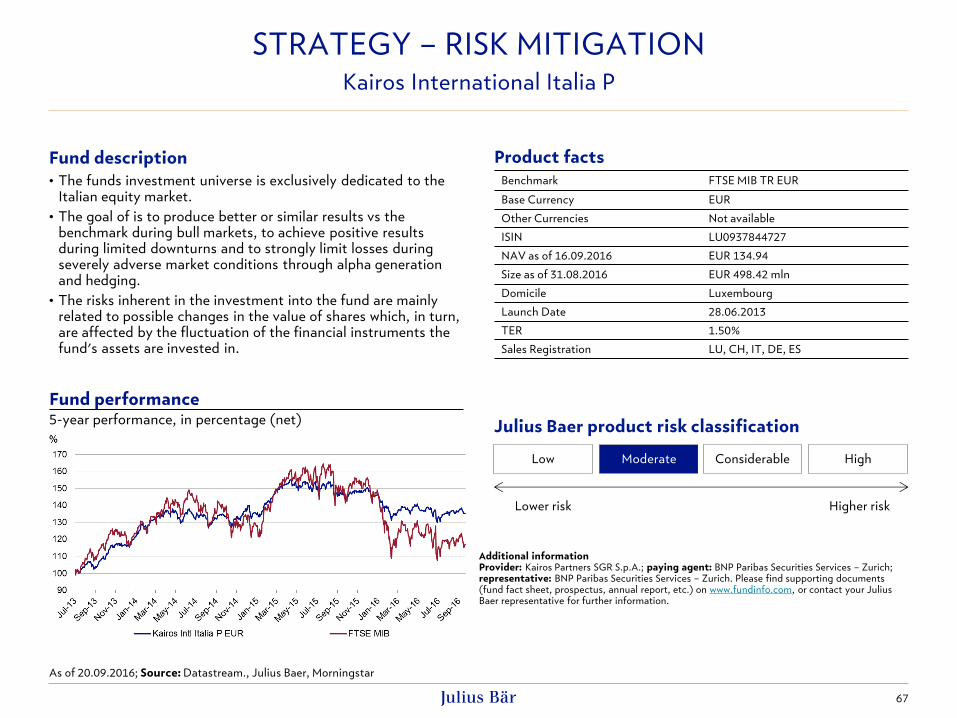
67
STRATEGY – RISK MITIGATION Kairos International Italia P
Fund description
• The funds investment universe is exclusively dedicated to the Italian equity market.
• The goal of is to produce better or similar results vs the benchmark during bull markets, to achieve positive results during limited downturns and to strongly limit losses during severely adverse market conditions through alpha generation and hedging.
• The risks inherent in the investment into the fund are mainly related to possible changes in the value of shares which, in turn, are affected by the fluctuation of the financial instruments the fund's assets are invested in.
Fund performance 5-year performance, in percentage (net)
Benchmark FTSE MIB TR EUR
Base Currency EUR
Other Currencies Not available
ISIN LU0937844727
NAV as of 16.09.2016 EUR 134.94
Size as of 31.08.2016 EUR 498.42 mln
Domicile Luxembourg
Launch Date 28.06.2013
TER 1.50%
Sales Registration LU, CH, IT, DE, ES
Product facts
As of 20.09.2016; Source: Datastream., Julius Baer, Morningstar
Low Moderate Considerable High
Lower risk Higher risk
Julius Baer product risk classification
Additional information Provider: Kairos Partners SGR S.p.A.; paying agent: BNP Paribas Securities Services – Zurich; representative: BNP Paribas Securities Services – Zurich. Please find supporting documents (fund fact sheet, prospectus, annual report, etc.) on www.fundinfo.com, or contact your Julius Baer representative for further information.
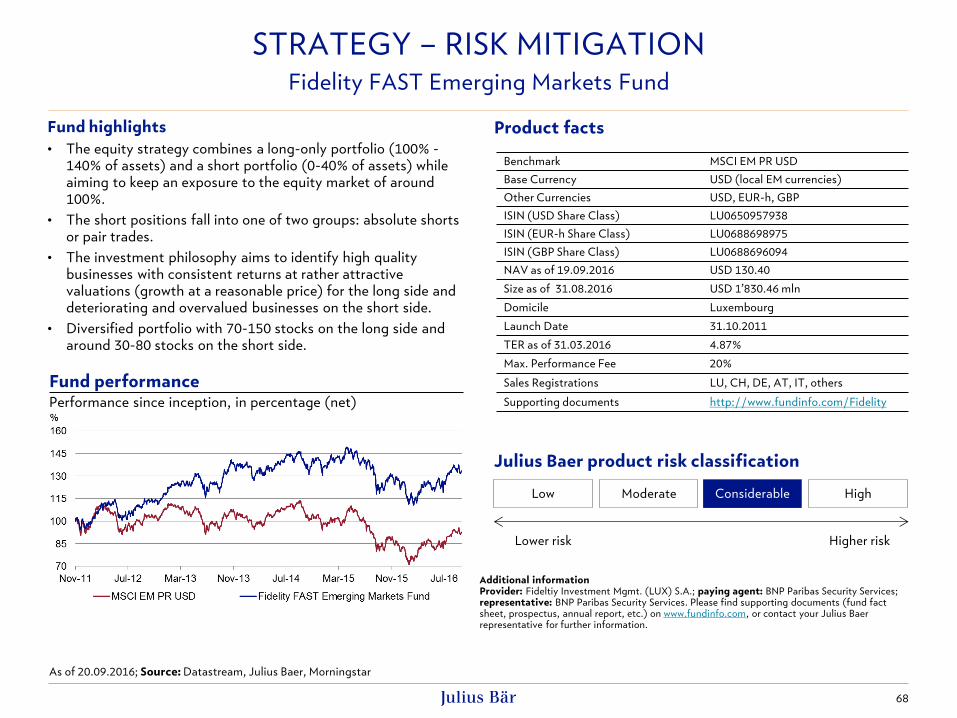
68
STRATEGY – RISK MITIGATION Fidelity FAST Emerging Markets Fund
Fund performance Performance since inception, in percentage (net)
Product facts
Additional information Provider: Fideltiy Investment Mgmt. (LUX) S.A.; paying agent: BNP Paribas Security Services; representative: BNP Paribas Security Services. Please find supporting documents (fund fact sheet, prospectus, annual report, etc.) on www.fundinfo.com, or contact your Julius Baer representative for further information.
Fund highlights
• The equity strategy combines a long-only portfolio (100% -
140% of assets) and a short portfolio (0-40% of assets) while
aiming to keep an exposure to the equity market of around
100%.
• The short positions fall into one of two groups: absolute shorts
or pair trades.
• The investment philosophy aims to identify high quality
businesses with consistent returns at rather attractive
valuations (growth at a reasonable price) for the long side and
deteriorating and overvalued businesses on the short side.
• Diversified portfolio with 70-150 stocks on the long side and
around 30-80 stocks on the short side.
Benchmark MSCI EM PR USD
Base Currency USD (local EM currencies)
Other Currencies USD, EUR-h, GBP
ISIN (USD Share Class) LU0650957938
ISIN (EUR-h Share Class) LU0688698975
ISIN (GBP Share Class) LU0688696094
NAV as of 19.09.2016 USD 130.40
Size as of 31.08.2016 USD 1’830.46 mln
Domicile Luxembourg
Launch Date 31.10.2011
TER as of 31.03.2016 4.87%
Max. Performance Fee 20%
Sales Registrations LU, CH, DE, AT, IT, others
Supporting documents http://www.fundinfo.com/Fidelity
Low Moderate Considerable High
Lower risk Higher risk
Julius Baer product risk classification
As of 20.09.2016; Source: Datastream, Julius Baer, Morningstar
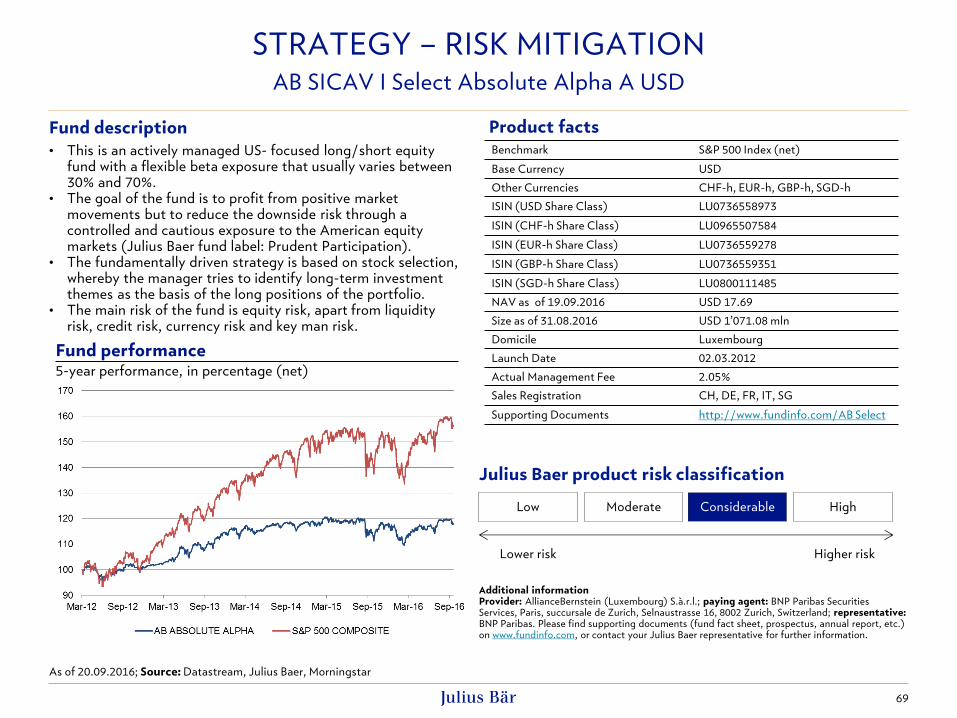
STRATEGY – RISK MITIGATION
69
AB SICAV I Select Absolute Alpha A USD
Fund description
• This is an actively managed US- focused long/short equity fund with a flexible beta exposure that usually varies between 30% and 70%.
• The goal of the fund is to profit from positive market movements but to reduce the downside risk through a controlled and cautious exposure to the American equity markets (Julius Baer fund label: Prudent Participation).
• The fundamentally driven strategy is based on stock selection, whereby the manager tries to identify long-term investment themes as the basis of the long positions of the portfolio.
• The main risk of the fund is equity risk, apart from liquidity risk, credit risk, currency risk and key man risk.
Fund performance 5-year performance, in percentage (net)
Low Moderate Considerable High
Lower risk Higher risk
Julius Baer product risk classification
Product facts
Benchmark S&P 500 Index (net)
Base Currency USD
Other Currencies CHF-h, EUR-h, GBP-h, SGD-h
ISIN (USD Share Class) LU0736558973
ISIN (CHF-h Share Class) LU0965507584
ISIN (EUR-h Share Class) LU0736559278
ISIN (GBP-h Share Class) LU0736559351
ISIN (SGD-h Share Class) LU0800111485
NAV as of 19.09.2016 USD 17.69
Size as of 31.08.2016 USD 1’071.08 mln
Domicile Luxembourg
Launch Date 02.03.2012
Actual Management Fee 2.05%
Sales Registration CH, DE, FR, IT, SG
Supporting Documents http://www.fundinfo.com/AB Select
Additional information Provider: AllianceBernstein (Luxembourg) S.à.r.l.; paying agent: BNP Paribas Securities Services, Paris, succursale de Zurich, Selnaustrasse 16, 8002 Zurich, Switzerland; representative: BNP Paribas. Please find supporting documents (fund fact sheet, prospectus, annual report, etc.) on www.fundinfo.com, or contact your Julius Baer representative for further information.
As of 20.09.2016; Source: Datastream, Julius Baer, Morningstar

70
Important legal information
This publication constitutes marketing material and is not the result of independent financial research. Therefore the legal requirements regarding the independence of
financial research do not apply. This material is not independent from the proprietary interests of Julius Baer (i.e. it is possible that Julius Baer products may be
recommended), which may conflict with your interests.
The information and opinions expressed in this publication were produced by Bank Julius Baer & Co. Ltd., Zurich, as of the date of writing and are subject to change
without notice. This publication is intended for information purposes only and does not constitute an offer or an invitation by, or on behalf of, Julius Baer to make any
investments. Opinions and comments of the authors reflect their current views, but not necessarily of other Julius Baer entities or any other third party.
Services and/or products mentioned in this publication may not be suitable for all recipients and may not be available in all countries. Clients of Julius Baer are kindly
requested to get in touch with the local Julius Baer entity in order to be informed about the services and/or products available in such country.
This publication has been prepared without taking account of the objectives, financial situation or needs of any particular investor. Before entering into any transaction,
investors should consider the suitability of the transaction to individual circumstances and objectives. Any investment or trading or other decision should only be made by
the client after a thorough reading of the relevant product term sheet,
subscription agreement, information memorandum, prospectus or other offering document relating to the issue of the securities or other financial instruments. Nothing in
this publication constitutes investment, legal, accounting or tax advice, or a representation that any
investment or strategy is suitable or appropriate for individual circumstances, or otherwise constitutes a personal recommendation for any specific investor. Julius Baer
recommends that investors independently assess, with a professional advisor, the specific financial risks as
well as legal, regulatory, credit, tax and accounting consequences. Past performance is not a reliable indicator of future results.
Performance forecasts are not a reliable indicator of future performance. The investor may not get back the amount invested.
Although the information and data herein are obtained from sources believed to be reliable, no representation is made that the information is accurate or complete.
Bank Julius Baer & Co. Ltd., Zurich, its subsidiaries and affiliated companies do not accept liability for any loss arising from the use of this publication.
Investments in funds should only be made after a thorough reading of the current prospectus, the current Key Investor Information Document or simplified prospectus,
the fund regulations or articles of association and the latest annual and semi-annual reports. These documents can be obtained free of charge upon request. The value of
the units and the return they generate can go down as well as up. Performance values are calculated without taking account of commissions and costs that result from
selling and buying back investments.
Structured products (e.g. baskets, certificates) are complex financial products and therefore involve a higher degree of risk. They are intended for investors who
understand and are capable of assuming all risks involved. Structured products may therefore only be sold to experienced investors and require additional advice regarding
the products specific risks. The value of the products is not only dependent on the development of the underlying, but also on the creditworthiness of the issuer, which
may vary over the term of the product. In case of the issuer’s insolvency or bankruptcy, the investor in the product may lose his entire investment. Before entering an
investment all documents related to the issue of the described structured product has to be read. The full terms of the respective structured product may be obtained free
of charge.
IMPORTANT LEGAL INFORMATION (1/2)
71
The investor may be exposed to currency risk, because the product or underlyings of the product are denominated in other currencies than that of the country in which
the investor is resident. The investment as well as its performance are therefore exposed to currency fluctuations and may increase or decrease in value.
This publication may only be distributed in countries where its distribution is legally permitted. This publication is not directed to any person in any jurisdiction
where (by reason of that person’s nationality, residence or otherwise) such publications are prohibited.
External Asset Managers/External Financial Advisors: In case this marketing publication is provided to an External Asset Manager or an External Financial Adviser,
Julius Baer expressly prohibits that it is redistributed by the External Asset Manager or the External Financial Adviser and is made available to their clients and/or third
parties. By receiving any marketing publication the External Asset Managers or the External Financial Advisers confirm that they will make their own independent analysis
and investment decisions.
Switzerland: in Switzerland this publication has been distributed by Bank Julius Baer & Co. Ltd., Zurich, authorised and regulated by the Swiss Financial Market
Supervisory Authority FINMA. All investment funds mentioned in this publication are authorised for distribution in Switzerland. Structured products do not constitute a
participation in a collective investment scheme. Therefore, they are not supervised by the Swiss Financial Market Supervisory Authority FINMA and the investor does not
benefit from the specific investor protection provided under the Swiss Federal Act on Collective Investment Schemes. This publication is not a simplified prospectus as
stated in Art. 5 of the Swiss Federal Act on Collective Investment Schemes.
United States: NEITHER THIS PUBLICATION NOR ANY COPY THEREOF MAY BE SENT, TAKEN INTO OR DISTRIBUTED IN THE UNITED STATES OR TO ANY US
PERSON.
This publication may contain information obtained from third parties, including ratings from rating agencies such as Standard & Poor’s, Moody’s, Fitch and other similar
rating agencies. Reproduction and distribution of third-party content in any form is prohibited except with the prior written permission of the related third-party. Third-
party content providers do not guarantee the accuracy, completeness, timeliness or availability of any information, including ratings, and are not responsible for any errors
or omissions (negligent or otherwise), regardless of the cause, or for the results obtained from the use of such content. Third-party content providers give no express or
implied warranties, including, but not limited to, any warranties of merchantability or fitness for a particular purpose or use. Third-party content providers shall not be
liable for any direct, indirect, incidental, exemplary, compensatory, punitive, special or consequential damages, costs, expenses, legal fees, or losses (including lost income
or profits and opportunity costs) in connection with any use of their content, including ratings. Credit ratings are statements of opinions and are not statements of fact or
recommendations to purchase, hold or sell securities. They do not address the market value of securities or the suitability of securities for investment purposes, and should
not be relied on as investment advice.
© Bank Julius Baer & Co. Ltd., 2016
IMPORTANT LEGAL INFORMATION (2/2)