financial stability report - federal reserve
TRANSCRIPT
B o a r d o f G o v e r n o r s o f t h e F e d e r a l R e s e rv e S y s t e m
Financial Stability Report
May 2021


B o a r d o f G o v e r n o r s o f t h e F e d e r a l R e s e rv e S y s t e m
Financial Stability Report
May 2021

This and other Federal Reserve Board reports and publications are available online at www.federalreserve.gov/publications/default.htm.
To order copies of Federal Reserve Board publications offered in print, see the Board’s Publication Order Form
(www.federalreserve.gov/pubs/orderform.pdf)
or contact: Publications Fulfillment
Mail Stop N-127 Board of Governors of the Federal Reserve System
Washington, DC 20551(ph) 202-452-3245(fax) 202-728-5886
(email) [email protected]

iii
Contents
Purpose . . . . . . . . . . . . . . . . . . . . . . . . . . . . . . . . . . . . . . . . . . . . . . . . . . . . . . . 1
Framework. . . . . . . . . . . . . . . . . . . . . . . . . . . . . . . . . . . . . . . . . . . . . . . . . . . . . 3
Overview . . . . . . . . . . . . . . . . . . . . . . . . . . . . . . . . . . . . . . . . . . . . . . . . . . . . . . 7
1. Asset Valuations . . . . . . . . . . . . . . . . . . . . . . . . . . . . . . . . . . . . . . . . . . . . . . 9
2. Borrowing by Businesses and Households. . . . . . . . . . . . . . . . . . . . . . . . . 23
3. Leverage in the Financial Sector . . . . . . . . . . . . . . . . . . . . . . . . . . . . . . . . 37
4. Funding Risk . . . . . . . . . . . . . . . . . . . . . . . . . . . . . . . . . . . . . . . . . . . . . . . 45
Near-Term Risks to the Financial System . . . . . . . . . . . . . . . . . . . . . . . . . . . 59
Figure Notes . . . . . . . . . . . . . . . . . . . . . . . . . . . . . . . . . . . . . . . . . . . . . . . . . . 65
Note: This report generally reflects information that was available as of April 19, 2021.
Vulnerabilities from Asset Valuations, Risk Appetite, and Low Interest Rates . . . . . . . . . . . . . . . . . . . . . . . . . . . . . . . . . . . . . . . . . . . 15
The Paycheck Protection Program Liquidity Facility. . . . . . . . . . . . . . . . . . . 32
LIBOR Transition Update . . . . . . . . . . . . . . . . . . . . . . . . . . . . . . . . . . . . . . . 51
Vulnerabilities in Global U.S. Dollar Funding Markets. . . . . . . . . . . . . . . . . 55
Salient Shocks to Financial Stability Cited in Market Outreach . . . . . . . . . . 62
Boxes


1
PurposeThis report presents the Federal Reserve Board’s current assessment of the resilience of the U.S. financial system. By publishing this report, the Board intends to promote public under-standing and increase transparency and accountability for the Federal Reserve’s views on this topic.
Promoting financial stability is a key element in meeting the Federal Reserve’s dual mandate for monetary policy regarding full employment and stable prices. In an unstable financial system, adverse events are more likely to result in severe financial stress and disrupt the flow of credit, leading to high unemployment and great financial hardship. Monitoring and assessing financial stability also support the Federal Reserve’s regulatory and supervisory activities, which promote the safety and soundness of our nation’s banks and other impor-tant financial institutions. Information gathered while monitoring the stability of the finan-cial system helps the Federal Reserve develop its view of the salient risks to be included in the scenarios of the stress tests and its setting of the countercyclical capital buffer (CCyB).1
The Board’s Financial Stability Report is similar to those published by other central banks and complements the annual report of the Financial Stability Oversight Council (FSOC), which is chaired by the Secretary of the Treasury and includes the Federal Reserve Board Chair and other financial regulators.
1 More information on the Federal Reserve’s supervisory and regulatory activities is available on the Board’s website; see Board of Governors of the Federal Reserve System (2021), Supervision and Regulation Report (Washington: Board of Governors, April), available at https://www.federalreserve.gov/publications/supervision-and-regulation-report.htm as well as the webpages for Supervision and Regulation (https://www.federalreserve.gov/supervisionreg.htm) and Payment Systems (https://www.federalreserve.gov/paymentsystems.htm). Moreover, additional details about the conduct of monetary policy are also on the Board’s website; see the Monetary Policy Report (https://www.federalreserve.gov/monetarypolicy/mpr_default.htm) and the webpage for Monetary Policy (https://www.federalreserve.gov/monetarypolicy.htm).

3
FrameworkA stable financial system, when hit by adverse events, or “shocks,” continues to meet the demands of households and businesses for financial services, such as credit provision and payment services. In contrast, in an unstable system, these same shocks are likely to have much larger effects, disrupting the flow of credit and leading to declines in employment and economic activity.
Consistent with this view of financial stability, the Federal Reserve Board’s monitoring framework distinguishes between shocks to and vulnerabilities of the financial system. Shocks, such as sudden changes to financial or economic conditions, are typically surprises and are inherently difficult to predict. Vulnerabilities tend to build up over time and are the aspects of the financial system that are most expected to cause widespread problems in times of stress. As a result, the framework focuses primarily on monitoring vulnerabilities and emphasizes four broad categories based on research.2
1. Elevated valuation pressures are signaled by asset prices that are high relative to eco-nomic fundamentals or historical norms and are often driven by an increased willingness of investors to take on risk. As such, elevated valuation pressures imply a greater possibil-ity of outsized drops in asset prices.
2. Excessive borrowing by businesses and households leaves them vulnerable to distress if their incomes decline or the assets they own fall in value. In the event of such shocks, businesses and households with high debt burdens may need to cut back spending sharply, affecting the overall level of economic activity. Moreover, when businesses and households cannot make payments on their loans, financial institutions and investors incur losses.
3. Excessive leverage within the financial sector increases the risk that financial institu-tions will not have the ability to absorb even modest losses when hit by adverse shocks. In those situations, institutions will be forced to cut back lending, sell their assets, or, in extreme cases, shut down. Such responses can substantially impair credit access for house-holds and businesses.
4. Funding risks expose the financial system to the possibility that investors will “run” by withdrawing their funds from a particular institution or sector. Many financial institu-tions raise funds from the public with a commitment to return their investors’ money on short notice, but those institutions then invest much of the funds in illiquid assets that
2 For a review of the research literature in this area and further discussion, see Tobias Adrian, Daniel Covitz, and Nellie Liang (2015), “Financial Stability Monitoring,” Annual Review of Financial Economics, vol. 7 (December), pp. 357–95.
4 Framework
are hard to sell quickly or in assets that have a long maturity. This liquidity and maturity transformation can create an incentive for investors to withdraw funds quickly in adverse situations. Facing a run, financial institutions may need to sell assets quickly at “fire sale” prices, thereby incurring substantial losses and potentially even becoming insolvent. Histo rians and economists often refer to widespread investor runs as “financial panics.”
These vulnerabilities often interact with each other. For example, elevated valuation pres-sures tend to be associated with excessive borrowing by businesses and households because both borrowers and lenders are more willing to accept higher degrees of risk and leverage when asset prices are appreciating rapidly. The associated debt and leverage, in turn, make the risk of outsized declines in asset prices more likely and more damaging. Similarly, the risk of a run on a financial institution and the consequent fire sales of assets are greatly amplified when significant leverage is involved.
It is important to note that liquidity and maturity transformation and lending to households, businesses, and financial firms are key aspects of how the financial system supports the economy. For example, banks provide safe, liquid assets to depositors and long-term loans to households and businesses; businesses rely on loans or bonds to fund investment projects; and households benefit from a well-functioning mortgage market when buying a home.
The Federal Reserve’s monitoring framework also tracks domestic and international devel-opments to identify near-term risks—that is, plausible adverse developments or shocks that could stress the U.S. financial system. The analysis of these risks focuses on assessing how such potential shocks may play out through the U.S. financial system, given our current assessment of the four areas of vulnerabilities.
While this framework provides a systematic way to assess financial stability, some potential risks do not fit neatly into it because they are novel or difficult to quantify. In addition, some vulnerabilities are difficult to measure with currently available data, and the set of vulnera-bilities may evolve over time. Given these limitations, we continually rely on ongoing research by the Federal Reserve staff, academics, and other experts to improve our measurement of existing vulnerabilities and to keep pace with changes in the financial system that could cre-ate new forms of vulnerabilities or add to existing ones.
Federal Reserve actions to promote the resilience of the financial system
The assessment of financial vulnerabilities informs Federal Reserve actions to promote the resilience of the financial system. The Federal Reserve works with other domestic agencies directly and through the FSOC to monitor risks to financial stability and to undertake super-visory and regulatory efforts to mitigate the risks and consequences of financial instability.
Actions taken by the Federal Reserve to promote the resilience of the financial system include its supervision and regulation of financial institutions—in particular, large bank

FINaNCIaL STaBILITY rePorT: maY 2021 5
holding companies (BHCs), the U.S. operations of certain foreign banking organizations (FBOs), and financial market utilities. Specifically, in the post-crisis period, for the largest, most systemically important BHCs, these actions have included requirements for more and higher-quality capital, an innovative stress-testing regime, new liquidity regulation, and improvements in the resolvability of such BHCs.
In addition, the Federal Reserve’s assessment of financial vulnerabilities informs the design of stress-test scenarios and decisions regarding the CCyB. The stress scenarios incorporate some systematic elements to make the tests more stringent when financial imbalances are rising, and the assessment of vulnerabilities also helps identify salient risks that can be included in the scenarios. The CCyB is designed to increase the resilience of large banking organizations when there is an elevated risk of above-normal losses and to promote a more sustainable supply of credit over the economic cycle.


7
OverviewThis report reviews conditions affecting the stability of the financial system by analyzing vul-nerabilities related to valuation pressures, borrowing by businesses and households, financial leverage, and funding risk. It also highlights several near-term risks that, if realized, could interact with such vulnerabilities.
Since the November 2020 Financial Stability Report was issued, prices of risky assets gen-erally rose further, with the outlook buoyed by positive vaccine-related news, additional fiscal stimulus, and better-than-expected economic data. Vulnerabilities from both business and household debt have declined, reflecting a slower pace of business borrowing and an improvement in earnings as well as government programs that have supported business and household incomes. Even so, many businesses and households remain under considerable strain, with job losses heavily concentrated among the most financially vulnerable, including many lower-wage workers and racial and ethnic minorities. Banks have remained well cap-italized but may face heightened credit risk in the sectors most affected by the COVID-19 pandemic. Although markets for short-term funding are now functioning normally, struc-tural vulnerabilities at some nonbank financial institutions (NBFIs) could amplify shocks to the financial system in times of stress.
Our current view of vulnerabilities is as follows:
1. Asset valuations. Prices of risky assets have generally increased since November with improving fundamentals, and, in some markets, prices are high compared with expected cash flows. Long-term Treasury yields have risen over the past few months but remain low by historical standards. High asset prices in part reflect the continued low level of Trea-sury yields. However, valuations for some assets are elevated relative to historical norms even when using measures that account for Treasury yields. In this setting, asset prices may be vulnerable to significant declines should risk appetite fall.
2. Borrowing by businesses and households. Debt owed by businesses was effectively flat in the second half of 2020, remaining at a high level relative to gross domestic product (GDP). Improving earnings, low interest rates, and ongoing government support have increased the ability of businesses to service these obligations. Debt owed by households remained at a moderate level relative to income. Delinquencies on mortgages and other consumer debt fell early in the pandemic and remain below their pre-pandemic levels, as households have received significant government support—including from forbearance and fiscal programs—and as interest rates have remained low. Even so, some businesses and households remain under considerable strain.

8 overvIew
3. Leverage in the financial sector. Banks remain well capitalized, and leverage at broker-dealers is low. Measures of hedge fund leverage are somewhat above their historical averages, but the data available may not capture important risks from hedge funds or other leveraged funds. Amid elevated investor risk appetite, issuance of collateralized loan obligations (CLOs) and asset-backed securities (ABS) has been robust.
4. Funding risk. Funding risks at domestic banks remain low, because these banks rely only modestly on short-term wholesale funding and maintain sizable holdings of high-quality liquid assets. However, the market turmoil at the onset of the pandemic highlighted struc-tural vulnerabilities that persist at some types of money market funds (MMFs) as well as bond and bank loan mutual funds.
This report also details how near-term risks have changed since the November 2020 report. Despite substantial progress with vaccinations, perceived risks associated with the course of the pandemic and its effects on the U.S. and foreign economies remain relatively high. A worsening of the global pandemic could stress the financial system in emerging markets and some European countries. Further, if global interest rates were to rise abruptly, some emerging market economies (EMEs) could experience additional fiscal strains. These risks, if realized, could interact with the vulnerabilities identified in this report and pose additional risks to the U.S. financial system.

9
Prices of risky assets have risen further on the improved economic outlook, and valuations are generally high
Broad equity market indexes have reached record highs in recent months. Yields on corpo-rate bonds and leveraged loans remain at low levels relative to their historical ranges. Mean-while, yields on long-term Treasury securities have risen over the past few months but remain low by historical standards. Reflecting, in part, increased prices, some measures of risk compensation, which account for the still-low level of interest rates, have decreased to levels that are low relative to their historical norms.
On balance, indicators of commercial real estate (CRE) valuations remain high; however, low transaction volumes—especially for distressed properties—may mask declines in commer-cial property values. Farmland prices remain elevated relative to rents and incomes. Sup-ported by relatively low mortgage rates, house prices have continued to increase amid strong home sales.
Looking ahead, asset prices may be vulnerable to significant declines should investor risk appetite fall, progress on containing the virus disappoint, or the recovery stall. Some seg-ments of the economy—such as energy, travel, and hospitality—are particularly sensitive to pandemic-related developments.
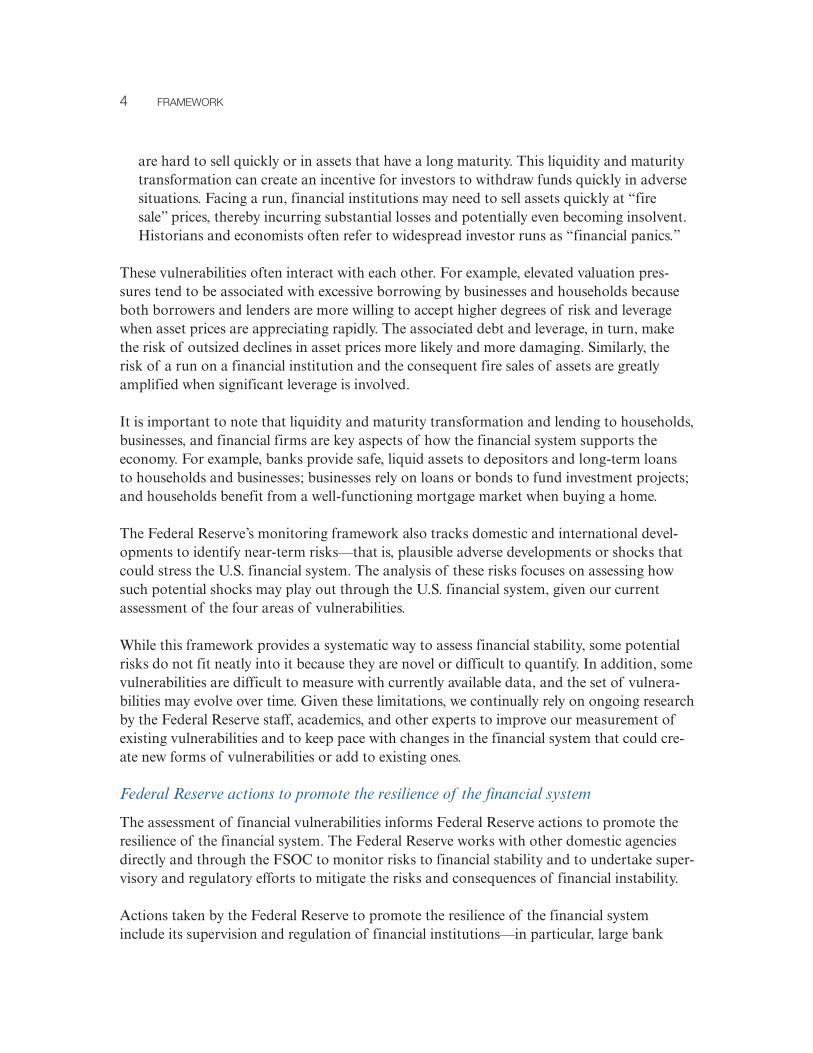
Table 1 shows the sizes of the asset markets discussed in this section. The largest asset markets are those for corporate public equities, residential real estate, Treasury securities, and CRE.
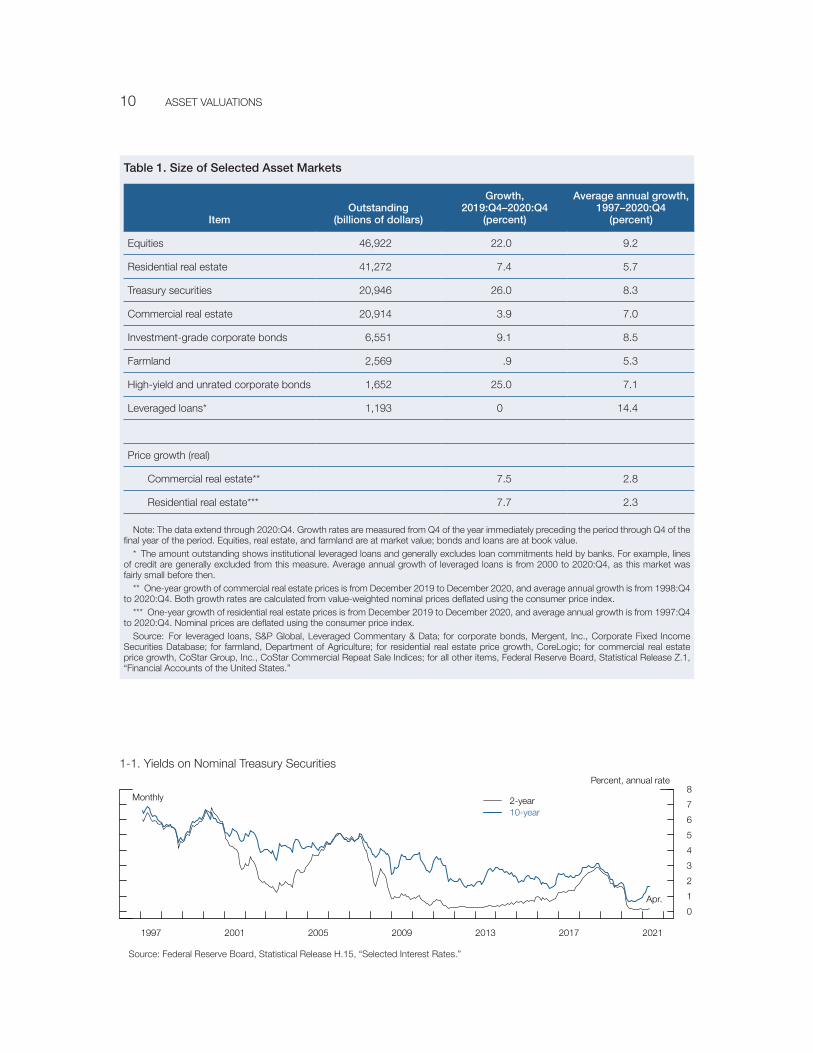
Treasury yields and term premiums have risen but remain low
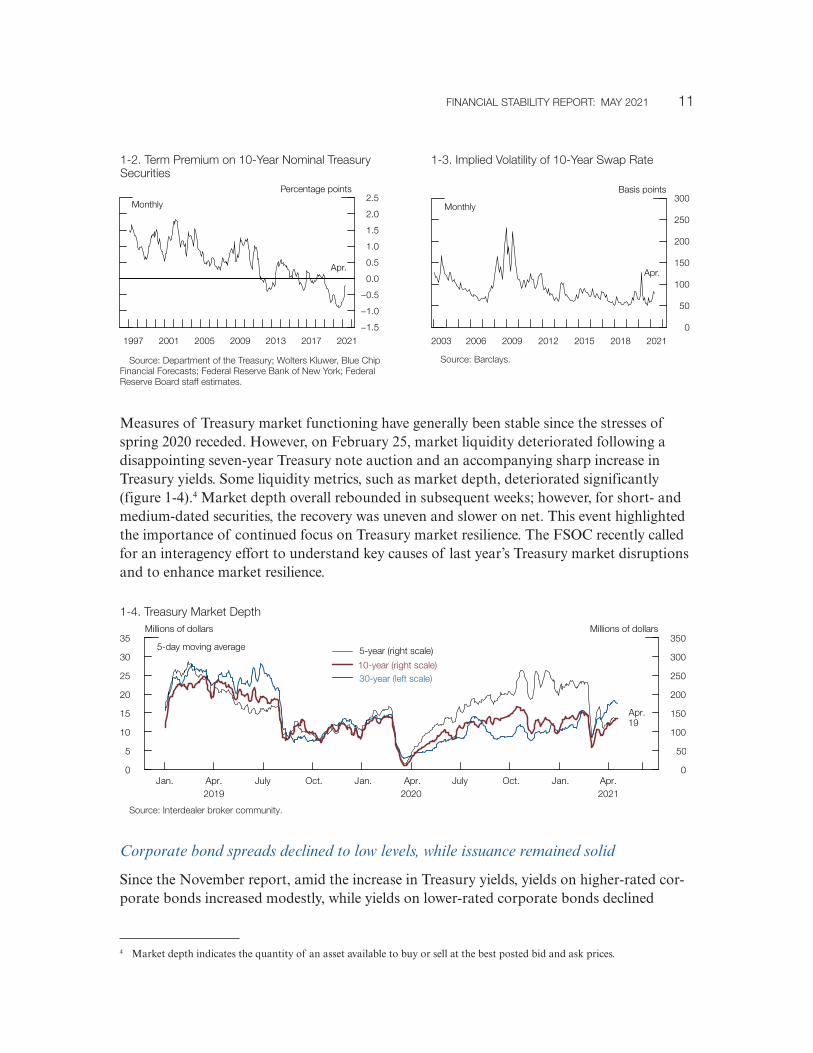
Since the previous report, yields on longer-dated Treasury securities have moved up to their pre-COVID levels (figure 1-1). Model estimates of Treasury term premiums have also risen but are still negative, and implied volatility on long-term interest rates has edged up (figures 1-2 and 1-3).3 The increases in yields and term premiums are consistent with market perceptions of an improved economic outlook, higher inflation expectations, and diminished downside risks from the pandemic. Still, Treasury yields remain low relative to their histor-ical range, and an increase in term premiums, if not accompanied by a strengthening of the economic outlook, could put downward pressure on valuations in a variety of markets.
3 Treasury term premiums capture the difference between the yield that investors require for holding longer-term Treasury securities and the expected yield from rolling over shorter-dated ones.
1. Asset Valuations
10 aSSeT vaLuaTIoNS
1-1. Yields on Nominal Treasury Securities
Source: Federal reserve Board, Statistical release H.15, “Selected Interest rates.”
0
1
2
3
4
5
6
7
8
1997 2001 2005 2009 2013 2017 2021
Percent, annual rate
2-year10-year
monthly
apr.
Table 1. Size of Selected Asset Markets
ItemOutstanding
(billions of dollars)
Growth, 2019:Q4–2020:Q4
(percent)
Average annual growth, 1997–2020:Q4
(percent)
equities 46,922 22.0 9.2
residential real estate 41,272 7.4 5.7
Treasury securities 20,946 26.0 8.3
Commercial real estate 20,914 3.9 7.0
Investment-grade corporate bonds 6,551 9.1 8.5
Farmland 2,569 .9 5.3
High-yield and unrated corporate bonds 1,652 25.0 7.1
Leveraged loans* 1,193 0 14.4
Price growth (real)
Commercial real estate** 7.5 2.8
residential real estate*** 7.7 2.3
Note: The data extend through 2020:Q4. Growth rates are measured from Q4 of the year immediately preceding the period through Q4 of the final year of the period. equities, real estate, and farmland are at market value; bonds and loans are at book value.
* The amount outstanding shows institutional leveraged loans and generally excludes loan commitments held by banks. For example, lines of credit are generally excluded from this measure. average annual growth of leveraged loans is from 2000 to 2020:Q4, as this market was fairly small before then.
** one-year growth of commercial real estate prices is from December 2019 to December 2020, and average annual growth is from 1998:Q4 to 2020:Q4. Both growth rates are calculated from value-weighted nominal prices deflated using the consumer price index.
*** one-year growth of residential real estate prices is from December 2019 to December 2020, and average annual growth is from 1997:Q4 to 2020:Q4. Nominal prices are deflated using the consumer price index.
Source: For leveraged loans, S&P Global, Leveraged Commentary & Data; for corporate bonds, mergent, Inc., Corporate Fixed Income Securities Database; for farmland, Department of agriculture; for residential real estate price growth, CoreLogic; for commercial real estate price growth, CoStar Group, Inc., CoStar Commercial repeat Sale Indices; for all other items, Federal reserve Board, Statistical release Z.1, “Financial accounts of the united States.”
FINaNCIaL STaBILITY rePorT: maY 2021 11
Measures of Treasury market functioning have generally been stable since the stresses of spring 2020 receded. However, on February 25, market liquidity deteriorated following a disappointing seven-year Treasury note auction and an accompanying sharp increase in Treasury yields. Some liquidity metrics, such as market depth, deteriorated significantly (figure 1-4).4 Market depth overall rebounded in subsequent weeks; however, for short- and medium-dated securities, the recovery was uneven and slower on net. This event highlighted the importance of continued focus on Treasury market resilience. The FSOC recently called for an interagency effort to understand key causes of last year’s Treasury market disruptions and to enhance market resilience.
Corporate bond spreads declined to low levels, while issuance remained solid
Since the November report, amid the increase in Treasury yields, yields on higher-rated cor-porate bonds increased modestly, while yields on lower-rated corporate bonds declined
4 Market depth indicates the quantity of an asset available to buy or sell at the best posted bid and ask prices.
0
50
100
150
200
250
300
2003 2006 2009 2012 2015 2018 2021
Basis points
monthly
apr.
1-3. Implied volatility of 10-Year Swap rate
Source: Barclays.
−1.5
−1.0
−0.5
0.0
0.5
1.0
1.5
2.0
2.5
1997 2001 2005 2009 2013 2017 2021
Percentage points
monthly
apr.
1-2. Term Premium on 10-Year Nominal Treasury Securities
Source: Department of the Treasury; wolters kluwer, Blue Chip Financial Forecasts; Federal reserve Bank of New York; Federal reserve Board staff estimates.
1-4. Treasury market Depth
Source: Interdealer broker community.
0
5
10
15
20
25
30
35
0
50
100
150
200
250
300
350
Jan. apr. July oct. Jan. apr. July oct. Jan. apr.
millions of dollarsmillions of dollars
apr.19
5-day moving average
202120202019
5-year (right scale)
10-year (right scale)30-year (left scale)

12 aSSeT vaLuaTIoNS
significantly (figure 1-5). These movements left the spreads of lower-rated corporate bond yields over comparable-maturity Treasury yields very narrow relative to their historical distributions (figure 1-6).5 Corporate bond spreads in sectors heavily affected by the pandemic—such as energy, airline, and hospitality—also declined but remain wider than average spreads across all industries. The excess bond premium, which is a measure that captures the gap between corporate bond spreads and expected credit losses, is at the bottom quintile of its historical distribution, suggesting elevated appetite for risk among investors (figure 1-7).6
Corporate bond markets appear to have functioned smoothly since the November Financial Stability Report, and bid-ask spreads remained within historical norms. The Federal Reserve’s corporate credit emer-gency lending facilities, as well as several other facilities, expired at the end of last year and are no longer authorized to purchase eligible assets. This event left no imprint on markets.
Corporate bond issuance by both investment- and speculative-grade firms has remained solid, as companies boosted their cash buffers and refinanced their debt
at lower interest rates and longer maturities. The share of investment-grade issuance with the lowest ratings has increased. However, within speculative-grade bonds, the share of new
5 Spreads between yields on corporate bonds and comparable-maturity Treasury securities reflect the extra compensation investors require to hold debt that is subject to corporate default or liquidity risks.
6 For a description of the excess bond premium, see Simon Gilchrist and Egon Zakrajšek (2012), “Credit Spreads and Busi-ness Cycle Fluctuations,” American Economic Review, vol. 102 (June), pp. 1692–720.
−3
−2
−1
0
1
2
3
4
5
1997 2001 2005 2009 2013 2017 2021
monthly
Percentage points
mar.
1-7. excess Bond Premium
Source: Federal reserve Board staff calculations based on Lehman Brothers Fixed Income Database (warga); Intercontinental exchange, Inc., ICe Data Services; Center for research in Security Prices, CrSP/Compustat merged Database, wharton research Data Services; S&P Global market Intelligence, Compustat.
0123456789
101112
02468
1012141618202224
1997 2001 2005 2009 2013 2017 2021
monthly
Percentage pointsPercentage points
apr.
Triple-B(left scale)
High-yield(right scale)
1-6. Corporate Bond Spreads to Similar-maturity Treasury Securities
Source: ICe Data Indices, LLC, used with permission.
02468
1012141618202224
1997 2001 2005 2009 2013 2017 2021
monthlyPercent
Triple-B
High-yield
apr.
1-5. Corporate Bond Yields
Source: ICe Data Indices, LLC, used with permission.

FINaNCIaL STaBILITY rePorT: maY 2021 13
bonds with the lowest ratings remained subdued through the first quarter of 2021. While the composition of new issues of investment-grade bonds has become riskier, overall credit quality of outstanding bonds has improved since November as actual and expected defaults have declined.
Spreads on leveraged loans, in both the primary and secondary markets, have narrowed fur-ther since the fall (figure 1-8). These spreads are now in the bottom quintile of their post-2008 distributions.
Equity prices increased amid continued high volatility, and valuations continue to be supported in part by low interest rates
Equity prices have increased, on net, since November 2020. Forecasts of corporate earnings have risen roughly in line with equity prices, so the ratio of prices to forecasts of earnings remains near the top of its historical distribution (figure 1-9). Meanwhile, the difference between the forward earnings-to-price ratio and the expected real yield on 10-year Treasury securities—a rough measure of the compensation that investors require for holding risky
6
9
12
15
18
21
24
27
30
1991 1996 2001 2006 2011 2016 2021
monthly
ratio
median
apr.
1-9. Forward Price-to-earnings ratio of S&P 500 Firms
Source: Federal reserve Board staff calculations using refinitiv (formerly Thomson reuters), Institutional Brokers estimate System estimates.
1-8. Secondary-market Spreads of Leveraged Loans
Source: S&P Global, Leveraged Commentary & Data.
0
5
10
15
20
25
30
1997 2001 2005 2009 2013 2017 2021
weekly
Percentage points
apr.9
B
BB

14 aSSeT vaLuaTIoNS
stocks known as the equity premium—has declined since November (figure 1-10). A lower equity premium generally indicates investors have a higher appetite for the risk of invest-ing in equities. However, this measure of the equity premium remains above its historical median, suggesting that equity investor risk appetite, though higher since November by this measure, is still within historical norms. That said, this measure is close to its lowest level over the past 15 years. Option-implied volatility, a proxy for perceived uncertainty, remains above pre-pandemic levels (figure 1-11).
In contrast to the mixed signals from price-based measures, a number of nonprice measures suggest that investor appetite for equity risk is elevated relative to history. The pace of initial public offerings (IPOs) has increased to levels not seen since the 1990s. In addition, a ris-ing share of IPOs is supported by special purpose acquisition companies (SPACs), which are nonoperating corporations created specifically to issue public equity and subsequently acquire an existing operating company. For a broader discussion of risk appetite, see the box “Vulnerabilities from Asset Valuations, Risk Appetite, and Low Interest Rates.”
−2
0
2
4
6
8
10
1991 1996 2001 2006 2011 2016 2021
monthly
Percentage points
median
apr.
1-10. Spread of Forward earnings-to-Price ratio of S&P 500 Firms to expected 10-Year real Treasury Yield
Source: Federal reserve Board staff calculations using refinitiv (formerly Thomson reuters), Institutional Brokers estimate System estimates; Department of the Treasury; Federal reserve Bank of Philadelphia, Survey of Professional Forecasters.
0
10
20
30
40
50
60
70
1997 2001 2005 2009 2013 2017 2021
monthly
Percent
option-implied volatilityrealized volatility
apr.
1-11. S&P 500 return volatility
Source: Bloomberg Finance L.P.

FINaNCIaL STaBILITY rePorT: maY 2021 15
Vulnerabilities from Asset Valuations, Risk Appetite, andLow Interest Rates
Assessing vulnerabilities from asset valuations is a part of the Federal Reserve’s fi nancial stability framework. High asset valuations, relative to the general level of interest rates and the income fl ows generated by different types of assets, suggest investors require less compensation for the risks they are taking and, thus, have elevated appetite for or willingness to invest in risky assets. At times when risk appetite is elevated, investors may take on excessive leverage or engage in other forms of risk-taking, which are vulnerabilities that are addressed in other parts of the Federal Reserve’s fi nan-cial stability framework. In addition, should risk appetite decline from elevated levels, a broad range of asset prices could be vulnerable to large and sudden declines, which can lead to broader stress to the fi nancial system.
In this discussion, we fi rst provide a short primer on factors affecting asset prices. Next, we explore methods that are used to assess investor risk appetite, focusing on approaches that account for economic fundamentals. And, fi nally, motivated by the notable decline in interest rates over recent decades, we ask how persistently low interest rates might affect valuations and risk appetite.
Factors affecting asset prices
People and businesses invest now to receive income in the future. There are various theories explain-ing asset prices. According to a long-standing theory, an asset’s price should equal the expected discounted value today of future payoffs from holding assets—for example, interest payments from Treasury securities and corporate bonds as well as dividends from stocks.1 Investors also want to be compensated for the relative risk of their investments, so the expected rate of return will tend to be higher for riskier assets such as equities and corporate bonds than for Treasury securities. The differ-ence in the expected returns between risky assets and Treasury securities is the risk premium investors expect to receive as compensation for the risk they take.
For assets such as publicly traded equities and corporate bonds, it can be diffi cult to tell the relative contribution of risk premiums and expected future income in causing changes in asset valuations at any point in time. An increase in asset prices might refl ect higher expected future payoffs; a decline in the overall level of interest rates, which raises the current value of those future payoffs; a fall in risk premiums; or a combination of these factors.
Asset prices and risk appetite
The Federal Reserve closely monitors measures of risk premiums, which help indicate whether investor risk appetite is rising or falling. When risk appetite is higher, risk premiums are lower, prices of risky assets are higher, and the odds of a large and potentially destabilizing fall in asset prices increases. High risk appetite can also prompt businesses and households to take on more leverage and induce banks and other lenders to increase their risk-taking.
1 Discounting refers to the formula for determining the current value of a payment or stream of payments in the future. The discount rate for a risky asset equals the interest rate on a safe asset plus a risk premium, which compensates investors for the risk of losses from holding the risky asset. an alternative theory for asset prices is that an asset price today reflects market participants’ estimate of what a potential buyer might be willing to pay for the asset tomorrow.
(continued on next page)

16 aSSeT vaLuaTIoNS
The risk premium for an asset varies over time and, unlike the price of an asset, cannot be directly observed. Thus, the Federal Reserve takes into account a large set of indicators that provide signals about risk premiums. For example, one measure of the risk premium investors require for holding stocks is the difference between the “earnings yield,” which is the ratio of earnings to stock prices, and the long-term real interest rate. This equity risk premium captures the earnings investors expect to receive by holding equities compared with what they would receive by holding a less risky investment in long-term government bonds.2 The left panel of fi gure A shows the distribution of monthly readings on this measure over the past three decades, ordered from low to high. The arrow in the fi gure shows the most recently available reading. According to this measure, the equity risk premium is around its historical center, suggesting that risk appetite is fairly typical.
The right panel shows the distribution of a related measure for the corporate bond market: the excess bond premium.3 This measure captures a component of corporate bond yields that is not explained by risk-free rates or default risk. By construction, this measure has a historical average of zero. When it is below zero, risk appetite is above that average. As in the left panel, the arrow shows the most recent value, which is not just negative but among the lowest recorded in recent decades, indicating high risk appetite.
2 This indicator is a rough measure of the premium that investors require for holding risky corporate equities. The first step in its calcula-tion is to take the ratio of firm earnings to stock prices as a proxy for expected equity returns. This ratio is calculated as the expected (or “forward”) earnings of S&P 500 firms based on analyst estimates, divided by the price of the index. In the second step, the expected equity risk premium is calculated as the earnings yield less the expected 10-year real Treasury yield as a proxy for expected excess equity returns over a risk-free rate. although this indicator provides useful information on the compensation for risk demanded by equity investors, alternative risk premium measures can be constructed using different models and assumptions. Considering a range of these measures can provide valuable additional insights into risk appetite and equity valuation pressures.
3 See Simon Gilchrist and egon Zakrajšek (2012), “Credit Spreads and Business Cycle Fluctuations,” American Economic Review, vol. 102 (June), pp. 1692–720. See also note 6 in the main text. This measure captures a component of corporate bond yields that is not explained by risk-free rates or default risk.
(continued)
Vulnerabilities from Asset Valuations (continued)
Mar.2021
0 1 2 3 4 5 6 7 8 9
0
10
20
30
40
50
60Count
Percentage points
expected equity risk Premium
Mar.2021
−1 0 1 2 30
20
40
60
80
100Count
Percentage points
excess Bond Premium
Source: (Left-hand panel) Federal reserve Board staff calculations using refinitiv (formerly Thomson reuters), Institutional Brokers estimate System estimates; Department of the Treasury; Federal reserve Bank of Philadelphia, Survey of Professional Forecasters.(right-hand panel) Federal reserve Board staff calculations based on Lehman Brothers Fixed Income Database (warga); Intercontinental exchange, Inc., ICe Data Services; Center for research in Security Prices, CrSP/Compustat merged Database, wharton research Data Services; Bank of america merrill Lynch Bond Indices; moody’s; S&P Global market Intelligence, Compustat.
Figure a. measures of risk appetite

FINaNCIaL STaBILITY rePorT: maY 2021 17
The two panels of fi gure A thus give very different signals about risk appetite based on asset prices. They illustrate why the Federal Reserve also reviews indicators not directly related to an asset’s price but that have been associated with periods of elevated risk appetite in the past, such as measures related to trading patterns, underwriting standards, issuance, or investor leverage. For example, indicators pointing to elevated risk appetite in equity markets in early 2021 include the episodes of high trading volumes and price volatility for so-called meme stocks—stocks that increased in trading volume after going viral on social media.4 Elevated equity issuance through SPACs also suggests a higher-than-typical appetite for risk among equity investors (fi gure B).5
Asset prices and persistently low risk-free interest rates
In recent decades, risk-free interest rates have declined notably, partly because of a decline in the neutral rate of interest, or the interest rate consistent with the economy being at full employment with 2 percent infl ation. Even before the pandemic, a number of estimates found that the neutral rate of interest had declined in recent decades. The decline in the neutral rate of interest likely refl ects persistent structural factors such as demographic changes and low productivity growth. While actual interest rates fl uctuate with the economic cycle, their trends tend to be driven by the neutral rate of interest. In other words, when, as now, the neutral rate of interest is low, market interest rates also tend to be low.
4 one such episode occurred in January 2021, when social media activity contributed to extreme fluctuations in stock prices for some companies, resulting in substantial losses for some investors.
5 SPaC issuance volume remained strong, but, going forward, the pace is reportedly expected to moderate, and the post-IPo perfor-mance of recently issued SPaCs has weakened. SPaC issuance took off in mid-2020 around the exceptional performance of some high-profile names (for example, Draftkings), with some commentators arguing that SPaCs offer a more efficient way to go public than the traditional IPo. However, some academics find that SPaCs have substantially higher costs and suggest that the advantages of SPaCs may be due to the lower disclosure requirements imposed by law when a company is acquired by a public SPaC, as opposed to undertaking a traditional IPo. See minmo Gahng, Jay r. ritter, and Donghang Zhang (2021), “SPaCs,” unpublished paper, January (revised march 2021); and michael klausner, michael ohlrogge, and emily ruan (forthcoming), “a Sober Look at SPaCs,” Yale Journal on Regulation. recent statements issued by the Securities and exchange Commission highlighted accounting challenges that may be common in SPaCs, potential liability risks of SPaCs under securities laws, and additional scrutiny that investors might want to use before investing in SPaCs.
(continued on next page)
Figure B. annual Domestic IPos Scaled by the market Capitalization of the S&P 500
0.0
0.1
0.2
0.3
0.4
0.5
0.6
0.7
0.8Percent
Annual rate
2020 H1
2020H2
Q1
1993 1997 2001 2005 2009 2013 2017 2021
Special purpose acquisition companies
Operating companies
Source: SDC Platinum.

18 aSSeT vaLuaTIoNS
The connections between persistently low interest rates and risk premiums are not well understood. Persistently low interest rates might contribute to the buildup of fi nancial vulnerabilities through a vari-ety of channels. Because low interest rates tend to be driven by changes in the structure of the econ-omy that reduce expected returns in many asset classes, low interest rates could lead some fi nancial intermediaries to invest in higher-risk assets to meet fi xed return targets.6 By reducing uncertainty about monetary policy, low interest rates could also mute fi nancial market volatility, which could con-tribute to a buildup in leverage if investors become complacent.7 Beyond asset valuations, low rates could encourage household borrowing, including through mortgages. Higher household borrowing can support spending and economic activity, but excessive borrowing can increase fi nancial vulnerabilities.
At the same time, persistently low interest rates can also reduce fi nancial vulnerabilities—for example, by supporting lower debt service payments. There is also some evidence that unexpected monetary policy easing leads to lower risk premiums, a key channel through which accommodative monetary policy can support the economy.8 However, even large changes in interest rates due to unexpected changes in monetary policy have been found to have only modest effects on equity, corporate bond, and house prices when compared to the overall variation in these asset prices.9
Given these challenges in assessing vulnerabilities associated with risk appetite and asset valuations, the Federal Reserve’s fi nancial stability monitoring tracks a wide range of measures related to risk-taking across fi nancial markets and institutions as well as the resilience of the system to potential drops in asset prices.
6 For example, one study provides evidence that “lower for longer” announcements led to higher risk-taking by mmFs; see marco Di maggio and marcin kacperczyk (2017), “The unintended Consequences of the Zero Lower Bound Policy,” Journal of Finan-cial Economics, vol. 123 (January), pp. 59–80. regarding the connections between low interest rates and risk-taking by intermediaries, see also Claudio Borio and Haibin Zhu (2012), “Capital regulation, risk-Taking and monetary Policy: a missing Link in the Transmis-sion mechanism?” Journal of Financial Stability, vol. 8 (December), pp. 236–51; Nuno Coimbra and Hélène rey (2019), “Financial Cycles with Heterogeneous Intermediaries,” NBer working Paper Series 23245 (Cambridge, mass.: National Bureau of economic research, January), https://www.nber.org/papers/w23245; and Lina Lu, matthew Pritsker, andrei Zlate, kenechukwu anadu, and James Bohn (2019), “reach for Yield by u.S. Public Pension Funds,” Finance and economics Discussion Series 2019-048 (washington: Board of Governors of the Federal reserve System, June), https://dx.doi.org/10.17016/FeDS.2019.048.
7 relatedly, low volatility could lead to higher leverage for intermediaries that face value-at-risk constraints. See Tobias adrian and Hyun Song Shin (2014), “Procyclical Leverage and value-at-risk,” Review of Financial Studies, vol. 27 (February), pp. 373–403.
8 See mark Gertler and Peter karadi (2015), “monetary Policy Surprises, Credit Costs, and economic activity,” American Economic Journal: Macroeconomics, vol. 7 (January), pp. 44–76; Simon Gilchrist, David López-Salido, and egon Zakrajšek (2015), “monetary Policy and real Borrowing Costs at the Zero Lower Bound,” American Economic Journal: Macroeconomics, vol. 7 (January), pp. 77–109; and Samuel G. Hanson and Jeremy C. Stein, “monetary Policy and Long-Term real rates,” Journal of Financial Econom-ics, vol. 115 (march), pp. 429–48.
9 For example, estimates from a range of models indicate that for every 100 basis point decline in the general level of interest rates, house prices increase over the course of several years by roughly 2 to 4 percentage points. By comparison, between 2000 and 2006, house prices increased between 40 and 70 percent, depending on the house price measure used. For further discussion, see Jonathan Goldberg, elizabeth klee, edward Simpson Prescott, and Paul wood (2020), “monetary Policy Strategies and Tools: Finan-cial Stability Considerations,” Finance and economics Discussion Series 2020-074 (washington: Board of Governors of the Federal reserve System, august), https://dx.doi.org/10.17016/FeDS.2020.074.
Vulnerabilities from Asset Valuations (continued)

FINaNCIaL STaBILITY rePorT: maY 2021 19
Commercial real estate valuation pressures appear to remain high
Disruptions caused by the pandemic continue to make it difficult to assess valuations in the CRE sector. Since the November report, CRE price indexes based on transactions recovered from their decline early last year, suggesting elevated pressures (figure 1-12). Furthermore, capitalization rates, which measure annual income relative to prices of commercial prop-erties, have continued to tick down (figure 1-13). However, other measures suggest market participants perceive values as having fallen over the past year. For example, an index of the prices of CRE properties administered by real estate investment trusts (REITs), which supplements observed transactions with appraisal information, remains below pre- pandemic levels.7 Similarly, stock prices of REITs that invest in harder-hit commercial property sectors have increased since November but generally remain below their respective pre-pandemic levels.
Other indicators continue to show strains in CRE markets. Vacancy rates continue to increase, and rent growth has declined fur-ther. Additionally, delinquency rates on com-mercial mortgage-backed securities (CMBS), which usually contain riskier loans, remain elevated. Finally, the January Senior Loan Officer Opinion Survey on Bank Lending Practices (SLOOS) indicated that banks, on net, reported weaker demand for most CRE loans and tighter lending standards in the fourth quarter of 2020 (figure 1-14).
7 The Green Street price index remained below its pre-pandemic level in February. This index is appraisal based, using both sales and nonsales information to track prices of properties managed by REITs.
40
60
80
100
120
140
160
180
200
1997 2001 2005 2009 2013 2017 2021
Jan. 2001 = 100
equal-weightedvalue-weighted
monthly
Feb.
1-12. Commercial real estate Prices (real)
Source: CoStar Group, Inc., CoStar Commercial repeat Sale Indices; Bureau of Labor Statistics, consumer price index via Haver analytics.
5.5
6.0
6.5
7.0
7.5
8.0
8.5
9.0
9.5
10.0
2001 2005 2009 2013 2017 2021
monthly
Percent
Feb.
1-13. Capitalization rate at Property Purchase
Source: real Capital analytics; andrew C. Florance, Norm G. miller, ruijue Peng, and Jay Spivey (2010), “Slicing, Dicing, and Scoping the Size of the u.S. Commercial real estate market,” Journal of Real Estate Portfolio Management, vol. 16 (may–august), pp. 101–18.
−100−80−60−40−20
020406080
100
2000 2004 2008 2012 2016 2020
Net percentage of banks reporting
eas
ing
Ti
ghte
ning
Q4
Quarterly
1-14. Change in Bank Standards for Commercial real estate Loans
Source: Federal reserve Board (FrB), Senior Loan officer opinion Survey on Bank Lending Practices; FrB staff calculations.
20 Asset VAluAtions
Farmland prices remain high relative to rents
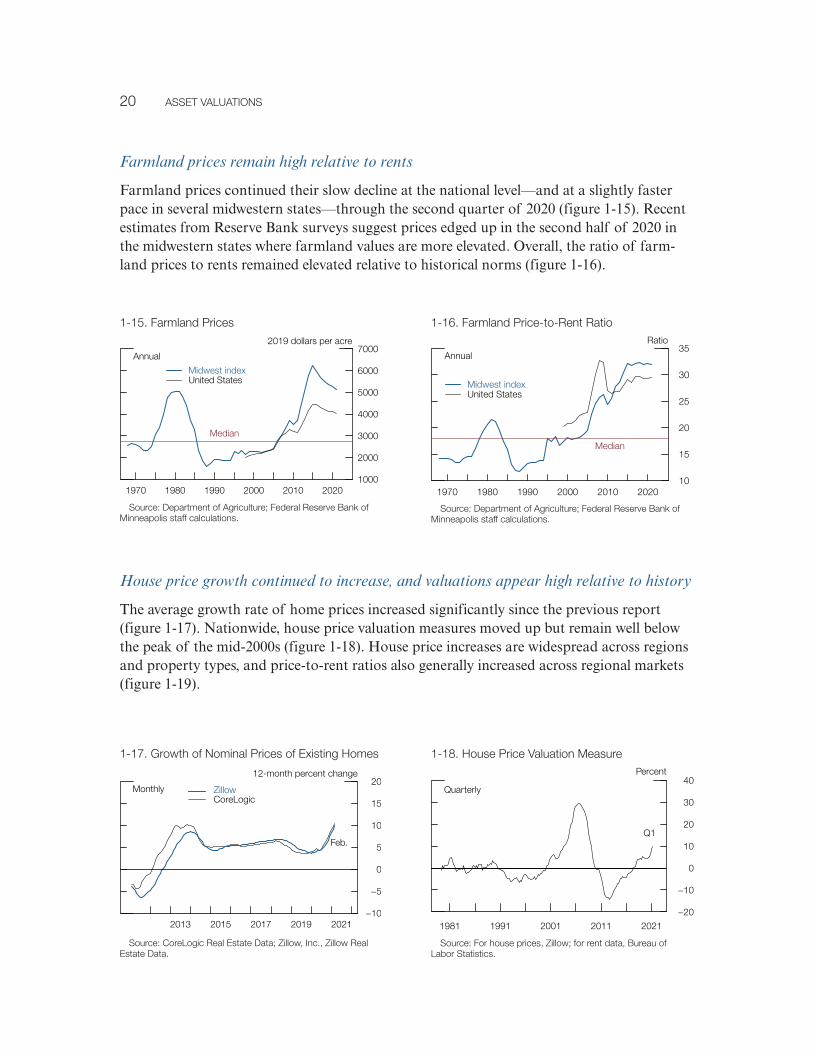
Farmland prices continued their slow decline at the national level—and at a slightly faster pace in several midwestern states—through the second quarter of 2020 (figure 1-15). Recent estimates from Reserve Bank surveys suggest prices edged up in the second half of 2020 in the midwestern states where farmland values are more elevated. Overall, the ratio of farm-land prices to rents remained elevated relative to historical norms (figure 1-16).
House price growth continued to increase, and valuations appear high relative to history
The average growth rate of home prices increased significantly since the previous report (figure 1-17). Nationwide, house price valuation measures moved up but remain well below the peak of the mid-2000s (figure 1-18). House price increases are widespread across regions and property types, and price-to-rent ratios also generally increased across regional markets (figure 1-19).
1000
2000
3000
4000
5000
6000
7000
1970 1980 1990 2000 2010 2020
Annual
2019 dollars per acre
Median
Midwest indexunited states
1-15. Farmland Prices
source: Department of Agriculture; Federal Reserve Bank of Minneapolis staff calculations.
10
15
20
25
30
35
1970 1980 1990 2000 2010 2020
Annual
Ratio
Median
Midwest indexunited states
1-16. Farmland Price-to-Rent Ratio
source: Department of Agriculture; Federal Reserve Bank of Minneapolis staff calculations.
−10
−5
0
5
10
15
20
2013 2015 2017 2019 2021
Monthly
12-month percent change
ZillowCorelogic
Feb.
1-17. Growth of nominal Prices of existing Homes
source: Corelogic Real estate Data; Zillow, inc., Zillow Real estate Data.
−20
−10
0
10
20
30
40
1981 1991 2001 2011 2021
Quarterly
Percent
Q1
1-18. House Price Valuation Measure
source: For house prices, Zillow; for rent data, Bureau of labor statistics.

FINaNCIaL STaBILITY rePorT: maY 2021 21
Low levels of interest rates have likely supported robust housing demand. However, down-side risks to the sector remain, given the unusually large number of mortgage loans in for-bearance programs and the uncertainty around their ultimate repayment.
1-19. Selected Local Housing Price-to-rent ratio Indexes
Source: For house prices, Zillow; for rent data, Bureau of Labor Statistics.
406080
100120140160180200220240
1997 1999 2001 2003 2005 2007 2009 2011 2013 2015 2017 2019 2021
Jan. 2010 = 100
Feb.
monthlyPhoenixmiamiLos angelesmedianmiddle 80 percent of markets


23
Vulnerabilities from business and household debt have continued to fall since the November report, reflecting continued government support; nonetheless, business-sector debt outstanding remains high relative to income
Vulnerabilities arising from business debt remain elevated, although they have fallen since the middle of last year. Business debt outstanding changed very little in the second half of 2020, and recovering earnings and the low level of interest rates have generally aided businesses’ ability to carry debt. Smaller businesses, some of which continue to face significant financial strains, have been supported by government programs, including the Paycheck Protection Program (PPP), which was bolstered in part by funding from the Federal Reserve’s Paycheck Protection Program Liquidity Facility (PPPLF).
Vulnerabilities arising from household debt are modest. Household borrowing has remained heavily concentrated among borrowers with high credit scores. Government actions taken in response to the pandemic have provided significant support to household balance sheets and incomes, with many households saving more and holding more liquid assets. Still, some households continue to face significant financial stresses.
Table 2 shows the amounts outstanding and recent historical growth rates of forms of debt owed by nonfinancial businesses and households as of the end of 2020. Total outstanding private credit was split about evenly between businesses and households, with businesses owing $17.7 trillion and households owing $16.6 trillion. While business debt increased 9.1 percent, on net, over 2020, roughly one-third, or about $425 billion, of this net increase consists of outstanding PPP loans that may be forgiven over coming quarters.
The ratio of total nonfinancial debt to gross domestic product remains above its trend
For several years before the pandemic, the combined total debt owed by businesses and households grew at a pace similar to that of nominal GDP. In the first half of 2020, strong business borrowing and a precipitous drop in GDP pushed the credit-to-GDP ratio to his-torical highs. In the second half of 2020, this ratio fell markedly, as GDP partially rebounded and business debt was little changed (figure 2-1). The household debt-to-GDP ratio also declined sharply later in the year, returning to its pre-pandemic range (figure 2-2).
The ratio of business debt to gross domestic product declined in the second half of 2020
Business debt increased little in the second half of 2020, while nominal GDP grew 10 percent over the same period. Firms paid down their earlier pandemic-driven draws on credit lines, and loan originations fell. A decline in net bond issuance further moderated the increase in business debt in the fourth quarter (figure 2-3). Except in some hard-hit industries, credit-line drawdowns have returned to normal levels. Reduced outlays, recovering profits,
2. Borrowing by Businesses and Households

24 BorrowING BY BuSINeSSeS aND HouSeHoLDS
Table 2. Outstanding Amounts of Nonfinancial Business and Household Credit
ItemOutstanding
(billions of dollars)
Growth, 2019:Q4–2020:Q4
(percent)
Average annual growth, 1997–2020:Q4
(percent)
Total private nonfinancial credit 34,359 6.6 5.6
Total nonfinancial business credit 17,719 9.1 5.9
Corporate business credit 11,145 10.1 5.2
Bonds and commercial paper 7,257 10.4 5.8
Bank lending 1,519 8.8 3.0
Leveraged loans* 1,133 0 14.4
Noncorporate business credit 6,574 7.5 7.3
Commercial real estate credit 2,597 4.4 6.1
Total household credit 16,640 4.1 5.3
mortgages 10,935 4.4 5.5
Consumer credit 4,178 –.1 5.0
Student loans 1,707 3.7 8.9
auto loans 1,225 3.2 4.9
Credit cards 975 –11.2 2.9
Nominal GDP 21,495 .5 4.0
Note: The data extend through 2020:Q4. Growth rates are measured from Q4 of the year immediately preceding the period through Q4 of the final year of the period. The table reports the main components of corporate business credit, total household credit, and consumer credit. other, smaller components are not reported. The commercial real estate (Cre) row shows Cre debt owed by both corporate and noncorporate businesses. The total household-sector credit includes debt owed by other entities, such as nonprofit organizations. GDP is gross domestic product.
* Leveraged loans included in this table are an estimate of the leveraged loans that are made to nonfinancial businesses only and do not include the small amount of leveraged loans outstanding for financial businesses. The amount outstanding shows institutional leveraged loans and generally excludes loan commitments held by banks. For example, lines of credit are generally excluded from this measure. The average annual growth rate shown for leveraged loans is computed from 2000 to 2020:Q4, as this market was fairly small before 2000.
Source: For leveraged loans, S&P Global, Leveraged Commentary & Data; for GDP, Bureau of economic analysis, national income and product accounts; for all other items, Federal reserve Board, Statistical release Z.1, “Financial accounts of the united States.”
0.8
1.1
1.4
1.7
2.0
1981 1984 1987 1990 1993 1996 1999 2002 2005 2008 2011 2014 2017 2020
Quarterly
ratio
Q4
2-1. Private Nonfinancial-Sector Credit-to-GDP ratio
Source: Federal reserve Board staff calculations based on Bureau of economic analysis, national income and product accounts, and Federal reserve Board, Statistical release Z.1, “Financial accounts of the united States.”

FINaNCIaL STaBILITY rePorT: maY 2021 25
slow share repurchases, and funds raised through corporate bond issuance contributed to firms’ holdings of liquid assets. Moreover, low interest rates continued to mitigate, to some degree, investor concerns about default risk arising from high leverage. Meanwhile, the net issuance of riskier forms of business debt—high-yield bonds and institutional lev-eraged loans—was solid, on average, over the past three quarters (figure 2-4).
2-4. Net Issuance of risky Business Debt
−60
−40
−20
0
20
40
60
80
100
120
2005 2007 2009 2011 2013 2015 2017 2019 2021
Quarterly
Billions of dollars
Q1
Institutional leveraged loansHigh-yield and unrated bonds
Source: mergent, Fixed Income Securities Database; S&P Global, Leveraged Commentary & Data.
0.3
0.4
0.5
0.6
0.7
0.8
0.9
1.0
1.1
0.4
0.5
0.6
0.7
0.8
0.9
1.0
1981 1984 1987 1990 1993 1996 1999 2002 2005 2008 2011 2014 2017 2020
Quarterly
ratioratio
Nonfinancial business (right scale)Household (left scale)
Q4
2-2. Nonfinancial Business- and Household-Sector Credit-to-GDP ratios
Source: Federal reserve Board staff calculations based on Bureau of economic analysis, national income and product accounts, and Federal reserve Board, Statistical release Z.1, “Financial accounts of the united States.”
−10
−5
0
5
10
15
20
2002 2008 2014 2020
Quarterly
Percent change, annual rate
Q4
2-3. Growth of real aggregate Debt of the Business Sector
Source: Federal reserve Board, Statistical release Z.1, “Financial accounts of the united States.”
Business debt vulnerabilities remain elevated
As the growth in outstanding debt slowed appreciably, an indicator of the leverage of large businesses—the ratio of debt to assets for all publicly traded nonfinancial firms—declined significantly in the second half of 2020 but still remains modestly above levels seen leading
26 BorrowING BY BuSINeSSeS aND HouSeHoLDS
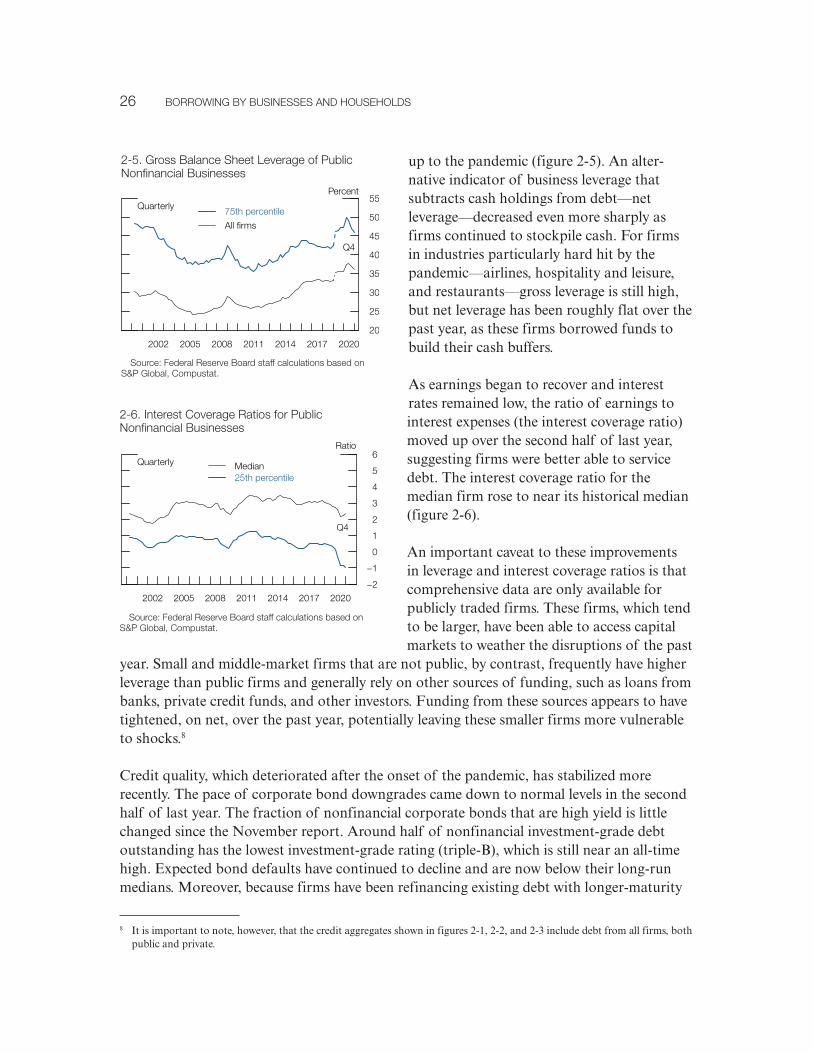
up to the pandemic (figure 2-5). An alter-native indicator of business leverage that subtracts cash holdings from debt—net leverage—decreased even more sharply as firms continued to stockpile cash. For firms in industries particularly hard hit by the pandemic—airlines, hospitality and leisure, and restaurants—gross leverage is still high, but net leverage has been roughly flat over the past year, as these firms borrowed funds to build their cash buffers.
As earnings began to recover and interest rates remained low, the ratio of earnings to interest expenses (the interest coverage ratio) moved up over the second half of last year, suggesting firms were better able to service debt. The interest coverage ratio for the median firm rose to near its historical median (figure 2-6).
An important caveat to these improvements in leverage and interest coverage ratios is that comprehensive data are only available for publicly traded firms. These firms, which tend to be larger, have been able to access capital markets to weather the disruptions of the past
year. Small and middle-market firms that are not public, by contrast, frequently have higher leverage than public firms and generally rely on other sources of funding, such as loans from banks, private credit funds, and other investors. Funding from these sources appears to have tightened, on net, over the past year, potentially leaving these smaller firms more vulnerable to shocks.8
Credit quality, which deteriorated after the onset of the pandemic, has stabilized more recently. The pace of corporate bond downgrades came down to normal levels in the second half of last year. The fraction of nonfinancial corporate bonds that are high yield is little changed since the November report. Around half of nonfinancial investment-grade debt outstanding has the lowest investment-grade rating (triple-B), which is still near an all-time high. Expected bond defaults have continued to decline and are now below their long-run medians. Moreover, because firms have been refinancing existing debt with longer-maturity
8 It is important to note, however, that the credit aggregates shown in figures 2-1, 2-2, and 2-3 include debt from all firms, both public and private.
20
25
30
35
40
45
50
55
2002 2005 2008 2011 2014 2017 2020
Quarterly
Percent
75th percentile
all firms
Q4
2-5. Gross Balance Sheet Leverage of Public Nonfinancial Businesses
Source: Federal reserve Board staff calculations based on S&P Global, Compustat.
−2
−1
0
1
2
3
4
5
6
2002 2005 2008 2011 2014 2017 2020
Quarterly
ratio
Q4
median25th percentile
2-6. Interest Coverage ratios for Public Nonfinancial Businesses
Source: Federal reserve Board staff calculations based on S&P Global, Compustat.

FINaNCIaL STaBILITY rePorT: maY 2021 27
bonds at low interest rates, only about 5 percent of outstanding bonds rated triple-B and about 3 percent of outstanding speculative-grade bonds mature within one year.
Expected default rates on leveraged loans have fallen, although underwriting standards appear to have weakened. The default rate on leveraged loans increased rapidly early in the pandemic but has declined since last summer (figure 2-7). Additionally, downgrades of leveraged loans have slowed significantly over the same period, returning to their pre- pandemic pace. However, the share of newly issued loans to large corporations with high leverage—defined as those with ratios of debt to earnings before interest, taxes, depreciation, and amortization greater than 6—has exceeded the historical highs reached in recent years (figure 2-8).
Vulnerabilities from debt owed by small businesses have decreased, but many small businesses remain financially strained
While many small businesses closed or significantly scaled back their operations as a result of measures to contain the pandemic, credit quality for the small businesses that have con-tinued operating or reopened has stabilized in recent months. Short-term loan delinquencies have declined notably since last summer, and long-term delinquencies have also ticked down, indicating an improvement in firms’ balance sheets. Loans extended under the PPP have provided financial support to many small businesses. Liquidity provided through the PPPLF continues to facilitate PPP lending, particularly among smaller lenders (see the box “The Paycheck Protection Program Liquidity Facility”). With pandemic-related restrictions on business operations continuing to be lifted, survey evidence suggests that a declining, though still sizable, share of small firms expect to need additional financial assistance.
Stresses on households have decreased, although some households remain vulnerable
Over the past year, an unprecedented number of households experienced significantly lower earnings due to business closures and unemployment stemming from the COVID-19 pan-
−2
0
2
4
6
8
10
12
14
2000 2003 2006 2009 2012 2015 2018 2021
Percent
mar.
monthly
2-7. Default rates of Leveraged Loans
Source: S&P Global, Leveraged Commentary & Data.
0
20
40
60
80
100
120
140
160
2002 2005 2008 2011 2014 2017 2020
Percent
Debt multiples ≥ 6xDebt multiples 5x−5.99xDebt multiples 4x−4.99xDebt multiples < 4x Q4
2-8. Distribution of Large Institutional Leveraged Loan volumes, by Debt-to-eBITDa ratio
Source: mergent, Fixed Income Securities Database; S&P Global, Leveraged Commentary & Data.
28 BorrowING BY BuSINeSSeS aND HouSeHoLDS
demic. Job losses were heavily concentrated among the most financially vulnerable, including many lower-wage workers and racial and ethnic minorities.
The financial positions of many households appear to have improved since the previous Financial Stability Report, supported by a stronger economy. Household incomes and bal-ance sheets have also been broadly and significantly supported by fiscal programs—including the expanded unemployment insurance and direct stimulus payments in the Consolidated Appropriations Act, 2021, and the American Rescue Plan Act of 2021—and by forbearance programs that have allowed many households to delay loan payments. In the second half of 2020, aggregate household cash and checkable deposits nearly doubled from about $1.6 tril-lion to roughly $3 trillion, with notable increases apparent across the income distribution. Still, some households remain financially strained and more vulnerable to future shocks.
Borrowing by households has continued rising at a modest pace
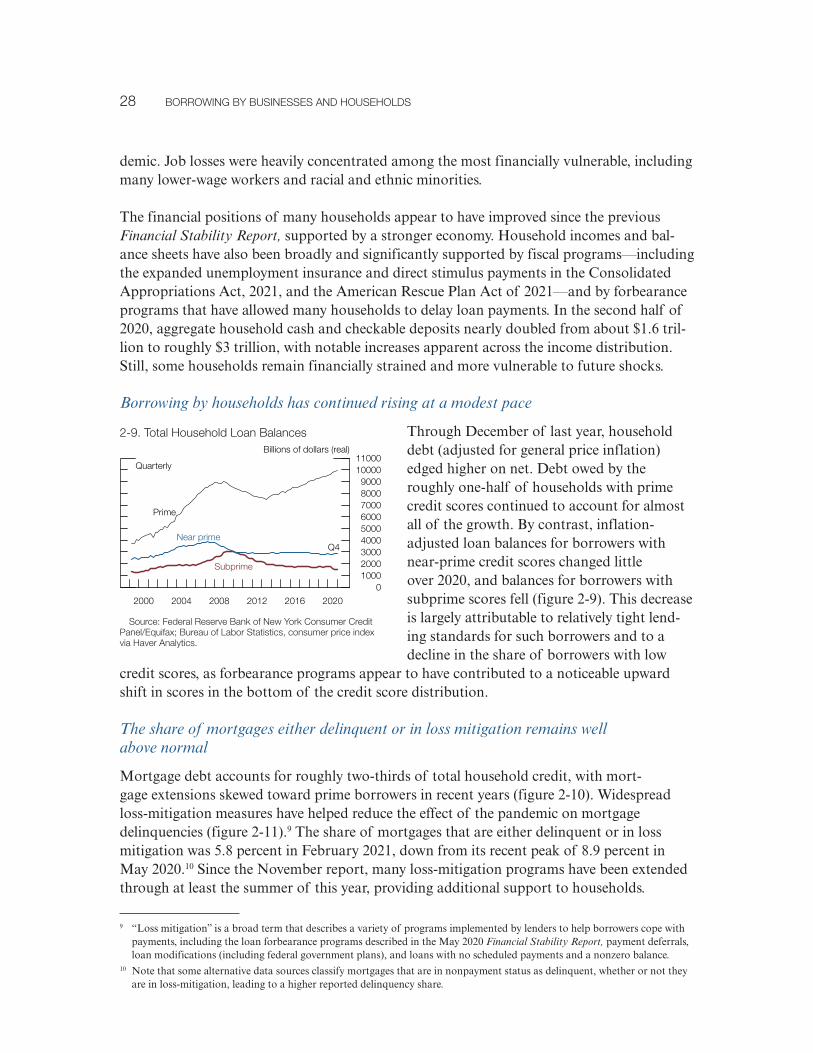
Through December of last year, household debt (adjusted for general price inflation) edged higher on net. Debt owed by the roughly one-half of households with prime credit scores continued to account for almost all of the growth. By contrast, inflation- adjusted loan balances for borrowers with near-prime credit scores changed little over 2020, and balances for borrowers with subprime scores fell (figure 2-9). This decrease is largely attributable to relatively tight lend-ing standards for such borrowers and to a decline in the share of borrowers with low
credit scores, as forbearance programs appear to have contributed to a noticeable upward shift in scores in the bottom of the credit score distribution.
The share of mortgages either delinquent or in loss mitigation remains well above normal
Mortgage debt accounts for roughly two-thirds of total household credit, with mort-gage extensions skewed toward prime borrowers in recent years (figure 2-10). Widespread loss-mitigation measures have helped reduce the effect of the pandemic on mortgage delinquencies (figure 2-11).9 The share of mortgages that are either delinquent or in loss mitigation was 5.8 percent in February 2021, down from its recent peak of 8.9 percent in May 2020.10 Since the November report, many loss-mitigation programs have been extended through at least the summer of this year, providing additional support to households.
9 “Loss mitigation” is a broad term that describes a variety of programs implemented by lenders to help borrowers cope with payments, including the loan forbearance programs described in the May 2020 Financial Stability Report, payment deferrals, loan modifications (including federal government plans), and loans with no scheduled payments and a nonzero balance.
10 Note that some alternative data sources classify mortgages that are in nonpayment status as delinquent, whether or not they are in loss-mitigation, leading to a higher reported delinquency share.
0100020003000400050006000700080009000
1000011000
2000 2004 2008 2012 2016 2020
Billions of dollars (real)
Quarterly
Prime
Q4Near prime
Subprime
2-9. Total Household Loan Balances
Source: Federal reserve Bank of New York Consumer Credit Panel/equifax; Bureau of Labor Statistics, consumer price index via Haver analytics.

FINaNCIaL STaBILITY rePorT: maY 2021 29
Borrowers still in mortgage forbearance may be more vulnerable to the end of government support as well as to adverse shocks. Survey evidence suggests that these borrowers are more likely to be employed in industries hard hit by the pandemic, to have suffered income losses in the past year, and to be delinquent or in forbearance on other forms of debt. Even so, a large fraction of borrowers have already exited forbearance—in general, these borrowers have loans that are either current or paid off.
At the same time, the significant growth in house prices over the past year, noted earlier in this report, has contributed to the very low estimated share of outstanding mortgages with negative equity (figure 2-12). The ratio of outstanding mortgage debt to home values at the end of last year remains at a modest level (figure 2-13).
Consumer credit edged down
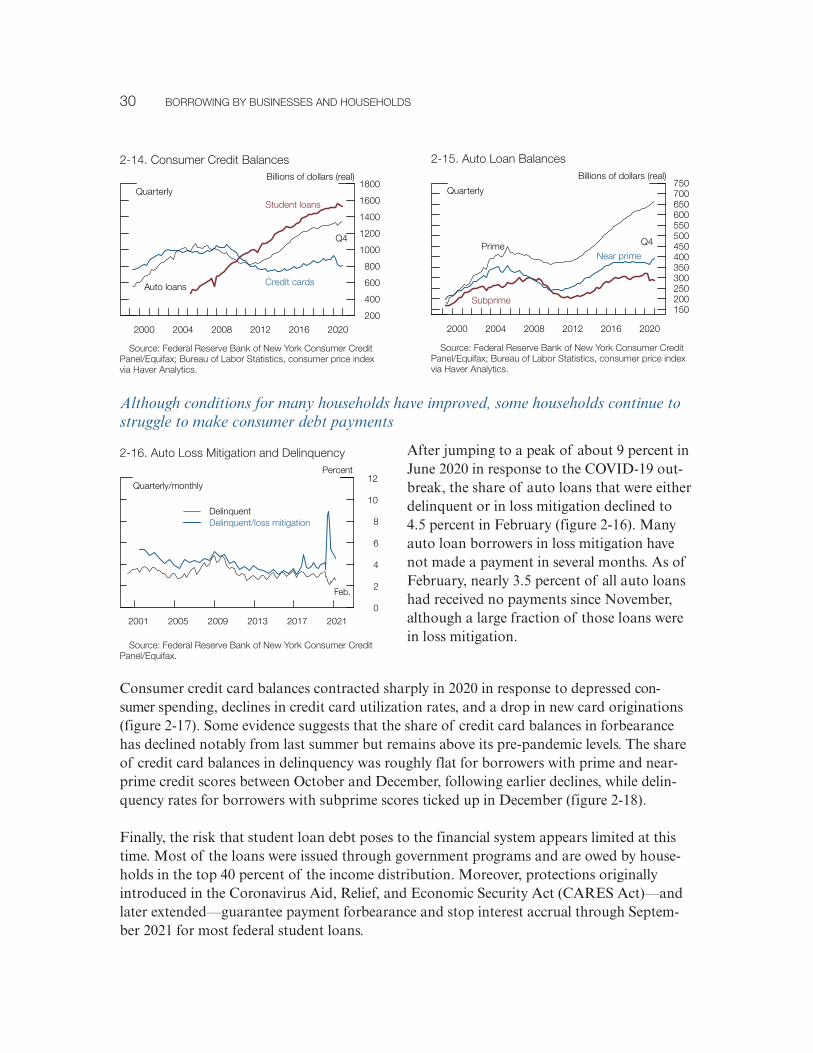
Most of the remaining one-third of total debt owed by households is consumer credit, which consists mainly of student loans, auto loans, and credit card debt (figure 2-14). Table 2 shows that consumer credit edged down in 2020 and currently stands at a little more than $4 trillion. Auto loan balances expanded moderately, on net, over 2020, driven entirely by borrowers with prime and near-prime credit scores (figure 2-15).
0
200
400
600
800
1000
1200
1400Billions of dollars (real)
2002 2005 2008 2011 2014 2017 2020
annual SubprimeNear primePrime
2-10. estimates of New mortgage volumes to Households
Source: Federal reserve Bank of New York Consumer Credit Panel/equifax; Bureau of Labor Statistics, consumer price index via Haver analytics.
0
2
4
6
8
10
12
14
2003 2009 2015 2021
Percent
DelinquentDelinquent/loss mitigation
Feb.
Quarterly/monthly
2-11. mortgage Loss mitigation and Delinquency
Source: Federal reserve Bank of New York Consumer Credit Panel/equifax.
0
10
20
30
40
2012 2014 2016 2018 2020
Percent
Dec.
Q4
ZillowCoreLogic
2-12. estimates of mortgages with Negative equity
Source: CoreLogic real estate Data; Zillow, Inc., Zillow real estate Data.
60
80
100
120
140
160
180
2000 2004 2008 2012 2016 2020
Quarterly
1999:Q1 = 100
Q4
relative to model-implied valuesrelative to market value
2-13. estimates of Housing Leverage
Source: Federal reserve Bank of New York Consumer Credit Panel/equifax; CoreLogic; Bureau of Labor Statistics via Haver analytics.
30 BorrowING BY BuSINeSSeS aND HouSeHoLDS
Although conditions for many households have improved, some households continue to struggle to make consumer debt payments
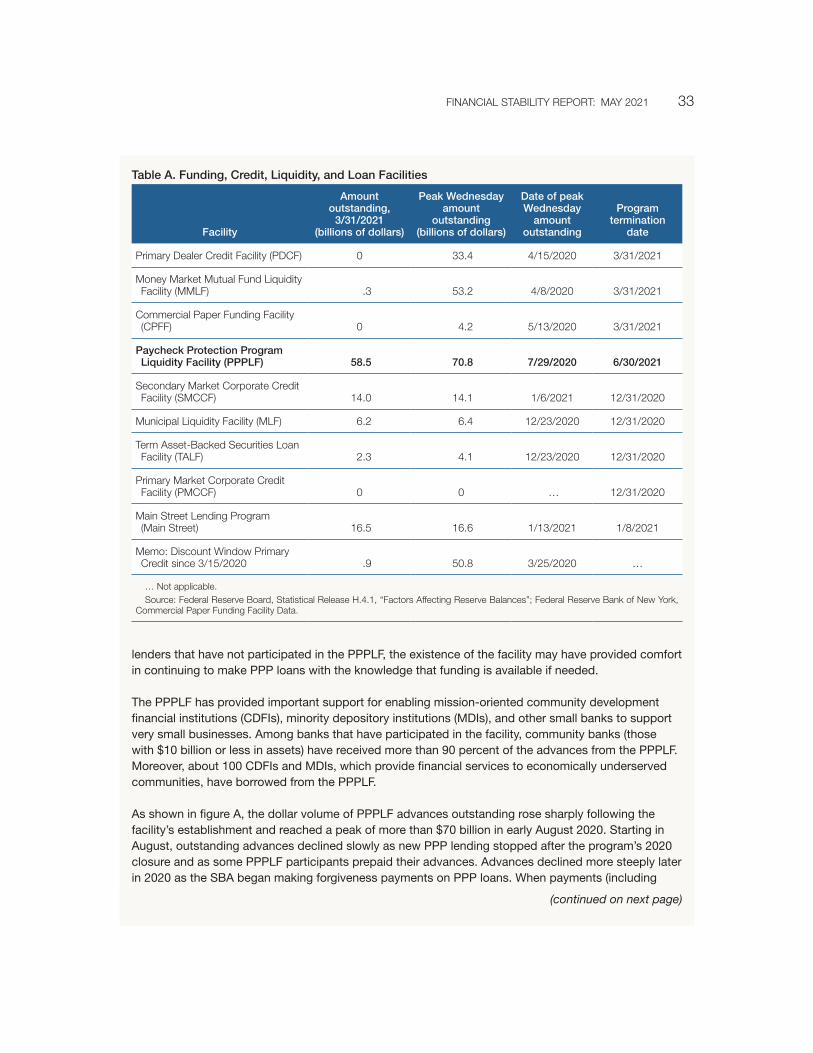
After jumping to a peak of about 9 percent in June 2020 in response to the COVID-19 out-break, the share of auto loans that were either delinquent or in loss mitigation declined to 4.5 percent in February (figure 2-16). Many auto loan borrowers in loss mitigation have not made a payment in several months. As of February, nearly 3.5 percent of all auto loans had received no payments since November, although a large fraction of those loans were in loss mitigation.
Consumer credit card balances contracted sharply in 2020 in response to depressed con-sumer spending, declines in credit card utilization rates, and a drop in new card originations (figure 2-17). Some evidence suggests that the share of credit card balances in forbearance has declined notably from last summer but remains above its pre-pandemic levels. The share of credit card balances in delinquency was roughly flat for borrowers with prime and near-prime credit scores between October and December, following earlier declines, while delin-quency rates for borrowers with subprime scores ticked up in December (figure 2-18).
Finally, the risk that student loan debt poses to the financial system appears limited at this time. Most of the loans were issued through government programs and are owed by house-holds in the top 40 percent of the income distribution. Moreover, protections originally introduced in the Coronavirus Aid, Relief, and Economic Security Act (CARES Act)—and later extended—guarantee payment forbearance and stop interest accrual through Septem-ber 2021 for most federal student loans.
0
2
4
6
8
10
12
2001 2005 2009 2013 2017 2021
Percent
DelinquentDelinquent/loss mitigation
Feb.
Quarterly/monthly
2-16. auto Loss mitigation and Delinquency
Source: Federal reserve Bank of New York Consumer Credit Panel/equifax.
150200250300350400450500550600650700750
2000 2004 2008 2012 2016 2020
Billions of dollars (real)
Quarterly
Prime Q4
Near prime
Subprime
2-15. auto Loan Balances
Source: Federal reserve Bank of New York Consumer Credit Panel/equifax; Bureau of Labor Statistics, consumer price index via Haver analytics.
200
400
600
800
1000
1200
1400
1600
1800
2000 2004 2008 2012 2016 2020
Quarterly
Billions of dollars (real)
Student loans
auto loans Credit cards
Q4
2-14. Consumer Credit Balances
Source: Federal reserve Bank of New York Consumer Credit Panel/equifax; Bureau of Labor Statistics, consumer price index via Haver analytics.

FINaNCIaL STaBILITY rePorT: maY 2021 31
50
100
150
200
250
300
350
400
450
500
2000 2004 2008 2012 2016 2020
Quarterly
Billions of dollars (real)
Prime
Q4Near prime
Subprime
2-17. Credit Card Balances
Source: Federal reserve Bank of New York Consumer Credit Panel/equifax; Bureau of Labor Statistics, consumer price index via Haver analytics.
0
5
10
15
20
25
30
2002 2008 2014 2020
Quarterly
Percent
Q4
PrimeNear prime
Subprime
2-18. Credit Card Delinquency rates
Source: Federal reserve Bank of New York Consumer Credit Panel/equifax.

32 BorrowING BY BuSINeSSeS aND HouSeHoLDS
The Paycheck Protection Program Liquidity Facility
The PPP was established at the outset of the pandemic by the CARES Act to provide payroll support to small businesses and other small organizations. Under the PPP, lenders make loans that are guaran-teed by the Small Business Administration (SBA) and are forgivable if the borrower uses the proceeds to keep workers on its payroll and to pay related expenses. The PPP opened on April 3, 2020, and closed on August 8, 2020. Following the enactment of the Economic Aid to Hard-Hit Small Businesses, Nonprofi ts, and Venues Act (Economic Aid Act), the PPP reopened on January 11, 2021, and the SBA will stop receiving applications for PPP loans on May 31, 2021. Through March 28, 2021, the SBA has approved 8.7 million PPP loans totaling $734 billion.
On April 9, 2020, the Federal Reserve, with the approval of the Secretary of the Treasury, announced the establishment of the PPPLF as an emergency lending program under section 13(3) of the Fed-eral Reserve Act. The PPPLF was designed to bolster the effectiveness of the PPP by supplying liquidity to SBA-approved PPP lenders and to increase those lenders’ capacity and confi dence to make PPP loans. On April 16, 2020, the PPPLF began operations by making advances to banks.1 On April 30, 2020, the Federal Reserve expanded the PPPLF to include all PPP lenders, including nonbanks.
Under the PPPLF, the Federal Reserve provides nonrecourse advances to PPP lenders that pledge PPP loans. As PPP loans are fully guaranteed by the SBA, the PPPLF takes the PPP loans as collateral at face value. The terms of the PPPLF that provide support to the PPP include the following:
• The PPPLF provides complete, risk-free, matched-maturity funding for pledged PPP loans.
• PPP lenders may obtain PPPLF funding for whole PPP loans that they have purchased as well as those that they originated.
• For banks, PPP loans receive a 0 percent risk weight under risk-based capital rules, and PPP loans that are pledged to the PPPLF are excluded from leverage ratio calculations.2
The PPPLF was originally scheduled to terminate on September 30, 2020; the termination date has since been extended to June 30, 2021.
PPPLF program usage
As shown in table A, the PPPLF has been the most heavily used of the emergency lending facilities established by the Federal Reserve to support the continued fl ow of credit to households, businesses, and state and local governments during the pandemic.3 More than 850 PPP lenders—from all 50 states and the District of Columbia and including almost 70 nonbanks—have taken out PPPLF advances . For
1 as used here, the term “banks” consists of all types of depository institutions, including savings associations and credit unions.2 For more information on the regulatory capital effects of banks’ participation in the PPPLF, see Board of Governors of the Federal
reserve System, Federal Deposit Insurance Corporation, and office of the Comptroller of the Currency (2020), “Federal Bank regu-lators Issue Interim Final rule for Paycheck Protection Program Facility,” joint press release, april 9, https://www.federalreserve.gov/newsevents/pressreleases/bcreg20200409a.htm.
3 more information on the other Federal reserve facilities is available on the Board’s website at https://www.federalreserve.gov/funding-credit-liquidity-and-loan-facilities.htm.
(continued)
FINaNCIaL STaBILITY rePorT: maY 2021 33
lenders that have not participated in the PPPLF, the existence of the facility may have provided comfort in continuing to make PPP loans with the knowledge that funding is available if needed.
The PPPLF has provided important support for enabling mission-oriented community development fi nancial institutions (CDFIs), minority depository institutions (MDIs), and other small banks to support very small businesses. Among banks that have participated in the facility, community banks (those with $10 billion or less in assets) have received more than 90 percent of the advances from the PPPLF. Moreover, about 100 CDFIs and MDIs, which provide fi nancial services to economically underserved communities, have borrowed from the PPPLF.
As shown in fi gure A, the dollar volume of PPPLF advances outstanding rose sharply following the facility’s establishment and reached a peak of more than $70 billion in early August 2020. Starting in August, outstanding advances declined slowly as new PPP lending stopped after the program’s 2020 closure and as some PPPLF participants prepaid their advances. Advances declined more steeply later in 2020 as the SBA began making forgiveness payments on PPP loans. When payments (including
Facility
Amountoutstanding,
3/31/2021(billions of dollars)
Peak Wednesday amount
outstanding(billions of dollars)
Date of peak Wednesday
amountoutstanding
Programtermination
date
Primary Dealer Credit Facility (PDCF) 0 33.4 4/15/2020 3/31/2021
money market mutual Fund Liquidity Facility (mmLF) .3 53.2 4/8/2020 3/31/2021
Commercial Paper Funding Facility (CPFF) 0 4.2 5/13/2020 3/31/2021
Paycheck Protection Program Liquidity Facility (PPPLF) 58.5 70.8 7/29/2020 6/30/2021
Secondary market Corporate Credit Facility (SmCCF) 14.0 14.1 1/6/2021 12/31/2020
municipal Liquidity Facility (mLF) 6.2 6.4 12/23/2020 12/31/2020
Term asset-Backed Securities Loan Facility (TaLF) 2.3 4.1 12/23/2020 12/31/2020
Primary market Corporate Credit Facility (PmCCF) 0 0 … 12/31/2020
main Street Lending Program (main Street) 16.5 16.6 1/13/2021 1/8/2021
memo: Discount window Primary Credit since 3/15/2020 .9 50.8 3/25/2020 …
… Not applicable. Source: Federal reserve Board, Statistical release H.4.1, “Factors affecting reserve Balances”; Federal reserve Bank of New York,
Commercial Paper Funding Facility Data.
Table A. Funding, Credit, Liquidity, and Loan Facilities
(continued on next page)
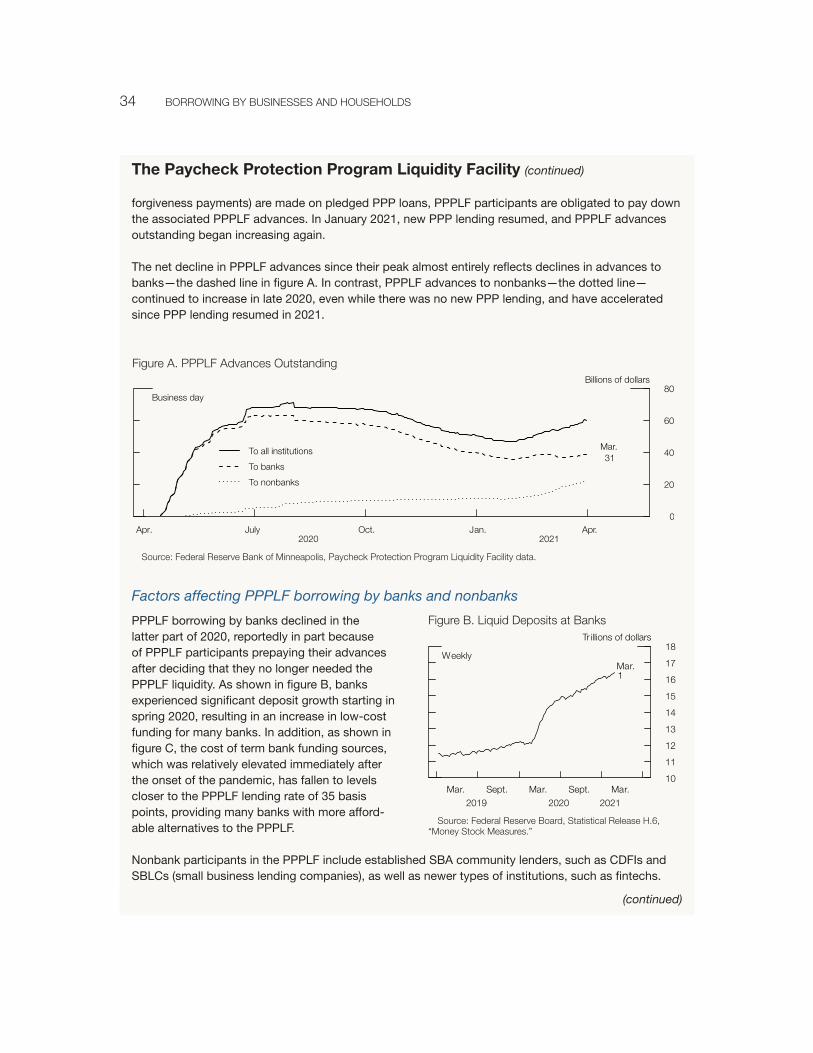
34 BorrowING BY BuSINeSSeS aND HouSeHoLDS
forgiveness payments) are made on pledged PPP loans, PPPLF participants are obligated to pay down the associated PPPLF advances. In January 2021, new PPP lending resumed, and PPPLF advances outstanding began increasing again.
The net decline in PPPLF advances since their peak almost entirely refl ects declines in advances to banks—the dashed line in fi gure A. In contrast, PPPLF advances to nonbanks—the dotted line— continued to increase in late 2020, even while there was no new PPP lending, and have accelerated since PPP lending resumed in 2021.
Factors affecting PPPLF borrowing by banks and nonbanks
PPPLF borrowing by banks declined in the latter part of 2020, reportedly in part because of PPPLF participants prepaying their advances after deciding that they no longer needed the PPPLF liquidity. As shown in fi gure B, banks experienced signifi cant deposit growth starting in spring 2020, resulting in an increase in low-cost funding for many banks. In addition, as shown in fi gure C, the cost of term bank funding sources, which was relatively elevated immediately after the onset of the pandemic, has fallen to levels closer to the PPPLF lending rate of 35 basis points, providing many banks with more afford-able alternatives to the PPPLF.
Nonbank participants in the PPPLF include established SBA community lenders, such as CDFIs and SBLCs (small business lending companies), as well as newer types of institutions, such as fi ntechs.
(continued)
The Paycheck Protection Program Liquidity Facility (continued)
10
11
12
13
14
15
16
17
18
Mar. Sept. Mar. Sept. Mar.2019 2020 2021
Weekly
Tr illions of dollars
Mar.1
Figure B. Liquid Deposits at Banks
Source: Federal reserve Board, Statistical release H.6, “money Stock measures.”
Figure a. PPPLF advances outstanding
0
20
40
60
80
Apr. July Oct. Jan. Apr.2020 2021
Business day
Billions of dollars
To all institutions
To banks
To nonbanks
Mar.31
Source: Federal reserve Bank of minneapolis, Paycheck Protection Program Liquidity Facility data.

FINaNCIaL STaBILITY rePorT: maY 2021 35
Nonbanks are important PPP lenders, as they may reach businesses that banks are not serving, such as very small businesses or businesses in economically distressed areas, and their average PPP loan size is signifi cantly smaller than that of banks. Nonbanks typically lack the funding base and access to funding sources that banks enjoy, making access to the PPPLF potentially important for their ability to make PPP loans. The lack of funding alternatives is likely an important reason why nonbank PPPLF borrowing has continued to increase.
Figure C. Bank Term Funding alternatives
COVID-19 onset
Apr. July Oct. Jan. Apr.2020 2021
Weekly average
Percent
Mar.29
1 year
2 years
PPPLF rate
Fed funds target range (lower bound)
0.0
0.2
0.4
0.6
0.8
1.0
1.2
1.4
1.6
Source: Bloomberg Finance L.P.; Federal Home Loan Bank of Des moines.


37
Table 3. Size of Selected Sectors of the Financial System, by Types of Institutions and Vehicles
ItemTotal assets
(billions of dollars)
Growth, 2019:Q4–2020:Q4
(percent)
Average annual growth, 1997–2020:Q4
(percent)
Banks and credit unions 23,454 17.0 6.2
mutual funds 19,563 10.8 10.0
Insurance companies 12,278 10.0 6.1
Life 9,337 9.8 6.2
Property and casualty 2,941 11.0 5.8
Hedge funds* 8,097 1.8 8.6
Broker-dealers 3,676 6.0 4.9
Outstanding (billions of dollars)
Securitization 11,330 6.7 5.4
agency 10,094 7.3 6.0
Non-agency** 1,236 2.5 3.2
Note: The data extend through 2020:Q4. Growth rates are measured from Q4 of the year immediately preceding the period through Q4 of the final year of the period. Life insurance companies’ assets include both general and separate account assets.
* Hedge fund data start in 2012:Q4 and are updated through 2020:Q3. Growth rates for the hedge fund data are measured from Q3 of the year immediately preceding the period through Q3 of 2020.
** Non-agency securitization excludes securitized credit held on balance sheets of banks and finance companies.Source: Federal reserve Board, Statistical release Z.1, “Financial accounts of the united States”; Federal reserve Board, “enhanced Finan-
cial accounts of the united States.”
Leverage at banks and broker-dealers remains low, while leverage at hedge funds and life insurance companies continues to be high
Table 3 shows the sizes and growth rates of the types of financial institutions discussed in this section.
Bank capital ratios rose above pre-pandemic levels, though some heightened credit risk remains
Banks have weathered the pandemic well. The common equity Tier 1 ratio—a regulatory risk-based measure of bank capital adequacy—increased, on net, over the past year for most banks (figure 3-1). Over the second half of 2020, profitability recovered, credit quality held up much better than many had expected, and the largest banks reduced capital distributions amid
3. Leverage in the Financial Sector
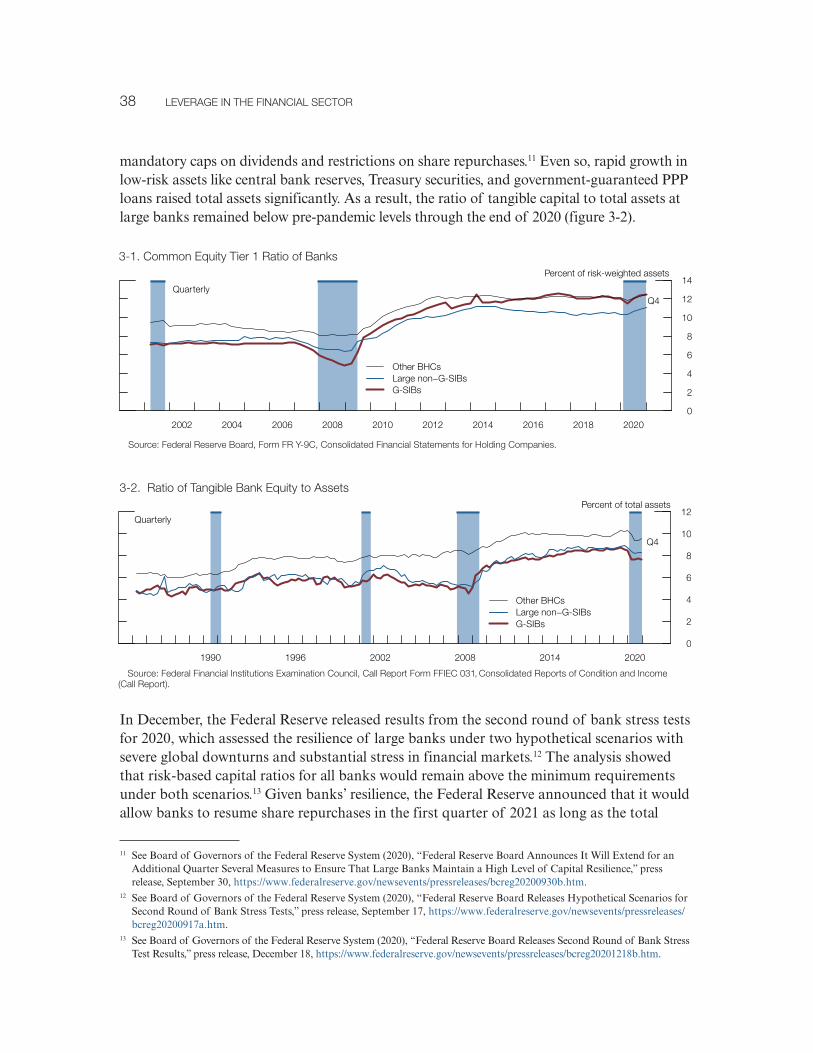
38 LeveraGe IN THe FINaNCIaL SeCTor
mandatory caps on dividends and restrictions on share repurchases.11 Even so, rapid growth in low-risk assets like central bank reserves, Treasury securities, and government-guaranteed PPP loans raised total assets significantly. As a result, the ratio of tangible capital to total assets at large banks remained below pre-pandemic levels through the end of 2020 (figure 3-2).
In December, the Federal Reserve released results from the second round of bank stress tests for 2020, which assessed the resilience of large banks under two hypothetical scenarios with severe global downturns and substantial stress in financial markets.12 The analysis showed that risk-based capital ratios for all banks would remain above the minimum requirements under both scenarios.13 Given banks’ resilience, the Federal Reserve announced that it would allow banks to resume share repurchases in the first quarter of 2021 as long as the total
11 See Board of Governors of the Federal Reserve System (2020), “Federal Reserve Board Announces It Will Extend for an Additional Quarter Several Measures to Ensure That Large Banks Maintain a High Level of Capital Resilience,” press release, September 30, https://www.federalreserve.gov/newsevents/pressreleases/bcreg20200930b.htm.
12 See Board of Governors of the Federal Reserve System (2020), “Federal Reserve Board Releases Hypothetical Scenarios for Second Round of Bank Stress Tests,” press release, September 17, https://www.federalreserve.gov/newsevents/pressreleases/bcreg20200917a.htm.
13 See Board of Governors of the Federal Reserve System (2020), “Federal Reserve Board Releases Second Round of Bank Stress Test Results,” press release, December 18, https://www.federalreserve.gov/newsevents/pressreleases/bcreg20201218b.htm.
3-2. ratio of Tangible Bank equity to assets
Source: Federal Financial Institutions examination Council, Call report Form FFIeC 031, Consolidated reports of Condition and Income (Call report).
0
2
4
6
8
10
12
1990 1996 2002 2008 2014 2020
Quarterly
Percent of total assets
other BHCsLarge non−G-SIBsG-SIBs
Q4
3-1. Common equity Tier 1 ratio of Banks
Source: Federal reserve Board, Form Fr Y-9C, Consolidated Financial Statements for Holding Companies.
0
2
4
6
8
10
12
14
2002 2004 2006 2008 2010 2012 2014 2016 2018 2020
Percent of risk-weighted assets
other BHCsLarge non−G-SIBsG-SIBs
Q4Quarterly
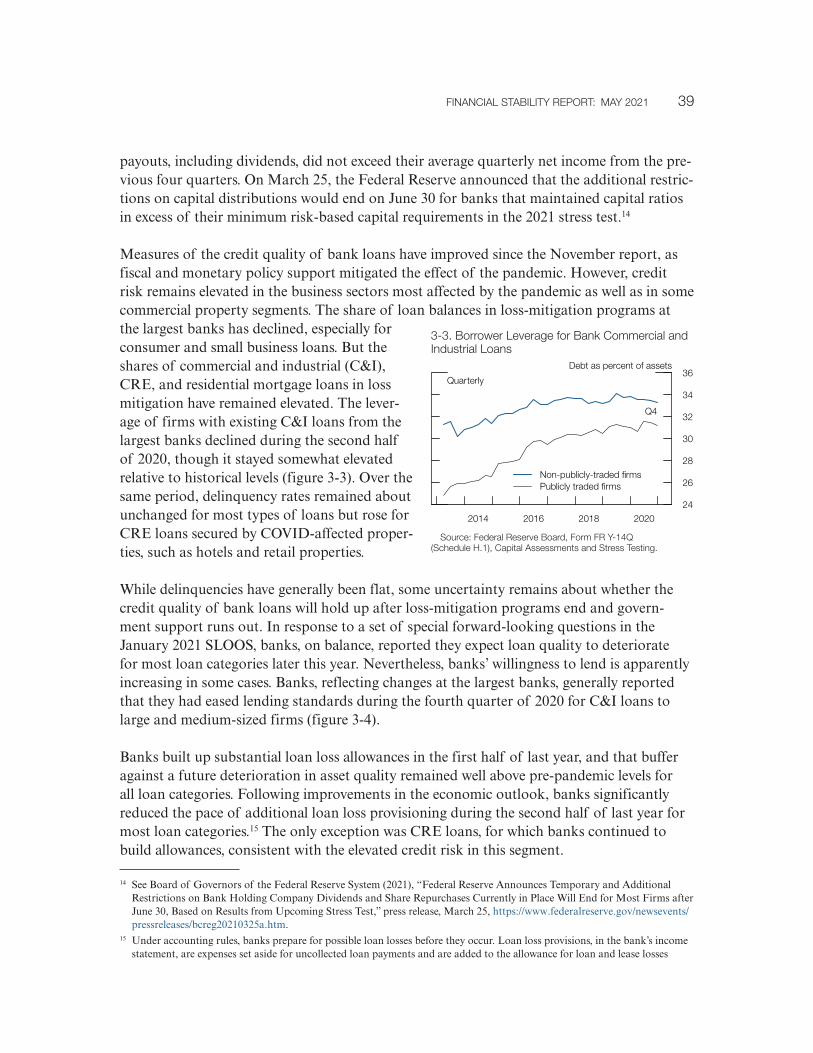
FINaNCIaL STaBILITY rePorT: maY 2021 39
payouts, including dividends, did not exceed their average quarterly net income from the pre-vious four quarters. On March 25, the Federal Reserve announced that the additional restric-tions on capital distributions would end on June 30 for banks that maintained capital ratios in excess of their minimum risk-based capital requirements in the 2021 stress test.14
Measures of the credit quality of bank loans have improved since the November report, as fiscal and monetary policy support mitigated the effect of the pandemic. However, credit risk remains elevated in the business sectors most affected by the pandemic as well as in some commercial property segments. The share of loan balances in loss-mitigation programs at the largest banks has declined, especially for consumer and small business loans. But the shares of commercial and industrial (C&I), CRE, and residential mortgage loans in loss mitigation have remained elevated. The lever-age of firms with existing C&I loans from the largest banks declined during the second half of 2020, though it stayed somewhat elevated relative to historical levels (figure 3-3). Over the same period, delinquency rates remained about unchanged for most types of loans but rose for CRE loans secured by COVID-affected proper-ties, such as hotels and retail properties.
While delinquencies have generally been flat, some uncertainty remains about whether the credit quality of bank loans will hold up after loss-mitigation programs end and govern-ment support runs out. In response to a set of special forward-looking questions in the January 2021 SLOOS, banks, on balance, reported they expect loan quality to deteriorate for most loan categories later this year. Nevertheless, banks’ willingness to lend is apparently increasing in some cases. Banks, reflecting changes at the largest banks, generally reported that they had eased lending standards during the fourth quarter of 2020 for C&I loans to large and medium-sized firms (figure 3-4).
Banks built up substantial loan loss allowances in the first half of last year, and that buffer against a future deterioration in asset quality remained well above pre-pandemic levels for all loan categories. Following improvements in the economic outlook, banks significantly reduced the pace of additional loan loss provisioning during the second half of last year for most loan categories.15 The only exception was CRE loans, for which banks continued to build allowances, consistent with the elevated credit risk in this segment.
14 See Board of Governors of the Federal Reserve System (2021), “Federal Reserve Announces Temporary and Additional Restrictions on Bank Holding Company Dividends and Share Repurchases Currently in Place Will End for Most Firms after June 30, Based on Results from Upcoming Stress Test,” press release, March 25, https://www.federalreserve.gov/newsevents/pressreleases/bcreg20210325a.htm.
15 Under accounting rules, banks prepare for possible loan losses before they occur. Loan loss provisions, in the bank’s income statement, are expenses set aside for uncollected loan payments and are added to the allowance for loan and lease losses
3-3. Borrower Leverage for Bank Commercial and Industrial Loans
Source: Federal reserve Board, Form Fr Y-14Q (Schedule H.1), Capital assessments and Stress Testing.
24
26
28
30
32
34
36
2014 2016 2018 2020
Quarterly
Debt as percent of assets
Q4
Non-publicly-traded firmsPublicly traded firms

40 LeveraGe IN THe FINaNCIaL SeCTor
A key factor in banks’ ability to accumulate equity capital has been bank profitability— measured as either return on equity or return on assets—which recovered during the second half of 2020. The reduction in loan loss provisions contributed notably to this recovery. In addition, trading and investment banking revenues were robust. Nonetheless, bank prof-itability remains under pressure from historically low net interest margins and uncertainty about the credit quality of loans exiting loss-mitigation programs. Based on preliminary data for the first quarter of 2021, profitability at the U.S. global systemically important banks (G-SIBs) continued to be strong, although one G-SIB announced a large loss from prime brokerage activities.
Leverage is at historically low levels at broker-dealers . . .
Broker-dealer leverage remained near histor-ically low levels through the fourth quarter of 2020 (figure 3-5). Net borrowing of pri-mary dealers has decreased somewhat since the November report but remains higher than in recent years, as dealers continue to finance sizable inventories of Treasury securities. No notable effect on Treasury market function-ing followed the expiration in March 2021 of temporary changes to the supplementary leverage ratio (SLR), which were implemented to ease strains in Treasury market intermedi-
ation during the onset of the pandemic. To ensure that the SLR—established in 2014 as an additional capital requirement—remains effective in an environment of higher reserves, the Board will soon be inviting public comment on several potential SLR modifications.16
(ALLL), which is renamed “allowance for credit losses” for banks adopting the Current Expected Credit Losses methodol-ogy. On a bank’s balance sheet, total loans are reported net of ALLL. More information on ALLL is available on the Board’s website at https://www.federalreserve.gov/supervisionreg/topics/alll.htm.
16 See Board of Governors of the Federal Reserve System (2021), “Federal Reserve Board Announces That the Temporary Change to Its Supplementary Leverage Ratio (SLR) for Bank Holding Companies Will Expire as Scheduled on March 31,” press release, March 19, https://www.federalreserve.gov/newsevents/pressreleases/bcreg20210319a.htm.
3-5. Leverage at Broker-Dealers
Source: Federal reserve Board, Statistical release Z.1, “Financial accounts of the united States.”
0
10
20
30
40
50
1996 2000 2004 2008 2012 2016 2020
Quarterly
ratio of assets to equity
Q4
3-4. Change in Bank Lending Standards for Commercial and Industrial Loans
Source: Federal reserve Board, Senior Loan officer opinion Survey on Bank Lending Practices; Federal reserve Board staff calculations.
−100−80−60−40−20
020406080
100
2000 2004 2008 2012 2016 2020
Quarterly
Net percentage of banks reporting
eas
ing
Tig
hten
ing
Q4

FINaNCIaL STaBILITY rePorT: maY 2021 41
. . . and is high at life insurance companies
Leverage at life insurance companies remains high (figure 3-6). Life insurers invest heavily in corporate bonds and hold CLOs, which leaves them vulnerable to risks from elevated leverage in the corporate sector. They also invest heavily in CRE debt. If the performance of their debt holdings deteriorates, life insurers’ capital posi-tions could be impaired. Meanwhile, based on information through the fourth quarter of 2020, leverage at property and casualty insurers stayed at low levels relative to historical averages.
Available measures of hedge fund leverage are somewhat above average but may not be capturing important risks
While data on hedge fund leverage come from different sources with various lags, most measures increased in the second half of 2020 and are now somewhat above their historical averages, reversing the decrease in the first half of the year amid the March 2020 market turmoil. Gross leverage at hedge funds, as reported in publicly available Securities and Exchange Commission (SEC) disclosures, fell in the first half of 2020, the most recent data available, but the average remained near 2018 levels (figure 3-7).17 In addition, several indi-cators of leverage intermediated by dealers on behalf of hedge funds, such as hedge funds’ margin and securities borrowing in prime brokerage accounts, suggest that hedge fund leverage associated with equity market activ-ities is at high levels. More recently, in the Senior Credit Officer Opinion Survey on Dealer Financing Terms, around one-fifth of dealers, on net, reported hedge fund clients reducing their use of leverage between September and November 2020; dealers reported hedge funds’ use of leverage as basically unchanged from December 2020 to February 2021 (figure 3-8). Overall, the available data suggest that leverage remains somewhat elevated at hedge funds. The FSOC has restarted its Hedge Fund Working Group to better share data, identify risks, and strengthen the financial system.
A few recent episodes have highlighted the opacity of risky exposures and the need for greater transparency at hedge funds and other leveraged financial entities that can transmit stress to
17 Comprehensive data on hedge fund leverage are available only with a long lag. The Federal Reserve supplements these data with more timely but less comprehensive measures in developing its assessment of vulnerabilities from hedge fund leverage.
3-6. Leverage at Insurance Companies
Source: National association of Insurance Commissioners, quarterly and annual statutory filings accessed via S&P Global market Intelligence, S&P Capital IQ.
0
3
6
9
12
15
2002 2005 2008 2011 2014 2017 2020
Quarterly
ratio of assets to equity
LifeProperty and casualty
Q4
3-7. Gross Leverage at Hedge Funds
Source: Securities and exchange Commission, Form PF, reporting Form for Investment advisers to Private Funds and Certain Commodity Pool operators and Commodity Trading advisors.
1
2
3
4
5
6
7
8
9
10
2014 2016 2018 2020
monthly
ratio
mean
median
June

42 LeveraGe IN THe FINaNCIaL SeCTor
the financial system. For example, some hedge funds with substantial short positions sus-tained losses during the meme stock episode in January 2021, when intense social media activ-ity contributed to fluctuations in the prices of some specific stocks, though the effects on the hedge fund sector overall appear to have been limited (see the box “Vulnerabilities from Asset Valuations, Risk Appetite, and Low Interest Rates” in the Asset Valuations section).
In a separate episode in late March, a few banks took large losses when a highly leveraged family office, Archegos Capital Management, was unable to meet margin calls related to total return swap agreements and other positions financed by prime brokers.18 Price declines in the concentrated stock positions held by Archegos triggered the margin calls, prompting sales of the stock positions, which led to further declines in the prices of affected stocks and, ultimately, substantial losses for some banks. While broader market spillovers appeared lim-ited, the episode highlights the potential for material distress at NBFIs to affect the broader financial system.
Although overall securitization volumes remained subdued, issuance of collateralized loan obligations and nonmortgage asset-backed securities was elevated
Securitization allows financial institutions to bundle loans or other financial assets and sell claims on the cash flows generated by these assets as tradable securities, much like bonds. Examples of the resulting securities include CLOs (predominantly backed by leveraged loans), ABS (often backed by credit card and auto debt), CMBS, and residential mortgage- backed securities (RMBS). By funding assets with debt issued by investment funds knows as “special purpose entities” (SPEs), securitization can add leverage to the financial system, in part because SPEs are generally subject to rules such as risk retention that are less stringent than banks’ regulatory capital requirements.19 In addition, the process commonly involves the creation of securities, or “tranches,” with different levels of seniority. As a result, securiti-zation allows the creation of highly rated securities from pools of lower-rated assets.
18 Family offices are private firms that manage wealth on behalf of their owners and are exempt from registration with the SEC; thus, they are not subject to disclosing their size or leverage.
19 Following the Dodd-Frank Wall Street Reform and Consumer Protection Act of 2010, federal financial regulatory agencies introduced credit risk retention rules that required sponsors of securitization vehicles to retain a minimum share of the credit risk for any asset that the sponsor transfers, sells, or conveys to a third party through securitization.
3-8. Change in the use of Financial Leverage
Source: Federal reserve Board, Senior Credit officer opinion Survey on Dealer Financing Terms.
−80
−60
−40
−20
0
20
40
60
2012 2013 2014 2015 2016 2017 2018 2019 2020 2021
Quarterly
Net percentage
Hedge fundsTrading reITsInsurance companiesmutual funds
Q1

FINaNCIaL STaBILITY rePorT: maY 2021 43
On balance, issuance volumes of non-agency securities—that is, those securities not guaran-teed by a government-sponsored enterprise (GSE) or by the federal government—remained subdued and ended last year 20 percent below their 2019 levels despite support from the Term Asset-Backed Securities Loan Facility (TALF) (figure 3-9). Issuance recovered some-what in the first quarter of 2021, though the recovery was uneven across asset classes. Amid increased investor risk appetite, CLO and ABS issuance was elevated, whereas non-agency CMBS and RMBS issuance was weak during the first quarter.
CLO securitization has grown rapidly in recent years, with investors attracted by higher yields. Although recently issued CLOs have been relatively sounder than the structures in use before the 2007–09 financial crisis, the value of lower-rated tranches may be highly sensitive to performance of the underlying loans.20 As a result, leveraged investors, such as hedge funds, may be vulnerable if they have substantial exposures to these lower-rated tranches and the underlying loans experience losses. In 2021, CLO issuance rose to a record pace through March that was about 100 percent above its average monthly issuance volume from the same period last year, and about 75 percent above its average volume for that same period from 2016 through 2020. In addition, a record volume of CLOs was refinanced or restructured, as CLO managers sought to lower their liability costs amid tighter market spreads. Meanwhile, CLO fundamentals have improved, following a notable deterioration in 2020. While certain collateral metrics, such as average loan ratings or holdings of triple-C-rated loans, are worse than their pre-pandemic levels, they have improved significantly relative to mid-2020.
Bank lending to nonbank financial institutions rose to pre-pandemic levels by the end of 2020
Bank lending to NBFIs represents a potential channel for transmission of stress from one part of the financial system to another. Committed amounts of credit from large banks to NBFIs, which consist mostly of revolving credit lines and include undrawn amounts, increased in the latter part of last year and reached a record $1.6 trillion by year-end
20 Unlike open-end mutual funds, CLOs do not generally permit early redemptions or rely on funding that must be rolled over before the underlying assets mature. Also, recent CLOs provide higher levels of subordination to better protect senior tranche holders than before the 2007–09 financial crisis. As a result, CLOs are generally considered more “sound” because they avoid the run risk associated with a rapid reversal in investor sentiment and have less embedded leverage.
3-9. Issuance of Non-agency Securitized Products, by asset Class
Source: Green Street advisors, LLC, Commercial mortgage alert (cmalert.com) and asset-Backed alert (abalert.com); Bureau of Labor Statistics, consumer price index via Haver analytics.
0
400
800
1200
1600
2000
2400
2800
2001 2003 2005 2007 2009 2011 2013 2015 2017 2019 2021
Billions of dollars (real)
annual otherPrivate-label rmBSNon-agency CmBSauto loan/lease aBSCDos (including aBS CDos and CLos)

44 LeveraGe IN THe FINaNCIaL SeCTor
(figure 3-10).21 The increase was driven by lending to open-end investment funds; SPEs, including CLOs and ABS; real estate lenders and lessors; and other financial vehicles (figure 3-11).22 These credit-line commitments provide NBFIs with liquidity insurance and a backstop to meet heightened investor redemptions or disruptions in the short-term funding markets in which they operate. As such, the credit lines represent contingent commitments from banks that can support increases in financial leverage during times of stress. Indeed, the utilization rates of NBFIs’ credit lines spiked in March 2020 but generally fell back to normal levels during the second half of last year.
Delinquency rates on loans by large banks to NBFIs were higher in the second half of 2020 than before the pandemic, but they remained below delinquency rates on C&I loans to nonfinancial firms. The relatively modest delinquency rates on loans to NBFIs partly reflect actions by the Department of the Treasury and the Federal Reserve that stabilized funding markets and produced marketwide effects that reduced liquidity risks at NBFIs.
21 The Federal Reserve is able to monitor the exposures of the largest U.S. banks to NBFIs because those banks report detailed information about their loan commitments on regulatory form FR Y-14Q, available on the Board’s website at https://www.federalreserve.gov/apps/reportforms/reportdetail.aspx?sOoYJ+5BzDZGWnsSjRJKDwRxOb5Kb1hL.
22 Open-end investment funds include mutual funds and exchange-traded funds. Other financial vehicles include mostly private closed-end investment funds and trusts.
3-10. Large Bank Lending to Nonbank Financial Firms: Committed amounts
Source: Federal reserve Board, Form Fr Y-14Q (Schedule H.1), Capital assessments and Stress Testing.
Billions of dollars
0
250
500
750
1000
1250
1500
1750
2018 2019 2020
1. Financial transactions processing2. Private equity, BDCs, and credit funds3. Broker-dealers4. Insurance5. reITs
8. other financial vehicles9. real estate lenders and lessors
10
9
8
7
6
543
21
Q4
6. open-end investment funds7. Special purpose entities, CLos, and aBS
Quarterly
10. Consumer lenders, other lenders, and lessors
3-11. Growth of Loan Commitments and utilization to Nonbank Financial Institutions in 2020, by Sector
Source: Federal reserve Board, Form Fr Y-14Q (Schedule H.1), Capital assessments and Stress Testing.
−20
−10
0
10
20
30
40
reITs Insurance
Committed amountsutilized amounts
Percent
otherfinancialvehicles
realestate
lenders& lessors
SPes,CLos,& aBS
open-endinvestment
funds
Broker-dealers
Pe,BDCs,& creditfunds
Consumerleasing,other
lenders
Financialtransactionsprocessing
Total

45
Vulnerabilities from liquidity and maturity mismatches remain low at large banks, but structural vulnerabilities persist at some types of money market funds as well as bond and bank loan mutual funds
In 2020, the total amount of liabilities that are potentially vulnerable to runs, including those of nonbanks, is estimated to have increased 13.6 percent to $17.7 trillion, as shown in table 4; that amount was equivalent to about 85 percent of GDP (figure 4-1). Much of this net increase reflected growth in uninsured deposits and government MMF assets under management. This growth more than offset declines in the second half of the year in the size of prime and tax-exempt MMFs, which are particularly vulnerable to runs. Meanwhile, bond mutual funds continued to grow, on net, in 2020.
Table 4. Size of Selected Instruments and Institutions
Item
Outstanding/ total assets
(billions of dollars)
Growth,2019:Q4–2020:Q4
(percent)
Average, annual growth, 1997–2020:Q4
(percent)
Total runnable money-like liabilities* 17,716 13.6 4.7
uninsured deposits 6,845 32.7 11.5
Domestic money market funds** 4,333 19.3 5.1
Prime 543 −29.9 −.3
Government 3,685 35.5 16.1
Tax-exempt 105 −23.3 −2.4
repurchase agreements 4,016 −.9 5.7
Commercial paper 987 −5.6 1.8
Securities lending*** 637 10.1 5.8
Bond mutual funds 4,938 11.6 9.0
Note: The data extend through 2020:Q4. Growth rates are measured from Q4 of the year immediately preceding the period through Q4 of the final year of the period. Total runnable money-like liabilities exceeds the sum of listed components. Items not included in the table are variable-rate demand obligations, federal funds, funding-agreement-backed securities, private liquidity funds, offshore money market funds, short-term investment funds, and local government investment pools.
* average annual growth is from 2003:Q4 to 2020:Q4.** average annual growth is from 2001:Q4 to 2020:Q4.*** average annual growth is from 2000:Q4 to 2020:Q4.Source: Securities and exchange Commission, Private Funds Statistics; imoneyNet, Inc., offshore money Fund analyzer; Bloomberg
Finance L.P.; Securities Industry and Financial markets association: u.S. municipal variable-rate Demand obligation update; risk management association, Securities Lending report; DTCC Solutions LLC, an affiliate of the Depository Trust & Clearing Corporation: commercial paper data; Federal reserve Board staff calculations based on Investment Company Institute data; Federal reserve Board, Statistical release H.6, “money Stock and Debt measures” (m3 monetary aggregate); Federal reserve Board, Statistical release Z.1, “Financial accounts of the united States”; Federal Financial Institutions examination Council, Consolidated reports of Condition and Income (Call report); morningstar, Inc., morningstar Direct; moody’s analytics, Inc., Creditview, asset-Backed Commercial Paper Program Index.
Funding Risk4.
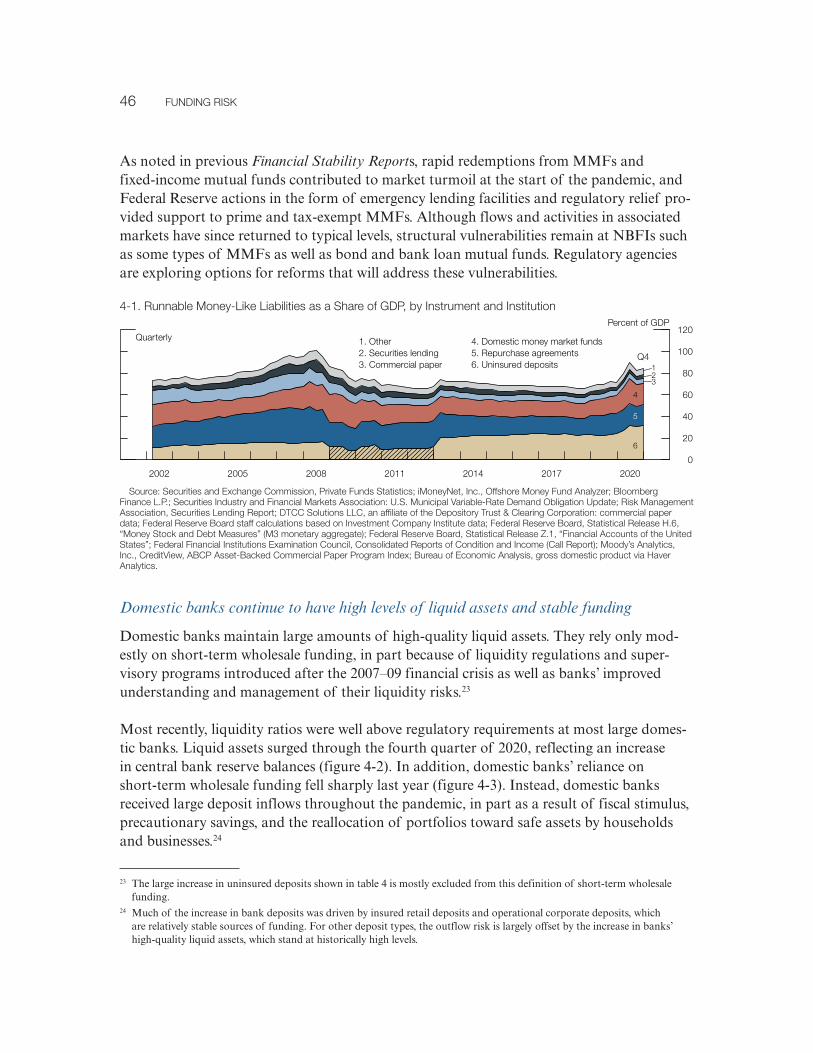
46 FuNDING rISk
As noted in previous Financial Stability Reports, rapid redemptions from MMFs and fixed-income mutual funds contributed to market turmoil at the start of the pandemic, and Federal Reserve actions in the form of emergency lending facilities and regulatory relief pro-vided support to prime and tax-exempt MMFs. Although flows and activities in associated markets have since returned to typical levels, structural vulnerabilities remain at NBFIs such as some types of MMFs as well as bond and bank loan mutual funds. Regulatory agencies are exploring options for reforms that will address these vulnerabilities.
Domestic banks continue to have high levels of liquid assets and stable funding
Domestic banks maintain large amounts of high-quality liquid assets. They rely only mod-estly on short-term wholesale funding, in part because of liquidity regulations and super-visory programs introduced after the 2007–09 financial crisis as well as banks’ improved understanding and management of their liquidity risks.23
Most recently, liquidity ratios were well above regulatory requirements at most large domes-tic banks. Liquid assets surged through the fourth quarter of 2020, reflecting an increase in central bank reserve balances (figure 4-2). In addition, domestic banks’ reliance on short-term wholesale funding fell sharply last year ( figure 4-3). Instead, domestic banks received large deposit inflows throughout the pandemic, in part as a result of fiscal stimulus, precautionary savings, and the reallocation of portfolios toward safe assets by households and businesses.24
23 The large increase in uninsured deposits shown in table 4 is mostly excluded from this definition of short-term wholesale funding.
24 Much of the increase in bank deposits was driven by insured retail deposits and operational corporate deposits, which are relatively stable sources of funding. For other deposit types, the outflow risk is largely offset by the increase in banks’ high-quality liquid assets, which stand at historically high levels.
Quarterly
Percent of GDP
0
20
40
60
80
100
120
2002 2005 2008 2011 2014 2017 2020
1. other2. Securities lending3. Commercial paper
4. Domestic money market funds5. repurchase agreements6. uninsured deposits
Q4
6
5
4
321
4-1. runnable money-Like Liabilities as a Share of GDP, by Instrument and Institution
Source: Securities and exchange Commission, Private Funds Statistics; imoneyNet, Inc., offshore money Fund analyzer; Bloomberg Finance L.P.; Securities Industry and Financial markets association: u.S. municipal variable-rate Demand obligation update; risk management association, Securities Lending report; DTCC Solutions LLC, an affiliate of the Depository Trust & Clearing Corporation: commercial paper data; Federal reserve Board staff calculations based on Investment Company Institute data; Federal reserve Board, Statistical release H.6, “money Stock and Debt measures” (m3 monetary aggregate); Federal reserve Board, Statistical release Z.1, “Financial accounts of the united States”; Federal Financial Institutions examination Council, Consolidated reports of Condition and Income (Call report); moody’s analytics, Inc., Creditview, aBCP asset-Backed Commercial Paper Program Index; Bureau of economic analysis, gross domestic product via Haver analytics.

FINaNCIaL STaBILITY rePorT: maY 2021 47
To a larger extent than domestic banks, FBOs have an active role in global U.S. dollar fund-ing markets and rely on short-term wholesale funding (see the box “Vulnerabilities in Global U.S. Dollar Funding Markets”).
Structural vulnerabilities remain at prime and tax-exempt money market funds
Assets under management at prime and tax-exempt MMFs have declined since the middle of last year, but vulnerabilities at these funds remain and call for structural fixes. In particular, assets under management at prime MMFs declined over the second half of last year, when some large prime funds closed or converted to government funds, and they have continued to decline modestly since then (figure 4-4). However, vulnerabilities associated with liquidity transformation at these funds remain prominent. A fund engages in liquidity transformation by offering daily redemptions to investors even when the fund’s underlying assets may be
monthly
Billions of dollars (real)
0
750
1500
2250
3000
3750
4500
5250
6000
2001 2003 2005 2007 2009 2011 2013 2015 2017 2019 2021
1. Government only2. Tax exempt
3. retail prime4. Institutional prime
1
23
4
Jan.
4-4. Domestic money market Fund assets
Source: Federal reserve Board staff calculations based on Investment Company Institute data; Bureau of Labor Statistics, consumer price index via Haver analytics.
5
10
15
20
25
30
35
40
2002 2005 2008 2011 2014 2017 2020
Percent of assets
Q4
Quarterly
4-3. Short-Term wholesale Funding of Banks
Source: Federal reserve Board, Form Fr Y-9C, Consolidated Financial Statements for Holding Companies.
0
4
8
12
16
20
24
28
32
2004 2008 2012 2016 2020
Quarterly
Percent of assets
Q4
other BHCsLarge non−G-SIBsG-SIBs
4-2. Liquid assets Held by Banks
Source: Federal reserve Board, Form Fr Y-9C, Consolidated Financial Statements for Holding Companies.

48 FuNDING rISk
difficult to sell quickly. The President’s Working Group on Financial Markets released a report in December 2020 outlining potential reforms to address risks from the MMF sec-tor.25 Subsequently, the SEC issued a request for comment on these potential reforms.26 If properly calibrated, some of these reforms—such as swing pricing, a minimum balance at risk, and capital buffers—could significantly reduce the run risk associated with MMFs. Meanwhile, the Money Market Mutual Fund Liquidity Facility and the Commercial Paper Funding Facility, which were deployed during the COVID-19 pandemic to backstop short-term funding markets, expired at the end of March with no material effect on these markets.
Other cash-management vehicles, such as dollar-denominated offshore funds and short-term investment funds, also invest in money market instruments and are vulnerable to runs, and some of these vehicles experienced heavy redemptions in March 2020. Currently, between $400 billion and $1 trillion of these vehicles’ assets are in portfolios similar to those of U.S. prime funds, and a new wave of redemptions could destabilize short-term funding markets. The Financial Stability Board’s (FSB) Holistic Review of the March Market Turmoil high-lighted vulnerabilities from NBFIs, including from these cash management vehicles. The FSB, coordinating with other international organizations, will continue work that addresses risk factors that amplified stress and furthers an understanding of systemic risks in NBFIs and policies that could address these risks.
Bond and bank loan mutual funds benefited from net inflows but are exposed to risks due to large holdings of illiquid assets
Mutual funds that invest substantially in cor-porate bonds and bank loans may be particu-larly exposed to liquidity transformation risks, given the option of daily redemptions and the relative illiquidity of their assets.27 U.S. cor-porate bonds held by mutual funds increased substantially to $1.8 trillion in the fourth quarter of 2020, well above pre-pandemic levels and about one-sixth of outstanding U.S. corporate bonds (figure 4-5). High-yield bond funds and bank loan mutual funds primarily
25 See U.S. Department of the Treasury (2020), “President’s Working Group on Financial Markets Releases Report on Money Market Funds,” press release, December 22, https://home.treasury.gov/news/press-releases/sm1219.
26 See U.S. Securities and Exchange Commission (2021), “SEC Requests Comment on Potential Money Market Fund Reform Options Highlighted in President’s Working Group Report,” press release, February 4, https://www.sec.gov/news/press-release/2021-25.
27 See Kenechukwu Anadu and Fang Cai (2019), “Liquidity Transformation Risks in U.S. Bank Loan and High-Yield Mutual Funds,” FEDS Notes (Washington: Board of Governors of the Federal Reserve System, August 9), https://www.federalreserve.gov/econres/notes/feds-notes/liquidity-transformation-risks-in-US-bank-loan-and-high-yield-mutual-funds-20190809.htm.
Quarterly
Billions of dollars (real)
0
300
600
900
1200
1500
1800
2100
2002 2005 2008 2011 2014 2017 2020
Q4
4-5. u.S. Corporate Bonds Held by mutual Funds
Source: Federal reserve Board staff estimates based on Federal reserve Board, Statistical release Z.1, “Financial accounts of the united States”; Bureau of Labor Statistics, consumer price index via Haver analytics.
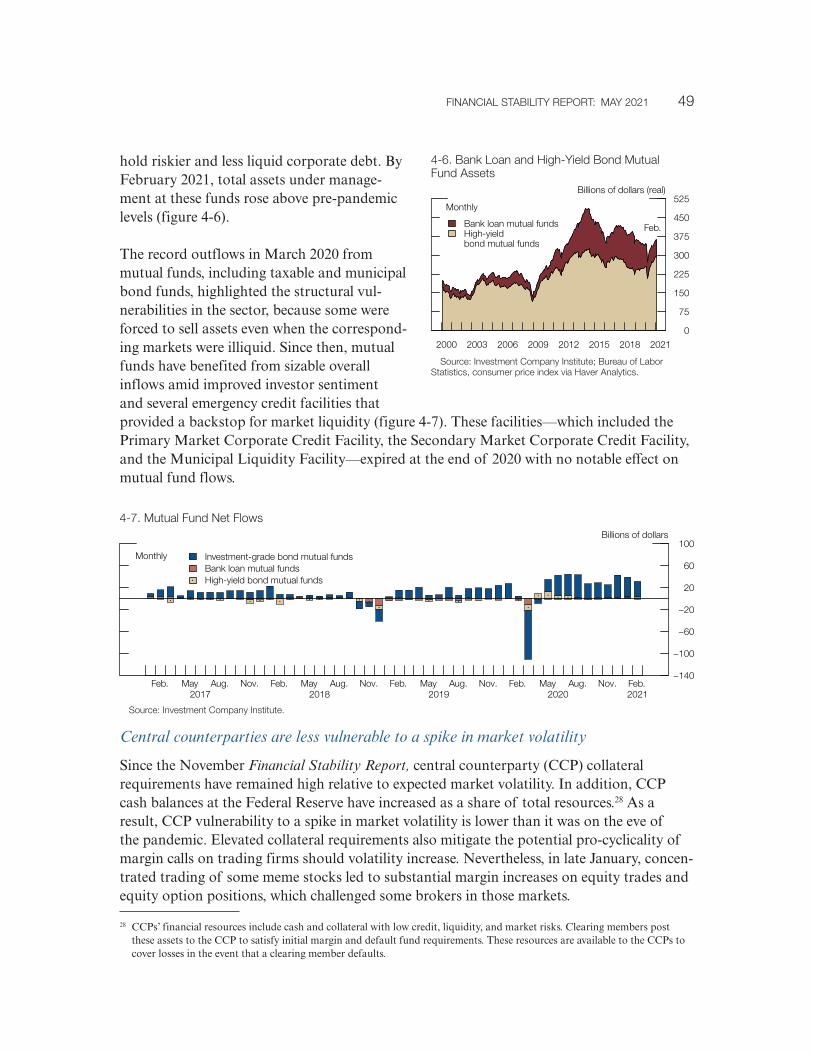
FINaNCIaL STaBILITY rePorT: maY 2021 49
hold riskier and less liquid corporate debt. By February 2021, total assets under manage-ment at these funds rose above pre-pandemic levels (figure 4-6).
The record outflows in March 2020 from mutual funds, including taxable and municipal bond funds, highlighted the structural vul-nerabilities in the sector, because some were forced to sell assets even when the correspond-ing markets were illiquid. Since then, mutual funds have benefited from sizable overall inflows amid improved investor sentiment and several emergency credit facilities that provided a backstop for market liquidity (figure 4-7). These facilities—which included the Primary Market Corporate Credit Facility, the Secondary Market Corporate Credit Facility, and the Municipal Liquidity Facility—expired at the end of 2020 with no notable effect on mutual fund flows.
−140
−100
−60
−20
20
60
100monthly
Billions of dollars
Feb. may aug. Nov. Feb. may aug. Nov. Feb. may aug. Nov. Feb. may aug. Nov. Feb.20212020201920182017
Investment-grade bond mutual fundsBank loan mutual fundsHigh-yield bond mutual funds
4-7. mutual Fund Net Flows
Source: Investment Company Institute.
monthly
Billions of dollars (real)
0
75
150
225
300
375
450
525
2000 2003 2006 2009 2012 2015 2018 2021
Bank loan mutual fundsHigh-yieldbond mutual funds
Feb.
4-6. Bank Loan and High-Yield Bond mutual Fund assets
Source: Investment Company Institute; Bureau of Labor Statistics, consumer price index via Haver analytics.
Central counterparties are less vulnerable to a spike in market volatility
Since the November Financial Stability Report, central counterparty (CCP) collateral requirements have remained high relative to expected market volatility. In addition, CCP cash balances at the Federal Reserve have increased as a share of total resources.28 As a result, CCP vulnerability to a spike in market volatility is lower than it was on the eve of the pandemic. Elevated collateral requirements also mitigate the potential pro-cyclicality of margin calls on trading firms should volatility increase. Nevertheless, in late January, concen-trated trading of some meme stocks led to substantial margin increases on equity trades and equity option positions, which challenged some brokers in those markets.
28 CCPs’ financial resources include cash and collateral with low credit, liquidity, and market risks. Clearing members post these assets to the CCP to satisfy initial margin and default fund requirements. These resources are available to the CCPs to cover losses in the event that a clearing member defaults.

50 FuNDING rISk
Liquidity risks at life insurers are at post-2008 highs and have been increasing
Over the past decade, the gap has widened between the liquidity of life insurers’ assets and the liquidity of their liabilities, potentially making it harder for them to meet a sudden rise in withdrawals and other claims. Life insurers have been increasing the share of illiquid, risky assets on their balance sheets. These assets—including CRE loans, less liquid corporate debt, and alternative investments—edged up to 35 percent of general account assets, the same level as just before the 2007–09 financial crisis (figure 4-8).29 Meanwhile, after dipping during the financial crisis, the share of more easily redeemable liabilities remains above its pre-crisis level, in part due to increasing nontraditional liabilities (figure 4-9).
29 Life insurers’ assets and liabilities are divided between the general account and separate accounts. In the separate accounts, each policyholder selects a portfolio of assets from a menu offered by the insurer, and the performance of that portfolio is reflected in the value of the insurer’s liability to that policyholder. The assets in the general account are pooled and selected by the insurer to meet future payment obligations to all general account policy and other liability holders, with any remain-der becoming profit for the insurance company.
0
50
100
150
200
250
300
350Quarterly
Billions of dollars (real)
2006 2008 2010 2012 2014 2016 2018 2020
FHLB advances
Q4
0
20
40
60
80
100
2012 2014 2016 2018 2020
Quarterly
Billions of dollars (real)
repurchase agreementsSecurities lending
Q4Funding-agreement-backed securities
4-9. Nontraditional Liabilities of u.S. Life Insurers, by Liability Type
Source: Bureau of Labor Statistics, consumer price index via Haver analytics; moody’s analytics, Inc., Creditview, asset-Backed Commercial Paper Program Index; Securities and exchange Commission, Forms 10-Q and 10-k; National association of Insurance Commissioners, quarterly and annual statutory filings accessed via S&P Global market Intelligence; Bloomberg Finance L.P.
0250500750
10001250150017502000225025002750
0
10
20
30
40
50
2006 2008 2010 2012 2014 2016 2018 2020
Billions of dollarsPercent share
4. alternative investments5. Illiquid corporate debt6. Illiquid corporate debt, securitized
1. other asset-backed securities2. Commercial real estate3. Commercial real estate, securitized
Share of life insurer assets (left scale)Share of P&C insurer assets (left scale)
4-8. Less Liquid General account assets Held by u.S. Insurers
Source: Staff estimates based on data from Bloomberg Finance L.P. and National association of Insurance Commissioners annual Statutory Filings.

FINaNCIaL STaBILITY rePorT: maY 2021 51
LIBOR Transition Update
The transition away from LIBOR passed several notable milestones recently. Most important, on March 5, 2021, the LIBOR administrator and regulator provided clarity on the end dates of the publi-cation of LIBORs as representative, panel-based rates. Separately, in January 2021, the Inter national Swaps and Derivatives Association (ISDA) IBOR Fallbacks Protocol took effect, inserting robust fallback language in derivatives contracts referencing LIBOR for parties that adhere to the protocol. In addition, New York State recently enacted legislation proposed by the Alternative Refer ence Rates Committee (ARRC) that minimizes legal uncertainty and adverse economic effects associated with LIBOR-based contracts that do not have effective fallback language, an important step because of the large number of securities issued under New York State law. With the legislation, these contracts will move to the ARRC’s recommended alternative, the Secured Overnight Financing Rate (SOFR), and recommended spread adjustments. Collectively, these actions have solidifi ed the framework for the transition away from LIBOR. Growth in market use of LIBOR alternatives, however, continues to be uneven.
Timeline
On November 30, 2020, the LIBOR administrator, ICE Benchmark Administration (IBA), announced a market consultation on its proposal to cease publication of the most widely used U.S. dollar (USD) LIBOR tenors immediately after June 30, 2023.1 Following this announcement, the Federal Reserve Board, the Offi ce of the Comptroller of the Currency, and the Federal Deposit Insurance Corporation jointly provided guidance encouraging banks to stop new use of USD LIBOR as soon as practicable and, in any event, by the end of 2021. On March 5, 2021, IBA published its conclusion from its mar-ket consultation and, with the U.K. Financial Conduct Authority, confi rmed the end dates proposed in November. On March 9, 2021, the Federal Reserve Board reinforced its position with guidance that instructs bank examiners to review supervised fi rms’ planning for, and progress in, moving away from LIBOR during examinations and other supervisory activities in 2021.
The announcements provided clarity on the timing of LIBOR cessation. While supervisory guidance encourages new use of USD LIBOR to wind down this year, the extension of key USD LIBOR tenors through June 2023 will allow a signifi cant portion of legacy contracts to mature naturally.
By the time ISDA’s IBOR Fallbacks Protocol took effect on January 25, 2021, almost all major deriva-tives market participants had adhered to the new protocol, helping to ensure a successful rollout, and adherence has continued to grow since the effective date. ISDA confi rmed that the March 5 announce-ment fi xed the spreads to be used in the Fallbacks Protocol. The announcement likewise had the effect of fi xing the spreads for LIBOR-based contracts with fallback language recommended by the ARRC.2 However, there is no comparable protocol mechanism for cash products, and, in many cases, there are no effective ways to update fallback language in legacy contracts.
1 The announced consultation followed a mid-November proposal to cease publication of sterling, yen, Swiss franc, and euro LIBors at the end of 2021.
2 ISDa’s spread adjustments are based on the historical five-year median difference between each specific LIBor currency and tenor and the associated fallback rate, which, in the case of uSD LIBor, will be a compound average of SoFr. The arrC has stated that its recommended spread adjustments for cash products will match those of ISDa, although certain technical adjustments will be made to the arrC’s recommendations for consumer products to ensure that consumers do not see a jump in rates at the time of the uSD LIBor cessation.
(continued on next page)

52 FuNDING rISk
Legislation
The regulatory clarity provided by the March 5, 2021, announcement still leaves many market par-ticipants, including retail borrowers, exposed to contractual uncertainty when USD LIBOR ceases in mid-2023. To promote a smooth transition, New York State recently enacted legislation clarifying that, by operation of law, a SOFR-based rate will replace LIBOR in legacy LIBOR contracts that are ambig-uous or silent regarding fallback rates. Most U.S. securities are governed by New York law, so the New York State legislation will reduce transition risks related to inadequate contractual language. Legislation has also been proposed at the federal level to address contracts without a workable fallback that, if enacted, would reduce transition risks on a nationwide basis.
The recently enacted New York State legislation is primarily aimed at securities, which are diffi cult to amend due to the complexities in reaching agreement among the holders of these instruments, but it also includes a safe harbor that would encourage the use of ARRC fallbacks for consumer products (where the lender tends to have discretion to name a successor rate). Table A illustrates the challenges in replacing LIBOR in legacy contracts that, in many cases, envision a polling process similar to that used to create LIBOR. It is unlikely, however, that the current LIBOR banks would choose to respond to private polling after stepping away from the LIBOR panels.
(continued)
LIBOR Transition Update (continued)
Table A. Legacy Contract Provisions in the Absence of LIBOR
Financial instruments Typical existing fallbacksTypical consent requirements
to change fallbacks
oTC uncleared derivatives Bank poll Consent of counterparties
Cleared derivatives CCP designated successor rate(key CCPs have indicated that they will match ISDa)
None
Floating-rate Notes Bank poll. If n.a., then fixed rate at last quoted LIBor
unanimous consent among bond-holders
Securitizations • Bank poll. If n.a., then fixed rate at last quoted LIBor
• agency mBS allow issuer selection or fallback to last quoted LIBor
unanimous consent
Business loans • Bank poll. If n.a., then alternative base rate (prime rate or fed funds rate plus spread, 300+ basis points above LIBor).
• Some bilateral loans have no fallback• recent syndicated loans allow agent to
select a replacement
• Syndicated loans: unanimous consent of lenders
• Bilateral loans: agreement between borrower and lender
mortgages/consumer loans Lender selection Chosen by lender
other payments other contractual payments(for example, purchase agreements, sales contracts) typically have no fallback provisions
Consent of counterparties
Note: oTC is over-the-counter. CCP is central counterparty. ISDa is International Swaps and Derivatives association. mBS is mortgage-backed security. n.a. is not available.
Source: alternative reference rate Committee.
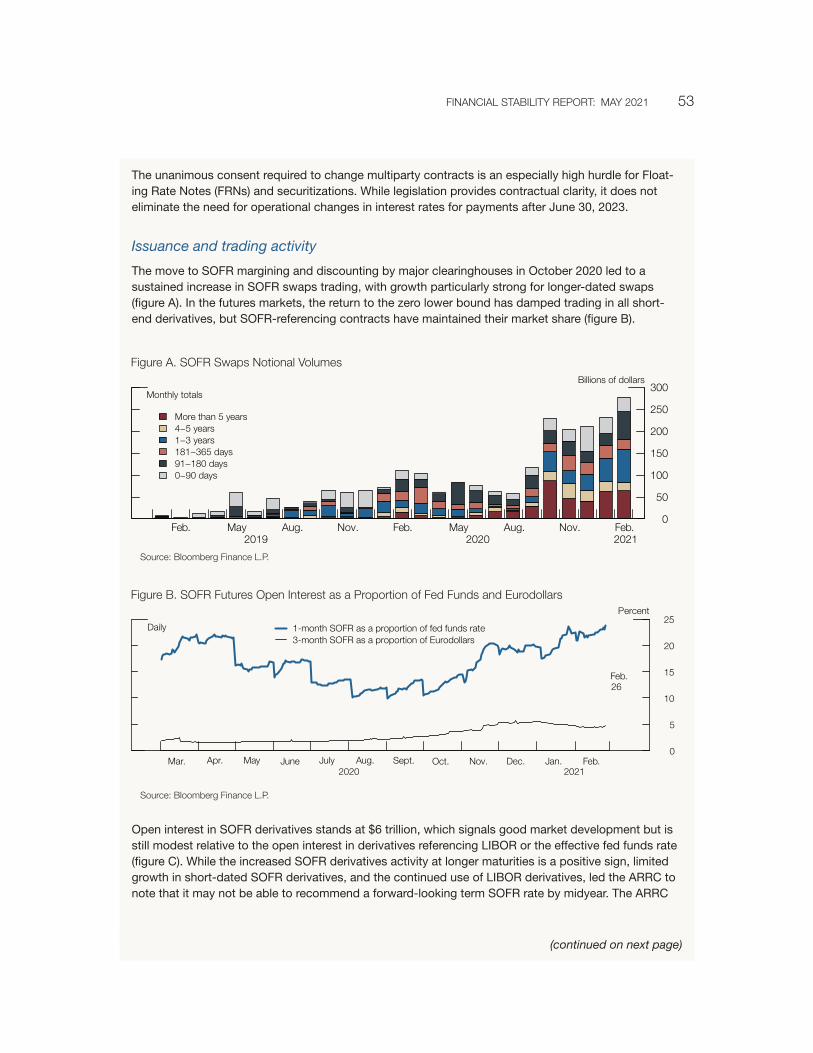
FINaNCIaL STaBILITY rePorT: maY 2021 53
The unanimous consent required to change multiparty contracts is an especially high hurdle for Float-ing Rate Notes (FRNs) and securitizations. While legislation provides contractual clarity, it does not eliminate the need for operational changes in interest rates for payments after June 30, 2023.
Issuance and trading activity
The move to SOFR margining and discounting by major clearinghouses in October 2020 led to a sustained increase in SOFR swaps trading, with growth particularly strong for longer-dated swaps ( fi gure A). In the futures markets, the return to the zero lower bound has damped trading in all short-end derivatives, but SOFR-referencing contracts have maintained their market share (fi gure B).
Open interest in SOFR derivatives stands at $6 trillion, which signals good market development but is still modest relative to the open interest in derivatives referencing LIBOR or the effective fed funds rate (fi gure C). While the increased SOFR derivatives activity at longer maturities is a positive sign, limited growth in short-dated SOFR derivatives, and the continued use of LIBOR derivatives, led the ARRC to note that it may not be able to recommend a forward-looking term SOFR rate by midyear. The ARRC
(continued on next page)
Figure a. SoFr Swaps Notional volumes
Source: Bloomberg Finance L.P.
0
50
100
150
200
250
300Billions of dollars
Feb. May Aug. Nov. Feb. May Aug. Nov. Feb.
Monthly totals
More than 5 years4−5 years1−3 years181−365 days91−180 days0−90 days
2019 2020 2021
0
5
10
15
20
25Daily
Percent
Feb.26
Mar. Apr. May June July Aug. Sept. Oct. Nov. Dec. Jan. Feb.
1-month SOFR as a proportion of fed funds rate3-month SOFR as a proportion of Eurodollars
2020 2021
Figure B. SoFr Futures open Interest as a Proportion of Fed Funds and eurodollars
Source: Bloomberg Finance L.P.

54 FuNDING rISk
also noted that it had envisioned a limited application of SOFR term rates and encouraged market participants to make use of the existing forms of SOFR.
The use of SOFR in cash markets has grown appreciably in certain products, but progress has been slow in other areas. SOFR FRN issuance is now greater than that for LIBOR as a result of GSE and bank issuance. The fi rst nonfi nancial corporate SOFR FRN issuance took place in February 2021. Con-sumer loans have also begun to actively transition from LIBOR: Fannie Mae and Freddie Mac began accepting SOFR adjustable-rate mortgages (ARMs) in 2020 and stopped accepting new LIBOR ARMs at the start of this year.
The business loan market, however, continues to predominantly reference LIBOR. A recently published progress report from the ARRC included responses to a survey of nonfi nancial corporate borrow-ers indicating that most banks are not yet offering LIBOR alternatives or communicating about the alternatives that they will offer. Given the size of the business loan market and the need for borrower preparedness, the reported lack of communication is a concern.
The ARRC has pointed to securitizations as another area where the transition from LIBOR has been slow. Although Freddie Mac has issued several successful SOFR securitizations, most new securitiza-tions continue to reference LIBOR.
LIBOR Transition Update (continued)
0
10
20
30
40
50
60Billions of dollars
Ma Aug. Nov. Feb. May Aug. Nov. Feb. May Aug. Nov. Feb.May
Monthly
Average daily volumeMedian daily volume
2018 2019 2020 2021
Figure C. Trading volumes in Cme’s Front-month SoFr Futures Contract
Source: Cme Group.

FINaNCIaL STaBILITY rePorT: maY 2021 55
Vulnerabilities in Global U.S. Dollar Funding Markets
The U.S. dollar is the leading global funding and investment currency, is used widely for trade and other international transactions, and currently accounts for almost half (more than $22 trillion) of outstanding cross-border bank credit and international debt securities. The wide use of the dollar generates signifi cant benefi ts to both U.S. and foreign residents: It expands the sources of funding to businesses and households; deepens the market for dollar-denominated securities, including U.S. government debt; and can reduce transaction costs for international trade in goods and services. The international role of the dollar has signifi cant benefi ts, but it also provides a conduit through which stresses can be transmitted across borders. Although there are other sources of vulnerabili-ties in global dollar funding markets, this discussion focuses on the role of FBOs (foreign banks that have U.S. offi ces) in these markets, the way FBOs may transmit stress in these markets to the United States, and the role of central bank liquidity swap line arrangements in alleviating those stresses.1
Foreign banking organizations are key participants in lending and borrowing in dollars in the United States and abroad
Global economic activity depends on credit and payments fl owing smoothly and effi ciently, and the central role of the dollar in international fi nance means that well-functioning dollar funding in the United States and abroad plays a critical role. FBOs serve as important conduits of dollar funding to and from U.S. and foreign businesses, governments, households, and NBFIs. Foreign banks, primarily FBOs, supply $15 trillion of dollar-denominated credit (equivalent to more than 17 percent of world GDP), which is about half of the total global dollar credit outstanding of banks.2 FBOs are the principal dollar lenders to non-U.S. residents and also supply more than one-third of dollar bank credit outstanding to U.S. residents (fi gure A). For example, the U.S. offi ces of FBOs supply almost one-fourth of total C&I lending by commercial banks and U.S. branches of FBOs in the United States. FBOs are also large borrowers in U.S. short-term dollar funding markets,
1 Foreign banks are entities organized under the laws of a foreign country that engage directly in the business of banking outside the united States. FBos include foreign banks that control a bank or operate a branch or agency in the united States. a regulatory defini-tion of an FBo is available on the electronic Code of Federal regulations website at https://www.ecfr.gov/cgi-bin/text-idx?SID=d37ef2568e628d9d079d528521151085&mc=true&node=se12.2.211_121&rgn=div8.
2 This fraction measures the global dollar credit (assets) of FBos ($15 trillion) as a proportion of the global dollar credit of all banks, which, in contrast to the cross-border credit mentioned in the preceding paragraph, includes the dollar credit from u.S. banks to u.S. residents and excludes credit from nonbanks (such as nonbank investors’ holdings of securities).
0
5
10
15
Foreign bank creditU.S. bank credit
8.3
1.4
7.0
12.0
Trillions of U.S. dollars
Non-U.S.residents
U.S.residents
Figure a. Dollar-Denominated Bank Credit, by Bank Nationality and Location of Counterparty
Source: Bank for International Settlements (BIS) locational statistics by residence and by nationality; BIS consolidated banking statistics; Federal reserve Board staff calculations.
(continued on next page)

56 FUNDING RISk
accounting for the majority of outstanding repurchase agreement (repo) borrowing, commercial paper, and negotiable certifi cates of deposit in U.S. markets (fi gure B).3
Foreign banking organizations can transmit funding stresses to the United States
FBOs, in general, rely less on insured U.S. retail deposits and thus depend more on wholesale fund-ing markets to fi nance their dollar assets than do U.S. banks. Moreover, a large and growing fraction of the dollar liabilities of FBOs are supplied by non-U.S. residents (fi gure C).4 While the adoption of liquidity requirements has improved the resilience of the intermediate holding companies (IHCs) of foreign banks, these requirements do not currently apply in full to their U.S. branches, although these branches are subject to the consolidated liquidity requirements established by their home country regulators.5 If dollar funding markets seize up, FBOs can be disproportionately affected. In cases when FBOs cannot roll over dollar funding, they may abruptly reduce lending to U.S. households and busi-nesses or liquidate holdings of U.S. assets, thereby transmitting stresses to the U.S. economy.
3 Figure B refers to foreign borrowers, but these are primarily FBOs.4 Figure C refers to all foreign banks, but FBOs account for the bulk of foreign bank liabilities.5 Large FBOs with $50 billion or more in U.S. non-branch assets are required under the rules implementing the Dodd-Frank Act’s
enhanced prudential standards to place virtually all of their U.S. subsidiaries under a top-tier U.S. IHC. Branches of FBOs are not required to be part of the IHC.
Vulnerabilities in Global U.S. Dollar Funding Markets (continued)
0
5
10
15
20
25
2014:Q2 2020:Q2
UnassignedNon-U.S. residents, home countryNon-U.S. residents, otherU.S. residents
Trillions of U.S. dollars
Figure C. Dollar-Denominated Liabilities of Foreign Banks, by Country of Counterparty
Source: Bank for International Settlements (BIS) locational statistics by residence and by nationality; BIS consolidated banking statistics; Federal Reserve Board staff calculations.
0
1
2
3
4
5
Repurchaseagreements
Commercialpaper
NegotiableCDs
Foreign borrowersU.S. borrowers
49%
51%
4.7
67%
1.0
88%
.5
Trillions of U.S. dollars
Figure B. Outstanding U.S. Short-Term Funding Instruments, by Borrower Origin
Source: Federal Reserve Bank of New York; DTCC Solutions LLC, an affiliate of the Depository Trust & Clearing Corporation; Federal Reserve Board (FRB), Statistical Release Z.1, “Financial Accounts of the United States”; FRB, Form FR 2004, Government Securities Dealers Reports; FRBstaff calculations.
(continued)

FINaNCIaL STaBILITY rePorT: maY 2021 57
Swap lines relieved stresses in dollar funding markets in March 2020
The COVID-19 shock hit U.S. and global dollar funding markets simultaneously. Specifi cally, stresses in U.S. money markets reduced access to U.S. short-term wholesale fi nancing for FBOs, while the cost of offshore dollar funding spiked. At the same time, the dollar funding needs of FBOs jumped as U.S. customers drew on credit lines, and the demand for hedging U.S. dollar exposures increased.
The enhancement and expansion of the Federal Reserve’s dollar liquidity swap line arrangements with foreign central banks relieved stresses for FBOs.6 These arrangements with foreign central banks helped restore stability in dollar funding markets and limit additional spillovers to other fi nancial markets in the United States and abroad. Additionally, the Federal Reserve introduced the temporary FIMA (Foreign and International Monetary Authorities) Repo Facility, which allows foreign and interna-tional monetary authorities to temporarily exchange their Treasury securities with the Federal Reserve for U.S. dollars (a repurchase agreement), thus giving these authorities access to dollar liquidity when needed. This facility provides a reliable source of dollar liquidity to a broad range of countries, many of which do not have swap line arrangements with the Federal Reserve. Although draws on the FIMA Repo Facility have been small, the facility can still provide signifi cant benefi ts to market functioning by eliminating the need for its users to sell U.S. assets, including Treasury securities, in order to build up precautionary dollar liquidity.
Swap line usage supported credit to U.S. businesses and confidence in dollar markets
During the spring 2020 COVID-19 shock, FBOs borrowed dollars in foreign central banks’ dol-lar auctions, which were funded by those cen-tral banks’ liquidity swap lines with the Federal Reserve. Use of the dollar auctions helped FBOs fulfi ll their credit commitments to U.S. businesses and boost their liquid asset buffers without having to sell dollar assets or further strain offshore dollar funding markets. FBOs headquartered in the euro area and Japan accounted for the majority of swap-line-funded dollars auctioned in spring 2020 (fi gure D). These foreign banks lent their U.S. offi ces a large amount of the funds obtained in the auctions.7
6 The Federal reserve’s swap lines are with foreign central banks, which then provide dollars to FBos in their jurisdictions via their dollar operations.
7 Technically, dollars obtained through auctions funded by swap lines are credited either to a correspondent bank in the united States that hosts an account for the foreign bank or, more commonly, to the u.S. branch of the borrowing FBo. In the latter case, the funds are immediately recorded as lending from the foreign parent bank to the u.S. branch. Nonetheless, the relationship shown in figure e, where the amounts of swap drawings are similar to the amounts of increased borrowing from abroad and assets held by u.S. offices of FBos for march 2020, is not mechanical or inevitable. rather than funds being remitted from the FBo’s branch to the parent bank,
0
100
200
300
400
500Billions of U.S. dollars
Apr. June Aug. Oct. Dec. Feb.
Weekly
OtherSNBBOEECBBOJ
2020 2021
Figure D. Central Bank Dollar Swaps outstanding during CovID-19
Source: Federal reserve Bank of New York, “u.S. Dollar Liquidity Swap – amounts outstanding.”
(continued on next page)

58 FuNDING rISk
In fi gure E, this lending is refl ected in the increased net borrowing from abroad by U.S. offi ces of European and Asian FBOs in March 2020 (the blue bars), which amounts to more than three-fourths of the dollars auctioned that month (the tan bars). In part, U.S. branches of FBOs used these dollars to increase their reserve balances at the Federal Reserve (reserve balances are a primary component of “cash,” the red bars). Amid the volatile environment of COVID-19, these reserves gave market participants confi dence that FBOs would be able to manage further shocks to dollar funding or credit demand without adverse effects. Dollars obtained from the auctions also supported increased lending by U.S. branches of FBOs to U.S. businesses (the pink bars) as U.S. customers drew their credit lines.8
these funds remained on the balance sheets of u.S. branches days and weeks after being credited and were used largely to fund u.S. lending and reserve balances at the Federal reserve.
8 The pink bars in figure e represent the change in all loans by u.S. branches of FBos, but a large majority of the change is in C&I loans to u.S. addressees.
0
50
100
150
200
250
300
Centralbank swapsauctioned
Changes in select assets
of U.S. branches
Centralbank swapsauctioned
Changes in select assets
of U.S. branches
Billions of U.S. dollars
Change in netborrowing
from abroadby U.S. offices
Change in netborrowing
from abroadby U.S. offices
Cash
Loans
Cash
Loans
European banks Asian banks
Figure e. Changes in march 2020 to Central Bank Liquidity Swaps auctioned and Balance Sheets of Foreign Banking organizations’ u.S. offices
Source: Treasury International Capital; Federal Financial Institutions examination Council, reporting Form FFIeC 002, report of assets and Liabilities of u.S. Branches and agencies of Foreign Banks; Federal reserve Board (FrB) Form Fr 2644, Selected assets and Liabilities of Domestically Chartered Commercial Banks and u.S. Branches and agencies of Foreign Banks; FrB staff calculations; central bank swap auction results.
Vulnerabilities in Global U.S. Dollar Funding Markets (continued)
59
Positive vaccine-related news, additional fiscal support, better-than-expected economic data, and accommodative monetary policy have supported favorable financial conditions and high prices of risky assets. Yet the ultimate extent and duration of the pandemic remain some of the most significant risks to the financial system. The realization of this risk continues to depend largely on the success of public health measures and the vaccination campaign, on the steps households and businesses take to resume economic activity, and on the support provided by economic policy and the remaining government lending and relief programs.
The Federal Reserve routinely engages in discussions with domestic and international policy-makers, academics, community groups, and others to gauge the set of risks of particular concern to these groups. As noted in the box “Salient Shocks to Financial Stability Cited in Market Outreach,” contacts were mostly focused on the risk that COVID-19 variants would become resistant to currently available vaccines, thereby inhibiting the economic recovery or causing another downturn. The following analysis considers possible interactions of existing vulnerabilities with three broad categories of risk, some of which were also raised in the dis-cussions of vulnerabilities: a downturn in U.S. economic activity or a significant reduction in the pace of the ongoing economic recovery, risks emanating from Europe, and risks from adverse developments in EMEs, including China.
Less than anticipated progress with respect to the pandemic could pose risks to the financial system
If the pandemic persists longer than anticipated—especially if new variants of the virus prove resistant to available vaccines—downward pressure on the U.S. economy could derail the ongoing recovery. If those developments occurred, a number of the vulnerabilities identi-fied in this report could interact with the negative shock to the economy and pose additional risk to the U.S. financial system: Asset prices, which have increased in recent months, could suffer significant declines; highly leveraged nonfinancial firms could see their profits weaken, leading to financial stress and defaults; and the finances of households, especially those that are financially fragile, could deteriorate, leading to defaults and further pressure on banks and other lenders.
Although leverage is low at banks and broker-dealers, the leverage of some NBFIs, such as life insurance companies and some hedge funds, is high, exposing them to sharp drops in asset prices and funding risks. Furthermore, prime MMFs as well as bond and bank loan mutual funds are vulnerable to funding strains and sudden redemptions. Stress in the finan-cial system could further interact with potential risks from new digital payment systems, including stablecoin arrangements. These associated risks may require additional safeguards, and regulators are monitoring these developments.30
30 See, for instance, Lael Brainard (2020), “An Update on Digital Currencies,” speech delivered at the Federal Reserve Board and Federal Reserve Bank of San Francisco’s Innovation Office Hours, San Francisco (via webcast), August 13,
Near-Term Risks to the Financial System
60 Near-Term rISkS To THe FINaNCIaL SYSTem
Stresses emanating from a lingering pandemic in Europe also pose risks to the United States because of strong transmission channels
European financial institutions play an important role in global financial intermediation and have notable financial and economic linkages with the United States. Therefore, finan-cial stress in Europe stemming from the adverse consequences of a lingering pandemic could negatively affect the United States. European economies adapted better this winter to declines in mobility and surges in the virus than last spring. Despite this resilience, the winter surge in COVID-19 cases and extended social-distancing measures weighed on the region’s economy, which was still struggling to recover from the depths of the pandemic. As such, European authorities have continued to maintain supportive fiscal and monetary policies as well as bank regulatory and supervisory measures such as forbearance. Nevertheless, if efforts to contain the virus fail and real activity remains depressed, asset quality may dete-riorate materially more than is already expected. If current supportive policies prematurely wear off or new ones are unable to offset the negative effects from this scenario, some sys-temically important European financial institutions could incur notable credit losses. Stresses in Europe could, in turn, affect the U.S. economy and financial system through a further deterioration in risk appetite, a pullback in lending from European banks to U.S. households and businesses, and losses due to large direct and indirect credit exposures.
Adverse developments in emerging market economies spurred in part by a further rise in long-term interest rates could spill over to the United States
In EMEs, difficulties in containing the virus, a possible further rise in long-term interest rates, and waning fiscal capacity pose near-term risks to financial stability. In particu-lar, many highly indebted EME sovereigns and corporations are vulnerable to a sudden increase in debt-servicing costs from sharp rises in global interest rates. If this increase in debt-servicing costs is not accompanied by an improvement in the global economic outlook, some EMEs could again see significant capital outflows, which could be exacerbated by a drop in global risk appetite or problems in EME banking systems. Under these circum-stances, authorities may find it difficult to address the negative economic and financial con-sequences because of limited fiscal capacity. Widespread and persistent EME stress could, in turn, have repercussions for the United States. While faced with more challenging global market conditions, U.S. financial institutions would be subject to heightened risks from both their direct exposures to stressed EME firms and sovereigns as well as their indirect expo-sures through U.S. businesses with strong links to EMEs.
Despite China’s relatively strong economic rebound from the pandemic, it continues to have elevated corporate and local government debt, a vulnerable financial sector, and stretched real estate valuations. Although government policy is still supportive of the broader econ-
https://www.federalreserve.gov/newsevents/speech/brainard20200813a.htm; and Randal K. Quarles (2021), “The FSB in 2021: Addressing Financial Stability Challenges in an Age of Interconnectedness, Innovation, and Change,” speech delivered at the Peterson Institute for International Economics, Washington (via webcast), March 30, https://www.federalreserve.gov/newsevents/speech/quarles20210330a.htm.
FINaNCIaL STaBILITY rePorT: maY 2021 61
omy, Chinese authorities have introduced measures to cool down property markets. If these measures fail to limit speculation, financial vulnerabilities will continue to rise. Under such a scenario, a sudden correction in domestic property markets could put pressure on Chinese property developers and other firms and substantially stress the financial sector. Given the size of China’s economy and financial system as well as its extensive trade linkages with the rest of the world, financial stresses in China could further strain global financial markets and negatively affect the United States.

62 Near-Term rISkS To THe FINaNCIaL SYSTem
Salient Shocks to Financial Stability Cited in Market Outreach
As part of its market intelligence gathering, Federal Reserve staff solicited views from a wide range of contacts on risks to U.S. fi nancial stability. From early February to early April, the staff surveyed
(continued)
Percent
0 10 20 30 40 50 60 70
CRE
Bank asset quality
EM stress
SLR extension
Under-regulated nonbanks
Cryptocurrencies/stablecoins
Reach for yield/leverage
Cyber attacks
TGA drawdown/debt ceiling
Risky asset valuations/correction
U.S.–China tensions
Inflation surge
Sharp rise in real interest rates
Vaccine-resistant variants
Source: Federal reserve Bank of New York survey of 24 market contacts from early February to early april.
Spring 2021: most Cited Potential Shocks over Next 12 to 18 months
Source: Federal reserve Bank of New York survey of 24 market contacts from early September to mid-october.
0 10 20 30 40 50 60 70 80
LIBOR transition
Cyber attacks
Brexit
Geopolitical risks
Sharp rise in real interest rates
CRE defaults/CMBS stress
Bank asset quality/bank profitability
Monetary policy space/efficacy
USD collapse/currency war
Inflation surprises
U.S.–China tensions
Stretched asset valuations
COVID resurgence
Insufficient fiscal stimulus
Corporate & SME stress/defaults
U.S. political uncertainty
Percent
Fall 2020: most Cited Potential Shocks over Next 12 to 18 months
FINaNCIaL STaBILITY rePorT: maY 2021 63
24 market contacts, including professionals at broker-dealers, investors, political advisory fi rms, and academics. COVID-related risks remain the greatest concern, with respondents also focused on market and economic shocks emanating from a potential faster-than-envisaged economic recovery and signifi cant ongoing fi scal and monetary stimulus, including a disruptive rise in real interest rates, a sharp correction in overvalued risky assets, and concern over rising infl ationary pressures. These frequently cited risks differ from those highlighted in the previous round of outreach in the fall, in which respondents widely cited concerns about corporate defaults, the likelihood or effi cacy of additional fi scal and monetary policy support, and U.S. political uncertainty.
Vaccine challenges
Contacts were focused on the risk that COVID-19 variants would become resistant to currently avail-able vaccines, thereby inhibiting the economic recovery or causing another downturn. For context, risks surrounding the pandemic were featured prominently in the previous round of outreach, in which respondents focused on the potential risk of a large resurgence in cases or delays in developing and deploying vaccines. In both rounds of outreach, many noted that asset prices across a range of mar-kets refl ect optimism around vaccine effi cacy and economic reopening, rendering them vulnerable to any virus- or vaccine-related setbacks.
Surge in real interest rates and elevated asset price valuations
Contacts suggested that a sharp rise in real interest rates—caused by either a sooner-than-expected removal of monetary policy accommodation or larger-than-anticipated U.S. Treasury issuance—could pave the way for a correction in risky assets, including emerging market assets. Contacts observed that valuations of many assets have derived signifi cant support from low discount rates and therefore may be susceptible to a spike in yields, especially if unaccompanied by an improvement in the eco-nomic outlook.
Effect of Treasury General Account drawdown
Several respondents noted that bank reserves were expected to continue to increase dramatically, potentially pressuring some short-term interest rates into negative territory and amplifying rate volatil-ity. In particular, some contacts noted the unpredictable trajectory of balances in the Treasury General Account. Several respondents suggested that the outcome of the impending debt ceiling negotiations has contributed to this uncertainty, as a delay in an extension of the debt ceiling suspension could result in a rapid drawdown of the Treasury’s account balances, thereby increasing reserve levels. Some worried that a surge in reserves would increase froth in markets, heightening future risks of a disruptive correction.
Escalation of U.S.–China tensions
Respondents also cited various geopolitical threats that could potentially destabilize markets. Several contacts worried about the possible escalation of tensions between the United States and China, par-ticularly surrounding Taiwan.

65
Figure NotesFigure 1-1 The 2- and 10-year Treasury rates are the constant-maturity yields based on the most actively traded securities.
Figure 1-2 Term premiums are estimated from a 3-factor term structure model using Treasury yields and Blue Chip interest rate forecasts.
Figure 1-3 Implied volatility on 10-year swap rate, 1 month ahead, derived from swaptions.
Figure 1-4 Market depth is defined as the average top 3 bid and ask quote sizes for on-the-run Treasury securities.
Figure 1-5 The triple-B series reflects the effective yield of the ICE Bank of America Merrill Lynch (BofAML) triple-B U.S. Corporate Index (C0A4), and the high-yield series reflects the effec-tive yield of the ICE BofAML U.S. High Yield Index (H0A0).
Figure 1-6 The triple-B series reflects the option-adjusted spread of the ICE Bank of America Merrill Lynch (BofAML) triple-B U.S. Corporate Index (C0A4), and the high-yield series reflects the option-adjusted spread of the ICE BofAML U.S. High Yield Index (H0A0).
Figure 1-7 The excess bond premium (EBP) is the residual of a regression of corporate bond spreads on controls for firms’ expected defaults. By construction, its historical mean is zero. Positive (nega-tive) EBP values indicate that investors’ risk appetite is below (above) its historical mean.
Figure 1-8 The data show secondary-market discounted spreads to maturity. Spreads are the con-stant spread used to equate discounted loan cash flows to the current market price. B-rated spreads begin in July 1997.
Figure 1-9 Aggregate forward price-to-earnings ratio of S&P 500 firms. Based on expected earnings for 12 months ahead.
Figure 1-10 Aggregate forward earnings-to-price ratio of S&P 500 firms. Based on expected earnings for 12 months ahead. Expected real Treasury yields are calculated from the 10-year consumer price index inflation forecast and the smoothed nominal yield curve estimated from off-the-run securities.

66 Figure Notes
Figure 1-11 Realized volatility estimated from 5-minute returns using an exponentially weighted moving average with 75 percent of the weight distributed over the past 20 days.
Box: Vulnerabilities from Asset Valuations, Risk Appetite, and Low Interest Rates
Figure A The left panel shows a histogram of a staff estimate of the equity risk premium for Janu-ary 1995 through February 2021. The equity risk premium estimate shown is the forward earnings-to-price ratio for the S&P 500 less the 10-year real Treasury yield. Expected real Treasury yields are calculated from a 10-year consumer price index inflation forecast. The right panel shows a histogram of the excess bond premium measure of Gilchrist and Zakrajšek (2012) for January 1995 through February 2021.
Figure B Includes all domestic initial public offerings (IPOs). Special purpose acquisition companies are defined using Security Data Company’s (SDC) “blank flag” check. Key identifies bars in order from bottom to top.
Figure 1-12 Series deflated using the consumer price index and seasonally adjusted by Federal Reserve Board staff. The data begin in 1997 for the equal-weighted curve and 1996 for the value-weighted curve.
Figure 1-13 Data are a 12-month moving average of weighted capitalization rates in the industrial, retail, office, and multifamily sectors, based on national square footage in 2009.
Figure 1-14 Banks’ responses are weighted by their commercial real estate loan market shares. The shaded bars with top caps indicate periods of business recession as defined by the National Bureau of Economic Research (NBER): March 2001–November 2001, December 2007–June 2009, and February 2020–present. As of the publication of this report, the NBER has not declared an end to the current recession. Survey respondents to the Senior Loan Officer Opinion Survey on Bank Lending Practices are asked about the changes over the quarter.
Figure 1-15 The data for the United States start in 1997. Midwest index is a weighted average of Corn Belt and Great Plains states that comes from staff calculations. Values are given in real terms. The data extend through July 2020.
Figure 1-16 The data for the United States start in 1998. Midwest index is the weighted average of Corn Belt and Great Plains states. The data extend through July 2020.
Figure 1-18 Valuation is measured as the deviation from the long-run relationship between the price-to-rent ratio and real 10-year Treasury yield.

FINaNCIaL STaBILITY rePorT: maY 2021 67
Figure 1-19 The data are seasonally adjusted. The data for Phoenix start in 2002. Monthly rent values for Phoenix are interpolated from semiannual numbers. Percentiles are based on 19 metropolitan statistical areas.
Figure 2-1 The shaded bars with top caps indicate periods of business recession as defined by the National Bureau of Economic Research (NBER): January 1980–July 1980, July 1981–November 1982, July 1990–March 1991, March 2001–November 2001, December 2007–June 2009, and February 2020–present. As of the publication of this report, the NBER has not declared an end to the current recession. GDP is gross domestic product.
Figure 2-2 The shaded bars with top caps indicate periods of business recession as defined by the National Bureau of Economic Research (NBER): January 1980–July 1980, July 1981–November 1982, July 1990–March 1991, March 2001–November 2001, December 2007–June 2009, and February 2020–present. As of the publication of this report, the NBER has not declared an end to the current recession. GDP is gross domestic product.
Figure 2-3 Nominal debt growth is seasonally adjusted and is translated into real terms after subtracting the growth rate of the price deflator for core personal consumption expenditure price.
Figure 2-4 Institutional leveraged loans generally exclude loan commitments held by banks.
Figure 2-5 Gross leverage is an asset-weighted average of the ratio of firms’ book value of total debt to book value of total assets. The 75th percentile is calculated from a sample of the 2,500 larg-est firms by assets. The dashed sections of the lines in the first quarter of 2019 reflect the structural break in the series due to the 2019 compliance deadline for Financial Accounting Standards Board rule Accounting Standards Update 2016-02. The new accounting standard requires operating leases, previously considered off-balance-sheet activities, to be included in measures of debt and assets.
Figure 2-6 The interest coverage ratio is earnings before interest and taxes divided by interest pay-ments. Firms with leverage less than 5 percent and interest payments less than $500,000 are excluded.
Figure 2-7 The data begin in December 1998. The default rate is calculated as the amount in default over the past 12 months divided by the total outstanding volume at the beginning of the 12-month period. The shaded bars with top caps indicate periods of business reces-sion as defined by the National Bureau of Economic Research (NBER): March 2001–

68 FIGure NoTeS
November 2001, December 2007–September 2009, and February 2020–present. As of the publication of this report, the NBER has not declared an end to the current recession.
Figure 2-8 Volumes are for large corporations with earnings before interest, taxes, depreciation, and amortization (EBITDA) greater than $50 million and exclude existing tranches of add-ons and amendments as well as restatements with no new money. Key identifies bars in order from top to bottom.
Figure 2-9 Subprime are those with an Equifax Risk Score below 620; near prime are from 620 to 719; prime are greater than 719. Scores are measured contemporaneously. Student loan balances before 2004 are estimated using average growth from 2004 to 2007, by risk score. The data are converted to constant 2020 dollars using the consumer price index.
Figure 2-10 Year-over-year change in balances for the second quarter of each year among those house-holds whose balance increased over this window. Subprime are those with an Equifax Risk Score below 620; near prime are from 620 to 719; prime are greater than 719. Scores were measured one year ago. The data are converted to constant 2020 dollars using the consumer price index. Key identifies bars in order from left to right.
Figure 2-11 Loss mitigation includes tradelines that have a narrative code of forbearance, natural disas-ter, payment deferral (including partial), loan modification (including federal government plans), or loans with no scheduled payment and a nonzero balance. Delinquent includes loans reported to the credit bureau at least 30 days past due. The line break represents the data transitioning from quarterly to monthly beginning January 2020.
Figure 2-12 Estimated share of mortgages with negative equity according to CoreLogic and Zillow. For CoreLogic, the data are monthly. For Zillow, the data are quarterly and, for 2017, are avail-able only for the first and fourth quarters.
Figure 2-13 Housing leverage is estimated as the ratio of the average outstanding mortgage loan balance for owner-occupied homes with a mortgage to (1) current home values using the CoreLogic national house price index and (2) model-implied house prices estimated by a staff model based on rents, interest rates, and a time trend.
Figure 2-14 The data are converted to constant 2020 dollars using the consumer price index. Student loan data begin in 2005.
Figure 2-15 Subprime are those with an Equifax Risk Score below 620; near prime are from 620 to 719; prime are greater than 719. Scores are measured contemporaneously. The data are converted to constant 2020 dollars using the consumer price index.

FINaNCIaL STaBILITY rePorT: maY 2021 69
Figure 2-16 Loss mitigation includes tradelines that have a narrative code of forbearance, natural disas-ter, payment deferral (including partial), loan modification (including federal government plans), or loans with no scheduled payment and a nonzero balance. Delinquent includes loans reported to the credit bureau as at least 30 days past due. The line break represents the data transitioning from quarterly to monthly beginning January 2020.
Figure 2-17 Subprime are those with an Equifax Risk Score below 620; near prime are from 620 to 719; prime are greater than 719. Scores are measured contemporaneously. The data are converted to constant 2020 dollars using the consumer price index.
Figure 2-18 Delinquency is at least 30 days past due, excluding severe derogatory loans. The data are four-quarter moving averages. Subprime are those with an Equifax Risk Score below 620; near prime are from 620 to 719; prime are greater than 719. Credit scores are lagged four quarters.
Box: The Paycheck Protection Program Liquidity Facility
Figure B The data are not seasonally adjusted. Liquid deposits are the sum of demand deposits and other liquid deposits (other checkable deposits and savings deposits).
Figure C Averages of Bloomberg deposit indexes and Federal Home Loan Bank of Des Moines advance rates. PPPLF is the Paycheck Protection Program Liquidity Facility.
Figure 3-1 The data are seasonally adjusted by Federal Reserve Board staff. Sample consists of banks as of 2020:Q4. Before 2014:Q1, the numerator of the common equity Tier 1 ratio is Tier 1 common capital for advanced-approaches bank holding companies (BHCs) and interme-diate holding companies (IHCs) (before 2015:Q1 for non-advanced-approaches BHCs). Afterward, the numerator is common equity Tier 1 capital. G-SIBs are global systemically important U.S. banks. Large non–G-SIBs are BHCs and IHCs with greater than $100 billion in total assets that are not G-SIBs. The denominator is risk-weighted assets. The shaded bars with top caps indicate periods of business recession as defined by the National Bureau of Economic Research (NBER): March 2001–November 2001, December 2007–June 2009, and February 2020–present. As of the publication of this report, the NBER has not declared an end to the current recession.
Figure 3-2 Bank equity is total equity capital net of preferred equity and intangible assets, and assets are total assets. The data are seasonally adjusted by Federal Reserve Board staff. G-SIBs are U.S. global systemically important banks. Large non–G-SIBs are bank holding companies (BHCs) and intermediate holding companies with greater than $100 billion in total assets that are not G-SIBs. The shaded bars with top caps indicate periods of business recession

70 FIGure NoTeS
as defined by the National Bureau of Economic Research (NBER): July 1990–March 1991, March 2001–November 2001, December 2007–June 2009, and February 2020–present. As of the publication of this report, the NBER has not declared an end to the current recession.
Figure 3-3 Weighted median leverage of nonfinancial firms that borrow using commercial and indus-trial loans from the 26 banks that have filed in every quarter since 2013:Q1. Leverage is measured as the ratio of the book value of total debt to the book value of total assets of the borrower, as reported by the lender, and the median is weighted by committed amounts.
Figure 3-4 Banks’ responses are weighted by their commercial and industrial loan market shares. Survey respondents to the Senior Loan Officer Opinion Survey on Bank Lending Prac-tices are asked about the changes over the quarter. Results are shown for loans to large and medium-sized firms. The shaded bars with top caps indicate periods of business recession as defined by the National Bureau of Economic Research (NBER): March 2001–November 2001, December 2007–June 2009, and February 2020–present. As of the publica-tion of this report, the NBER has not declared an end to the current recession.
Figure 3-5 Leverage is calculated by dividing total assets by equity.
Figure 3-6 Ratio is calculated as (total assets – separate account assets)/(total capital – accumulated other comprehensive income) using generally accepted accounting principles. The largest 10 publicly traded life and property and casualty insurers are represented.
Figure 3-7 Leverage is computed as the ratio of hedge funds’ gross notional exposure to net asset value. Gross notional exposure includes the nominal value of all long and short positions and derivative notional exposures. Options are delta adjusted, and interest rate derivatives are reported at 10-year bond equivalents. Data are reported on a three-quarter lag.
Figure 3-8 Net percentage equals the percentage of institutions that reported increased use of financial leverage over the past three months minus the percentage of institutions that reported decreased use of financial leverage over the past three months. REIT is real estate investment trust.
Figure 3-9 The data from the first quarter of 2021 are annualized to create the 2021 bar. CMBS is com-mercial mortgage-backed securities; CDO is collateralized debt obligation; RMBS is residen-tial mortgage-backed securities; CLO is collateralized loan obligation. The “Other” category consists of other asset-backed securities (ABS) backed by credit card debt, student loans, equipment, floor plans, and miscellaneous receivables; resecuritized real estate mortgage investment conduit (Re-REMIC) RMBS; and Re-REMIC CMBS. The data are converted to constant 2021 dollars using the consumer price index. Key identifies bars in order from top to bottom.
FINaNCIaL STaBILITY rePorT: maY 2021 71
Figure 3-10 Committed amounts on credit lines and term loans extended to nonbank financial firms by a balanced panel of 26 bank holding companies that have filed Form FR Y-14Q in every quarter since 2018:Q1. Nonbank financial firms are identified based on reported North American Industry Classification System (NAICS) codes. In addition to NAICS codes, a name-matching algorithm is applied to identify specific entities such as real estate investment trusts (REITs), special purpose entities, collateralized loan obligations (CLOs), and asset-backed securities (ABS). REITs incorporate both mortgage (trading) REITs and equity REITs. Broker-dealers also include commodity contracts dealers and brokerages and other securities and commodity exchanges. Other financial vehicles include closed-end investment and mutual funds. BDC is business development company.
Figure 3-11 2020:Q4 over 2019:Q4 growth rates as of year-end 2020. REIT is real estate investment trust; PE is private equity; BDC is business development company; SPE is special purpose entity; CLO is collateralized loan obligation; ABS is asset-backed securities. Key identifies bars in order from left to right.
Figure 4-1 The black striped area denotes the period from 2008:Q4 to 2012:Q4 when insured deposits increased because of the Transaction Account Guarantee program. “Other” consists of variable-rate demand obligations (VRDOs), federal funds, funding-agreement-backed securi-ties, private liquidity funds, offshore money market funds, and local government investment pools. Securities lending includes only lending collateralized by cash. GDP is gross domestic product. Values for VRDOs come from Bloomberg beginning in 2019:Q1. See Jack Bao, Josh David, and Song Han (2015), “The Runnables,” FEDS Notes (Washington: Board of Governors of the Federal Reserve System, September 3), https://www.federalreserve.gov/econresdata/notes/feds-notes/2015/the-runnables-20150903.html.
Figure 4-2 Liquid assets are cash plus estimates of securities that qualify as high-quality liquid assets as defined by the Liquidity Coverage Ratio requirement. Accordingly, Level 1 assets and discounts and restrictions on Level 2 assets are incorporated into the estimate. G-SIBs are U.S. global systemically important banks. Large non–G-SIBs are bank holding companies (BHCs) and intermediate holding companies with greater than $100 billion in total assets that are not G-SIBs.
Figure 4-3 Short-term wholesale funding is defined as the sum of large time deposits with maturity less than one year, federal funds purchased and securities sold under agreements to repur-chase, deposits in foreign offices with maturity less than one year, trading liabilities (exclud-ing revaluation losses on derivatives), and other borrowed money with maturity less than one year. The shaded bars with top caps indicate periods of business recession as defined by the National Bureau of Economic Research (NBER): March 2001–November 2001, December 2007–June 2009, and February 2020–present. As of the publication of this report, the NBER has not declared an end to the current recession.
72 FIGure NoTeS
Figure 4-4 The data are converted to constant 2021 dollars using the consumer price index.
Figure 4-5 The data are converted to constant 2020 dollars using the consumer price index.
Figure 4-6 The data are converted to constant 2021 dollars using the consumer price index. Key identi-fies series in order from top to bottom.
Figure 4-7 Mutual fund assets under management as of February 2021 included $2,541 billion in investment-grade bond funds, $292 billion in high-yield bond funds, and $71 billion in bank loan funds.
Figure 4-8 Securitized products include collateralized loan obligations for corporate debt, private-label commercial mortgage-backed securities for commercial real estate, and private-label residen-tial mortgage-backed securities and asset-backed securities backed by autos, credit cards, consumer loans, and student loans for other asset-backed securities. Illiquid corporate debt includes private placements, bank/syndicated loans, and high-yield bonds. Alternative invest-ments include assets filed under Schedule BA. P&C is property and casualty. Key identifies bars in order from top to bottom.
Figure 4-9 The data are converted to constant 2020 dollars using the consumer price index. FHLB is Federal Home Loan Bank. Keys identify series in order from top to bottom.
Box: LIBOR Transition Update
Figure A Key identifies bars in order from bottom to top. SOFR is Secured Overnight Financing Rate.
Figure B SOFR is Secured Overnight Financing Rate.
Figure C Key identifies bars in order from left to right. SOFR is Secured Overnight Financing Rate.
Box: Vulnerabilities in Global U.S. Dollar Funding Markets
Figure A Excludes intragroup credit and local credit in China. Data as of 2020:Q2. Key identifies bars in order from left to right.
Figure B Data as of December 2020. Repurchase agreements include those reported by banks and pri-mary dealers on the Statistical Release Z.1 and Form FR 2004, respectively. Neither DTCC Solutions LLC nor any of its affiliates shall be responsible for any errors or omissions in any DTCC data included in this publication, regardless of the cause and, in no event, shall
FINaNCIaL STaBILITY rePorT: maY 2021 73
DTCC or any of its affiliates be liable for any direct, indirect, special, or consequential dam-ages, costs, expenses, legal fees, or losses (including lost income or lost profit, trading losses and opportunity costs) in connection with this publication. CD is certificate of deposit. Key identifies shaded areas in order from top to bottom.
Figure C Excludes intragroup liabilities and liabilities reported by China and Russia. Key identifies bars in order from top to bottom.
Figure D BOJ is Bank of Japan, ECB is European Central Bank, BOE is Bank of England, SNB is Swiss National Bank, and “Other” includes Reserve Bank of Australia, Monetary Authority of Singapore, Norges Bank, Danmarks Nationalbank, Bank of Korea, and Bank of Mexico. Key identifies bars in order from bottom to top.
Figure E Change in net borrowing from abroad by U.S. offices is the change in gross liabilities minus gross claims from the Treasury International Capital Form B by any reporter with a foreign bank parent. Cash on branch balance sheets primarily includes reserve balances.
Box: Salient Shocks to Financial Stability Cited in Market Outreach
Figure Spring 2021 Responses are to the following question: “Over the next 12–18 months, which shocks, if realized, do you think would have the greatest negative effect on the functioning of the U.S. financial system?” TGA is Treasury General Account. EM is emerging market. SLR is sup-plementary leverage ratio. CRE is commercial real estate.
Figure Fall 2020 Responses are to the following question: “Over the next 12–18 months, which shocks, if realized, do you think would have the greatest negative effect on the functioning of the U.S. financial system?” SME is small and medium-sized enterprises. CRE is commercial real estate. CMBS is commercial mortgage-backed security.

Board of Governors of the Federal Reserve System
www.federalreserve.gov
0521