finding the sweet spot: value creation for consumer ... · sweet spot of sustained growth...
TRANSCRIPT
Finding the Sweet SpotValue Creation for Consumer Companies
in a Lower-Growth Economy
R
T V C R C C

The Boston Consulting Group (BCG) is a global manage-ment consulting fi rm and the world’s leading advisor on business strategy. We partner with clients in all sectors and regions to identify their highest-value opportunities, address their most critical challenges, and transform their businesses. Our customized approach combines deep in sight into the dynamics of companies and markets with close collaboration at all levels of the client organization. This ensures that our clients achieve sustainable compet-itive advantage, build more capable organizations, and secure lasting results. Founded in 1963, BCG is a private company with 70 offi ces in 41 countries. For more infor-mation, please visit www.bcg.com.
Finding the Sweet SpotValue Creation for Consumer Companies
in a Lower-Growth Economy
T V C R C C
bcg.com
Marcus Bokkerink
Patrick Ducasse
Jeff Gell
Eric Olsen
Frank Plaschke
Daniel Stelter
October 2010

© The Boston Consulting Group, Inc. 2010. All rights reserved.
For information or permission to reprint, please contact BCG at:E-mail: [email protected]: +1 617 850 3901, attention BCG/PermissionsMail: BCG/Permissions The Boston Consulting Group, Inc. One Beacon Street Boston, MA 02108 USA
The financial analyses in this report are based on public data and forecasts that have not been verified by BCG and on assump-tions that are subject to uncertainty and change. The analyses are intended only for general comparisons across companies and industries and should not be used to support any individual investment decision.

F S S
Contents
Executive Summary 4
The 2010 Consumer-Company Value Creators 6
The Coming Era of Lower Growth 16Why Lower Growth Is Likely 16Challenges and Opportunities for Consumer Companies 18
Value Creation in Lower-Growth Environments 20The Declining Importance of Capital Gains 20The Growing Importance of Cash Payout 20The Growth Paradox 23Five Growth Strategies for a Lower-Growth Economy 24
A Fresh Look at Value Creation Strategy 26Value-Creating Growth 26Balanced Capital Deployment 27Scenario-Based Strategic Planning 28A Success Story 28
Ten Questions Every CEO Should Know How to Answer 30
For Further Reading 31
Note to the Reader 32

T B C G
Executive Summary
F inding the Sweet Spot: Value Creation for Consumer Companies in a Lower-Growth Economy has been adapted from the twel h an-nual report in the Value Creators series pub-lished by The Boston Consulting Group. Each
year, we publish detailed empirical rankings of the stock market performance of the world’s top consumer-company value creators and distill managerial lessons from their suc-cess. We also highlight key trends in the global economy and world capital markets and describe how these trends are likely to shape future priorities for value creation. Finally, we share our latest analytical tools and client experiences to help companies better manage value creation. This year’s report addresses the challenges consumer companies face in delivering above-average shareholder returns in a global economy characterized by below-average growth.
Although 2009 saw a strong rebound in equity values, global capital markets are still laboring under the shadow of the worldwide fi nancial crisis that began in 2008.
Global market indexes were up roughly 30 percent in ◊ 2009, but the weighted average annual total share-holder return (TSR) for this year’s consumer-company Value Creators database, which covers the fi ve-year period from 2005 through 2009, was 6.7 percent. This is considerably below the long-term historical average of approximately 10 percent.
Market volatility remains high; as of this writing, most ◊ equity indexes are fl at for 2010.
Despite real signs of economic recovery, macroeco-◊ nomic fundamentals in the developed economies re-main under signifi cant pressure.
The top ten value creators in the three consumer-industry sectors we sampled—consumer goods, retail, and travel and tourism—substantially out-paced not only the average annual TSR for their own sector but also that of the total consumer-company sample.
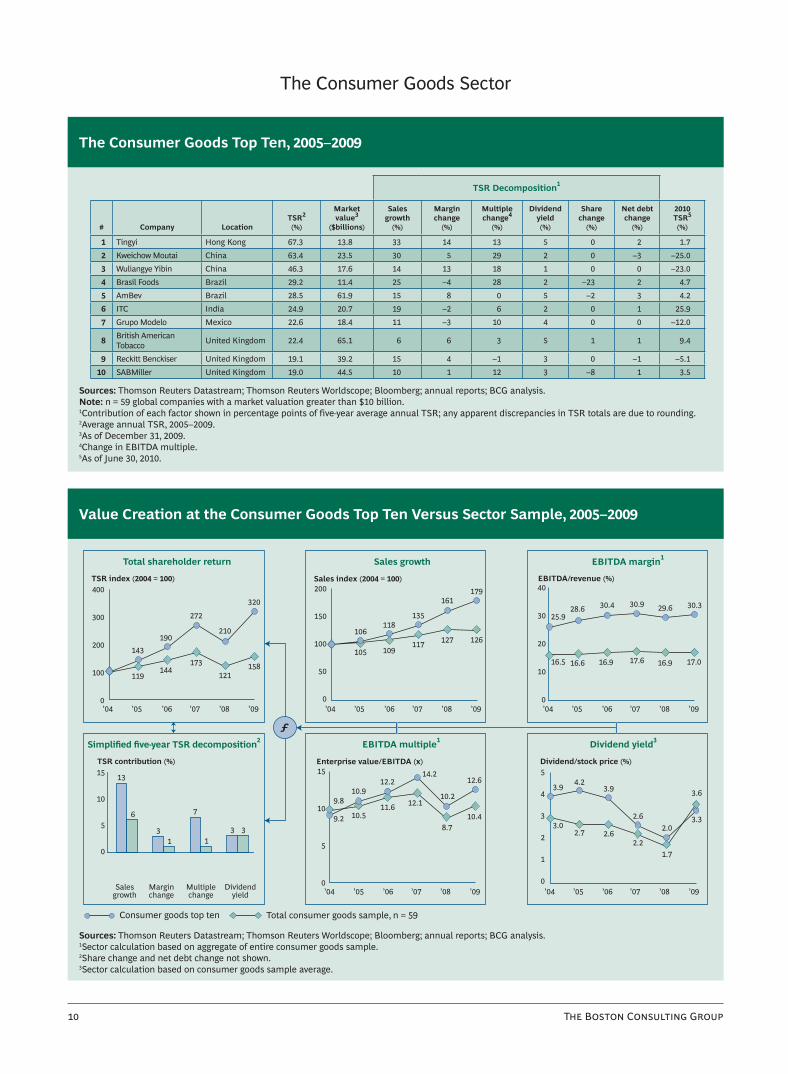
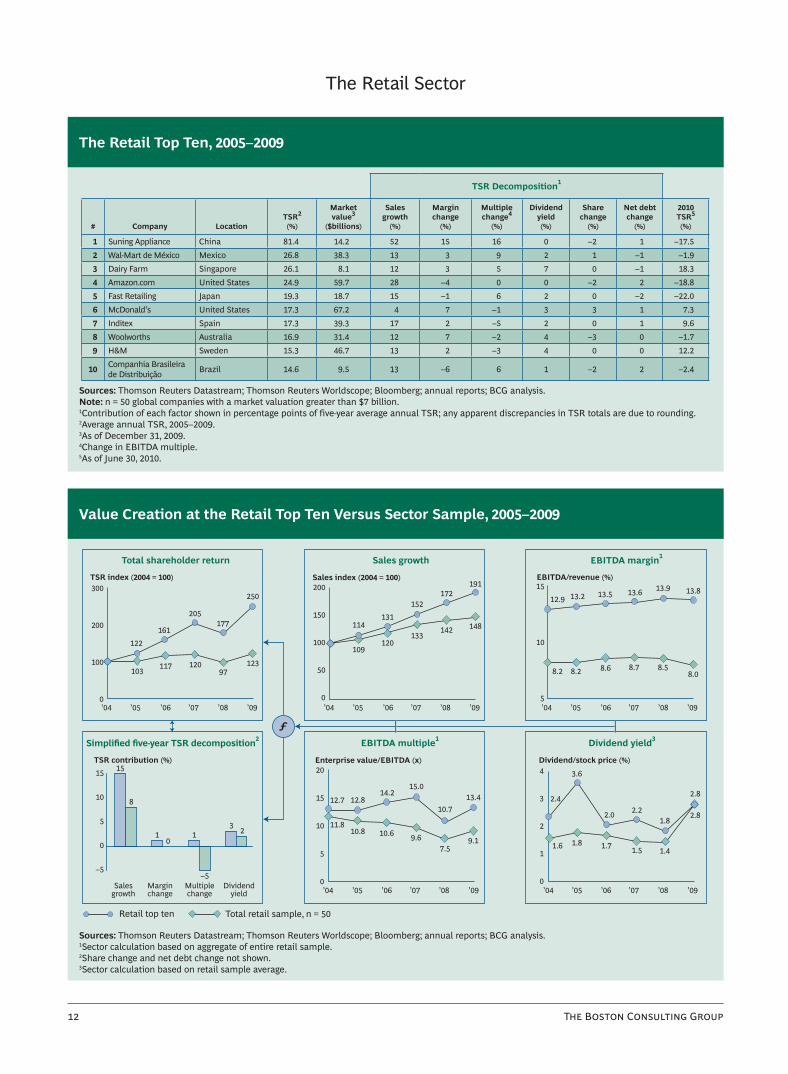
The average annual TSR of the top ten companies in ◊ the consumer goods sector was 16.7 percentage points higher than that of the consumer goods sample; the average annual TSR of the retail-sector top ten was 15.9 percentage points higher than that of the retail sample; and the average annual TSR of the travel-and-tourism top ten was 21.1 percentage points higher than that of the travel and tourism sample.
The average annual TSR for the top ten performers in ◊ all three sectors combined was more than fi ve times greater than that of the total consumer-company sam-ple of 157 companies.
BCG believes that the world’s developed economies are entering an extended period of below-average growth.
Recessions that are preceded by a fi nancial crisis tend ◊ to be followed by signifi cant shortfalls in postrecession GDP, according to a recent report by the International Monetary Fund (IMF).
In recent decades, growth in U.S. GDP has been the en-◊ gine of the global economy; but the high indebtedness of U.S. consumers makes it unlikely that the U.S. econ-omy will be able to continue to play that role—despite unprecedented stimulus spending by the U.S. govern-ment and the Federal Reserve.

F S S
Although developing economies such as Brazil, China, ◊ and India continue to grow rapidly and consumer con-fi dence there is high, they will not be able to pull the Western economies forward (indeed, these economies continue to depend on exports to fuel their rapid growth)—but companies that gain a solid foothold in those high-growth markets can pull themselves forward.
BCG estimates that the average annual GDP growth ◊ in developed economies from 2010 through 2015 will be in the neighborhood of 2 percent, with some coun-tries experiencing growth rates as low as 1 percent or even less.
A low-growth economy has big implications for how companies create shareholder value.
Lower revenue growth, growing pressure on margins ◊ as companies compete for fewer growth opportunities,and declining valuation multiples (refl ecting shi ing investor expectations) will make capital gains a rela-tively less important source of TSR—although profi t-able growth will continue to be the key performance diff erentiator for the companies that deliver the high-est shareholder returns.
As multiples decline, the yield from payouts of free ◊ cash fl ow will increase, making these direct payments to shareholders in the form of dividends or stock re-purchases a more important source of TSR. In other words, optimizing payouts can drive superior share-holder returns.
The very best performers (those that will make our an-◊ nual rankings of the top ten value creators in the con-sumer goods, retail, and travel and tourism sectors in the coming years) will be companies that fi nd the sweet spot of sustained growth representing the right combination of above-average profi table growth in what is a much tougher and more competitive eco-nomic environment with increased cash payouts.
This year’s Value Creators report for consumer com-panies addresses the special challenges and opportu-nities for value creation in a low-growth economy.
We begin by making the case that the world’s devel-◊ oped economies face an extended period of below-average growth.
Next, we describe the distinctive dynamics of value ◊ creation in a low-growth environment and a two-speed economy.
We then suggest steps companies should take to re-◊ think their approach to growth and capital deployment and to reset their value-creation strategy in response to these new dynamics.
About the AuthorsMarcus Bokkerink is a senior partner and managing director in the London offi ce of The Boston Consulting Group and leads the Consumer Goods practice in the United Kingdom; you may contact him by e-mail at [email protected]. Patrick Ducasse is a senior partner and managing director in BCG’s Paris offi ce and the global leader of the fi rm’s Consumer and Retail prac-tice; you may contact him by e-mail at [email protected]. Jeff Gell is a partner and managing director in BCG’s Chicago offi ce, a core member of the Consumer and Corporate Development practices, and global colead-er of the fi rm’s mergers and acquisitions sector; you may contact him by e-mail at gell.jeff @bcg.com. Eric Olsen is a senior partner and managing director in BCG’s Chicago offi ce and the fi rm’s global leader for value creation strat-egy; you may contact him by e-mail at [email protected]. Frank Plaschke is a partner and managing director in BCG’s Munich offi ce and the fi rm’s European leader for value creation strategy; you may contact him by e-mail at [email protected]. Daniel Stelter is a senior partner and managing director in BCG’s Berlin office and the global leader of the firm’s Corporate Development practice; you may contact him by e-mail at [email protected].

T B C G
The 2010 Consumer-Company Value Creators
We are pleased to announce the 2010 consumer-company Value Creators rankings for the five-year period from 2005 through 2009. Our sample encompasses 157 global companies
across three consumer-industry sectors: consumer goods, retail, and travel and tourism.
The 2010 consumer-company Value Creators rankings, which conclude this chapter, show our rankings of the overall top ten consumer-industry companies and the top ten companies within each of the three consumer-industry sectors that we analyzed.
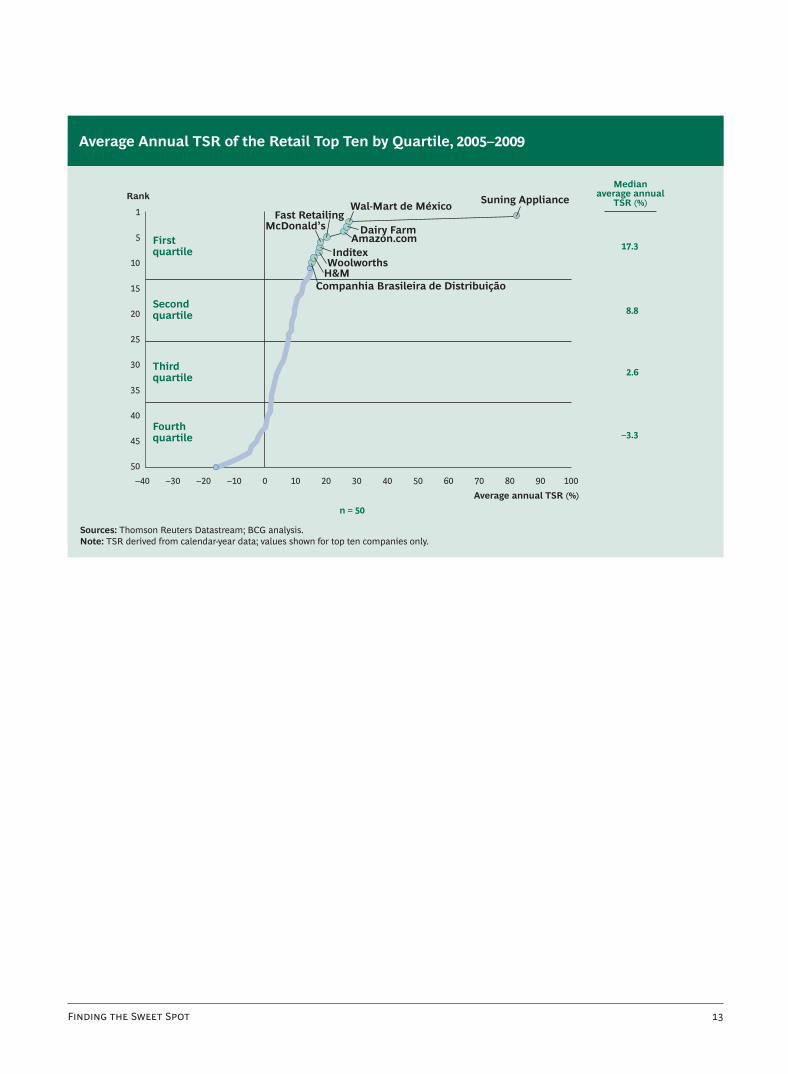
We also compare value creation of the top performers with that of the total industry or sector sample. In addi-tion, we reveal the leading companies’ average annual total shareholder return (TSR) by quartile.
As always, the leading companies in our sample substan-tially outpaced not only the average annual TSR for their own sector but also that of the total consumer-company sample.
For example, the average annual TSR of the top ten com-panies in the consumer goods sector was 16.7 percentage points higher than that of the consumer goods sample; the average annual TSR of the retail-sector top ten was 15.9 percentage points higher than that of the retail sam-ple; and the average annual TSR of the travel-and-tour-ism top ten was 21.1 percentage points higher than that of the travel and tourism sample.
The average annual TSR of the overall top-ten consumer companies (across all three sectors—consumer goods, re-tail, and travel and tourism—combined) was about
35 percent, which was more than fi ve times greater than that of the total consumer-company sample.
However, the weighted average annual TSR for the full set of 157 global companies in our sample was only 6.7 percent. This relatively poor performance (considerably below the long-term historical average of approximately 10 percent) refl ects the precipitous decline in market val-ues in late 2008 owing to the global fi nancial crisis—a de-cline that the rebound in 2009 equity values only partly recovered.1
Our rankings are based on an analysis of TSR at the larg-est publicly traded global consumer-goods, retail, and travel and tourism companies. This year’s sample in-cludes the 59 largest consumer-goods companies, the 50 largest retailers, and the 48 largest travel and tourism companies for the fi ve-year period from 2005 through 2009. We defi ned the largest companies by sector-specifi c market value hurdles.
To arrive at this sample, we began with TSR data for more than 4,000 companies provided by Thomson Reuters. We then refined the sample by taking the following three steps: We eliminated all companies that were not listed on a world stock exchange for the full five years of our study or did not have at least 25 percent of their shares available on public capital markets. We also eliminated all companies that were not in the three sectors of the consumer industry we were tracking, to end up with about 1,000 companies. We then established an appropriate minimum market-valuation hurdle per sector to eliminate the smallest companies.
1. See “Rebound but Not Yet Recovery,” BCG article, March 2010.

F S S
The rankings are based on fi ve-year TSR performance from 2005 through 2009.2 We also show TSR performance for 2010, through June 30. In addition, we break down TSR performance into six investor-oriented fi nancial met-rics that BCG has identifi ed as critical value drivers.3
What kind of improvement in TSR was necessary to achieve truly superior performance, given the sample average? To qualify for the top ten in our sample of 157 global consumer companies, a company had to achieve an average annual TSR of 26.1 percent. Top performers achieved an average annual TSR of 60 to 80 percent. Companies in the top quartile of the three consumer-indus-try sectors had a TSR of at least 13.4 per-cent per year. The weighted average annual TSR for the top ten consumer-goods companies was 26.2 percent; for retail companies it was 20.1 percent; and for travel and tourism companies it was 20.4 percent.
In the past fi ve years, companies from rapidly developing economies have come to dominate the consumer-company Value Creators rankings. Of the 157 companies listed in this year’s rankings, nine of the overall consum-er-industry top ten are located in rapidly developing econ-omies. Within the three sectors, that number is seven of the top ten in consumer goods, three of the top ten in retail, and fi ve of the top ten in travel and tourism. What’s more, six of the overall top-ten consumer-company value creators in our global sample are from Asia. And there are very few U.S. companies among the top value cre-ators—none in the overall top ten or in the consumer goods top ten and just two U.S. retailers and one U.S. travel and tourism company in these sectors’ top-ten lists.
In 2008, most sectors saw a major narrowing of the gap between the EBITDA multiples of the top ten in a sector and the average multiple of the sector as a whole. This trend reversed itself in 2009, as the EBITDA multiples of the best performers and those of the rest began to di-verge. In other words, although multiples increased, on average, they increased more for the top value creators—
and, in some sectors, signifi cantly more. This is a sign of the growing divergence in valuation multiples that we expect to be a characteristic of a low-growth economic environment.
Another striking change between 2008 and 2009 is the increase in dividend yields, both on average and for the top ten—in
the overall consumer-industry sample and in each of the three sectors analyzed. Given the sharp rise in stock pric-es in 2009, one would expect dividend yields (which are the ratio of dividend payout to stock price) to decline. The rise in 2009 would seem to indicate that the compa-nies in our sample are devoting a larger portion of their cash fl ow to dividend payouts, a move in line with inves-tor preferences as shown by our recent investor survey.4
2. TSR is a dynamic ratio that includes price gains and dividend payments for a specific stock during a given period. To measure performance from 2005 through 2009, 2004 end-of-year data must be used as a starting point in order to capture the change from 2004 to 2005, which drives 2005 TSR. For this reason, all exhibits in the report showing 2005–2009 performance begin with a 2004 data point.3. This value-drivers model has been described in previous Value Creators reports. See, for example, Missing Link: Focusing Corporate Strategy on Value Creation, The 2008 Value Creators Report, Septem-ber 2008, p. 20.4. See “Investors’ Priorities in the Postdownturn Economy,” BCG article, July 2010.
Companies from
rapidly developing
economies dominate
the rankings.

T B C G
The 2010 Consumer-Company Value Creators RankingsThe Consumer Industry
The Consumer Industry Top Ten, 2005–2009
Sources: Thomson Reuters Datastream; Thomson Reuters Worldscope; Bloomberg; annual reports; BCG analysis.Note: n = 157 global companies in the consumer goods, retail, and travel and tourism sectors.1Contribution of each factor shown in percentage points of five-year average annual TSR; any apparent discrepancies in TSR totals are due to rounding.2Average annual TSR, 2005–2009.3As of December 31, 2009.4Change in EBITDA multiple.5As of June 30, 2010.
’04 ’05 ’06 ’07 ’08 ’09’04 ’05 ’06 ’07 ’08 ’09’04 ’05 ’06 ’07 ’08 ’09
’04 ’05 ’06 ’07 ’08 ’09 ’04 ’05 ’06 ’07 ’08 ’09Salesgrowth
Marginchange
Multiplechange
Dividendyield
0
1
0
5
10
15
20
0
600
400
200
443
248
382
248
156
112 133 151107
138
168
126
201
135
233
137
141120
115107
20
15
5
10
15.1
17.6 18.219.2
18.119.1
12.1 12.3 12.5 12.8 12.3 11.8
2
3
4
5
2.9
2.72.3
4.3
2.3
3.0
1.9
2.2
1.1
1.6
3.1
3.0
10.511.4
14.7
17.5
10.2
14.5
9.98.0
11.011.210.510.23 2
–1
0
8
–5
20
10
15
0
5
19
58
0
100
200
300
ƒ
Total consumer-industry sample, n = 157Consumer industry top ten
Total shareholder return
Simplified five-year TSR decomposition2
Sales growth
EBITDA multiple1 Dividend yield3
EBITDA margin1
TSR index (2004 = 100) Sales index (2004 = 100) EBITDA/revenue (%)
TSR contribution (%) Enterprise value/EBITDA (x) Dividend/stock price (%)
Value Creation at the Consumer Industry Top Ten Versus Industry Sample, 2005–2009
Sources: Thomson Reuters Datastream; Thomson Reuters Worldscope; Bloomberg; annual reports; BCG analysis.1Industry calculation based on aggregate of entire sample.2Share change and net debt change not shown.3Industry calculation based on sample average.
TSR Decomposition1
# Company Location SectorTSR2 (%)
Market value3
($billions)
Sales growth
(%)
Margin change
(%)
Multiple change4
(%)
Dividend yield(%)
Share change
(%)
Net debt
change (%)
2010TSR5
(%)
1 Suning Appliance China Retail 81.4 14.2 52 15 16 0 –2 1 –17.5 2 Tingyi Hong Kong Consumer goods 67.3 13.8 33 14 13 5 0 2 1.7 3 Kweichow Moutai China Consumer goods 63.4 23.5 30 5 29 2 0 –3 –25.0 4 Wuliangye Yibin China Consumer goods 46.3 17.6 14 13 18 1 0 0 –23.0 5 Shenzhen Overseas China Travel and tourism 39.2 7.8 66 –6 –15 1 –9 1 –35.4 6 Turkish Airlines Turkey Travel and tourism 30.8 3.4 22 0 4 2 0 3 –21.4 7 Brasil Foods Brazil Consumer goods 29.2 11.4 25 –4 28 2 –23 2 4.7 8 AmBev Brazil Consumer goods 28.5 61.9 15 8 0 5 –2 3 4.2 9 Wal-Mart de México Mexico Retail 26.8 38.3 13 3 9 2 1 –1 –1.9 10 Dairy Farm Singapore Retail 26.1 8.1 12 3 5 7 0 –1 18.3

F S S
Average annual TSR (%)n = 157
RankMedian
average annualTSR (%)
Firstquartile
Secondquartile
Thirdquartile
Fourthquartile
20.1
9.7
4.7
–5.4
160
120
140
100
80
60
40
20
1
–40 –20 0 20 40 60 80 100–30 –10 10 30 50 70 90
Tingyi
Kweichow Moutai
SuningAppliance
Turkish Airlines Wuliangye Yibin
ShenzhenOverseas
Brasil Foods
AmBev
Dairy Farm
Wal-Martde México
Average Annual TSR of the Consumer Industry Top Ten by Quartile, 2005–2009
Sources: Thomson Reuters Datastream; BCG analysis.Note: TSR derived from calendar-year data; values shown for top ten companies only.
T B C G
The Consumer Goods Top Ten, 2005–2009
Sources: Thomson Reuters Datastream; Thomson Reuters Worldscope; Bloomberg; annual reports; BCG analysis.Note: n = 59 global companies with a market valuation greater than $10 billion.1Contribution of each factor shown in percentage points of five-year average annual TSR; any apparent discrepancies in TSR totals are due to rounding.2Average annual TSR, 2005–2009.3As of December 31, 2009.4Change in EBITDA multiple.5As of June 30, 2010.
’04 ’05 ’06 ’07 ’08 ’09’04 ’05 ’06 ’07 ’08 ’09’04 ’05 ’06 ’07 ’08 ’09
’04 ’05 ’06 ’07 ’08 ’09 ’04 ’05 ’06 ’07 ’08 ’09Salesgrowth
Marginchange
Multiplechange
Dividendyield
1
00
5
10
15
0
400
300
200
100
320
210
272
190143
119144
173121
158
135
117
161
127
179
126
118106
109105
40
20
30
10
0
25.928.6 30.4 30.9 29.6 30.3
16.5 16.6 16.9 17.6 16.9 17.0
2
3
5
43.9
3.02.7
4.2
2.6
3.9
2.2
2.6
1.7
2.0
3.6
3.3
9.810.9
12.214.2
10.2
12.6
10.48.7
12.111.610.59.2
3 311
6
0
15
10
5
13
3
7
0
50
100
150
200
ƒ
Total consumer goods sample, n = 59Consumer goods top ten
Total shareholder return
Simplified five-year TSR decomposition2
Sales growth
EBITDA multiple1 Dividend yield3
EBITDA margin1
TSR index (2004 = 100) Sales index (2004 = 100) EBITDA/revenue (%)
TSR contribution (%) Enterprise value/EBITDA (x) Dividend/stock price (%)
Value Creation at the Consumer Goods Top Ten Versus Sector Sample, 2005–2009
Sources: Thomson Reuters Datastream; Thomson Reuters Worldscope; Bloomberg; annual reports; BCG analysis.1Sector calculation based on aggregate of entire consumer goods sample.2Share change and net debt change not shown.3Sector calculation based on consumer goods sample average.
The Consumer Goods Sector
TSR Decomposition1
# Company LocationTSR2 (%)
Market value3
($billions)
Sales growth
(%)
Margin change
(%)
Multiple change4
(%)
Dividend yield(%)
Share change
(%)
Net debt change
(%)
2010TSR5
(%)
1 Tingyi Hong Kong 67.3 13.8 33 14 13 5 0 2 1.7 2 Kweichow Moutai China 63.4 23.5 30 5 29 2 0 –3 –25.0 3 Wuliangye Yibin China 46.3 17.6 14 13 18 1 0 0 –23.0 4 Brasil Foods Brazil 29.2 11.4 25 –4 28 2 –23 2 4.7 5 AmBev Brazil 28.5 61.9 15 8 0 5 –2 3 4.2 6 ITC India 24.9 20.7 19 –2 6 2 0 1 25.9 7 Grupo Modelo Mexico 22.6 18.4 11 –3 10 4 0 0 –12.0
8 British American Tobacco United Kingdom 22.4 65.1 6 6 3 5 1 1 9.4
9 Reckitt Benckiser United Kingdom 19.1 39.2 15 4 –1 3 0 –1 –5.1 10 SABMiller United Kingdom 19.0 44.5 10 1 12 3 –8 1 3.5

F S S
Average annual TSR (%)n = 59
RankMedian
average annualTSR (%)
Firstquartile
Secondquartile
Thirdquartile
Fourthquartile
22.4
11.9
7.2
–1.9
70
50
60
40
30
20
10
1
Tingyi
Kweichow Moutai
Wuliangye YibinBrasil Foods
AmBev
ITC
Grupo ModeloBritish American Tobacco
Reckitt Benckiser
SABMiller
–40 –20 0 20 40 60 80 100–30 –10 10 30 50 70 90
Average Annual TSR of the Consumer Goods Top Ten by Quartile, 2005–2009
Sources: Thomson Reuters Datastream; BCG analysis.Note: TSR derived from calendar-year data; values shown for top ten companies only.
T B C G
The Retail Top Ten, 2005–2009
Sources: Thomson Reuters Datastream; Thomson Reuters Worldscope; Bloomberg; annual reports; BCG analysis.Note: n = 50 global companies with a market valuation greater than $7 billion.1Contribution of each factor shown in percentage points of five-year average annual TSR; any apparent discrepancies in TSR totals are due to rounding.2Average annual TSR, 2005–2009.3As of December 31, 2009.4Change in EBITDA multiple.5As of June 30, 2010.
’04 ’05 ’06 ’07 ’08 ’09’04 ’05 ’06 ’07 ’08 ’09’04 ’05 ’06 ’07 ’08 ’09
’04 ’05 ’06 ’07 ’08 ’09 ’04 ’05 ’06 ’07 ’08 ’09Salesgrowth
Marginchange
Multiplechange
Dividendyield
00
5
10
20
15
0
300
200
100
250
177205
161122
103 117 12097
123
152
133
172
142
191
148131
114
120109
15
10
5
12.9 13.2 13.5 13.6 13.9 13.8
8.2 8.2 8.6 8.7 8.58.0
2
1
4
3 2.4
1.6 1.8
3.6
1.7
2.0
1.5
2.2
1.4
1.82.8
2.812.7
10.8 10.6
15.0
10.713.4
9.17.5
9.6
14.212.8
11.83 2
–5
0
8
0
–5
15
10
5
15
1 1
0
50
100
150
200
ƒ
Total retail sample, n = 50Retail top ten
Total shareholder return
Simplified five-year TSR decomposition2
Sales growth
EBITDA multiple1 Dividend yield3
EBITDA margin1
TSR index (2004 = 100) Sales index (2004 = 100) EBITDA/revenue (%)
TSR contribution (%) Enterprise value/EBITDA (x) Dividend/stock price (%)
Value Creation at the Retail Top Ten Versus Sector Sample, 2005–2009
Sources: Thomson Reuters Datastream; Thomson Reuters Worldscope; Bloomberg; annual reports; BCG analysis.1Sector calculation based on aggregate of entire retail sample.2Share change and net debt change not shown.3Sector calculation based on retail sample average.
The Retail Sector
TSR Decomposition1
# Company LocationTSR2 (%)
Market value3
($billions)
Sales growth
(%)
Margin change
(%)
Multiple change4
(%)
Dividend yield(%)
Share change
(%)
Net debt change
(%)
2010TSR5
(%)
1 Suning Appliance China 81.4 14.2 52 15 16 0 –2 1 –17.5 2 Wal-Mart de México Mexico 26.8 38.3 13 3 9 2 1 –1 –1.9 3 Dairy Farm Singapore 26.1 8.1 12 3 5 7 0 –1 18.3 4 Amazon.com United States 24.9 59.7 28 –4 0 0 –2 2 –18.8 5 Fast Retailing Japan 19.3 18.7 15 –1 6 2 0 –2 –22.0 6 McDonald's United States 17.3 67.2 4 7 –1 3 3 1 7.3 7 Inditex Spain 17.3 39.3 17 2 –5 2 0 1 9.6 8 Woolworths Australia 16.9 31.4 12 7 –2 4 –3 0 –1.7 9 H&M Sweden 15.3 46.7 13 2 –3 4 0 0 12.2
10 Companhia Brasileira de Distribuição Brazil 14.6 9.5 13 –6 6 1 –2 2 –2.4
F S S
Average annual TSR (%)n = 50
RankMedian
average annualTSR (%)
Firstquartile
Secondquartile
Thirdquartile
Fourthquartile
17.3
8.8
2.6
–3.3
25
30
35
40
45
50
20
15
10
5
1Suning Appliance
Dairy FarmAmazon.com
Fast RetailingMcDonald’s
InditexWoolworths
H&M
Wal-Mart de México
Companhia Brasileira de Distribuição
–40 –20 0 20 40 60 80 100–30 –10 10 30 50 70 90
Average Annual TSR of the Retail Top Ten by Quartile, 2005–2009
Sources: Thomson Reuters Datastream; BCG analysis.Note: TSR derived from calendar-year data; values shown for top ten companies only.

T B C G
The Travel and Tourism Top Ten, 2005–2009
Sources: Thomson Reuters Datastream; Thomson Reuters Worldscope; Bloomberg; annual reports; BCG analysis.Note: n = 48 global companies with a market valuation greater than $2 billion.1Contribution of each factor shown in percentage points of five-year average annual TSR; any apparent discrepancies in TSR totals are due to rounding.2Average annual TSR, 2005–2009.3As of December 31, 2009.4Change in EBITDA multiple.5As of June 30, 2010.
’04 ’05 ’06 ’07 ’08 ’09’04 ’05 ’06 ’07 ’08 ’09’04 ’05 ’06 ’07 ’08 ’09
’04 ’05 ’06 ’07 ’08 ’09 ’04 ’05 ’06 ’07 ’08 ’09Salesgrowth
Marginchange
Multiplechange
Dividendyield
00
5
10
15
0
300
100
200
253
147
253
178
135
111142 155
7496
146
124
178
134
177
126
131115
116104
20
15
10
5
16.9 16.5 16.317.8
16.515.6
13.515.1 14.9
15.9
13.711.8
2
1
4
3
3.4
2.31.6
2.2
2.4
2.5
2.1
2.1
1.3
1.7
2.6
2.3
10.7
7.7
9.2
10.4
6.8
10.8
10.3
6.5
10.0
10.79.9
7.92 2
–1–2
5
0
–5
15
10
5
13
–1
7
0
50
150
100
200
ƒ
Total travel and tourism sample, n = 48Travel and tourism top ten
Total shareholder return
Simplified five-year TSR decomposition2
Sales growth
EBITDA multiple1 Dividend yield3
EBITDA margin1
TSR index (2004 = 100) Sales index (2004 = 100) EBITDA/revenue (%)
TSR contribution (%) Enterprise value/EBITDA (x) Dividend/stock price (%)
Value Creation at the Travel and Tourism Top Ten Versus Sector Sample, 2005–2009
Sources: Thomson Reuters Datastream; Thomson Reuters Worldscope; Bloomberg; annual reports; BCG analysis.1Sector calculation based on aggregate of entire travel and tourism sample.2Share change and net debt change not shown.3Sector calculation based on travel and tourism sample average.
The Travel and Tourism Sector
TSR Decomposition1
# Company LocationTSR2 (%)
Market value3
($billions)
Sales growth
(%)
Margin change
(%)
Multiple change4
(%)
Dividend yield(%)
Share change
(%)
Net debt change
(%)
2010TSR5
(%)
1 Shenzhen Overseas China 39.2 7.8 66 –6 –15 1 –9 1 –35.4 2 Turkish Airlines Turkey 30.8 3.4 22 0 4 2 0 3 –21.4 3 LAN Airlines Chile 25.5 6.0 11 12 4 5 –1 –5 19.3 4 Korean Air Lines South Korea 24.6 3.3 5 –8 16 1 0 11 49.4 5 Bally Technologies United States 24.5 2.2 14 5 1 0 –1 6 –21.6 6 Bwin Interactive Entertainment Austria 24.2 2.2 41 24 –33 0 –8 1 –11.6 7 SMRT Singapore 22.6 2.1 6 0 7 6 0 4 16.2 8 Shanghai Oriental Pearl China 20.1 5.3 12 –6 12 1 –1 2 –28.1 9 easyJet United Kingdom 13.5 2.4 18 –15 31 0 –1 –19 12.7 10 Singapore Airlines Singapore 13.1 12.7 10 –3 –2 4 –1 4 –2.3

F S S
Average annual TSR (%)n = 48
RankMedian
average annualTSR (%)
Firstquartile
Secondquartile
Thirdquartile
Fourthquartile
23.4
7.6
–2.0
–10.3
25
30
35
40
45
50
20
15
10
5
1
Shenzhen Overseas
LAN Airlines
Bally Technologies
SMRTShanghai Oriental PearleasyJet
Bwin Interactive Entertainment
Korean Air Lines
Turkish Airlines
Singapore Airlines
–40 –20 0 20 40 60 80 100–30 –10 10 30 50 70 90
Average Annual TSR of the Travel and Tourism Top Ten by Quartile, 2005–2009
Sources: Thomson Reuters Datastream; BCG analysis.Note: TSR derived from calendar-year data; values shown for top ten companies only.

T B C G
A lthough 2009 saw a strong recovery in eq-uity values, global capital markets are still laboring under the shadow of the world-wide fi nancial crisis that began in 2008. Market volatility remains high; as of this
writing, most equity indexes are fl at for 2010. And de-spite real signs of economic recovery, macroeconomic fundamentals in the developed economies remain un-der signifi cant pressure—most recently from the sover-eign-debt crisis in European countries such as Greece, Portugal, and Spain.
We don’t know precisely how the recovery will play itself out. But we do feel confi dent about one prediction: the developed world is entering an extended period of be-low-average growth—with profound implications for how consumer companies create value. That’s why we have devoted this year’s Value Creators report for consumer companies to the theme of value creation in a lower-growth economy.
Why Lower Growth Is Likely
At fi rst glance, this focus may seem misguided. A er all, economic growth in 2010 has been better than most ob-servers had anticipated. This past summer, the Interna-tional Monetary Fund (IMF) announced it was raising its global growth forecast for 2010 to 4.6 percent—up from the 4.2 percent projection it had issued in April.5
And yet, the same IMF forecast estimates that growth will slow in the second half of 2010 and will be lower (4.3 per-cent) in 2011. What’s more, it points out that in the world’s developed economies, growth rates in 2011 will average only 2.4 percent—with the growth rate in some,
such as Japan, as low as 1.8 percent. And although emerg-ing markets in Asia and other parts of the developing world will grow much faster (8.5 percent, on average, in 2011), the growth rates in these economies will also slow down compared with their growth rates this year.
There are at least four reasons for believing that the world’s developed economies are likely to experience a period of below-average growth.
The Nature of the “Great Recession.” The downturn that began in late 2008 was a globally synchronized reces-sion brought on by a worldwide fi nancial crisis. History shows that recessions preceded by systemic fi nancial up-heaval tend to be far deeper and longer lasting than other recessions, and the subsequent recovery is slower. In 2009, for instance, the IMF released a study analyzing the medium-term implications of 88 historical fi nancial crises in developed, emerging, and developing countries.6 It found that in the seven years a er such a crisis, econo-mies tend to have a signifi cant output gap (that is, a devi-ation of actual output from what one would expect by extrapolating from the precrisis growth trend) of, on aver-age, a negative 10 percent.
Earlier this year, BCG used empirical data from the IMF study to simulate GDP growth rates from 2010 through 2015.7 Our model suggests that while major developing countries such as Brazil, China, and India will soon return
The Coming Eraof Lower Growth
5. See “I.M.F. Says Growth to Continue, but at Slower Pace,” New York Times, July 8, 2010.6. See IMF, World Economic Outlook: Sustaining the Recovery, October 2009.7. See Collateral Damage, Part 8: Preparing for a Two-Speed World; Ac-celerating Out of the Great Recession, BCG White Paper, January 2010.

F S S
to a level of GDP growth that approaches their precrisis growth rates, the more developed economies may see sig-nifi cantly lower growth for a number of years. Specifi cal-ly, the simulation shows GDP growth rates of less than 2 percent per year for the United States, Europe, and Japan, leading to an overall output gap ranging from a negative 8.7 percent (France) to a negative 16.7 percent (United Kingdom). (See Exhibit 1.)
The Indebtedness of U.S. Consumers. In the two decades preceding the downturn, median infl ation-adjusted U.S. hourly wag-es remained relatively fl at. And yet, the American consumer (whose spending ac-counts for 70 percent of U.S. GDP) contin-ued to spend with the sort of abandon that only unconstrained credit can provide. That spending was a critical engine of global economic growth.
Now, however, U.S. consumers are worried about jobs, re-duced asset values from the bursting of the property and stock bubbles, and the consequent threat to their retire-ment accounts. Their spending is unlikely to fuel a new wave of global growth. And although economies of the
developing world are growing at a signifi cantly faster pace than those in the developed world, they remain, in aggregate, too small and too focused on exports to pick up the slack.
Reduced Availability of Credit. Although the situation has improved somewhat since the dark days of late 2008,
the damaged global banking system is still leery about granting credit. Given that in recent years it has taken about fi ve dollars of credit to sustain each dollar of GDP growth, less credit is also a serious con-straint on growth.
The End of Government Stimulus. To be sure, the fast reaction and unprecedent-
ed fi nancial stimulus by the Obama administration and other governments has propped up growth rates and con-tributed to the economic recovery in 2010. But as of this writing, all signs indicate that world governments are shi ing from economic stimulus to defi cit reduction.8
t
Developed economies
may see significantly
lower growth for a
number of years.
Estimated decline in GDP growth, 2010–2015 Estimated gap in GDP
0 2 4 6 8
1.9
7.3
9.5
Italy
Euro zone
UnitedStates
Germany
France
0.6
Average annual GDP growth (%)
1.6
Brazil
0 5
Brazil
Output gap (%)
France
–2.5
Italy
2.1
Germany
Euro zone
PrecrisisPostcrisis
China
India
UnitedKingdom
Japan
7.7
6.4
3.1 3.3
1.1 2.6
1.1
1.0 2.6
1.0 1.8
0.7 1.6
0.7 1.6
–4.3
–8.7
–10.4
–11.7
–12.8
–13.9
–15.7
–16.7
India
China
UnitedStates
JapanUnited
Kingdom10 –20 –15 –10 –5
Exhibit 1. Lower Growth Rates Could Lead to Significant Gaps in GDP
Sources: Economist Intelligence Unit; Bloomberg; IMF; OECD; BCG analysis.Note: The output gap is the estimated shortfall in total 2015 GDP owing to the financial crisis, based on regressions derived from an IMF analysis of 88 historical examples. The precrisis growth rate is calculated by a various-length ordinary least squares (OLS) regression spanning at least ten years before the financial crisis. The postcrisis growth rate is the amount of growth necessary to achieve postcrisis GDP, using the Solow growth model. Brazil shows a positive value (output surplus) because its growth rate was above its precrisis trend in 2008 and was relatively unaffected by the downturn.
8. See “Governments Move to Cut Spending, in 1930s Echo,” New York Times, June 29, 2010.
T B C G
Once government stimulus winds down, can private de-mand sustain the recovery?
For all these reasons, both executives and investors are anticipating an economic environment characterized by low growth. In March 2010, BCG surveyed 440 senior ex-ecutives in seven major world economies.9 When asked what “shape” they thought the emerging recovery would take, fully half said that they expected the recovery to be “L-shaped”—that is, relatively slow and diffi -cult. This response is signifi cantly higher than in March 2009, when only 17 percent of respondents to a similar survey were so pessimistic.
In April 2010, we surveyed 110 professional investors and equity analysts in the United States and Europe who cov-er economies around the world and represent some $1 trillion in assets under management.10 Although re-spondents disagreed on precisely when the recovery would be in full gear (in general, those covering Europe and other global markets were more pessimistic than those covering the United States), they agreed that lower GDP growth would have an impact on corporate net in-come. The vast majority were convinced that growth in company net income in the years to come would be below the long-term historical average for developed markets of approximately 5 percent. A plurality (46 per-cent) estimated that annual net-income growth rates in the next few years could be as low as 2 to 4 percent dur-ing the recovery. Another 40 percent were slightly more optimistic, seeing net income growth in the neighbor-hood of 4 to 6 percent. And only 9 percent expected earn-ings growth to be 6 percent or higher.
Challenges and Opportunities for Consumer Companies
Whatever the precise level of future growth, a low-growth economy poses major challenges when it comes to value creation. Lower GDP growth will put pressure on corpo-rate revenues and profi ts. For many companies, maintain-ing historical levels of revenue growth will only come by winning market share. Competitive intensity will increase, and real winners (and losers) will emerge. How to deliver profi table growth that beats the average without under-mining other drivers of TSR—in particular, margins?
A er a 20-year period in which valuation multiples have been above the long-term historical average, lower growth is also likely to mean lower multiples as investors factor lower growth expectations into a company’s stock price. (See Exhibit 2.) What’s more, a er nearly all companies have, fi rst, suff ered from the late-2008 market selloff and, then, benefi ted from the 2009 rebound in equity values,
valuation multiples will become more dif-ferentiated as investors reward those com-panies that combine above-average growth with clear competitive advantage, strong margins, and appropriate capital deploy-ment. How to ensure that a company ben-efi ts from the increasing diff erentiation in valuation multiples and avoids becoming its victim?
An irony of the current economic environment is that op-portunities for growth are becoming constrained precise-ly at the moment when, due to widespread cost cutting and cash accumulation in response to the recession, cor-porations have built up an unprecedented amount of cash on their balance sheets. For example, the U.S. Fed-eral Reserve reported in early June that U.S. companies, excluding fi nancial services companies, held $1.84 trillion in cash, the highest level as a percentage of assets since the 1960s.11 To be sure, the size of any company’s cash hoard has to be evaluated in terms of its level of debt and its potential need to use that cash to pay down that debt in the future.12 Still, the question remains, how should companies best deploy this cash and their high levels of ongoing free cash fl ow to create value in the future?
Finally, as a result of the turmoil over the past several years, governments are becoming more involved in the private sector, and many observers are questioning the legitimacy of shareholder value as an appropriate model for corporate governance. How to balance the interests and priorities of diff erent stakeholders (investors includ-ed) in an environment in which the “economic pie” is likely to grow at a lower rate than in the recent past?
9. See Collateral Damage, Part 9: In the Eye of the Storm; Ignore Short-Term Indicators, Focus on the Long Haul, BCG White Paper, May 2010.10. See “Investors’ Priorities in the Postdownturn Economy,” BCG article, July 2010.11. See “US Companies Tap Cash Piles for Share Buy-Backs,” Finan-cial Times, June 17, 2010.12. See “Show Us the Money,” Economist, July 1, 2010.
A low-growth
economy poses major
challenges for value
creation.

F S S
But if an extended period of low growth presents chal-lenges for public companies, it also presents a singular opportunity. The stagfl ation of the 1970s, Japan’s “lost de-cade,” and even the Great Depression all off er examples of companies that prospered in tough economic times.13 The big winners didn’t succeed by playing it safe—that is, paying down debt, driving down costs to preserve the bottom line, conserving cash, and simply waiting for con-ditions to get better. Rather, they took advantage of their competitors’ paralysis to create new sources of competi-tive advantage that endured for a long time.
What’s more, the belief that the downturn is ushering in a period of below-average growth is creating a fundamen-tal shi in investor expectations.14 For the fi rst time in a long time, investors are focusing on longer-term funda-mentals. Instead of riding marketwide trends, they are as-sessing the quality and sustainability of individual com-pany stocks. They care more about a company’s business strategy and management track record and less about quarterly earnings growth rates. In short, they are giving companies permission to focus on long-term competitive-ness and sustainable value creation—more so than in a long time.
No one knows how long this shi will last. But investors have reset their focus and strategies to achieve superior TSR. Managements need to do the same. The fi rst step is understanding the distinctive dynamics of value creation in a low-growth environment.
0
10
20
30
40
1980 2010
June 2010 P/E = 19.9Median P/E2 = 17.5
1970 20001990
P/E1
50
Exhibit 2. Valuation Multiples Remain Above the Historical Average
Sources: Robert Shiller, Yale University; BCG analysis.1Cyclically adjusted price-to-earnings (P/E) ratios are based on a ten-year moving average of price index and earnings for S&P 500 composite. 2From January 1970 through June 2010.
13. See David Rhodes and Daniel Stelter, Accelerating Out of the Great Recession: How to Win in a Slow-Growth Economy, McGraw-Hill, 2010.14. See Collateral Damage: Function Focus; Valuation Advantage—How Investors Want Companies to Respond to the Downturn, BCG White Paper, April 2009; and “Investors’ Priorities in the Postdownturn Economy,” BCG article, July 2010.

T B C G
What characterizes value creation for consumer companies in low-growth environments? Two broad trends and a paradox. Their implications for an individual company will, of
course, depend on its particular situation. But under-standing the underlying dynamics of value creation in a low-growth economy is a necessary fi rst step. Once that has been done, there are a number of ways companies can navigate the paradox.
The Declining Importance of Capital Gains
As regular readers of the Value Creators reports know, BCG has a model for quantifying the relative contribu-tion of the various sources of TSR. (See Exhibit 3.) The model uses the combination of revenue (that is, sales) growth and change in margins as an indicator of a com-pany’s improvement in fundamental value. It then uses the change in the company’s valuation multiple to deter-mine the impact of investor expectations on TSR.15 To-gether, these two factors determine the change in a com-pany’s market capitalization. Finally, the model also tracks the distribution of free cash fl ow to investors and debt holders in the form of dividends, share repurchases, or payments on debt in order to determine the contribu-tion of free-cash-fl ow payouts to a company’s TSR. Using this model, executives can analyze the sources of TSR for their company, its business units, a peer group of compa-nies, an industry, or an entire market index over a given period.
How is low GDP growth likely to aff ect these drivers of TSR? In general, lower economic growth will mean lower
revenue growth for many companies. In addition, lower revenue growth will mean lower profi ts—a result of reduced operational leverage and pressure on margins owing to increased competition. What’s more, as a com-pany’s growth in net income declines, the overall level of its valuation multiple will likely drop as well, as inves-tors factor that decline into the company’s stock price. To be sure, earnings are currently rebounding from their depth-of-recession lows, and corporate profi tability is at an all-time high—but that won’t stop valuation multiples from declining as a refl ection of the low-growth future outlook.
All these changes will cut signifi cantly into a company’s ability to deliver capital gains, making this source of TSR relatively less important in the future than in the past. At fi rst glance, this might seem to imply that overall TSR will be lower as well. This logic is true as far as it goes; however, it neglects the inherently dynamic nature of TSR.
The Growing Importance of Cash Payout
Investors set stock prices in order to earn a required rate of return on their capital. The required rate of return for equities is a function of expected returns on risk-free bonds, plus a premium for the risk in equities. The main factor driving equity risk premiums is volatility in earn-
Value Creation in Lower-Growth Environments
15. There are many ways to measure a company’s valuation multi-ple, and different metrics are appropriate for different industries and different company situations. In the Value Creators rankings, we use the EBITDA multiple—the ratio of enterprise value (the market value of equity plus the market value of debt) to EBITDA—in order to have a single measure with which to compare perfor-mance across our global sample.

F S S
ings growth and stock prices. Given how uncertain the current environment is, one would expect that investors’ required rate of return would be, if anything, higher (to account for the increased risk). Investors are unlikely to accept a lower rate of return just because revenue growth is likely to be lower (and potentially riskier) in the future. Instead, they will set lower prices for equities so that stocks continue to deliver the required rate of return de-spite lower revenue growth.
As investors reset their expectations about future growth, reducing the absolute level of valuation multiples, the long-term result is to increase the value of a company’s free-cash-fl ow yield. Free-cash-fl ow yield is the return in-vestors get from cash payouts that companies make to in-vestors. These payouts come in the form of dividends, stock repurchases, and debt paydown. The percentage contribution of free-cash-fl ow yield to TSR is calculated by the amount of cash paid to investors divided by the company’s market capitalization. A company’s market capitalization is a product of its earnings and the valua-tion multiple assigned to those earnings. If valuation mul-tiples decline, then the yield goes up on the same amount of cash paid out.
The signifi cant amount of cash that companies have ac-cumulated on their balance sheets and the currently high levels of free cash fl ow that resulted from cost cutting during the downturn have given many companies the op-portunity to improve their free-cash-fl ow contribution (the numerator in free-cash-flow yield) dramatically. There are signs that at least some companies are realiz-ing that cash payout is becoming a more important source of TSR. A er cutting back on dividends and share buy-backs during the depths of the downturn, more and more companies are starting to return some of that cash to shareholders.
There are also indications that investors have begun to put a higher value on cash returned to shareholders, re-sulting in a positive impact on a company’s valuation multiple from higher cash payouts. When we asked par-ticipants in our investor survey to set their priorities for the use of excess cash, increases in a company’s dividend shot up to number three on the list, chosen by 32 percent of respondents as either their fi rst or second priority. (See Exhibit 4.) Last year, by contrast, it was the lowest prior-ity on the list, chosen by only 10 percent. This shi in in-vestor sentiment helps explain why, as of late June, the
TSR 9.9%
Dividend yieldShare changeNet debt change
Revenue growthMargin changeProfit growth
3.2%
3.4%2.3%
–2.3%3.4%
3.8%–0.5%
3.3%
Fundamental value
Valuation multiple
Multiple change
Gain in marketcapitalization
6.5%
Free-cash-flowcontribution
3.4%
Free-cash-flow contribution
1
3
2
Exhibit 3. BCG’s Model Allows a Company to Identify the Sources of Its TSR
Sources: Thomson Financial Datastream; Thomson Financial Worldscope; Bloomberg; BCG analysis.Note: This calculation is based on an actual company example; the contribution of each factor is shown in percentage points of average annual TSR.

T B C G
Dow Jones Select U.S. Dividend Index was up 1.9 percent for 2010—in contrast to the S&P 500, which was down 2.5 percent.16
For some consumer companies, a value creation strategy that emphasizes cash payout and strong free-cash-fl ow yield may be a sensible approach in a low-growth envi-ronment. This is especially true for companies in mature sectors with high returns on invested capital that are gen-erating far more cash than they can invest in profi table growth—in other words, in many consumer sectors in the developed world.
But there are two important caveats to this scenario. First, it is unclear how long the current high levels of free cash fl ow will last. As governments around the world cope with high defi cits and anemic tax revenues, cash-rich corporations will become a tempting new revenue source—whether through new corporate taxes such as the recent U.K. tax on bonuses in the fi nancial sector or through the kind of political pressure that forced BP to contribute to a $20 billion cleanup fund to defray the economic losses due to the Deepwater Horizon oil spill.17
Second, although a value creation strategy emphasizing free-cash-fl ow yield can occasionally generate superior TSR, it is extremely diffi cult to sustain that performance over time. As a company’s yield rises, investors will even-tually bid up its valuation multiple—which, of course, has the parallel eff ect of causing the yield to decline. Only in special situations, when a company’s valuation multiple remains low, can it sustainably deliver superior TSR from a value creation strategy based on free-cash-fl ow yield.18 In order to be a top TSR performer, most companies will, sooner or later, need to fi nd a way to grow. To understand why requires grasping a phenomenon that we call the growth paradox.
11
19
22
32
43
73
0 20 40
n = 110
60 80
Organic-growth investments
Strategic M&A
Dividend increases
Stock repurchaseprogram
Debt retirement
+9
Accumulation of cashon the balance sheet
+20
–1
+22
–22
–11
Options for the use of excess cash
Percentage of respondents who chose option as a high priority
Variation from 2009(percentage points)
Exhibit 4. Investors Are Putting a Higher Value on Dividend Increases
Source: BCG 2010 Investor Survey.Note: Respondents were asked, “How would you rank the following options based on your preference for the use of excess cash?” For each option, the exhibit shows the percentage of respondents who ranked it first or second.
16. See “Dividends Are Rising. Will Stocks Follow?” New York Times, June 25, 2010.17. Indeed, there are some signs that investors are already expect-ing growing government pressure on dividends. For example, the 2012 futures on the Euro Stoxx 50 Index of major companies pre-dicts that dividends will amount to €90 per share (about $110), down from €158 at the market’s peak in 2007—and well below the 2012 consensus analyst forecast of about €130. See “The Short View,” Financial Times, June 29, 2010.18. See the section “The Cash Machine” in Searching for Sustainabil-ity: Value Creation in an Era of Diminished Expectations, The 2009 Value Creators Report, October 2009, pp. 13–15.

F S S
The Growth Paradox
Exhibit 5, which is based on data from the S&P 500, illus-trates the paradoxical role of growth in value creation. On the one hand, revenue growth is by far the main driver of superior value creation. And yet, not all companies that deliver above-average growth necessarily create above-average TSR. The right-hand chart in Exhibit 5 shows that a great many companies grow without creating value be-cause their growth comes at the expense of other drivers of TSR—for example, declining margins or a lower valu-ation multiple.
A macroeconomic environment characterized by low growth exacerbates this growth paradox. Precisely because it is the scarce resource in a low-growth econo-my, a company’s ability to generate even modestly above-average sales growth will be a key diff erentiator between TSR winners and losers. For example, during the last prolonged bear market—from 1966 through 1982—nearly all of the top 20 companies that most strongly outperformed their industry peers in TSR did so through growth in sales rather than growth in margins or dividends.19
Therefore, it is critical that companies do not become so reconciled to the lack of growth opportunities that they focus exclusively on cost cutting and cash payouts at the neglect of making the necessary investments to secure future revenue-growth opportunities. The companies that are tempted to milk the business in order to prop up their earnings per share (EPS) may end up underinvesting in the future—in eff ect, making low growth a self-fulfi lling prophecy.20
At the same time, however, a company has to be careful to avoid the opposite problem: growth without value. Be-cause companies are so fl ush with cash as a result of the cost cutting and cash accumulation of recent years, they may be tempted to overcommit to growth. But as more
0
10
20
30
40
10 years
17
74%
15% 5%
6%
5 years
21
58%
20%15%7%
3 years
22
50%
20%
19%11%
1 year
34
29%
13%
46%
12%
Revenue growthMarginMultipleFree cash flow Average annual revenue growth (%)
Growth withoutvalue creation
0
20
40
0 20 40
Sources of TSR for top-quartile performers(S&P 500, 1990–2009)
Correlation of revenue growth and TSR(S&P 500, 1990–2009)
Change in annual TSR (%) Average annual TSR (%)
–20–20
Growth withvalue creation
For top performers, growth is the single mostimportant source of TSR over the long term. . .
. . .but not all companies with above-averagegrowth necessarily create value
Exhibit 5. The Growth Paradox
Source: BCG analysis.Note: Each bar shows the average annual TSR for a given time period; the shaded sections of each bar show the percent of total TSR from each source.
19. See Megatrends: Tailwinds for Growth in a Low-Growth Environ-ment, BCG Focus, May 2010.20. For example, when we asked the participants in our senior-exec-utive survey in which areas they would be making significant ef-forts in 2010, only 41 percent said that they were planning to in-crease R&D, only 35 percent were planning to hire new talent, and fewer than 40 percent were thinking of extending their geographic reach, expanding capacity, or exploring acquisitions. See Collateral Damage, Part 9: In the Eye of the Storm; Ignore Short-Term Indicators, Focus on the Long Haul, BCG White Paper, May 2010.

T B C G
and more companies compete for fewer growth opportu-nities, the odds that improvements in revenue growth will come at the expense of other drivers of TSR go up. As a result, a company may win on growth but not win on TSR.
Five Growth Strategies for a Lower-Growth Economy
Through our work with clients around the world, we have identifi ed fi ve ways compa-nies can successfully navigate the growth paradox—that is, fi ve growth strategies that have served companies well during periods of low growth.
Invest in innovation. During periods of low growth, in-novation becomes more important, not less. In the Great Depression, for example, DuPont, IBM, Chrysler, and GE all outspent their rivals and developed products ahead of their competitors. And many companies—P&G most dra-matically—acquired unassailable brand leadership by systematic investment in their brands.21 Through a com-mitment to innovation when other companies were cut-ting back, these companies established a dominant posi-tion in their industries that would last for decades.
Exploit megatrends. Megatrends are major trends with the power to shape the landscape of economic opportu-nity and risk for decades to come. They can take decades to gather strength and then suddenly burst forth to re-arrange the competitive environment. But because of the long buildup before takeoff , companies o en underesti-mate the power of megatrends or assume that they have already accounted for them in their plans.
BCG has been tracking the development and interaction of 78 megatrends since 2005. Nearly 80 percent contin-ued to grow during the downturn—with 23 actually strengthening in importance.22 Of the trends that kept growing, we estimate that 44 percent represent opportu-nities with a global market size greater than $500 billion. Take, for example, the demographic trend of the aging of the population. The so-called silver market (goods and services for consumers over 60) is now worth more than $700 billion worldwide and is fast become a valuable source of growth for companies in sectors as diverse as cosmetics and fi nancial services.
The growth of consumer spending in major emerging markets is also a rapidly developing megatrend. By 2015, emerging-market cities will account for around 30 per-cent—or $2.6 trillion—of the total global consumption of clothing and household items. And these cities are al-ready some of the fastest-growing markets for luxury goods in the world.23 Spotting the megatrends that will
sweep through a company’s markets over the next decade is a critical step in reignit-ing growth.
Pursue breakout growth. Some indus-tries grow faster than others. But in every industry, there are always a few compa-nies that achieve breakout growth at rates that are anywhere from two to seven times
the average for the industry as a whole and that create correspondingly above-average shareholder value. These companies do so by actively managing their corporate portfolio, focusing on developing and expanding their core business, and exercising discipline to sustain or ex-pand margins while pursuing top-line growth.
Engage in business model innovation. A company’s business model—the value proposition that it off ers cus-tomers and the operating model it creates to deliver that value at a profi t—is key to creating shareholder value in any economic environment. In times of instability, when the potential for competitive disruption is high, business model innovation is especially important. Business mod-el innovation can provide companies with a way to break out of intense competition, establish competitive barriers around new markets, or create new growth opportunities where none existed before.24
Practice pricing fl uency. In a low-growth environment in which margins are likely to be under pressure, a com-pany’s pricing policies and implementation will be a crit-
21. See David Rhodes and Daniel Stelter, Accelerating Out of the Great Recession: How to Win in a Slow-Growth Economy, McGraw-Hill, 2010.22. See Megatrends: Tailwinds for Growth in a Low-Growth Environ-ment, BCG Focus, May 2010.23. See Winning in Emerging-Market Cities: A Guide to the World’s Larg-est Growth Opportunity, BCG report, September 2010; and Big Prizes in Small Places: China’s Rapidly Multiplying Pockets of Growth, BCG report, November 2010.24. See Business Model Innovation: When the Game Gets Tough, Change the Game, BCG White Paper, December 2009.
In every industry, there
are a few companies
that achieve
breakout growth.

F S S
ical lever to manage. The winners will be those compa-nies that resist the temptation to off er concessions on prices in order to maintain share. Companies that can de-fend their prices with disciplined processes will have a competitive advantage. But it requires building a capabil-ity that reaches deep into a company’s sales and market-ing organization. A comprehensive “pricing fl uency” pro-gram focuses on improving a company’s pricing model with better policies for setting prices and on enhancing the pricing platform for organizational implementation. In our experience, the result is sustainable revenues that are 1 to 3 percent greater than those of competitors.25
The challenge for companies today: to shi from an ap-proach to value creation that is focused on delivering quarterly earnings growth to one that emphasizes man-aging TSR over the long term. How companies can begin charting a course to deliver superior TSR over the long term is the subject of the next section of this report.
25. See Crisis Pricing for the Downturn and After, BCG White Paper, September 2009; and “Pricing Fluency: A Program for Pricing Ex-cellence,” BCG Opportunities for Action, December 2009.

T B C G
T he shi to a low-growth economy requires a parallel shi in how companies set their value-creation strategy. Put simply, they need to stop managing to momentum tar-gets for short-term revenue and earnings
growth and start managing for superior TSR over the long term. Doing so requires rethinking their approach to growth and their criteria for capital deployment. It also requires innovations in the strategic-planning process.
Value-Creating Growth
Achieving profi table growth is going to be harder in a low-growth economy. There will be more competition—especially from global challengers from the fast-growing emerging economies. It is no coincidence, for instance, that six of the companies in our list of the overall con-sumer-industry top ten for the fi ve-year period from 2005 through 2009 are from Asia—since this economy has ex-perienced tremendous growth. As everyone competes for relatively fewer growth opportunities, margins will be un-der threat to a degree not seen in recent years. Still, the growth of emerging markets, which global challengers benefi t from, also represents opportunities for others. But competition will be tough, and success will depend on a company’s starting position and the investments it makes.
Coping with these challenges will require discipline. Com-panies will need to take a tough look at existing business plans so as to weed out those growth investments that do not create value and to focus on those that do. It will also require creativity. Companies will have to be far more sys-tematic in fi nding new ways and new places to grow.
Given the likelihood of increased competition, the place to begin the pursuit of value-creating growth is with any investments necessary to build a competitive moat around the core business. Competitors will be coming af-ter that business, so it is critical to preserve and protect existing sources of competitive advantage.
As a company develops its growth strategy, it also must be especially alert to the impact of growth on margins. In today’s environment, achieving profi table growth will be harder, and margins will be under threat. Therefore, it is necessary to manage the growth-margin tradeoff very carefully. To be sure, there may be situations in which it is necessary to accept lower margins in order to remain competitive. But, by all means, companies should avoid simply chasing share based on a weak competitive posi-tion because such a move is likely to wreak havoc on margins.
Once weaknesses in a company’s core business have been addressed, a company can begin thinking about new ways and new markets in which to grow. When a compa-ny has few opportunities for organic growth, growing through acquisitions can be an eff ective way to create val-ue.26 But investments in M&A tend to be riskier than equivalent investments in organic growth, so a company needs to assess its opportunities carefully and be realistic about its capabilities, both for doing deals and for the subsequent postmerger integration (PMI).27
A Fresh Look at ValueCreation Strategy
26. See Growing Through Acquisitions: The Successful Value Creation Record of Acquisitive Growth Strategies, BCG report, May 2004; and Searching for Sustainability: Value Creation in an Era of Diminished Ex-pectations, The 2009 Value Creators Report, October 2009, p. 12.27. See Accelerating Out of the Great Recession: Seize the Opportunities in M&A, BCG report, June 2010; and Real-World PMI: Learning from Company Experiences, BCG Focus, June 2009.

F S S
When it comes to M&A, the main shi companies need to make is to think less about whether a particular deal is “EPS accretive” in the short term and more about whether it is actually going to create shareholder value in the long term. A deal may appear to be “cheap” and de-liver one-time EPS gains without necessarily improving a company’s TSR. By the same token, deals that dilute EPS in the near term can improve TSR over the long term. Indeed, in a low-growth econo-my, some of the most value-creating acqui-sitions—those of companies with a higher growth rate than that of the acquirer—will initially dilute EPS because the target will likely be trading at a higher valuation mul-tiple than the acquirer. But over time, such an acquisition should lead to higher growth for the acquirer and a higher overall multiple.
Last but not least, no company should be thinking about where to grow without at the same time thinking about where not to—either because it lacks advantage, is not producing returns above the cost of capital, or faces an industry environment that makes a cash payout strategy preferable. It is the rare company, for example, that knows precisely where it is creating value—by business unit, by product line, or by customer segment. Yet that kind of detailed assessment is all the more necessary in today’s environment.
Balanced Capital Deployment
Unless the economy witnesses severe erosion in margins, many companies are going to have a lot more cash fl ow than they can eff ectively reinvest in profi table growth. The worst outcome would be to waste that cash by pur-suing value-destroying growth or to fail to exploit the value-creating potential of that cash by simply leaving it on the balance sheet. Rather, executives need to ask how best to deploy that cash in order to create shareholder value.
Getting to the right answer will require challenging some legacy assumptions. The fi rst is the lingering belief that dividends are to be avoided because they signal to inves-tors that a company has few growth prospects. As we have argued in these pages, investors’ views of dividends have changed. Increasingly, they see a strong dividend not as a sign that a company can’t grow but, rather, as an
indication that management is disciplined about using its capital to fund only value-creating growth.28
A related assumption worth challenging is the manage-ment preference for share repurchases over dividends as the best means to return cash to shareholders. This mis-taken belief is yet another artifact of too narrow a focus
on EPS rather than on TSR. Many execu-tives prefer share buybacks because, un-like dividends, buybacks boost EPS above the level that underlying organic growth in net income would on its own. They also think that boosting EPS growth is a conve-nient way to boost an “undervalued” stock price. And, of course, their incentives are o en tied directly to EPS growth, and the
value of their stock options depends on appreciation in stock price, not on increases in dividend yield.
But there is growing evidence that investors prefer divi-dend increases to recurring share repurchases because they are a far more robust signal of a company’s fi nancial health and stability. BCG’s research demonstrates that dividends have a far more positive impact on a compa-ny’s valuation multiple than share repurchases do. In-deed, in many cases, buybacks can actually reduce a com-pany’s multiple in the near term.29 And, as discussed earlier, the respondents to our investor survey rated divi-dend increases as a higher priority for excess cash than share repurchases—in part because, by a large majority (76 percent), they believe that most companies do a poor job of timing their share repurchases.
Finally, a third assumption about capital deployment that companies will have to rethink concerns the desir-ability of leverage. Leverage exacerbates the volatility of a company’s value-creation performance. But in a low-growth economy, investors will be looking for quality and sustainability. Some companies may want to retire debt in order to become a “safer,” less risky stock. Other companies may want to preserve current levels of lever-age because interest rates are so low and because it may be diffi cult to take on new debt in the future. But what-
28. See “Thinking Differently About Dividends,” BCG Perspectives, April 2003.29. See the section “The Share Buyback Trap” in Avoiding the Cash Trap: The Challenge of Value Creation When Profits Are High, The 2007 Value Creators Report, pp. 20–23.
No company should
think about where to
grow without thinking
about where not to.

T B C G
ever a company’s situation, it would be prudent to plan future value-creation strategy on the assumption that the company will need to fund that strategy out of its on-going operating free cash fl ow. One big advantage this kind of “living-within-our-means” discipline has for plan-ning purposes is that it will force sharpened consider-ation of a company’s potential tradeoff s around capital deployment.
Scenario-Based Strategic Planning
By now, it should be clear that the ap-proach to value creation strategy we are describing is not something that can take place within the normal strategic-planning process. As strategic planning exists at most companies today, busi-ness units develop their momentum plans, which are then aggregated into an overall corporate strategy. Re-thinking value creation strategy requires a top-down over-lay to that process, led actively by the CEO and involving the board.
One approach that helps sharpen the tradeoff s a compa-ny faces is to create alternative future scenarios that em-phasize signifi cantly diff erent uses of capital. For exam-ple, assign three diff erent teams to develop the “best-case scenario” for three diff erent value-creation strategies—one emphasizing investments in organic growth (such as expansion into emerging markets), one emphasizing ac-quisitive growth (such as the acquisition of a close com-petitor or a key emerging-market challenger), and one emphasizing cash payouts (such as substantially higher dividend payouts). What would be the diff erential impact of each of these scenarios on TSR? What would be the as-sociated risks given the company’s starting position, orga-nizational capabilities, and investor base?
The point of this exercise is not necessarily for any one scenario to win out over the others. It is likely that the fi -nal strategy will include elements drawn from each sce-nario, perhaps with diff erent moves playing a more cen-tral role at diff erent moments in time. But developing multiple scenarios has the advantage of surfacing unan-ticipated opportunities, sharpening the choices and tradeoff s that a company has to make, and forcing a tough, realistic assessment of what the company can ac-tually achieve.
As a company develops and evaluates these diff erent sce-narios, it should keep in mind the fi nancial fundamentals, as well as the likely impact of various moves on its inves-tor base and, therefore, on its valuation multiple.
One way to do so is to develop a fi ne-grained understand-ing of the factors that actually determine diff erences
in valuation multiples in a company’s peer group. BCG’s research shows that it is possible to identify and actively man-age the factors that determine approxi-mately 80 percent of the diff erences in valuation multiples across a company’s peer set.30
Another way to gauge investor reactions to a company’s plans is by conducting a detailed investor segmentation to determine who the company’s dominant investors are, as well as who future investors might be, and to identify their key priorities for the company.31 BCG regularly conducts interviews with the fund managers of leading asset managers on behalf of our clients. In our ex-perience, only by talking directly to investors, asking prob-ing questions, and carefully listening to and interpreting their responses can a company’s management gain a clear view of the expectations and priorities of the company’s investor base.32
A Success Story
Adapting to lower growth a er decades of relatively high growth is a bit like having to use muscles that one has not exercised in a long time. It can be painful—but in the end, it produces a healthier organism. By focusing on value-creating growth, optimizing the tradeoff s among various uses of capital, and taking a scenario-based ap-proach to strategic planning, companies will be in good shape to address the challenges of value creation in a lower-growth economy.
30. See the section “Understand What Drives Relative Valuation Multiples” in Balancing Act: Implementing an Integrated Strategy for Value Creation, The 2005 Value Creators Report, November 2005, pp. 15–18.31. See the section “The Investors Who Matter—and What Matters to Them” in Missing Link: Focusing Corporate Strategy on Value Cre-ation, The 2008 Value Creators Report, pp. 26–27.32. See “Treating Investors Like Customers,” BCG Perspectives, June 2002.
Creating alternative
future scenarios
sharpens the tradeoffs
a company faces.

F S S
Consider the experience of a leading retailer that had been growing successfully for the past 20 years by adding new stores across its home market. Its rapid expansion had delivered above-average growth and considerable shareholder value from gains in market share. But as the global economy began to slow, opportunities to open new stores disappeared and the retailer’s current stores be-came less profi table. Consequently, investors began to pe-nalize the retailer as profi table growth slowed down. The retailer realized it needed a more nuanced growth strat-egy for the low-growth era.
In working with the retailer, our fi rst step was to evaluate the company’s fundamental economics. It had a success-ful format with stores delivering strong cash returns, and a modest improvement in same-store sales could drive signifi cant incremental cash fl ow. Therefore, the next step was to determine how best to deploy that cash for maxi-mum shareholder returns—balancing investments back into the business with cash payouts to investors.
We talked to the retailer’s biggest investors, as well as to investors in other retail companies who had chosen not to invest in our client. These investors told us that although they would like to see our client direct a sub-stantial portion of its cash toward growth, they doubted that there were many high-return investments to be made—either by diversifying into new formats or by expanding into new regions. However, they saw the potential for very attractive fi nancial returns if our client invested modestly in the business and returned most of its cash to investors. What’s more, they thought such a move would be even more attractive if the cash returns came predominantly through dividends rather than stock buybacks, since the returns would be “guaran-teed,” and our client would be signaling its confi dence in the future.
Given this information from investors and the company’s economic fact base, we worked with the retailer to iden-tify which of a broad range of strategic scenarios would deliver the best mix of strengthened competitive advan-tage, attractive shareholder returns, and appropriate risk exposure. The scenarios considered included the follow-ing seven:
The status quo plan, which called for modest invest-◊ ment in the business combined with high returns to investors (predominantly through stock buybacks)
The status-quo plan with “optimized” fi nancial poli-◊ cies, which focused cash payouts more on dividends than on stock buybacks
Aggressive investment in growing the domestic fl eet of ◊ stores, combined with lower cash returns to investors
Aggressive investment in existing stores (to drive ◊ same-store sales), combined with lower cash returns to investors
Acquisition of a close competitor in order to consoli-◊ date the company’s sector domestically
Diversifi cation into a new format, either organically or ◊ through M&A
Diversifi cation into new regions◊
We concluded that the status quo plan would deliver av-erage shareholder returns. The second scenario (the sta-tus quo plan with optimized fi nancial policies) would in-crease shareholder returns—through a higher free-cash-fl ow yield and a stronger valuation multiple, as investors developed more confi dence in the company’s outlook from the signals its fi nancial policies sent. This would put the retailer on a par with the top-third compa-nies in terms of returns to shareholders. Most of the other investment options did not deliver materially higher re-turns and took on substantially higher risk. But higher re-investment into the existing portfolio of stores could place the company in the top quartile of companies in terms of shareholder returns, with only modest additional risk.
The retailer’s management team and board considered the pros and cons of all of the options and decided on the following cash deployment strategy: increased reinvest-ment in the existing portfolio of stores, very modest ex-pansion into additional stores, higher dividends to share-holders, and stock buybacks to redistribute any remaining cash to investors. Since implementing this plan, the com-pany has delivered a very attractive return to sharehold-ers. It has outperformed the overall market, as well as its peer group, and it has strengthened its leadership in the marketplace.
This process of assessing strategic options is replicable for any consumer company and is a key enabler for deliver-ing superior value creation in a lower-growth economy.

T B C G
In conclusion, we off er ten questions about value creation in a lower-growth economy that every con-sumer-company CEO should know how to answer. The questions synthesize the basic arguments and recommendations made in this year’s report.
Do you know where and how your businesses are creat- 1. ing value? By business unit, by product category, by customer segment?
Do you have a process in place for discovering new 2. ways to deliver value-creating growth? Are you look-ing at longer-term, longer-payout investment op-tions, or merely at immediate-payback invest-ments? Are you aware of the megatrends that apply to your business and how you might capture the opportunity?
Are you emphasizing shareholder value performance 3. over relatively long time horizons (three to fi ve years), rather than quarterly or annual EPS?
Are you evaluating future acquisitions by their long- 4. term value-creation potential, not by whether the deals would happen to accrete or dilute EPS in the short term?
Do you know what drives diff erences in valuation mul- 5. tiples in your peer group?
Do you know the segmentation of investors who own 6. your stock? Which types of investors dominate? Are they the right ones given your value-creation strat-egy? Are you engaged in an active dialogue with your core investors in order to understand their ob-jectives and priorities?
Are your fi nancial policies—such as debt-to-capital ra- 7. tio and dividend payout—likely to appeal to your tar-get investors in a low-growth environment?
Are your management processes—for example, plan- 8. ning, budgeting, and capital allocation—aligned with the goal of increasing shareholder value over the long term?
Are you rethinking your executive-compensation sys- 9. tem for an environment in which capital gains will be a less important contributor to TSR? Does your sys-tem require that senior executives have substantial “skin in the game” in the form of long-term direct equity exposure (not stock options)?
Have you thoroughly explored diff erent scenarios for 10. creating value in the future? Do you know the diff er-ent benefits and risks of emphasizing organic growth, M&A, or cash payout?
Ten Questions Every CEOShould Know How to Answer

F S S
For Further Reading
The Boston Consulting Group pub-lishes many reports and articles on corporate development and value creation that may be of interest to senior executives. Examples include:
Big Prizes in Small Places: China’s Rapidly Multiplying Pockets of GrowthA report by The Boston Consulting Group, November 2010
Winning in Emerging-Market Cities: A Guide to the World’s Largest Growth OpportunityA report by The Boston Consulting Group, September 2010
Investors’ Priorities in the Postdownturn EconomyAn article by The Boston Consulting Group, July 2010
Accelerating Out of the Great Recession: Seize the Opportunities in M&AA report by The Boston Consulting Group, June 2010
Cross-Border PMI: Understanding and Overcoming the ChallengesA Focus by The Boston Consulting Group, May 2010
Megatrends: Tailwinds for Growth in a Low-Growth Environment A Focus by The Boston Consulting Group, May 2010
Rebound but Not Yet RecoveryAn article by The Boston Consulting Group, March 2010
A er the StormThe 2010 Creating Value in Banking Report, February 2010
Time to Engage—or Fade Away: What All Owners Should Learn from the Shakeout in Private Equity BCG White Paper, published with the IESE Business School of the University of Navarra, February 2010
M&A: Ready for Li off ? A Survey of European Companies’ Merger and Acquisition Plans for 2010BCG White Paper, published with UBS Investment Bank, December 2009
Lessons from Consistent Value Creators in the Consumer IndustryThe 2009 Value Creators Report for Consumer Companies, November 2009
Searching for Sustainability: Value Creation in an Era of Diminished ExpectationsThe 2009 Value Creators Report, October 2009
Be Daring When Others Are Fearful: Seizing M&A Opportunities While They LastA report by The Boston Consulting Group, September 2009
Fixing What’s Wrong with Executive CompensationBCG White Paper, June 2009
Real-World PMI: Learning from Company ExperiencesA Focus by The Boston Consulting Group, June 2009
The Clock Is Ticking: Preparing to Seize M&A Opportunities While They LastBCG White Paper, May 2009
Thriving Under Adversity: Strategies for Growth in the Crisis and BeyondBCG White Paper, May 2009
Collateral Damage: Function Focus; Valuation Advantage—How Investors Want Companies to Respond to the DownturnBCG White Paper, April 2009
T B C G
Note to the Reader
AcknowledgmentsThis report is a product of BCG’s Consumer practice and its Corporate Development practice. The authors would like to acknowledge the con-tributions of the following global ex-perts in corporate development: Andrew Clark, a senior partner and managing director in the fi rm’s Auck-land offi ce and leader of the Corpo-rate Development practice in Asia-Pacifi c; Danny Friedman, a senior partner and managing director in BCG’s Los Angeles offi ce and leader of the Corporate Development prac-tice in the Americas; Jérôme Hervé, a senior partner and managing direc-tor in the fi rm’s Paris offi ce and lead-er of the Corporate Development practice in Europe; Lars-Uwe Luther, a partner and managing director in BCG’s Berlin offi ce and global head of marketing for the Corporate Development practice; and Brett Schiedermayer, the managing direc-tor of the BCG ValueScience Center in South San Francisco, California, a research center that develops lead-ing-edge valuation tools and tech-niques for M&A and corporate-strat-egy applications.
The authors would also like to thank Robert Howard and Sally Seymour for their contributions to the writing of the report; Hady Farag, a project leader in BCG’s Frankfurt offi ce, for his contributions in managing the fi rm’s Munich-based Value Creators research team; Kerstin Hobelsberger, Martin Link, and Dirk Schilder of the Value Creators research team for their contributions to the research; and Katherine Andrews, Gary Calla-han, Angela DiBattista, Elyse Fried-man, Kim Friedman, Pamela Gilfond, Sean Hourihan, Sara Strassenreiter, Simon Targett, and Janice Willett for their contributions to the editing, de-sign, and production of the report.
For Further ContactFor further information about the re-port or to learn more about BCG’s capabilities in corporate develop-ment and value management, you may contact the authors.
Marcus BokkerinkSenior Partner and Managing DirectorBCG London+44 207 753 [email protected]
Patrick DucasseSenior Partner and Managing DirectorBCG Paris+33 1 40 17 10 [email protected]
Jeff GellPartner and Managing DirectorBCG Chicago+1 312 993 3300gell.jeff @bcg.com
Eric OlsenSenior Partner and Managing DirectorBCG Chicago+1 312 993 [email protected]
Frank PlaschkePartner and Managing Director BCG Munich+49 89 23 17 [email protected]
Daniel StelterSenior Partner and Managing DirectorBCG Berlin+49 30 28 87 [email protected]

For a complete list of BCG publications and information about how to obtain copies, please visit our website at www.bcg.com/publications.
To receive future publications in electronic form about this topic or others, please visit our subscription website at www.bcg.com/subscribe.
10/10

Abu DhabiAmsterdamAthensAtlantaAucklandBangkokBarcelonaBeijingBerlinBostonBrusselsBudapestBuenos AiresCanberraCasablanca
ChicagoCologneCopenhagenDallasDetroitDubaiDüsseldorfFrankfurtHamburgHelsinkiHong KongHoustonIstanbulJakartaKiev
Kuala LumpurLisbonLondonLos AngelesMadridMelbourneMexico CityMiamiMilanMinneapolisMonterreyMoscowMumbaiMunichNagoya
New DelhiNew JerseyNew YorkOsloParisPhiladelphiaPragueRomeSan FranciscoSantiagoSão PauloSeoulShanghaiSingaporeStockholm
StuttgartSydneyTaipeiTel AvivTokyoTorontoViennaWarsawWashingtonZurich
bcg.com