finnängen swedens first renovated plusenergy house the path to … · finnängen insulation 25 cm...
TRANSCRIPT
Finnängen – Swedens first renovated plusenergy house
The path to energy-neutrality
Andreas Molin
Linköpings Universitet

Agenda
• Energy efficiency measures at Finnängen
• Why?

Finnängen – before renovation

• U-value (W/m2K)
– Wall 0,40
– Roof 0,32
– Ground 0,6/1,6
– Window 3
• Infiltration 800 l/s @ 50Pa (300m2)=2,67 l/s,m2
• Ventilation- Mech. Exhaust air + Firing
• Heating — Hydronic – Bio-mass pellet
• Space heating demand -30 000 kWh/yr
• Domestic hot water demand -5 000 kWh/år
• Electricity -5 000 kWh/år
– Household -4 000 kWh/år
– Building electricity -1 000 kWh/år
Myresjöhus-1976

Finnängen
Insulation 25 cm Air-tightness Windows
Solar Thermal - 11m2
Photovoltaic - 10 kW-68m2
Seasonal heat storage- Ground coil-100 m
Horisontal ground coil – 200 m
Solar tank-800l
HRX Ventilation
Grid Hydro power
Heat pump-6kWth

2010-04-28
Air-tightness is acheived by membrane 0,3 ACH (0,13 l/s,m2) at 50 Pa
Passive house standard:
0,6 ACH (0,3 l/s,m2)

Thermal comfort - windows • Comparison surface-temperature inside @ 10°C out
• Older Newer
• 16°C 20,5°C
Thermal comfort important when doing energy
efficiency measures.
Otherwise rebound-effect

Grey EPS Lambda 31 mW/mK
Long service life & form stability

Smart heat storage • Use super-heating of the heat
pump condenser • No need of electric resistance
heating for hot water • Heating with low primary
temperature gives high SPF • Low primary heating temp. :
– Increased insulation – Better air-tightness – Increased convection area – Ventilation heater
• Potential SPF 5
– Condensation at 30 ° – Hot water becomes 50-60 °C. – No legionella problems
60-90°
25-35°
10-25°
Can be used for increased perfrmance in District heating
systems
Lowers return temperature = higher electricity/heat ratio

Modeling Heat
Validation Prognosis
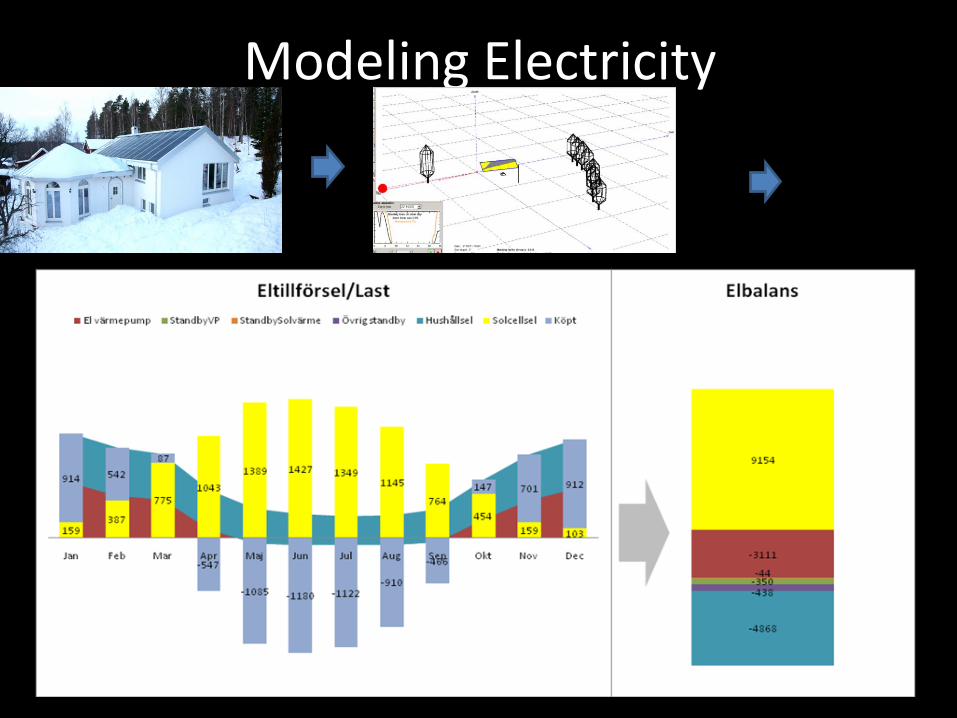
Modeling Electricity

Follow-up: www.ppam.se/blog
Air-tightness will be tested after 1 yr.
-2000
-1000
0
1000
2000
2011-01-01 00:00 2011-02-20 00:00 2011-04-11 00:00 2011-05-31 00:00[kW
h]
Acc. Electricity Consumption 2011
Electricty consumption
Solar prod Buy
Januari 1283 -98 1185 Februari 959 -410 549 Mars 641 -854 -213 April 352 -1096 -744 Maj 323 -1368 -1045 Juni 260 -1288 -1029


Before • U-value (W/m2K)
– Wall 0,40 – Roof 0,32 – Ground 0,6/1,6 – Window 3
• Infiltration 800 l/s @ 50Pa (300m2)=2,67 l/s,m2
• Ventilation-Mech exhaust+Firing • Heating- Bio-mass pellets • Heating -30 000 kWh/år • Hot water -5 000 kWh/år • Electricity -5 000 kWh/år
– Household -4 000 kWh/år – Building -1 000 kWh/år
After • U-value(W/m2K)
– Wall 0,10 – Roof 0,08/0,10 – Ground 0,6/1,6 – Window 0,77
• Infiltration 60 l/s @50 Pa (454m2)=0,13 l/s,m2
• Ventilation- HRX • Heating-Solar Thermal/heatpump • Heating -10 000 kWh/år • Hot water -5 000 kWh/år • El +2 000 kWh/år
– Household -3 000 kWh/år – Building -1 000 kWh/år – Heat pump -3 000 kWh/år – Solar el. +9 000 kWh/år
Annual use 10ton Pellets & - 5000 kWh el
=> +2000 kWh el

2 sept 2010, Solar power commisioned
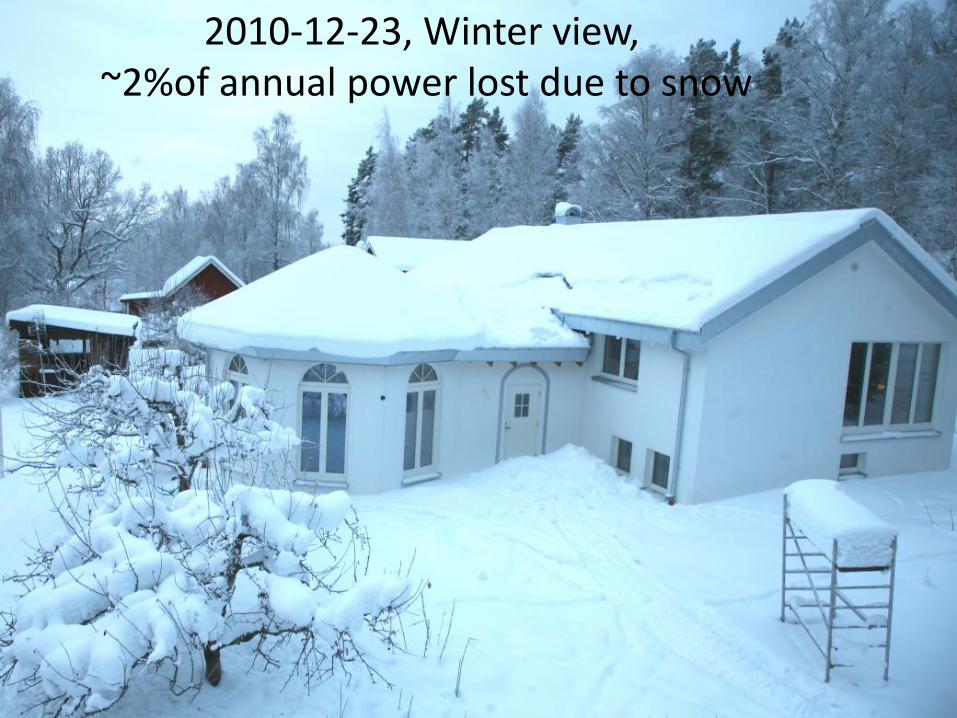
2010-12-23, Winter view, ~2%of annual power lost due to snow

2011-01-07 Heat pump commisioned

Life-Cycle Zero Energy Buildings (LC-ZEB)
• Embodied energy
• Operational energy use + embodied energy = 0
• Operational energy use must be negative.
– Finnängen 7000kons-9000prod=~-2000kWh/yr
• LC-ZEB will be acheived after certain years
– (ex 100 000 kWh/ 2 000 kWh = 50 år)
• Focus will be choice of materials & service life
• Older buildng embodied energy must be handled
• Competition: Which building will first be LC-ZEB?

Agenda
• Energy efficiency measures at Finnängen
• Why?

Why all the Kyoto-pyramid at once?
Air-tightness must be planned
Finding more development making use of the old building
Renovation plan: make efficiciency measures when maintenance is needed &
plan for air-tightness
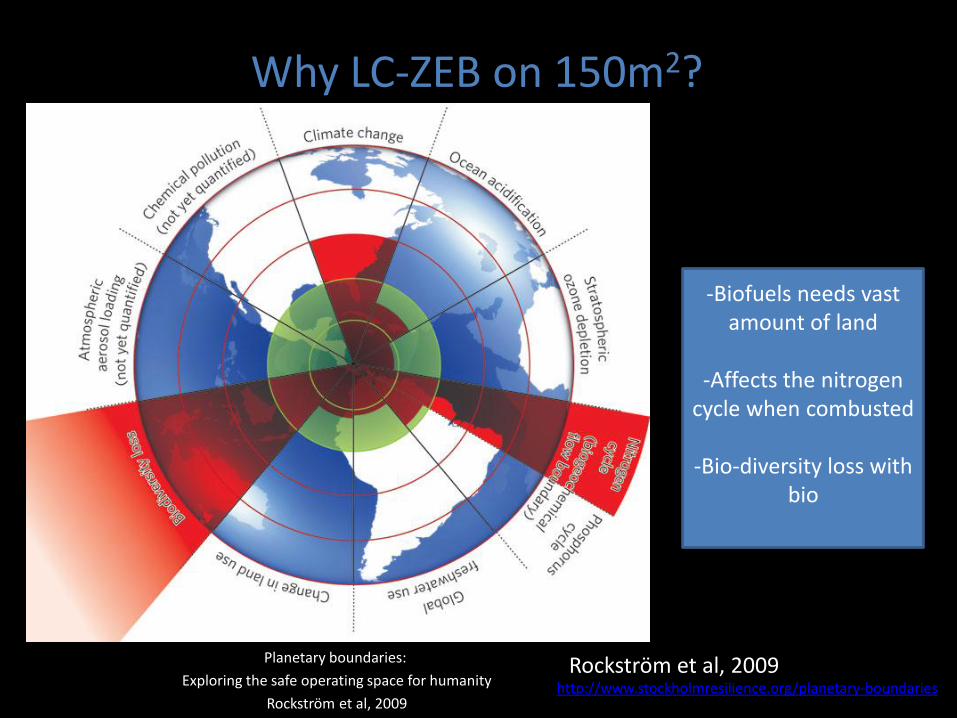
Planetary boundaries:
Exploring the safe operating space for humanity
Rockström et al, 2009
Rockström et al, 2009 http://www.stockholmresilience.org/planetary-boundaries
Why LC-ZEB on 150m2?
-Biofuels needs vast amount of land
-Affects the nitrogen
cycle when combusted
-Bio-diversity loss with bio

Solar power= minimum pollution = no effect on nitrogen cycle
Building solar power= non-exploiting = no effect on bio-diversity
Good potential
Roof & facades in Sweden: 660 km2
PV power: 20-80 TWh,
Depending on system efficiency, demanded rate of return. (Kjellson, 2000)
Why solar power on building =>
decreased biodiversity loss

Problem in Sweden: Sold electricity is less valued due to tax
Elforsk 10:93
50 50
28
5 17
25
3
0
20
40
60
80
100
120
140
Köpt el Såld el
Öre
/kW
h
Elpris
Energiskatt
Elcertifikat
Elnätavgift
Moms
Nätnytta
Todays system optimises economy for
small systems
Annual net-billing => Uses the full roof=> Decreased exploitation for energy=> Decreased bio-diversity loss

However: Higher value of solar power than average power
• A. Molin, P. Rohdin, B. Moshfegh.
• Positive power market value for gridconnected roof-top solar power in Sweden”.
• 11th World Renewable Energy Congress and Exhibition, Abu Dhabi, United Arab Emirates, 25 - 30 September 2010.
Night-time lower price
Daytime higher electricity price
+2% +11%
+23% Similar to Carbon Savings:
An investigation of the impact of time of generation on carbon savings from PV systems in Great Britain. P. A. Burgess1,*, M.M. Vahdati 2, D. Davies 3
TACK Andreas Molin
Skype: andreas.molin Mobile: +46-706-935097
Solar blogs :
www.ppam.se/blog bengts.blogg.viivilla.se


Solar Combined PV/T Kombinerad solcell/solfångare
• Maximal användning av solenergi
• Ökad elproduktion vid kylning med energibrunn eller markvärmelager
• Snöavtäckning med frivärme ifrån energibrunnen
• +100-200 kWhel/kWt,år • Återladdar
energibrunn/markvärme • Laddar
varmvattenberedaren

Integrated photovotaics can minimize costs
• 60% cost is in module and system
• Installation- & material-cost can be minimised with BIPV
Source: Elforsk 10:94

Annual net billing gives more investment VAT Investment-VAT more important, than energy tax/kWh
Årsnettning ger större anläggningar & mer investeringsmoms till staten
Elforsk 10:93

How to acheive 5% of Linköpings

Investeringsstöd => ej produktionsoptimerade anläggningar
Alternativt förslag
• Multipel på elcertifikat
– Sol kWh*10 (icke exploaterande)
– Sol kWh*5 (exploaterande)
• Garanteras i 10 år
• Sänk multipel med 10% varje år
• Återbetalning 8-24 år
• Antaget alternativt elpris= Ränta & inflation
• De bästa anläggningarna betalar av sig inom 10 år och blir ”lönsamma”.
0
0,5
1
1,5
2
2,5
2011 2016 2021
[kr/
kWh
] e
x m
om
s
Solstöd
0
5000
10000
15000
20000
25000
30000
35000
0
5
10
15
20
25
2011 2016 2021
An
tage
n s
yste
mko
stn
ad [
kr/k
W]
Åte
rbe
taln
ings
tid
[år
]
Bästa Pay-off Sämsta Pay-off Antagen systemkostnad