firm market valuation and intellectual property assets market valuation and intellectual property...
TRANSCRIPT

Mafini Dosso, Antonio Vezzani 2017
JRC Working Papers on Corporate
R&D and Innovation No 07/2017
Firm market valuation and intellectual property assets
This publication is a Technical report by the Joint Research Centre (JRC), the European Commission’s science and knowledge service. It aims to provide evidence-based scientific support to the European policy-making process. The scientific output expressed does not imply a policy position of the European Commission. Neither the European Commission nor any person acting on behalf of the Commission is responsible for the use which might be made of this publication. Contact information Antonio Vezzani Address: Edificio Expo. c/ Inca Garcilaso, 3. E-41092 Seville (Spain) E-mail: mailto: [email protected] Tel.: +34 954488463 Fax: +34 954488316 JRC Science Hub https://ec.europa.eu/jrc JRC107736 ISSN 1831-9408 (online) Seville, Spain: European Commission, 2017 © European Union, 2017 Reproduction is authorised provided the source is acknowledged. How to cite: Dosso M., Vezzani A. (2017). Firm market valuation and intellectual property assets. JRC Working Papers on Corporate R&D and Innovation, No 07/2017, Joint Research Centre.
All images © European Union 2017
The JRC Working Papers on Corporate R&D and Innovation are published under the editorial supervision of Antonio Vezzani in collaboration with Andries Brandsma, Fernando Hervás, Koen Jonkers, Pietro Moncada-Paternò-Castello, Alexander Tübke and Daniel Vertesy at the European Commission – Joint Research Centre; Michele Cincera (Solvay Brussels School of Economics and Management, Université Libre de Bruxelles); Alex Coad (Pontificia Universidad Catolica del Peru, Lima); Enrico Santarelli (University of Bologna); Marco Vivarelli (Università Cattolica del Sacro Cuore, Milan).
The JRC Working Papers on Corporate R&D and Innovation addresses economic and policy issues related to industrial research and innovation and to the competitiveness of the European industry. Mainly addressed to policy analysts and the academic community, these are policy relevant early-stage scientific articles highlighting policy implications. These working papers are meant to communicate to a broad audience preliminary research findings, generate discussion and attract critical comments for further improvements. All papers have undergone a peer review process.
JRC Working Paper on Corporate R&D and Innovation – No. 07/2017 Page 2
P
age
2
Pag
e 2
Firm market valuation and intellectual property assets
Mafini Dosso and Antonio Vezzani
European Commission, Joint Research Centre, Seville, Spain
Abstract
This paper investigates the relationship between the innovative activity of the top
corporate R&D investors worldwide and their valuation on the financial markets. The
empirical analysis is based on a sample of more than 1,500 top publicly listed Multinational
Corporations (MNCs) performing a considerable share of the business investment in R&D
worldwide. The main dataset covers their intellectual properties, patents and trademarks, filed
between 2005 and 2012. The paper extends upon the recent literature on the links between IP
assets and the firms’ financial valuation. It assesses the potential premium resulting from the
interactive use of different IPRs. More importantly, it differentiates the extent to which IPRs
confer a market premium to companies with respect to their industrial competitors from the
extent to which within-company variations hold the key to a market premium. Finally
confirming the relevance of corporate mixes of IP assets, important industrial specificities are
found in the premiums granted to both individual and two-ways strategies.
Keywords: patents, trademarks, innovation, market valuation, within-/between-effects
JEL: O31, O34, L19
JRC Working Paper on Corporate R&D and Innovation – No. 07/2017 Page 3
P
age
3
Pag
e 3
1. Introduction
The recognition of knowledge as the fundamental resource for sustainable economic
competitiveness and growth has come with an upsurge in the investments into knowledge-
based assets. Indeed, knowledge-based assets such as databases and innovative properties
(R&D, patents, trademarks and trade secrets) and economic competencies (market research,
worker training) are now considered as equally or even more strategic elements than tangible
assets (machinery, equipment, plants and buildings) for the performances of firms. At the
policy level, the idea of knowledge-driven economies has triggered a wider commitment into
and support for the development of local knowledge bases and pools of knowledge-based
assets (e.g. patents pools). These trends have come with a faster increase of intangible capital
investments as compared to tangible investments in several countries (Corrado et al., 2009;
Dal Borgo et al., 2012).
The market valuation of corporate tangible and intangible assets largely depends on the
actual performance of firms and the investors’ expectations of future achievements. From a
company perspective a higher market valuation can also constitute a relevant enabling factor
for accessing less costly and/or greater funds. In tune with this perspective, a flourishing
literature, which looks at the effects of firms’ intellectual property rights (IPRs) on stock
market valuation, has confirmed their contribution to the valuation of companies on financial
markets (e.g. Hall et al., 2005). However, most research has investigated this relationship
using R&D- and/or patent-based indicators as the main proxies for the intangible assets of
firms, leaving underestimated the effects of other corporate knowledge-based assets such as
trademarks. While the economic rationale for R&D can easily be related to the upgrading in
absorptive capabilities, to exploration purposes and greater opportunities for innovations,
patents are commonly justified by the uncertainty to appropriate the expected returns to such
intangible innovation investments. Indeed, patents confer the owner the exclusive right to use
the related invention for commercial exploitation(s), and to transfer the use right to other
parties (e.g. under licence). This exclusive right is limited in time and space, and is granted
under strict requirements (novelty, non-obviousness and industrial applicability). However,
the recourse to patents features strong sector specificities (Dernis et al., 2015), not all patents
lead to commercially viable products, and firms often combine different means to protect the
fruits of their innovative activity (Cohen et al., 2000; Gallié and Legros, 2012).
Surprisingly few scholars have attempted to assess the market valuation of trademarks
and patents together (e.g. Greenhalgh and Rogers, 2006; Greenhalgh and Rogers, 2012 for a
sample of United Kingdom’s firms). Trademarks are distinctive signs such as words, pictures,
logos, shapes, colours, sounds or any combination of those signs, allowing companies to
differentiate their goods and services from those of their competitors. Given their
informational role for customers, trademarks may also provide incentives for firms to
improve the quality of their offer (Economides, 1988; Cabral, 2000). As such, they can carry
valuable information for investors and therewith influence the valuations of companies on
financial markets. Moreover, they may enable firms to extend the "monopoly" rents of
patented innovations beyond the patent term (Statman and Tyebjee, 1981) by steering
potential customers through the brand and symbols protected with trademarks (Rujas, 1999).
JRC Working Paper on Corporate R&D and Innovation – No. 07/2017 Page 4
P
age
4
Pag
e 4
Following these arguments, our study exploits a sample of the top R&D investors
worldwide to assess the contribution of their patents and trademarks portfolios on their
valuation on financial markets. It first adds to the previous economic literature by accounting
for the effects of the simultaneous and interactive use of different IPRs (patents and
trademarks). As for the use of patents across industries, there is also a significant
heterogeneous recourse to trademarks (Millot, 2012; Dernis et al., 2015).
In line with Ramnath (2002), we argue that investors do not only form their expectations
using information exclusively on the target firm. They also benchmark it against firms in the
same sector, thus considering conjointly the overall sector performance. Such process calls
for the integration of both firm- and industry- specificities in the empirical analysis of the
firms’ market valuation. As a second contribution, our paper accounts for this neglected
feature of investors’ evaluation in empirical accounts, and disentangles the effects of the IPRs
on market valuation accordingly. Finally a finer investigation at the industry level allows
opening a discussion on the industry-specific nature of the links between patents, trademarks,
patents and trademarks on the one hand and the market valuation of R&D investors on the
other hand.
The rest of the paper is organised as follows. Section 2 outlines the theoretical
background. Section 3 presents the data and the methodological framework. Section 4
discusses the results. Section 5 concludes.
2. Theoretical Background
The increasing competition in the markets for technologies reduces the possibility for
firms to realise long term returns from their innovative activities. In the Schumpeterian
framework, the rents deriving from innovation activities are threatened by the process of
creative destruction whereby new entrants challenge the incumbents by introducing
innovations that render obsolete the current dominant products and technologies on the
market. In order to extend the rent extraction from their innovations, firms have developed
complex innovative strategies through the generation of multi-dimensions innovations. These
new corporate strategies have shifted the focus from purely technology-based innovations to
broader and more systemic conceptions of innovations, often relying on the simultaneous
development of technological and non-technological forms of innovations (Frenz and
Lambert, 2009; Evangelista and Vezzani, 2010). Indeed, evidence on these mixed modes of
innovation show that this shift has occurred in both large and smaller firms as well as in
manufacturing and services sectors (OECD 2011). The higher innovation rates and risks of
imitation have led firms to combine technological advancements with new business methods,
organizational and marketing innovations. This dynamics has been originally pointed out by
Hall (1993), who showed the increasing importance of advertising related expenditures for
the companies' stock market valuation pointing to an increasing importance of intangible
assets in determining firms' performance. More recently, Guzman and Stern (2015)
disentangled the relationship between intellectual property assets and firm growth. Taking a
sample of start-ups in the Silicon Valley, they show that firms owning trademark have a
higher probability to grow than non-trademarking ones (about 5 times higher), where the
premium from patents is even higher; start-ups with patenting activities have a probability to
JRC Working Paper on Corporate R&D and Innovation – No. 07/2017 Page 5
P
age
5
Pag
e 5
grow about 25 times higher than non-patenting ones. However, the authors did not explore
the possible effects deriving for the combination of trademarks and patents. Moreover, Zhou
et al. (2016) show that holding both patents and trademarks increases much the odds to
receive higher amounts of venture capital, as compared to situations where firms only resort
to a single intellectual property. Taken together, the two results suggest that the existence of
complementarity between patents and trademarks positively influence their growth
performance also because they are more likely to access relatively higher venture capital
funding.
Indeed, firms increasingly rely on a wider set of intangible assets and IPRs protection
means. These IPR strategies, referred as the IP bundles, allow them to delay the imitation and
to extend the temporary monopoly period (Greenhalgh and Longland, 2005). Thus, they may
confer them overall higher expected returns from innovation. However, as shown by Llerena
and Millot (2013) the complementary/substitutability relationship between IP assets is not
straightforward and may depend on industrial specificities and the type of IPs (Somaya and
Graham 2006). Our study attempts to account for these firms’ behaviours and assesses
whether corporate IPR strategies yield higher rewards on the international financial markets.
In doing so, we attempt to address the need of analysing IP complementarities in large firms
(Zhou et al., 2016), by exploiting a sample of top corporate R&D investors worldwide.
The returns to innovation at the micro level are generally estimated through output
measures related to the profits, sales, productivity (e.g. Geroski et al., 1993; Hall and Bagchi-
Sen, 2002), and the stock market performance (Hall, 2000; Hall et al., 2007). However,
unlike market valuation, there is a longer and uncertain time lag between innovation spending
and the realization of its effects on productivity and on the market via products sales and
profit. This has been referred to as the problem of timing of costs and revenues (Hall 2000).
Nevertheless, as underlined earlier by Griliches (1981) and more recently by Hall et al.
(2007), the firm’s valuation in public financial markets constitutes a relevant indicator of the
expected success of its innovation activities.1
In order to assess the market value of corporate knowledge assets, many scholars have relied
on R&D and patents-based indicators2 as proxy for firms' innovative activities (Toivanen, et
al., 2002; Hall et al., 2005). However patents may have an additional role beyond the
conventional protective and incentive functions. Indeed, patents can also constitute a signal to
investors that reduces the information asymmetries and mitigates their financial constraints,
thus revealing somehow the ability of firms to leverage funds on the markets (Hottenrott et
al., 2016). Prior works addressing the effects of corporate patenting activities on the market
valuation of firms suggest a positive and significant association, although its importance may
differ across jurisdictions (Hall et al., 2007). However partly due to the inherent
characteristics of patents,3 some innovations may not be patented. Moreover as pointed out
by Greenhalgh and Rogers (2012) some innovations, which reflect new varieties and better
1 See Hall (2000) for a detailed earlier review. 2 See Kleinknecht et al. (2002) and Hagedoorn and Cloodt (2003) for detailed discussions on the use of these indicators to assess firms’ innovative performances. 3 See Acs and Audretsch 1989, Griliches 1990, de Rassenfosse et al. 2013 for discussions on the use of patent as an indicator of innovative activities.
JRC Working Paper on Corporate R&D and Innovation – No. 07/2017 Page 6
P
age
6
Pag
e 6
qualities of product, may not pass sufficiently the inventive requirements although they may
be labelled as innovations. In these cases, firms will recourse to alternative statutory means to
protect their innovations (e.g. trademarks or industrial designs). Besides, in order to
commercialize their new technologies through a range of products or process innovations
firms would often need to implement complementary marketing and organizational methods.
In line with these arguments, our paper examines to which extent firms with a wider range of
innovative outputs, assessed through their patent and trademarks portfolios, benefit from a
higher premium on the financial markets.
Following the conceptual approach of Rujas (1999) on the complementarity between
patents and trademarks, we argue that different IPRs may convey different signals to
investors. Indeed while patents may carry out information on the technological competencies
of the firms and serve more for forward looking purposes, trademarks would rather convey
information on the actual commercial and marketing capabilities of the firms. Few studies
have attempted to assess the effect of different intellectual protection means on the stock
market performances of the firms (e.g. Greenhalgh and Rogers, 2006; Greenhalgh and
Rogers, 2012). Their findings on samples of United Kingdom firms’ patents and trademarks
at the UK International Property Office (UK IPO) and the European Patent Office (EPO)
suggest that both patents and trademarks may be significantly associated with the market
value of the firm. However, they do not account for the interactive use of these IPs, thus for
the additional premium resulting from broader IP strategies. Moreover, our paper examines
the strength of the IP-market valuation relationships across different industries.
3. Data and Methodology
The sample is built upon the 2013 EU Industrial and R&D Investment Scoreboard,4
which provides annual data on the top 2000 R&D investors worldwide. They account for
about 80% of the world’s business investment in R&D (European Commission 2013). The
patents and trademarks filed by these companies at the United States Patent and Trademark
Office (USPTO) have been retrieved from the EPO’s PATSTAT and OECD internal
databases in the framework of a JRC-OECD joint project. The matching has been carried out
on a by-country basis using a series of string matching algorithms contained in the Imalinker
system (Idener Multi Algorithm Linker) developed for the OECD by IDENER, Seville, 2013.
The matching exercise employs information on the Scoreboard companies' subsidiary
structure (about 500,000 subsidiaries) as reported in the ORBIS database. Subsidiaries
located in a different country with respect to a company's headquarters have been included
when performing the matching of patents and trademarks to company-level data. Their patent
and trademark applications have been consolidated into the relevant parent company. A more
extensive description of the approach used to perform the matching can be found in Dernis et
al. (2015).
The final dataset includes information on patents and trademarks filed at the USPTO over
the period 2005-2012 for more than 1,500 Multinational Corporations (MNCs). The
4 For more information on the sample of companies included in the EU Industrial and R&D Investment Scoreboard, see http://iri.jrc.ec.europa.eu/scoreboard.html.
JRC Working Paper on Corporate R&D and Innovation – No. 07/2017 Page 7
P
age
7
Pag
e 7
advantage of using USPTO data resides in the importance of the US markets for both the
technologies and end-products. Besides our companies show a relatively higher IP activity in
the US market, with the average number of patents and trademarks that is the largest at
USPTO for more than half of the industries. Data on market value were obtained from the
Bureau van Dijk’s ORBIS database and is calculated by multiplying its share price by the
number of shares outstanding. Additional company level data are taken from the EU
Industrial and R&D Investment Scoreboard’s dataset.
In the empirical application, we model the natural logarithm of market value of a given
company upon a series of company indicators influencing the market perception of its actual
worth and potential future performances.
In our framework, the market value of a given company could be written as:
𝑚𝑐𝑎𝑝𝑖𝑡 = 𝛼 + 𝛽𝑗𝐼𝑃𝑅𝑗𝑖𝑡 + 𝛾𝑋𝑖𝑡 + 𝛿𝑐𝑜𝑛𝑡𝑟𝑜𝑙𝑠 + 𝜇𝑖 + 휀𝑖𝑡 (1)
where IPRj stands for the intellectual property right considered in our study (j = Patents;
Trademarks; their interaction), X stands for a series of explanatory variables, and 𝑐𝑜𝑛𝑡𝑟𝑜𝑙𝑠
includes a set of binary variables for the industry (using the ISIC rev.4 classification), the
market in which a company i is listed, and the time specific factors. Finally, in equation (1),
μi represents the unobserved company-specific factors, and εit the error term; both are
assumed to be normally distributed.
To estimate equation (1) we use a correlated panel random effects approach proposed by
Mundlak (1978), modified by Neuhaus and Kalbfleisch (1998) and recently discussed by
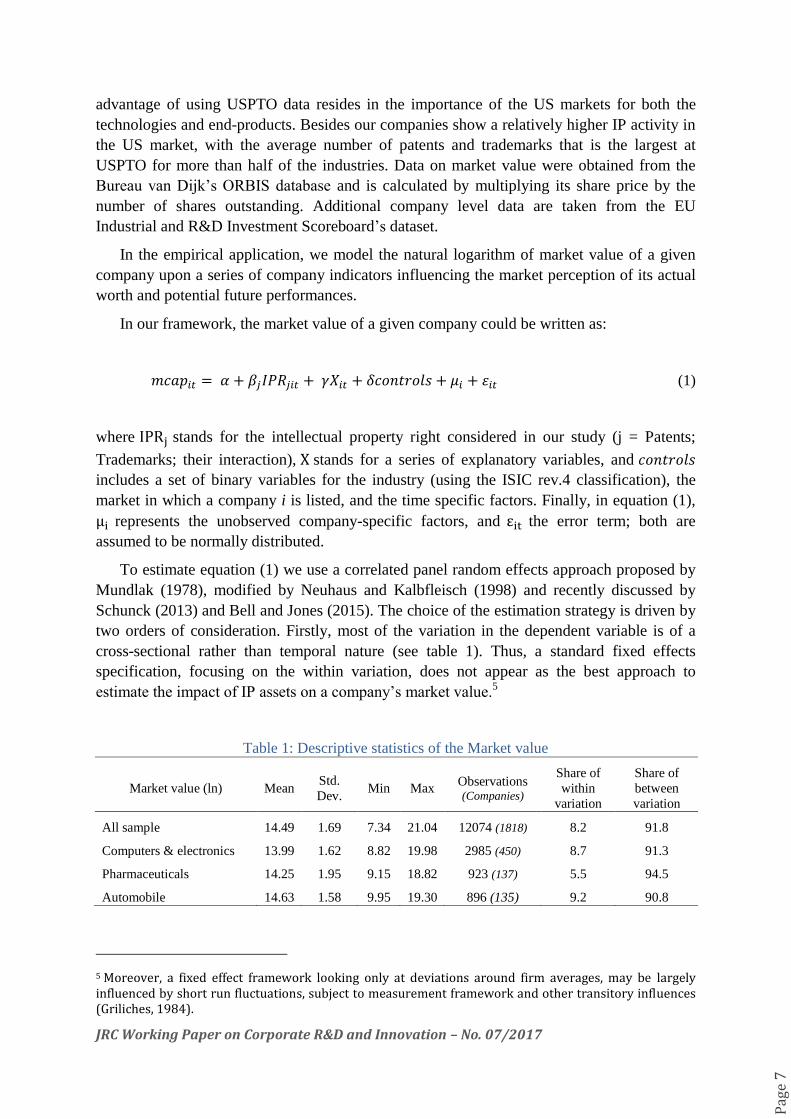
Schunck (2013) and Bell and Jones (2015). The choice of the estimation strategy is driven by
two orders of consideration. Firstly, most of the variation in the dependent variable is of a
cross-sectional rather than temporal nature (see table 1). Thus, a standard fixed effects
specification, focusing on the within variation, does not appear as the best approach to
estimate the impact of IP assets on a company’s market value.5
Table 1: Descriptive statistics of the Market value
Market value (ln) Mean Std.
Dev. Min Max
Observations (Companies)
Share of
within
variation
Share of
between
variation
All sample 14.49 1.69 7.34 21.04 12074 (1818) 8.2 91.8
Computers & electronics 13.99 1.62 8.82 19.98 2985 (450) 8.7 91.3
Pharmaceuticals 14.25 1.95 9.15 18.82 923 (137) 5.5 94.5
Automobile 14.63 1.58 9.95 19.30 896 (135) 9.2 90.8
5 Moreover, a fixed effect framework looking only at deviations around firm averages, may be largely influenced by short run fluctuations, subject to measurement framework and other transitory influences (Griliches, 1984).
JRC Working Paper on Corporate R&D and Innovation – No. 07/2017 Page 8
P
age
8
Pag
e 8
Secondly, the correlated panel random effect approach allows us to consider different context
specific heterogeneity through the inclusion of time-invariant covariates (for instance the
industrial sector in which a company operates or the market in which it is listed) and
estimating the within and between effects into a single specification. In our view this approach reflects, in a more realistic manner, the behaviour of investors who do not only
consider specific company’s performances, but also benchmark them against other
companies’ performances. Indeed, as pointed out by King (1966), stocks are often seen by
investors as falling into groups with 'similar' performance, firms in the same group share
similar costs of capital and correlated results. More recently, Piotroski and Roulstone (2004)
consider three types of investors and argue that market analysts have a lower access to firm
idiosyncratic information than other investors (management or institutional investors with a
high ownership stake) and tend to incorporate market- and industry-level information in their stock price formation. This is supported by evidence on a positive relation between analysts’
accuracy and industry specialisation and on the fact that they tend to adjust their firm specific
earnings forecasts in response to announcements of other firms in the same industry (Ramnath, 2002).
The within (fixed) effect can be incorporated into a random-effects model by
decomposing the variables of interest into a between (𝐼𝑃𝑅̅̅ ̅̅ ̅𝑖 =
1
𝑛𝑖∗ ∑ 𝐼𝑃𝑅𝑖𝑡)
𝑛𝑖𝑡=1 and a within
(𝐼𝑃𝑅𝑖𝑡 − 𝐼𝑃𝑅̅̅ ̅̅ ̅𝑡) component. Thus, following Allison (2009), our hybrid estimation equation can
be written as:
𝑚𝑐𝑎𝑝𝑖𝑡 = 𝛼 + 𝛽𝑤𝑗(𝐼𝑃𝑅𝑗𝑖𝑡−1 − 𝐼𝑃𝑅̅̅ ̅̅�̅�𝑖) + 𝛽𝑏𝑗𝐼𝑃𝑅̅̅ ̅̅
�̅�𝑖 + 𝛾𝑋𝑖𝑡 + 𝛿𝑐𝑜𝑛𝑡𝑟𝑜𝑙𝑠 + 𝜇𝑖 + 휀𝑖𝑡
(2)
In equation (2) the coefficients βw and βb represent the within and the between effects of
a company intellectual property assets, respectively. This formulation, by group mean
centering the intellectual property assets (IPRjit−1 − IPR̅̅ ̅̅ ̅ji), solves the collinearity problems
that may arise from the correlation between IPRji and IPR̅̅ ̅̅ ̅ji as in the Mundlak approach.
Therefore, it leads to more stable and precise estimates.
In addition of our main variables of interest, the natural logarithm (Ln) of patents and
trademarks, we consider the impact of the company’s sales growth and the influence of sector
sales growth on the market value. The former intends to capture the prospects for future
growth of a particular company that is not directly linked to its current innovative activities or
output; the latter reflects the tendency of investors to prefer companies operating in sectors
with higher future growth prospects and the eventual premium for the related companies (see
also Hall 1993). Also, firms with a higher labour productivity are expected to obtain higher
rewards on the financial markets; it would thus act as a signal of efficiency and potential
higher returns. This effect should translate into a positive coefficient on the labour
productivity variable, here defined by the ratio of sales over employees. We consider physical
investment, as measured by the Ln capital expenditures, to control for the differences in the
size of companies. Finally, our estimations account for the possibility that markets may
penalize firms with very high R&D expenditures as compared to physical investment, by
introducing the ratio between R&D and capital investment flows. It should be considered that
once controlling for the innovative output (through the inclusion of patents and trademarks),
JRC Working Paper on Corporate R&D and Innovation – No. 07/2017 Page 9
P
age
9
Pag
e 9
this variable captures the proportion of knowledge inputs not materialized in terms of
innovative output with respect to tangible and more tradable investments. The IPRs enter
with a lag in the model in order to account for the time delay in the identification and
treatment of the information they may convey to the (potential) investors. Similarly all the
right-hand side variables, except for the company’s and sectoral sales growth, are also one-
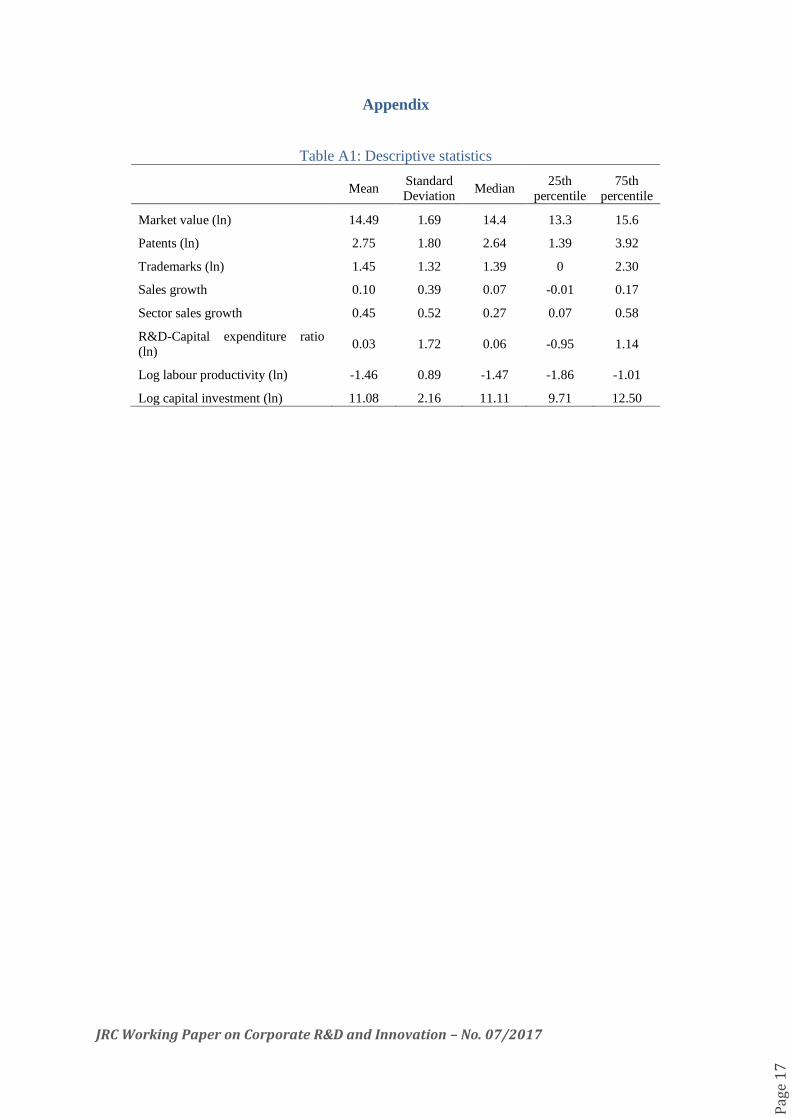
period lagged. Descriptive statistics of the variables on which base our analysis are reported
in table A1, see the Appendix.
4. Results
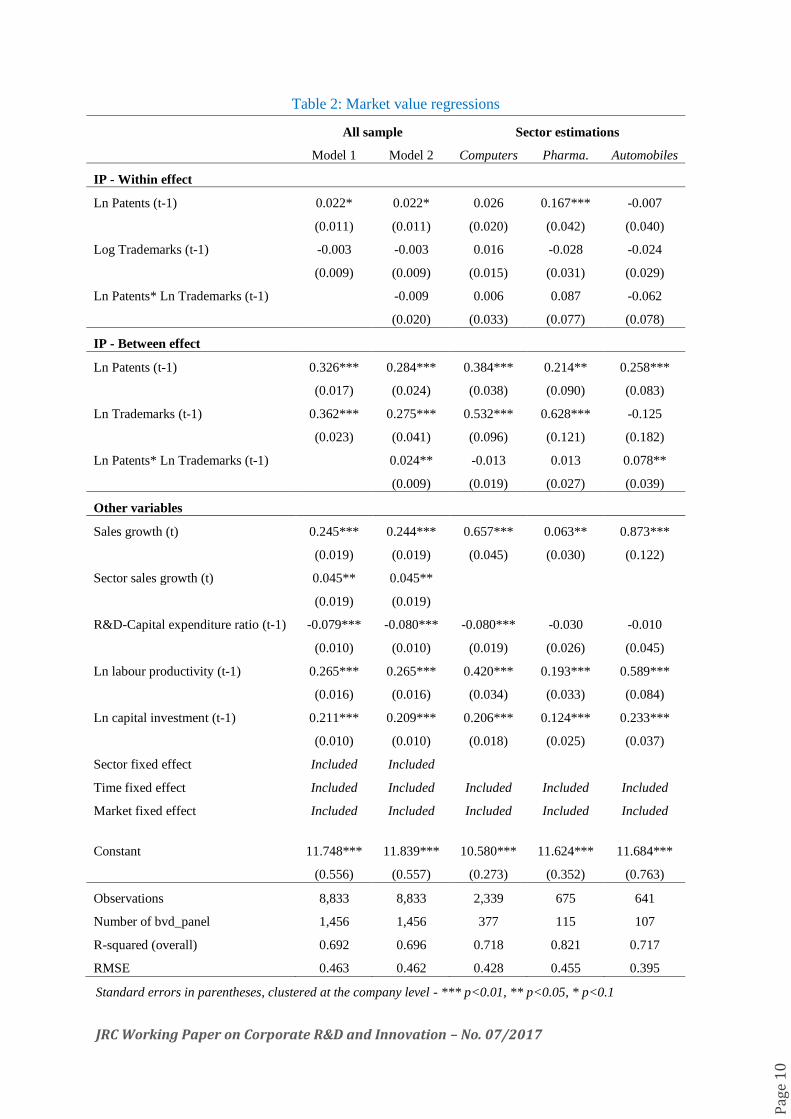
Table 2 reports the results of the estimations over the whole sample of Scoreboard
companies and for the three industrial sectors with the highest number of companies within
the sample. For the whole sample, Model 1 (first column) shows the results from a
specification excluding the interaction term between patents and trademarks, Model 2
(second column) adds the interaction, while for the industry estimations (last three columns)
only the second specification is reported.
The first striking result is that the IP strategies have a higher and in general more
significant power in explaining cross-sectional rather than within variation of market
valuation. Market valuation seems to respond much more to the overall innovative outputs of
companies (measured by their average IP outputs); this suggests that investors tend to value
more the long-run innovative behaviour of companies. This may also reflect some degree of
uncertainty in the evaluation of the potentialities of the latest innovative outputs of a
company.
The within elasticity of market value (the increase in a company market value deriving
from additional innovative outputs) is significant and around 2% for patents, but not
significant for trademarks. Having additional patents exerts a significant and much stronger
impact (elasticity of 16.7%) in the Pharmaceuticals industry, while they are not statistically
significant in the Computers and Automobiles industries.
JRC Working Paper on Corporate R&D and Innovation – No. 07/2017 Page 10
P
age
10
Pag
e 1
0
Table 2: Market value regressions
All sample Sector estimations
Model 1 Model 2 Computers Pharma. Automobiles
IP - Within effect
Ln Patents (t-1) 0.022* 0.022* 0.026 0.167*** -0.007
(0.011) (0.011) (0.020) (0.042) (0.040)
Log Trademarks (t-1) -0.003 -0.003 0.016 -0.028 -0.024
(0.009) (0.009) (0.015) (0.031) (0.029)
Ln Patents* Ln Trademarks (t-1)
-0.009 0.006 0.087 -0.062
(0.020) (0.033) (0.077) (0.078)
IP - Between effect
Ln Patents (t-1) 0.326*** 0.284*** 0.384*** 0.214** 0.258***
(0.017) (0.024) (0.038) (0.090) (0.083)
Ln Trademarks (t-1) 0.362*** 0.275*** 0.532*** 0.628*** -0.125
(0.023) (0.041) (0.096) (0.121) (0.182)
Ln Patents* Ln Trademarks (t-1)
0.024** -0.013 0.013 0.078**
(0.009) (0.019) (0.027) (0.039)
Other variables
Sales growth (t) 0.245*** 0.244*** 0.657*** 0.063** 0.873***
(0.019) (0.019) (0.045) (0.030) (0.122)
Sector sales growth (t) 0.045** 0.045**
(0.019) (0.019)
R&D-Capital expenditure ratio (t-1) -0.079*** -0.080*** -0.080*** -0.030 -0.010
(0.010) (0.010) (0.019) (0.026) (0.045)
Ln labour productivity (t-1) 0.265*** 0.265*** 0.420*** 0.193*** 0.589***
(0.016) (0.016) (0.034) (0.033) (0.084)
Ln capital investment (t-1) 0.211*** 0.209*** 0.206*** 0.124*** 0.233***
(0.010) (0.010) (0.018) (0.025) (0.037)
Sector fixed effect Included Included
Time fixed effect Included Included Included Included Included
Market fixed effect Included Included Included Included Included
Constant 11.748*** 11.839*** 10.580*** 11.624*** 11.684***
(0.556) (0.557) (0.273) (0.352) (0.763)
Observations 8,833 8,833 2,339 675 641
Number of bvd_panel 1,456 1,456 377 115 107
R-squared (overall) 0.692 0.696 0.718 0.821 0.717
RMSE 0.463 0.462 0.428 0.455 0.395
Standard errors in parentheses, clustered at the company level - *** p<0.01, ** p<0.05, * p<0.1
JRC Working Paper on Corporate R&D and Innovation – No. 07/2017 Page 11
P
age
11
Pag
e 1
1
On the one hand, the non-significance of patents in the within estimation for the
Computers industry (and to a lesser extent in the Automobiles one) could be due to the "dense
web of overlapping IPRs that a company must hack its way through in order to actually
commercialize new technology" (Shapiro, 2001, p.120), known as patent thicket, which
renders difficult the evaluation of individual IPRs. On the other hand, in the Pharmaceuticals
industry, where the market for drugs is much more regulated and new molecules rest on a
narrow number of patents, it is much easier to evaluate the potential impact of a patent on
future firm performances. Investors actually grant a higher importance to the technical
competencies conveyed by the companies’ patent filings from the Pharmaceuticals industry.
This is in line with Hall et al. (2014) suggesting an important role of patents in this industry.
These results, are also consistent with the hypothesis of a higher capacity of patents in
attenuating information asymmetries for industries where technologies or products are more
discrete (e.g. Pharmaceuticals) than in industries relying on more complex technologies
(Heeley et al., 2007). In these latter industries a number of different patents are attached to a
single product making rendering more opaque the patent-value link. Finally, corporate
trademarking activities do not lead to a significant premium, when considering their within
effects.
Looking back at the between effect of IPRs, our results clearly show that financial
markets do value the technical and commercial knowledge conveyed by the corporate patents
and trademarks. Moreover and differently from the full model estimations of Greenhalgh and
Rogers (2006; 2012), which suggest a non-significant impact of trademarks on market
valuation, we do find a positive relation between trademarks and market valuation.6
Moreover the between effects of patents and trademarks exhibit a similar magnitude. Twenty
years after Hall (1993), who showed the increasing importance of advertising related
expenditures during the 1980s, we find that product differentiation through trademarks seem
to pay off (in terms of market valuation) as their technological developments.
The inclusion of a proxy for the combined use of patent and trademarks brings further
evidence. The coefficients attached to the IPRs considered does not vary that much, where
we find a positive and significant impact for their interaction. Having a larger patent portfolio
pay off more for those companies which also own trademarks, and vice versa. In other words,
investors award a premium for those companies mastering a wider and possibly interrelated
range of technical and commercial competencies. However, among the industries considered,
this result holds true only for the Automobiles. In this industry, the market premium
associated to trademarks somehow vanishes away while the interaction term shows up with a
positive and significant value. This may reflect the fact that the effects of trademarks operate
mainly through patents.
The coefficient on patents is positive and significant across all specifications in the three
selected industries. This result highlights the importance of corporate patenting activities
when investors benchmark them to take investment decisions. Among the industries
considered, (average) patents yield the highest impact in the Computers industry.
6 It should be noted that Greenhalgh and Rogers’ estimation (2006, 2012) relies on fixed effect specification. Therefore, the non-significant effects of trademarks are in line to those we find for the within variation.
JRC Working Paper on Corporate R&D and Innovation – No. 07/2017 Page 12
P
age
12
Pag
e 1
2
Consistently with the patent thicket argument this may indicate the need to build up a higher
negotiation power through larger patent portfolios in an industry characterized by a very high
degree of technological complexity. In the Pharmaceuticals and Computers industries, the
higher effects of corporate trademarks stress the importance of developing commercial and
marketing competencies in parallel with new technologies.
Consistent results emerge for the remaining variables used in the specification. Firms
with higher sales growth are more likely to yield a higher value on the markets, suggesting a
positive valuation of investors on the companies’ growth prospects. Again, industrial
specificities arise and point at a much lower impact (in the order of one tenth) of sales growth
in the Pharmaceuticals sector as compared to the other industries considered. Here,
consistently with the within estimates, patents may incorporate a much clearer signal of
future performances for investors. Moreover, investors tend to place a positive premium on
companies operating in sectors with an above-average growth, as suggested by the positive
and significant coefficients on the sector sales growth. In other words, companies also benefit
from operating in sector with an overall future potential for sales increase. Once the
innovative output in terms of patents and trademarks are accounted for, our results indicate
that investors would rather penalize companies with a higher ratio of R&D over capital
expenditures. However, this holds true only for the Computers industry. Consistently with
our expectations, firms with a higher productivity also benefit from a market premium, as
shown by the persistent positive sign on the coefficient associated to the ratio of sales per
employee. Finally, larger firms, or more accurately, firms that ceteris paribus have higher
investments in tangible investments obtain a higher valuation on the market.
5. Conclusions
Overall, our results confirm the importance of patenting and trademarks activities in
influencing the firms’ value on financial markets. Indeed they suggest that investors do
account for and confer a premium to the technical, functional, commercial and marketing
knowledge conveyed by the corporate IPRs. The empirical analysis also highlights the
importance of industrial specificities in the IPRs-market valuation relationship and, it does so
by considering a finer inspection at the industry level, as compared to the prior literature. We
therefore confirm that differences in the relationship between innovation and stock
performances originate also in industry-fixed effects, which relate to the characteristics of the
technology in use, and more generally to the current technological regime (Mazzucato, 2006).
The differences observed between the Computers, Pharmaceuticals and Automobiles sectors
point indeed to industry-specific structural features such as the degree of complexity and
modularity of the products, as well as differences in the strategic and competitive behaviours
of companies. Finally, the empirical approach chosen allowed us to show that the effect of
IPRs strategies on market values operates mainly through the cross-sectional dimension.
What really seem to matter are the relative abilities of firms to develop new technological and
commercial competencies.
Our analysis also supports a broader view of the mix of corporate knowledge-based assets
to better assess their effects on the performances of companies and industries and their
society-wide impacts. In the context of knowledge-driven economies this is even more

JRC Working Paper on Corporate R&D and Innovation – No. 07/2017 Page 13
P
age
13
Pag
e 1
3
important as the rate of intangible investments of firms and countries is expanding rapidly. In
the current global economic context such assets constitute an important basis for companies
to remain competitive.
JRC Working Paper on Corporate R&D and Innovation – No. 07/2017 Page 14
P
age
14
Pag
e 1
4
References
Acs, Z. J. & Audretsch, D. B. (1989). Patents as a measure of innovative activity, Kyklos, 42(2),
pp. 171-180.
Allison, P. D. (2009). Fixed Effects Regression Models. Thousand Oaks, CA: Sage.
Bell, A.J.D. & Jones, K. (2015). Explaining Fixed Effects: Random Effects modelling of Time-
Series Cross-Sectional and Panel Data. Political Science Research and Methods, vol 3, pp.
133-153.
Cabral, L.M.B. (2000). Stretching firm and brand reputation. RAND Journal of Economics, 31
(4), pp. 658–673.
Cohen, W. M., Nelson, R. R. & Walsh, J. P. (2000). Protecting their intellectual assets:
Appropriability conditions and why US manufacturing firms patent (or not) (No. w7552).
National Bureau of Economic Research.
Corrado, C., Hulten Ch. & Sichel, D. (2009). Intangible Capital and U.S. Economic Growth.
Review of Income and Wealth, September 2009, No.3.
Dal Borgo, M, Goodridge, P, Haskel, J. & Pesole, A. (2012), Productivity and Growth in UK
Industries: An Intangible Investment Approach. Oxford Bulletin of Economics and Statistics.
de Rassenfosse, G., Dernis, H., Guellec, D., Picci, L. & van Pottelsberghe de la Potterie B.
(2013). The worldwide count of priority patents: A new indicator of inventive activity.
Research Policy, 42(3), pp. 720–737.
Dernis, H., Dosso, M., Hervas, F., Millot, V., Squicciarini, M. & Vezzani, A. (2015). World
Corporate Top R&D Investors: Innovation and IP bundles. A JRC and OECD common
report. Luxembourg: Publications Office of the European Union.
Economides (1988). The Economics of Trademarks, Trademark Reporter, 78, pp. 523-539.
Evangelista, R. & Vezzani A. (2010). The economic impact of technological and organizational
innovations. A firm-level analysis. Research Policy, 39 (1), pp. 1253–1263.
European Commission (2013). The 2013 EU Industrial R&D Investment Scoreboard,
Luxembourg: Publications Office of the European Union.
Frenz, M. & Lambert, R. (2009). Exploring non-technological and mixed modes of innovation
across countries. In Innovation in Firms, a Microeconomic Perspective, pp. 69-109. OECD
Publications.
Gallié, E.-P. & Legros, D. (2012). French firms’ strategies for protecting their intellectual
property. Research Policy, vol. 41(4), pp. 780-794.
Geroski P.A., Machin, S. & Van Reenan, J. (1993). The Profitability of Innovating Firms”,
RAND Journal of Economics, 24, pp. 198-221.
Greenhalgh, C. & Rogers, M. (2012). Trade Marks and Performance in Services and
Manufacturing Firms: Evidence of Schumpeterian Competition through Innovation. The
Australian Economic Review, 45 (1), pp.50-76.
Greenhalgh, C. & Rogers, M. (2006). The value of innovation: the interaction of competition,
R&D and IP. Research policy, vol. 35, No. 4, 05, pp. 562-580.
Greenhalgh, C. & Longland, M. (2005). Running to Stand Still? – The Value of R&D, Patents
and Trade Marks in Innovating Manufacturing Firms, International Journal of the
Economics of Business, vol. 12, Issue 3, November, pp. 307-328.
JRC Working Paper on Corporate R&D and Innovation – No. 07/2017 Page 15
P
age
15
Pag
e 1
5
Griliches, Z. (1990). Patent Statistics as Economic Indicators: A Survey. Journal of Economic
Literature, 28, pp. 1661-1707.
Griliches, Z. (1981). Market Value, R&D and Patents. Economics Letters, 7, pp. 183-87.
Guzman, J., & Stern, S. (2015). Where is Silicon Valley?. Science, 347(6222), pp. 606-609.
Hagedoorn, J. & Cloodt, M. (2003). Measuring innovative performance: Is there an advantage in
using multiple indicators? Research Policy. 32, pp. 1365-1379.
Hall, B. H. (2000). Innovation and Market Value. In Barrell, R., Mason, G., and O’Mahoney, M.
(eds.), Productivity, Innovation and Economic Performance, Cambridge: Cambridge
University Press
Hall, B., Helmers, C., Rogers, M. & Sena, V. (2014). The Choice between Formal and Informal
Intellectual Property: A Review. Journal of Economic Literature, vol. 52, no. 2, pp. 375-423.
Hall, B. H., Thoma, G. & Torrisi, S. (2007). The Market Value of Patents and R&D: Evidence
from European Firms. Cambridge, MA: NBER Working Paper No. 13428.
Hall, B. H., Jaffe, A. & Trajtenberg, M. (2005). Market Value and Patent Citations. Rand Journal
of Economics. 36, pp. 16-38.
Hall, B. H. (1993). The stock market's valuation of R&D investment during the 1980's. American
Economic Review, 83: 259-264.
Hall, L. & Bagchi-Sen, S. (2002). A study of R&D, innovation, and business performance in the
Canadian biotechnology industry. Technovation 22, pp. 231-244.
Heeley, M., Matusik, S., & Jain, N. (2007). Innovation, Appropriability, and the Underpricing of
Initial Public Offerings. The Academy of Management Journal, 50(1), 209-225
Hottenrott, H., Hall, B. H. & Czarnitzki D. (2016). Patents as quality signals? The implications
for financing constraints on R&D. Economics of Innovation and New Technology, Special
Issue " Financing constraints R&D investments and innovation performances", vol. 25(3),
pp. 197-217.
King, B. F. (1966). Market and industry factors in stock price behavior. Journal of Business,
39(1), pp. 139-190.
Kleinknecht, A, Van Montfort K. & Brouwer, E. (2002). The non-trivial choice between
innovation indicators. Economics of Innovation and New Technologies, 11, pp. 109-121.
Llerena, P., & Millot, V. (2013). Are Trade Marks and Patents Complementary or Substitute
Protections for Innovation. BETA Document de Travail, 1.
Mazzucato, M. (2006). Innovation and Stock Prices. Revue de L’Observatoire Français de
Conjonctures Economiques. Special Issue on Industrial Dynamics, Productivity and Growth
Millot, V. (2012). Trademark strategies and innovative activities. Ph.D. thesis, Université de
Strasbourg.
Mundlak, Y. (1978). On the Pooling of Time Series and Cross Section Data. Econometrica, 46
(1), pp. 69-85.
Neuhaus, J. M. & Kalbfleisch, J. D. (1998). Between- and within-cluster covariate effects in the
analysis of clustered data. Biometrics, 54, pp. 638-645.
OECD (2011). Mixed modes of innovation. In OECD Science, Technology and Industry
Scoreboard 2011, OECD Publishing.
JRC Working Paper on Corporate R&D and Innovation – No. 07/2017 Page 16
P
age
16
Pag
e 1
6
Piotroski, J.D. & Roulstone, D.T. (2004). The Influence of Analysts, Institutional Investors, and
Insiders on the Incorporation of Market, Industry, and Firm-Specific Information into Stock
Prices. The Accounting Review, 79(4), pp. 1119-1151.
Ramnath, S. (2002). Investor and Analyst Reactions to Earnings Announcements of Related
Firms: An Empirical Analysis. Journal of Accounting Research, 40(5), pp. 1351-1376.
Rujas, J. (1999). Trademarks: complementary to patents. World Patent Information, 21, pp. 35-
39.
Sandner, P.G. & Block, J. (2011). The market value of R&D, patents, and trademarks. Research
Policy, 40 (7), pp. 969-985.
Schunck, R. (2013). Within and between estimates in random-effects models: Advantages and
drawbacks of correlated random effects and hybrid models. Stata Journal, StataCorp LP,
vol. 13(1), pp. 65-76.
Shapiro, C. (2001). Navigating the Patent Thicket: Cross Licenses, Patent Pools, and Standard-
Setting. In Adam Jaffe, Joshua Lerner, and Scott Stern, eds., Innovation Policy and the
Economy, National Bureau of Economic Research.
Somaya, D., & Graham, S. J. (2006). Vermeers and Rembrandts in the same attic:
Complementarity between copyright and trademark leveraging strategies in software.
Georgia Institute of Technology TIGER Working Paper.
Statman, M., & Tyebjee, T. T. (1981). Trademarks, patents, and innovation in the ethical drug industry. The
Journal of Marketing, 71-81.
Toivanen, O., Stoneman, P. & Bosworth, D. (2002). Innovation and the market value of UK
firms, 1989-1995. Oxford Bulletin of Economics and Statistics, 64, pp. 39-61.
Zhou, H. Sandner, P.G., Martinelli, S.L., Block J. H. (2016). Patents, trademarks, and their
complementarity in venture capital funding, Technovation, Volume 47, pp. 14-22.
JRC Working Paper on Corporate R&D and Innovation – No. 07/2017 Page 17
P
age
17
Pag
e 1
7
Appendix
Table A1: Descriptive statistics
Mean Standard
Deviation Median
25th
percentile
75th
percentile
Market value (ln) 14.49 1.69 14.4 13.3 15.6
Patents (ln) 2.75 1.80 2.64 1.39 3.92
Trademarks (ln) 1.45 1.32 1.39 0 2.30
Sales growth 0.10 0.39 0.07 -0.01 0.17
Sector sales growth 0.45 0.52 0.27 0.07 0.58
R&D-Capital expenditure ratio
(ln) 0.03 1.72 0.06 -0.95 1.14
Log labour productivity (ln) -1.46 0.89 -1.47 -1.86 -1.01
Log capital investment (ln) 11.08 2.16 11.11 9.71 12.50

JRC Working Paper on Corporate R&D and Innovation – No. 07/2017 Page 18
P
age
18
Pag
e 1
8
s