technology transfer and valuation of intellectual...
TRANSCRIPT

Technology Transfer and Valuation of Intellectual Property Assets
February, 2012
Dipanjan Nag, Ph.D., MBA, CLP
Executive Director, Office of Technology Commercialization President, IPShakti LLC
Vice President Elect for Professional Development, AUTM

The World is Spiky: Population
Map by Tim Gulden, University of Maryland.
From Richard Florida, “The World is Spiky,”
The Atlantic Monthly, October 2005

The World is Spiky: Patents
Map by Tim Gulden, University of Maryland.
From Richard Florida, “The World is Spiky,”
The Atlantic Monthly, October 2005

The World is Spiky: Scientific Citations
Map by Tim Gulden, University of Maryland.
From Richard Florida, “The World is Spiky,”
The Atlantic Monthly, October 2005

“Society, having funded much of the university based research, has an expectation that the fruits of that research will improve the human
condition.”
-- Niels Reimers, 1987
Founder and Director of Stanford Office of Technology Licensing

6

Perspectives of Technology Transfer • University perspective
– Disseminate technologies
– Products to market from basic research
– Enrich local economy
– Generate revenues
• Large company perspective
– Viable source of early stage IP
– Running clinical studies
– Collaboration with academia
• For philanthropy
• For goodwill
• Access to accomplished researchers
– Access to work force 7

Perspectives of Technology Transfer
• Small company/startup perspective
– Viable partner for early stage POC
– Access to facilities and instruments
– Access to faculty researchers
– Increased brand value for fund raising
– Access to work force
8

TTO Stakeholders
9
Faculty Inventors
Schools, Centers & Institutes
OTC
External
•Corporations
•Venture and Angel community
•State agencies (NJ EDA, NJBio,
R&D Council, Others)
•AUTM, LES, Bio and other
industry consortia

The Model
10 Revenues
Economic Development
Service to Faculty
Licensing

Facets of the Innovation Ecosystem
11
Proof of Concept Center (POCC)
Entrepreneurship Education Program (degree granting)
Innovation & POC Funds
(internal programs)
Entrepreneurship Mentoring
Program (Faculty, Staff, Community)
Technology Commercialization
Office

Tech Commercialization in Numbers*
12
Research Funding (~$588B)
~249,000 Invention Disclosures
~130,000 Patent Applications
~51,000 Patents Awarded
38,030 active license & options, 6,272 start-ups
* Source AUTM Licensing Survey 1991-2009

Identifying Potential Markets
Rodger’s Diffusion of Innovation
Identify the right market

High-Level Technology Transfer Process Flow
Faculty
Invention
Disclosures
Screening of
Inventions
Engage
?
Protection
Strategy
Enactment
Marketing
Strategy
Enactment
Deal-Making
Deal
Portfolio
Management
IP Portfolio
Management
Marketing
Results
Review
Marketing
Strategy
Development
Protection
Strategy
Development
yes
License
Back? no
Understand
Findings
Early On
Support
Research
IP License-
Back
yes
no Waive to
Sponsor (if applicable)
Intake &
Evaluation
Protection
Commercialization Turnback
Credits
Eric Hunzeker, UNL


16

STREPTOMYCIN

The Three R’s of Technology Transfer
• Build relationships with Faculty members
– Get high quality disclosures
• Build relationships with local and national industry
– Create trust so that licensing will follow
• Build relationships with fellow technology transfer professionals
– Data shared between offices about licensing experience
– Establish efficient flow of information about royalty, agreements and deal structures

19

Components of S&P 500 Market Value
Components of S&P 500®
Market Capitalization
-
2,000
4,000
6,000
8,000
10,000
12,000
14,000
1973 1975 1977 1979 1981 1983 1985 1987 1989 1991 1993 1995 1997 1999 2001 2003 2005
S&
P 5
00 M
ark
et C
ap (
$ '0
00s)
Market Premium
Intangible Book Value
Tangible Book Value
Data: Ned Davis Research, Inc.

Exclusivity Value:
• Price premium
• Reduced manufacturing cost
• Increased market share
• Enhanced customer satisfaction
• Blocking value
Defensive Value/
Freedom to Operate:
• Creates an IP arsenal to
discourage lawsuits
• Provides ability to compete,
but little advantage
Trading Value:
• Value in trade for entering into
cross-licenses, for licensing-out,
or for sale
Option Value:
• Current technology and protection
may provide an avenue for future
investments
IP Creates Value Through a Variety of
Mechanisms Numerous Sources of Value
Acknowledge Ocean Tomo

Income Approach
• Theory: Value is determined by the economic benefit expected from use of the IP
• Value of Patent = Present Value of the expected future income stream
• Three key parameters:
Amount of the income stream
Duration of the income stream
Risk associated with the realization of the income
• How much can be earned from commercialization of the IP, and what is that value in today’s dollars?
• Most commonly used valuation approach – Gold Standard
• Generally two types of analysis performed for the Income Approach: Excess Earnings and Relief from Royalty
Basic Valuation Approaches – Income Approach
Acknowledge Ocean Tomo

Revenue
COGS
SG&A
Taxes
Cash Flow
Risk Factors
Incremental Cash Flow of
Products Embodying IP ($)
Allocation of Cash Flows to IP (%)
Value of Intellectual Property
X
=
PV of Intellectual Property
Example Income Approach – Excess Earnings
Discount Rate
Probabilities of Success
Discounts to Cash Flows
Discounts to Value Allocation
Many Others
With IP Without IP
Valuation Methodologies
Revenue
COGS
SG&A
Taxes
Cash Flow
Acknowledge Ocean Tomo

Market Opportunity
Penetration Rate
Price
Launch Date
Useful Life
Many Others
Royalty Base (e.g., sales)
Royalty Rate (%)
Royalty Revenue
X
=
Example Income Approach – Relief from Royalty
Risk Factors
PV of Intellectual Property
Discount Rate
Probabilities of Success
Discounts to Cash Flows
Discounts to Value Allocation
Many Others
Acknowledge Ocean Tomo

• Riskier projects require greater potential returns
• Discount rate usage: Present Value Factor = $1 / (1+DR)Years
– Risk-free rate (treasury bonds) – passage of time 5%
– Weighted average cost of capital – standard risks 12%
– Cost of equity 15%
– Risk adjusted hurdle rates used in licensing
• Very low risk 15-20%
• Moderate risk 25-35%
• Very high risk 35-45%
– Venture capital rates
• Bridge financing 20-35%
• Second stage financing 30-50%
• First stage financing 40-60%
• Start-up financing 50-70%
• Seed financing 80+%
Discount Rates
Acknowledge Ocean Tomo

Cost Approach
• Theory: Value is determined by the cost to replace or the cost to re-create the IP
• Costs Include: R&D, materials, equip., marketing, advertising, delayed market entry
• Value of Patent = Fair market value of total investment to replace or re-create
– A prudent licensee/buyer will not pay more for the IP than the amount for which the IP could be re-created
– By licensing IP from others, the licensee avoids development costs and minimizes risk
• How do you replace or re-create a unique asset?
• Need to consider lost time-to-market due to re-creation
• These are sunk costs – are they relevant?
• Original costs to develop IP may be different than costs to replace or re-create IP
• Often used to value embryonic technology or technology easy to design around (e.g. software)
Basic Valuation Approaches – Cost Approach
Acknowledge Ocean Tomo
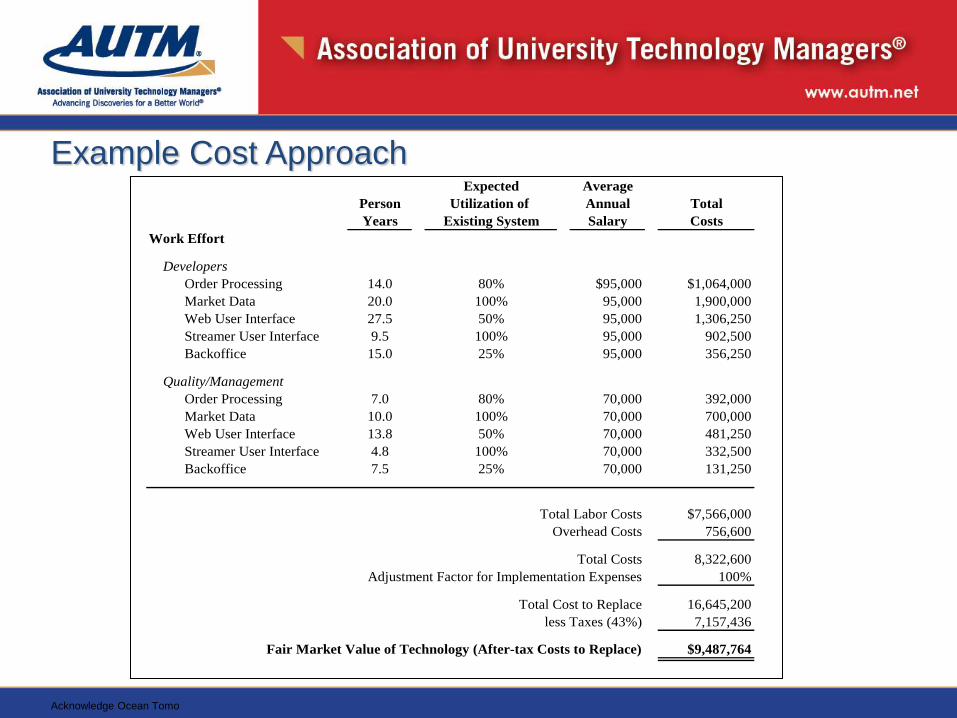
Example Cost Approach Expected Average
Person Utilization of Annual Total
Years Existing System Salary Costs
Work Effort
Developers
Order Processing 14.0 80% $95,000 $1,064,000
Market Data 20.0 100% 95,000 1,900,000
Web User Interface 27.5 50% 95,000 1,306,250
Streamer User Interface 9.5 100% 95,000 902,500
Backoffice 15.0 25% 95,000 356,250
Quality/Management
Order Processing 7.0 80% 70,000 392,000
Market Data 10.0 100% 70,000 700,000
Web User Interface 13.8 50% 70,000 481,250
Streamer User Interface 4.8 100% 70,000 332,500
Backoffice 7.5 25% 70,000 131,250
Total Labor Costs $7,566,000
Overhead Costs 756,600
Total Costs 8,322,600
Adjustment Factor for Implementation Expenses 100%
Total Cost to Replace 16,645,200
less Taxes (43%) 7,157,436
Fair Market Value of Technology (After-tax Costs to Replace) $9,487,764
Acknowledge Ocean Tomo

Market Approach
• Theory: Value is based on the transactions of other purchasers & sellers in the marketplace
• Value of Patent = Arm’s length price paid in equally desirable & comparable transactions
– Licensee/Buyer is not willing to pay more than others have paid for similar IP
• Comparables: type of IP, industry, market size, terms, and profitability
• Based on the principle of substitution: assesses what the market will or should bear
• Comparables must be actual asset transactions
• Larger samples of comparable transactions can help smooth differences between firms
• Difficult to identify comparable because the patent market is illiquid
• Often used to determine licensing royalty rates for similar technology
Basic Valuation Approaches – Market Approach
Acknowledge Ocean Tomo

Example Market Approach
Brand IP Owner / Seller / Licensor
New Owner / Licensee /
Infringer
Trademark
Value ($M)
Revenue
($M) Date Notes
Commodore Tulip Co. Yeahronimo Ventures $33 2005 Transaction believed predominantly IP based. Commodore has not had traction since
the 1970s/early 1980s
Levis Levis Strauss & Co. N/A $500 $4,091 2003 Loan: "In 2003, Levis Strauss completed a $500 million trademark-backed term loan,
$200 million of which was priced with a hefty 10% interest rate through lead arranger
Bank of America"
Fieldcrest, Cannon,
Royal Velvet
Pillowtex Co. GGST LLC $121 $935 2003 Bankruptcy: bidders at bankruptcy auction primarily interested in brand IP, although
some hard assets also purchased
Rolls-Royce Rolls-Royce, PLC (aircraft
company)
BMW $65 $5,645 2003 Purchase: "BMW, having done its homework, knew that the aircraft company owned
the valuable Rolls-Royce trademark…BMW, already a partner with Rolls-Royce PLC
in an aerospace venture, purchased the Rolls-Royce trademark from the aircraft
company for a mere $65 million"
Nautica Nautica Enterprises VF Corporation $217 $694 2003 Total purchase price of $589.6M
Hotel del Coronado Lowe Enterprises CNL Hospitality
Properties
$49 2003 Total purchase price of $385M, representing a 60% majority stake
Calvin Klein Calvin Klein Phillips-Van Hausen >$300 $172 2002 Calvin Klein is selling the company that bears his name. Klein will be paid $400
million in cash, plus $30 million in stock and up to $300 million in royalties
Prime Prime Restaurants of
Canada, Inc.
PRC Trademarks, Inc. $130 $127 2002 Plus a 3.25% royalty rate of gross revenues
Schwinn Schwinn/GT Pacific Cycle $86 2001 Bankruptcy: primary asset was brand IP, but some inventory may also have been
purchased
Rocket Gillette Co. Rocket Electric Co., Ltd. $44 $8,084 2001 "Rocket Electric Co., a battery maker in Korea, entered into a 7-year license contract
with Gillette Co. involving the use of trademark ROCKET…Of the total amount,
US$44 million was attributed to the value of the trademark as determined by Brand
Value Co."
Dean Foods Dean Foods Company Suiza Foods Corporation $207 $5,974 2001 Upon the acquisition Suiza Foods Corporation changed their name to Dean Foods
Company. Total purchase price of $683.9M.
DHL N/A N/A $50 1992 Tax: opinions by the various experts as to U.S. value of the mark were $350.9, $102.0,
$122.2, $18.2 million -- ultimately the Court allocated $50 million of value to the U.S.
trademark rights
Speedo Speedo Pentland, UK $37 1990 Worldwide license for Speedo swimwear
Acknowledge Ocean Tomo

PORTFOLIO ANALYSIS
Looking for Value
30

Metrics for Analysis
• Market Size
• Timeliness of Technology
• Maturity
• Intellectual Property Strength
• Time to Market
31

Market Size
• Is the overall market large?
• What part of the market will this technology capture?
• Is the market evolved?
• Will this be a discontinuous invention? – Requires displacement of current technologies?
• What is the expected market penetration?
32

Timeliness of Technology
• Is the technology ahead of its time?
• Is there a need for the technology in the market right now?
• Will this plug into a current technology?
• Will this be disruptive in the marketplace?
• Does the government of other regulatory bodies mandate use of this technology?
– Prohibiting the use of cell phones in car • NHTSA
33

Maturity of Technology
• Is the technology in an early stage of development?
• How long will it take to take the technology to a product concept?
• How long will it take it to take the technology to a prototype?
• What amount of resources will it take to get the technology evolved for a company to take it to market?
34

Intellectual Property Strength
• What is the status of intellectual property protection?
• Is there an issued patent in the portfolio?
• Are there other forms of technology protecting it? – Copyright
– Trademarks
– Know-how/trade secret
• What is the quality of patent around the technology?
• Are there international patents in the appropriate regions for the technology?
• Cost of protecting the technology appropriately
35

Time to Market
• How long will it take to get the technology to market?
• How long does it typically take a technology of a similar nature to get to market?
– Is this a pharmaceutical or medical device?
• Is there a regulatory body which mandates particular standards for the product to get to market?
• How long will the development take to introduce the product?
36

37

Models for Technology Transfer
• Within the University
• Outside the University
– A non-profit foundation
– A TLO model (prevalent in Japan and other countries)
38

THANK YOU!
39

Outline
• Introduction
• Role of Public and Private Sector in Patent Quality
• Strategic Development of Patent Quality
• Patent Quality Determination
• IP portfolio management and patent quality
40

INTRODUCTION:
• What is Patent Quality?
• Patent Quality vs Quantity?
• What is Patent Value?
• Patent Quality = Patent Value?
• What are the metrics for measuring patent quality?
41
Metrics for measuring patent quality
• Backward citations (prior art)
• Number of claims
• Length of claims
• Breadth and quality of claims
• Litigation(s)
• Quality of inventor(s)
• Disclosure
– Completeness of disclosure to support the claims
• Pendency of the patent (it depends)
• Law firm used
– Specific attorney technology expertise
• Forward citation (Most critical metric)
42

Role of Public and Private Sector in Patent Quality
A. Is patent quality an active measure people look at when filing patents?
B. How much does the law firm contribute to the improvement of patent quality?
C. As a University tech transfer office what can you do to ensure higher quality patents?
D. Does private sector care that much about patent quality?
E. Does due IP diligence come before or after filing patents?
43

Is patent quality an active measure people look at when filing patents?
• Most entities do not have patent quality checks when filing
– Do you ask for the minimum number of claims?
– Do you ask for a certain number of independent claims?
– Do perform a prior art search?
– Do you ask counsel to perform “white space” analysis?
44

How much does the law firm contribute to the improvement of patent quality?
• The law firm/counsel has the ultimate responsibility in ensuring high
quality of patents
– The prior art search could be done with law firm or with outside entity
– The inventor needs to weigh in on the invention
– Sometimes the inventor is more focused on a narrow part of the invention
– GOOD INVENTION ≠ HIGH QUALITY PATENT
– Getting counsel who preferably understand IP litigation
– Have you considered invalidation of the patent?
• Has your counsel considered invalidation of the patent?
– Looking at the patent family rather than the single patent 45

As a University tech transfer office what can you do to ensure higher quality patents?
• Always opt for a higher number of claims in a patent (does not cost you that much more!)
• Have a robust set of prior art (it helps rather than hurting your patent)
• Independent claims should obviously be as broad as possible (making sure they are not too broad so as to get the patent invalidated)
• The claims should be supported by a robust disclosure/embodiment
• Avoid “paper clip provisional” as much as possible
– They do hurt your patent quality!
46

Does private sector care that much about patent quality?
• YES!
– Licensee or acquirer does care about patent quality
– But quantity is also critical
47

Does IP due diligence come before or after filing patents?
• Looking at some of the IP due diligence checkpoints
– Pending litigation
– Completed litigation
– Licenses granted
– Infringement
– Invalidity
– Complete prosecution history (PAIR is your friend!)
– Check assignment (then check again, USPTO assignment database)
• Check Espace (most complete)
• Check Patent Lens
48

Does due IP diligence come before or after filing patents?
• Invention disclosures
• IDS and searches performed
• Patent application (provisional or non-provisional or PCT)
• Inventor declaration
• Filing receipts.
• Inventor assignment(s) – confirmatory assignment
• Security interests or liens
• Office actions
• Notice of allowance
• Issue fee
• Ribbon patent
49

Strategic Development of Patent Quality:
A. Knockout Prior Art Search
B. Patent Reexamination
C. Benefits vs Limitation
D. Favor patent challengers?
E. Deter NPE assertions?
F. Timely assessment of technology
50

Patent Quality Determination:
A. Technique: Claim Interpretation
B. Tools: Article One Partners Patent Ratings Patent Indices Peer to Patent
C. New Business Models RPX AST
Ocean Tomo
Intellectual Ventures
51

IP portfolio management and patent quality
A. Technology evaluation vs. IP portfolio management (maturity of technology vs. maturity of IP)
B. How to extract value from high quality patents?
C. Is selling high quality patents an option?
D. The 1 hour IP portfolio triage - Does it work? 52

Technology evaluation vs. IP portfolio management
• Technology evaluation is not the same as IP evaluation
– A “hot” technology might not necessarily have a high quality patent
– A high quality patent might not be necessarily tied to a “timely invention”
• A technologist should perform a technology portfolio evaluation
– A tool suited for performing an IP portfolio evaluation has to be used to address quality of a patent
• IP portfolio management is essential from time to time for trimming the portfolio of unlicensed techs
– Non-exclusively licensed techs can be licensed again if there are high quality patents
– Stick vs. carrot licenses 53

How to extract value from high quality patents?
• Based on technology maturity
– Older technologies with large number of forward citations
• Stick license – non-exclusive
– Timely inventions with high number of forward citations from a single company
• Stick license – exclusive
– Patents in mature markets which are not necessarily platform technologies
• Larger number of forward citations
• Might be worth exploring product claims
• Might be further worth exploring claims charts or evidence of use
• Companies will not license unless there is direct evidence of infringement
54