fiscal year 2017 - sdbor.edu · fiscal year 2017 2 university center - sioux falls south dakota...
TRANSCRIPT

Fact BookFiscal Year 2017
South Dakota School for the Deaf
South Dakota Board of Regents Offi ce of the Executive Director
www.sdbor.edu

South Dakota Board of Regents Fact Book Fiscal Year 2017
Map of Universities and Special Schools ..................................................................................................................................... 2Executive Summary ...................................................................................................................................................................... 3Board Member Biographies .......................................................................................................................................................... 8Missions of the Universities and Special Schools ...................................................................................................................... 10
Enrollments, High School Preparation, and Degrees ConferredHistorical Fall Headcount, Full-Time Equivalent, and Total Enrollments ................................................................................. 12Student Profi le by University ...................................................................................................................................................... 14High School Dual Credit ............................................................................................................................................................. 15SD High School Graduates / University System Enrollment / High School Students Enrolled in University Courses ............ 16Distance Education .................................................................................................................................................................... 17Advanced Placement® Exams in South Dakota ........................................................................................................................ 18ACT - American College Testing: US and SD Distributions, SD Mean Scores by Completion of Core ................................... 19Distribution of ACT Composite Scores ..................................................................................................................................... 20Educational Improvement .......................................................................................................................................................... 21New Undergraduate Registrants / Transfer Enrollments ........................................................................................................... 22Retention of New Degree-Seeking Undergraduates / Completion of Baccalaureate Degrees .................................................. 23Awarded Degrees and Baccalaureate Majors Awarded............................................................................................................... 24Graduates - Teacher Education Majors ....................................................................................................................................... 27Degree Trends Summary ............................................................................................................................................................ 28Licensure and Certifi cation Examinations .................................................................................................................................. 29
Placement In-State Placement of Regental Teacher Education Graduates ................................................................................................... 30Placement Outcomes of Regental Graduates ............................................................................................................................. 31
ResearchGovernor Research Center Program .......................................................................................................................................... 32Grants and Contracts / FY16 Expenditures from Grants and Contracts / Grant and Contract Expenditures History ................ 33Grant and Contract Award History / System Technology Transfer / Research Centers’ Economic Impact ............................... 34
Tuition and Fees and Student Financial AidFY17 Tuition and Mandatory Fees Schedule .............................................................................................................................. 35Regional Comparison Tuition and Fees ...................................................................................................................................... 38Regional Comparison Total Cost ................................................................................................................................................ 39Jump Start ................................................................................................................................................................................... 40South Dakota Opportunity Scholarship / Student Financial Aid by Program .......................................................................... 41Total Financial Aid from Loans / Average Student Loan Debt / Total Grant and Aid Funding for Surrounding States ........... 42
Financial ResourcesBoard of Regents Percent of General Fund Expenditures / Board of Regents All Funds by Funds Source ............................... 43History of General Fund Appropriations ................................................................................................................................... 44FY17 All Funds Operating Budget ............................................................................................................................................ 46Operating Budgets by Program ................................................................................................................................................... 48Budgeted Salaries / FTE by Category (All Funds / General Funds) ........................................................................................... 52Actual Expenditures Per Student FTE / State & Student Support .............................................................................................. 54Appropriations / Education Appropriations per FTE .................................................................................................................. 55
Faculty Characteristics and SalaryStudent-Faculty Ratio / Employee Utilization ............................................................................................................................ 56Faculty Salaries by Rank / Salary Competitiveness Plan / Salary Policy Average for Peer Institutions ................................... 57Salary Policy Increase for Surrounding States / Salary Policy Average for Surrounding States History .................................. 58Faculty Profi le by University ...................................................................................................................................................... 59
Special SchoolsSouth Dakota School for the Blind and Visually Impaired / South Dakota School for the Deaf ............................................... 60SDSBVI and SDSD Enrollment ................................................................................................................................................. 61
Facilities Maintenance and Repair Goal / Buildings – Initial & Replacement Costs ................................................................................ 62Size of Physical Plant ................................................................................................................................................................ 63Campus Housing Utilization ....................................................................................................................................................... 64Campus Housing Utilization History / Campus Funded South Dakota Building Authority Leases .......................................... 65Auxiliary System Bonded Debt .................................................................................................................................................. 66South Dakota Building Authority HEFF Leases & Science Facility Leases .............................................................................. 67
Minimum Admission Requirements ........................................................................................................................................ 68

Fiscal Year 2017Fiscal Year 2017
2
University Center - Sioux Falls
South Dakota Regental Universities and Special Schools
Black Hills State University
South Dakota School of Mines & Technology
South Dakota School for the Blind and Visually Impaired
Northern State University
South Dakota State University
South Dakota School for the Deaf
Dakota State University
University of South Dakota
Abbreviations Used in the Fact Book
Capital University Center - Pierre
BHSU- Rapid City
indicates a public higher education center
University Center - Sioux Falls
ADRDL Animal Disease Research and NACUBO National Association of CollegeDiagnostic Laboratory & University Business Officers
AES Agricultural Experiment Station NSU Northern State UniversityBHSU Black Hills State University RIS Regents Information SystemsBHSU-RC Black Hills State University Rapid City SDLN South Dakota Library NetworkBOR Board of Regents SDSD South Dakota School for the DeafCUC Capital University Center SDSMT South Dakota School of Mines DDN Digital Dakota Network and TechnologyDSU Dakota State University SDSBVI South Dakota School for the Blind EPSCoR and Visually Impaired
SDSU South Dakota State UniversityESC Enrollment Services Center SSOM Sanford School of MedicineFTE Full-time Equivalent S&PL School and Public LandsGAF General Activity Fee UCSF University Center Sioux FallsHEFF Higher Education Facilities Fund USD University of South DakotaIPEDS Integrated Postsecondary WICHE Western Interstate Commission
Education Data System for Higher Education
Experimental Program to Stimulate Competitive Research

Executive Summary Fiscal Year 2017
3
Enrollments, High School Preparations, and Degrees Conferred Pages 12-29 • Total headcount enrollment for Fall 2016 is 36,531. • Total full-time enrollment for Fall 2016 is 26,600. • Total South Dakota high school graduates FY16 are 8,765. • Public university enrollments have remained steady despite a 10 percent decrease in the number of SD high school graduates over a 13-year span. • New registrants at the public universities in Fall 2016 are 7,849. • Total number of degrees awarded by the public universities in FY16 are 6,614. • The university system retention rate (freshman to sophomore year) is 79 percent.
Placement Pages 30-31 • 56.2 percent of FY14 graduates were placed in SD by either employment or enrollment. • 71.6 percent of FY14 graduates originally from SD remained in state.
Research Pages 32-34 • The total economic impact to the state from the Research Centers is $418.8 million. • Total state and external funding for the Research Centers is $290.8 million.
Tuition and Fees and Student Financial Aid Pages 35-42• Cost of Attendance • The total cost (includes room and board) for an undergraduate resident to attend one year of college at a public university is $15,387. • Among the surrounding states, SD undergraduate resident total cost is the fourth highest in the seven regional states. • The total cost for one year of graduate school for a resident student is $15,227 (does not include room and board), second lowest among surrounding states. • Student Aid • Non-obligation aid (grants and scholarships) for the system in FY16 was $78,204,543. • Obligation aid (loans and work study) for the system in FY16 was $202,848,540. • Eighty percent of students received fi nancial aid at the system level. • Average fi nancial aid award for the system was $10,754. • Average loan debt was $25,408.• South Dakota Opportunity Scholarship • During Fall 2016 there were 3,155 Opportunity Scholarship recipients attending SD public universities. • In Fall 2016, there were 2,676 continuing eligible recipients at all SD institutions and 1,273 fi rst-time recipients. Financial Resources Pages 43-55 • The general fund base for the university system has increased by 5.3 percent. • State support per student FTE has increased 5.7 percent over FY16. • Student support is 56 percent and state support is 44 percent. • South Dakota continues to rank low among surrounding states for appropriations of state tax funds to support postsecondary education.
Faculty Characteristics and Salary Pages 56-59 • A total of 99.8 percent of faculty have either a doctorate or master’s degree in the subject they teach. • A total of 75.2 percent have a terminal degree (highest degree available) in their fi eld. • Student faculty ratio is 19.8 to 1 for the system.
Special Schools Pages 60-61 • SDSBVI serves 21 students on campus and 216 students through outreach. • SDSD serves 506 students through outreach programs.
Facilities and Equipment Pages 62-67 • In FY16, the state appropriated an additional $3.3 million to support maintenance and repair of Board of Regents’ academic facilities. This is the fi nal installment of a four-year plan to get to a 2 percent annual investment. • The Board of Regents continues to work towards the goal of an annual investment of 2 percent of the building replacement values. With an investment of $25,254,195 in FY17, maintenance and repair has now reached the 2 percent goal.

Fiscal Year 2017
4
Executive Summary
Now
Goal
88.7%
95.0%
South Dakota Public Universities: Developing Minds, Communities, and Our Economy
The Board of Regents’ mission is to provide an excellent, effi cient, accessible, equitable, and affordable public university and special schools system that improves South Dakota’s overall educational attainment and research productivity, while enriching the intellectual, economic, civic, social, and cultural life of the state, its residents, and its communities.
The South Dakota Board of Regents, in its Strategic Plan for 2014-2020, has committed to four major goals that will guide the actions of the Board of Regents, its system, and institutional leaders:
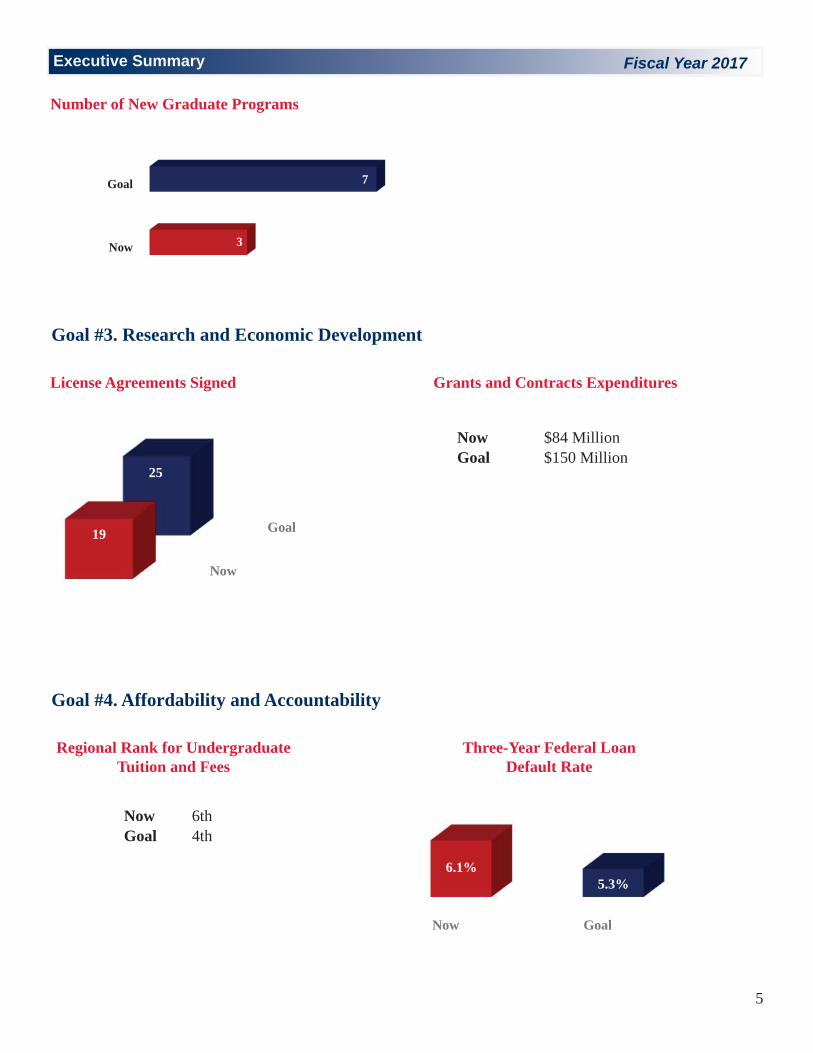
Goal #1. Student Success – Refl ecting rates of growth in total graduates over the last fi ve years, grow degree production to 7,450 per year by 2020. Goal #2. Academic Quality and Performance – Document that academic programs are of the highest quality. Goal #3. Research and Economic Development – Increase annual system research and contract expenditures to $150 million by 2020 to advance knowledge, enhance technology transfer and commercialization, and catalyze economic development. Goal #4. Affordability and Accountability – Reduce South Dakota tuition and fees ranking to the regional average by 2020.
Goal #1. Student Success
Now Goal
90
100
Number of Accredited Programs
Goal #2. Academic Quality and Performance
Percent of Graduates Passing Licensure Exams
Now Goal
Undergraduate Degree 4,710 5,630
Graduate Degree 1,460 1,820
Retention Rate 77.4% 83.0%
4 Year Graduation Rate 26.8% 27.0%
6 Year Graduation Rate 49.7% 54.0%
Remediation Rate 26.9% 22.0%
Executive Summary Fiscal Year 2017
5
Now Goal
6.1%5.3%
Now
Goal
3
7
Number of New Graduate Programs
Goal #3. Research and Economic Development
Now
Goal19
25
License Agreements Signed Grants and Contracts Expenditures
Goal #4. Affordability and Accountability
Regional Rank for Undergraduate Tuition and Fees
Three-Year Federal Loan Default Rate
Now $84 MillionGoal $150 Million
Now 6thGoal 4th

Fiscal Year 2017
6
Executive Summary
Why is Higher Education Important?
Education Pays
Unemployment Rates 2015 Median Annual Earnings in 2015
Source: Bureau of Labor Statistics, Current Population Survey
Professional Degree
Bachelor’s Degree
Some College, No Degree
High School Diploma
The national data are clear. Education pays. Data from the U.S. Bureau of Labor Statistics demonstrate that increasing levels of education pays off in the form of higher earnings and lower employment rates.
Earn More - Stay Employed
$25,724
$35,376
$38,507
$41,638
$59,326
$69,970
$84,684
$90,267
Doctoral Degree
Master’s Degree
Associate’s Degree
Less than High School Diploma
8%
5.4 %
5%
3.8%
2.8%
2.4%
1.7%
1.5%
The Economic Impact of Public Higher Education
$2.66 Billion South Dakota public universities generate approximately $2.66 billion of annual economic impact to South Dakota. The state investment was $197 million for FY16.
Public universities directly support 5,628 full-time jobs, together with an additional
21,950 jobs in other industries in South Dakota.
$162 Million in sales and property tax revenues accrued to the state of South Dakota due to the economic activity generated by the public university system.
Source: The Economic Impact of the South Dakota Public Universities, November 2016

Executive Summary Fiscal Year 2017
7
All Public Private Proprietary
South Dakota 11.70% 7.60% 6.20% 21.30%Nation 12.10% 12.00% 7.20% 16.20%SD State Rank 25 7 23 50
2011 2012 2013 AveragePrivate 6.90% 6.30% 5.20% 6.20%Proprietary 21.00% 20.10% 22.90% 21.30%Regental 6.30% 6.10% 5.70% 6.10%Technical 13.80% 11.50% 10.60% 12.00%
Total 11.50% 11.20% 12.30% 11.70%
1.8 Graduates of four-year college
1.6
1.4
1.2 People with some college
1.0
1975 1980 1985 1990 1995 2000 2005 2010 2013
Average Loan Default Rates for Institutions in the United States
Higher Education Enables Financial Responsibility
South Dakota Postsecondary Institution Loan Default Rates for 2011-2013
Another example of how higher education benfi ts South Dakota is that our college graduates are more fi nancially secure. Graduates from South Dakota public universities have consistently exhibited low default rates on their student loans. The table below shows that South Dakota’s public institutions has a much lower student loan default rate than the rest of the nation.
2011-2013 (3-Year Average)
Rising Value of a College DegreeThe pay of people with a four-year college degree has risen compared to those with a high school degree but no college credit. The relative pay of people who attended college without earning a four-year degree has stayed fl at.
Ratio of average hourly pay, compared with pay of people with a high school degree
Note: Labels refl ect group's highest level of education. "Graduates of 4-year college," for instance, excludes people with graduate degrees. High school graduates are used as the base line in this graph.
Source: Recreated from New York Times analysis of Economic Policy Institute data
College Is Worth It

Board Member Biographies Fiscal Year 2017
8
Bob Sutton, Vice President, Sioux Falls, holds a bachelor’s degree in political science and a master’s degree in public administration, both from the University of South Dakota. He is currently the executive vice president of human resources for Avera Health. He previously served as regional president and CEO of Avera St. Mary’s Hospital in Pierre, president of the South Dakota Community Foundation, president of the South Dakota Bankers Association, and executive director of the South Dakota Association of County Offi cials. Sutton has served as the chairman of the South Dakota Housing Development Authority, South Dakotans for the Arts, and as a board member of Junior Achievement of South Dakota. Appointed by Governor Daugaard in 2013, his term will expire in 2019.
John W. Bastian, Belle Fourche, holds a bachelor’s degree in political science from South Dakota State University and a J.D. degree from Hamline University School of Law. He was a circuit court judge for the Fourth Judicial Circuit for 20 years and retired in 2013. Prior to that service, he spent 10 years in the attorney general’s offi ce as an appellate attorney and prosecutor. Bastian is also a veteran of the United States Air Force. He serves part-time with the South Dakota Unifi ed Judicial System and is assigned to preside over cases in the Fourth, Sixth and Seventh Judicial Circuits. Appointed by Governor Daugaard in 2014 to complete the term of the late Randy Morris, his second term will expire in 2022.
Conrad Adam, Pierre, is a fi nance major at the University of South Dakota, with a minor in accounting. He currently serves as a Dean’s Ambassador at the Beacom School of Business. Previously, he has held internships with the South Dakota Bureau of Finance & Management and the South Dakota Community Foundation. He is fi nance chair for Dakotathon, the largest philanthropy event on the USD campus, supporting Children’s Miracle Network. Regent Adam is a public speaker who shares his history of childhood cancer survivorship, advocating for pediatric cancer research and fundraising. In his free time, he enjoys organizing and volunteering at charity events, traveling, and spending time with family and friends. Appointed by Governor Daugaard in 2016, his term will expire in 2018.
South Dakota Board of Regents
Randy Schaefer, President, Madison, is a 1984 Dakota State University graduate with a bachelor’s degree in education. He is a State Farm Insurance agent in Madison where he has achieved many accomplishments, including Agency Masters Club and Chairman’s Circle. He is an active member of Madison’s Chamber of Commerce and the Lake Area Development Association. Schaefer currently serves on the DSU Foundation Board of Trustees and is active in supporting local and area schools and their students. Appointed by Governor Rounds in 2009, his term will expire in 2021.
Kevin Schieffer, Secretary, Sioux Falls, holds a bachelor’s degree from the University of South Dakota and is a graduate of Georgetown University School of Law, where he also served as an adjunct professor of law. He is a business consultant in Sioux Falls and retired in 2008 after 12 years as chief executive offi cer of Cedar American Rail Holdings Inc., the largest regional railroad system in the U.S. He was appointed as United States attorney for South Dakota by President George H.W. Bush in 1991. He has engaged in the private practice of law and served as chief of staff to former U.S. Sen. Larry Pressler from 1982 to 1991. Appointed by Governor Daugaard in 2013, his term will expire in 2021.

Fiscal Year 2017
9
Board Member Biographies
Harvey C. Jewett, Aberdeen, earned a B.A. and a J.D. from the University of South Dakota. He is currently president and chief operating offi cer of The Rivett Group, L.L.C.; a partner in the law fi rm of Siegel, Barnett, and Schutz. He ha served as the president and chair of the Great Plains Education Foundation since its founding in 1999. He was the president and chair of Jewett Wholesale Drug Co. from 1975 through 2008. Jewett has served on the boards of the Education Assistance Corporation, Student Loan Finance Corporation, the USD Law School Foundation, Great Plains Education Foundation, Norwest Bank South Dakota, Children’s Home Society, and Super 8 Motels, Inc. where he served as president for many years. He also served for 20 years on the Board of Trustees of the College of St. Benedict in St. Joseph, MN. He served there as the chair of the Audit Committee, including chairing the Joint Audit Committee of St. Benedict and University of St. John’s of Collegeville, MN. Regent Jewett was appointed in 1997 by Governor Janklow and reappointed in 1999. Regent Jewett was reappointed by Governor Rounds in 2005 and again by Governor Daugaard in 2001. His term will expire in 2017. Regent Jewett served as president of the Regents from 1999-2009.
Pam Roberts, Pierre, holds a bachelor’s degree in commercial economics from South Dakota State University. She retired in 2013 after a career in senior leadership roles, including Secretary of Labor, Commissioner of Personnel, and Chief of Operations, in the administrations of governors Janklow, Mickelson, Miller, Rounds, and Daugaard. Roberts and her husband, Clay, operate their family’s ranch in Stanley and Lyman counties. Appointed by Governor Daugaard in 2016, her term will expire in 2022.
Michael G. Rush, Executive Director and CEO, Pierre, was appointed by the South Dakota Board of Regents to his post in May 2015. Dr. Rush previously was executive director of the Idaho State Board of Education/Board of Regents. He served as that state’s higher education executive offi cer from 2007 to 2015, supporting a board that governs Idaho’s higher education institutions and also has general supervision over all public education, including community colleges. Prior to his time as executive director of Idaho’s state board, Dr. Rush served as an administrator, director of research, and state supervisor for the Division of Professional-Technical Education, also in Idaho. He has experience as an assistant professor of agricultural and Extension education at The Pennsylvania State University, as an instructor of vocational and technical education at Virginia Polytechnic Institute and State University, and as a secondary vocational agriculture instructor. Rush is active professionally at the state and national levels, serving on the executive committee for the State Higher Education Executive Offi cers (SHEEO) and as chair of the Western Interstate Commission for Higher Education. He also represented United States higher education at three international conferences.
Kathryn Johnson, Hill City, is the owner of Johnson Environmental Concepts of Rapid City. She holds a B.S. in chemistry from Black Hills State University, an M.S. in chemistry from Iowa State University, and a Ph.D. in geology from South Dakota School of Mines and Technology. She currently serves on the Research & Commercialization Council. She was federally appointed to the Congressional Commission on the Advancement of Women and Minorities in Science, Engineering and Technology, and is a member of the National Research Council Committee on Women in Science & Engineering. She was a 1997 Bush Foundation Leadership Fellow and is a member of the American Chemical Society, Geochemical and Environmental Sections; South Dakota Association of Environmental Professionals; and the Environmental Assessment Association. Appointed by Governor Rounds in 2005, her current term will expire in 2017. Regent Johnson served as president of the Regents from 2011-2013.
Jim Morgan, Brookings, retired in 2013 after 12 years as president and CEO of Daktronics, concluding a four-decade career at the Brookings-based electronics manufacturer, which is the world’s industry leader in designing and manufacturing electronic scoreboards, programmable display systems, and large-screen video displays. He joined Daktronics in the company’s fi rst year of operation as its fi rst design engineer, while still a college student. He remains on the company’s board of directors. Morgan is a graduate of South Dakota State University, where he earned both his B.S. and M.S. degrees in electrical engineering. Appointed by Governor Daugaard in 2015, his term will expire in 2021.

Missions of the Universities and Special Schools Fiscal Year 2017
10
Black Hills State University – Tom Jackson Jr., PresidentBlack Hills State University provides associate and baccalaureate degree programs in the liberal arts and sciences, education (SDCL 13-59-1), business, and technology. BHSU offers master’s degree programs in education, business services, and science. The BHSU Center for Indian Studies (SDCL 13-59-2.1) provides opportunities to research and study the history, culture, and language of the Indians of North America and South Dakota. BHSU supports the Center of Excellence in Mathematics and Science Education.
Dakota State University – José-Marie Griffi ths, PresidentDakota State University provides associate and baccalaureate degrees in computer science related programs, business, respiratory care, education and exercise science. The education programs are intended to prepare elementary, secondary, and special education teachers with expertise in the useof technology in teaching and learning (SDCL 13-59-2.2). DSU also provides master’s degrees in computer science, business and educational technology and doctorates in information systems and cyber security. The National Security Agency has designated Dakota State University as a Center of Excellence in Cyber Operations and the university houses the Center for the Advancement of Health Information Technology.
Northern State University – Timothy M. Downs, PresidentNorthern State University provides associate and baccalaureate degree programs in the liberal arts and sciences, education (SDCL 13-59-1), business and international business, and technology. NSU offers master’s degree programs in education and banking. Distance delivery technology is a core mission in all degree programs, especially all levels of teacher preparation. NSU is home to the Center for Statewide E-Learning.
South Dakota School of Mines and Technology – Heather Wilson, PresidentSouth Dakota School of Mines and Technology offers graduate and undergraduate programs in engineering and the sciences (SDCL 13-60-1) to promote excellence in teaching and learning, to support research, scholarly and creative activities, and to provide service to the state of South Dakota, the region, and the nation. The South Dakota School of Mines and Technology is the technological university within the South Dakota System of Higher Education.
Missions of the Universities and Special Schools Fiscal Year 2017
11
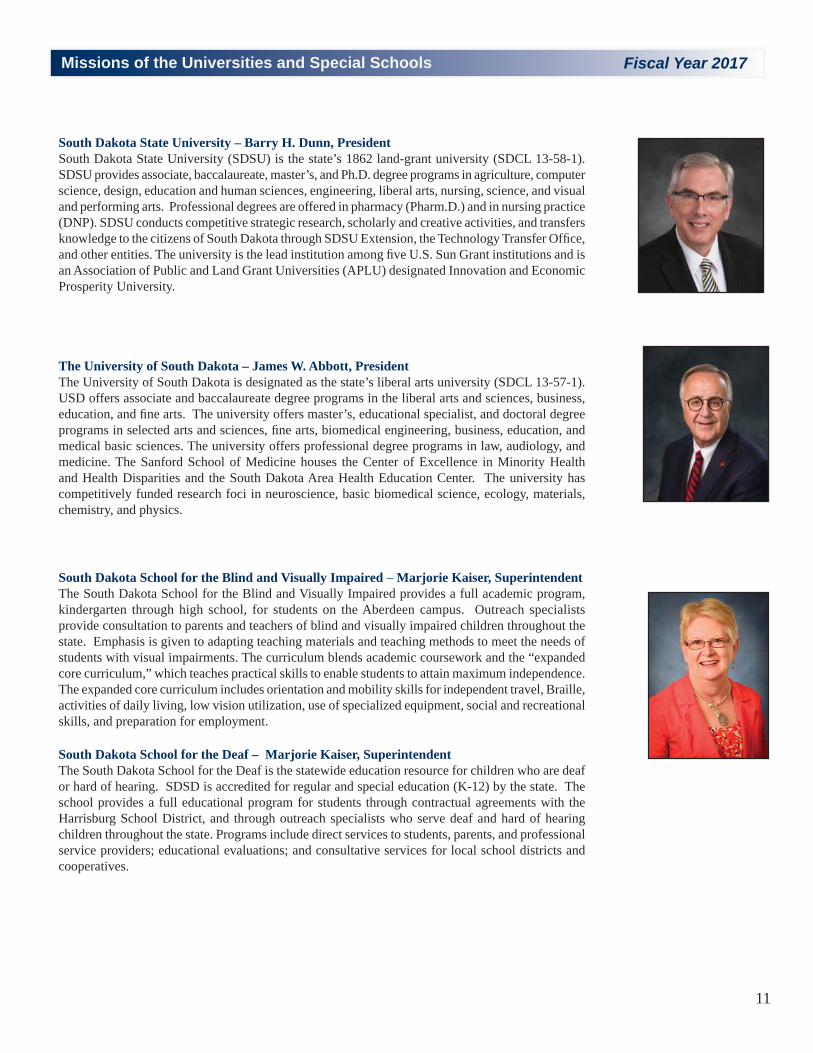
South Dakota State University – Barry H. Dunn, PresidentSouth Dakota State University (SDSU) is the state’s 1862 land-grant university (SDCL 13-58-1). SDSU provides associate, baccalaureate, master’s, and Ph.D. degree programs in agriculture, computer science, design, education and human sciences, engineering, liberal arts, nursing, science, and visual and performing arts. Professional degrees are offered in pharmacy (Pharm.D.) and in nursing practice (DNP). SDSU conducts competitive strategic research, scholarly and creative activities, and transfers knowledge to the citizens of South Dakota through SDSU Extension, the Technology Transfer Offi ce, and other entities. The university is the lead institution among fi ve U.S. Sun Grant institutions and is an Association of Public and Land Grant Universities (APLU) designated Innovation and Economic Prosperity University.
The University of South Dakota – James W. Abbott, PresidentThe University of South Dakota is designated as the state’s liberal arts university (SDCL 13-57-1). USD offers associate and baccalaureate degree programs in the liberal arts and sciences, business, education, and fi ne arts. The university offers master’s, educational specialist, and doctoral degree programs in selected arts and sciences, fi ne arts, biomedical engineering, business, education, and medical basic sciences. The university offers professional degree programs in law, audiology, and medicine. The Sanford School of Medicine houses the Center of Excellence in Minority Health and Health Disparities and the South Dakota Area Health Education Center. The university has competitively funded research foci in neuroscience, basic biomedical science, ecology, materials, chemistry, and physics.
South Dakota School for the Blind and Visually Impaired – Marjorie Kaiser, SuperintendentThe South Dakota School for the Blind and Visually Impaired provides a full academic program, kindergarten through high school, for students on the Aberdeen campus. Outreach specialists provide consultation to parents and teachers of blind and visually impaired children throughout the state. Emphasis is given to adapting teaching materials and teaching methods to meet the needs of students with visual impairments. The curriculum blends academic coursework and the “expanded core curriculum,” which teaches practical skills to enable students to attain maximum independence. The expanded core curriculum includes orientation and mobility skills for independent travel, Braille, activities of daily living, low vision utilization, use of specialized equipment, social and recreational skills, and preparation for employment.
South Dakota School for the Deaf – Marjorie Kaiser, SuperintendentThe South Dakota School for the Deaf is the statewide education resource for children who are deaf or hard of hearing. SDSD is accredited for regular and special education (K-12) by the state. The school provides a full educational program for students through contractual agreements with the Harrisburg School District, and through outreach specialists who serve deaf and hard of hearing children throughout the state. Programs include direct services to students, parents, and professional service providers; educational evaluations; and consultative services for local school districts and cooperatives.

Enrollments, High School Preparation, and Degrees Conferred Fiscal Year 2017
12
Enrollments are as of fall census date. On-campus enrollments are supported by appropriations from the general fund and on-campus tuition, and includes all nursing enrollments. Off-campus courses are supported by tuition paid at the higher off-campus tuition rate, and includes all remedial enrollments. Students who enrolled in both on-campus and off-campus courses are included in each section. Students enrolled in more than one university appear in each university’s column. The total section is unduplicated by school – a student enrolled in both on-campus and off-campus courses is counted only once for each school. Thus, the column in NOT the sum of the university columns because each student is counted only once. Students registered for zero credit hours because they were using services related to a degree in progress are included.
BHSU DSU NSU SDSMT SDSU USD System %Change
2007 2,636 1,333 1,877 2,031 10,040 7,253 25,1702008 2,601 1,368 2,030 2,035 10,198 7,033 25,265 0.38%2009 2,579 1,315 1,935 2,147 10,458 7,028 25,462 0.78%2010 2,729 1,384 1,978 2,323 10,828 7,167 26,409 3.72%2011 2,552 1,378 1,992 2,286 10,928 6,962 26,098 -1.18%2012 2,451 1,333 1,907 2,369 10,583 6,837 25,480 -2.37%2013 2,412 1,332 1,837 2,587 10,686 6,962 25,816 1.32%2014 2,215 1,290 1,748 2,740 10,744 6,899 25,636 -0.70%2015 2,162 1,381 1,638 2,760 10,676 6,893 25,510 -0.49%2016 2,088 1,339 1,530 2,749 10,685 6,736 25,127 -1.50%
BHSU DSU NSU SDSMT SDSU USD System %Change
2007 1,878 1,385 865 71 2,454 2,911 9,5642008 1,929 1,570 1,008 57 2,644 3,192 10,400 8.74%2009 2,143 2,017 1,008 70 3,877 3,849 12,964 24.65%2010 2,779 2,161 1,713 132 4,305 4,354 15,444 19.13%2011 2,644 2,250 2,089 79 4,639 4,529 16,230 5.09%2012 2,720 2,303 2,231 132 4,922 4,972 17,280 6.47%2013 2,867 2,339 2,064 150 4,923 4,841 17,184 -0.56%2014 3,117 2,256 2,390 152 4,765 4,845 17,525 1.98%2015 3,115 2,381 2,326 197 5,153 4,804 17,976 4.61%2016 3,036 2,394 2,570 183 5,182 5,167 18,532 5.75%
BHSU DSU NSU SDSMT SDSU USD System %Change
2007 4,004 2,570 2,555 2,070 11,706 9,243 32,1482008 4,011 2,780 2,805 2,061 11,995 9,291 32,943 2.47%2009 4,076 2,861 2,672 2,177 12,376 9,617 33,779 2.54%2010 4,722 3,101 3,296 2,354 12,816 10,151 36,440 7.88%2011 4,415 3,102 3,580 2,311 12,725 9,970 36,103 -0.92%2012 4,407 3,110 3,622 2,424 12,583 10,284 36,430 0.91%2013 4,464 3,129 3,343 2,640 12,554 10,235 36,365 -0.18%2014 4,489 3,047 3,580 2,798 12,557 10,061 36,532 0.46%2015 4,395 3,145 3,496 2,843 12,589 9,971 36,439 -0.25%2016 4,244 3,190 3,587 2,859 12,613 10,038 36,531 0.25%
Historical Fall HeadcountFall On-Campus Headcount Enrollment
Fall Off-Campus Headcount Enrollment
Fall Total Headcount Enrollment
Source: Regents Information Systems
Enrollments, High School Preparation, and Degrees ConferredEnrollments, High School Preparation, and Degrees Conferred Fiscal Year 2017
13
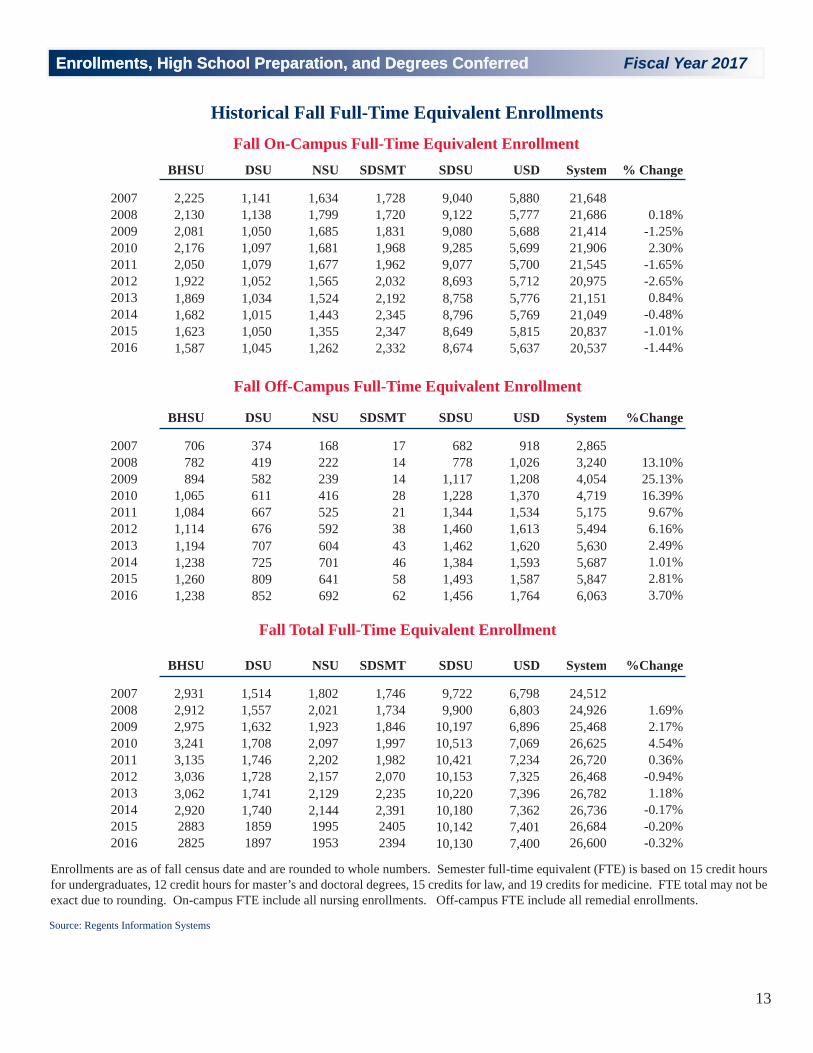
BHSU DSU NSU SDSMT SDSU USD System % Change
2007 2,225 1,141 1,634 1,728 9,040 5,880 21,6482008 2,130 1,138 1,799 1,720 9,122 5,777 21,686 0.18%2009 2,081 1,050 1,685 1,831 9,080 5,688 21,414 -1.25%2010 2,176 1,097 1,681 1,968 9,285 5,699 21,906 2.30%2011 2,050 1,079 1,677 1,962 9,077 5,700 21,545 -1.65%2012 1,922 1,052 1,565 2,032 8,693 5,712 20,975 -2.65%2013 1,869 1,034 1,524 2,192 8,758 5,776 21,151 0.84%2014 1,682 1,015 1,443 2,345 8,796 5,769 21,049 -0.48%2015 1,623 1,050 1,355 2,347 8,649 5,815 20,837 -1.01%2016 1,587 1,045 1,262 2,332 8,674 5,637 20,537 -1.44%
BHSU DSU NSU SDSMT SDSU USD System %Change
2007 706 374 168 17 682 918 2,8652008 782 419 222 14 778 1,026 3,240 13.10%2009 894 582 239 14 1,117 1,208 4,054 25.13%2010 1,065 611 416 28 1,228 1,370 4,719 16.39%2011 1,084 667 525 21 1,344 1,534 5,175 9.67%2012 1,114 676 592 38 1,460 1,613 5,494 6.16%2013 1,194 707 604 43 1,462 1,620 5,630 2.49%2014 1,238 725 701 46 1,384 1,593 5,687 1.01%2015 1,260 809 641 58 1,493 1,587 5,847 2.81%2016 1,238 852 692 62 1,456 1,764 6,063 3.70%
BHSU DSU NSU SDSMT SDSU USD System %Change
2007 2,931 1,514 1,802 1,746 9,722 6,798 24,5122008 2,912 1,557 2,021 1,734 9,900 6,803 24,926 1.69%2009 2,975 1,632 1,923 1,846 10,197 6,896 25,468 2.17%2010 3,241 1,708 2,097 1,997 10,513 7,069 26,625 4.54%2011 3,135 1,746 2,202 1,982 10,421 7,234 26,720 0.36%2012 3,036 1,728 2,157 2,070 10,153 7,325 26,468 -0.94%2013 3,062 1,741 2,129 2,235 10,220 7,396 26,782 1.18%2014 2,920 1,740 2,144 2,391 10,180 7,362 26,736 -0.17%2015 2883 1859 1995 2405 10,142 7,401 26,684 -0.20%2016 2825 1897 1953 2394 10,130 7,400 26,600 -0.32%
Historical Fall Full-Time Equivalent EnrollmentsFall On-Campus Full-Time Equivalent Enrollment
Fall Off-Campus Full-Time Equivalent Enrollment
Fall Total Full-Time Equivalent Enrollment
Enrollments are as of fall census date and are rounded to whole numbers. Semester full-time equivalent (FTE) is based on 15 credit hours for undergraduates, 12 credit hours for master’s and doctoral degrees, 15 credits for law, and 19 credits for medicine. FTE total may not be exact due to rounding. On-campus FTE include all nursing enrollments. Off-campus FTE include all remedial enrollments.
Source: Regents Information Systems

Enrollments, High School Preparation, and Degrees Conferred Fiscal Year 2017
14
BHSU DSU NSU SDSMT SDSU USDAssociate 2016 HS Grad Freshman 28 1 78 47 79 233 0.64%
Other HS Grad Freshman 87 21 35 61 57 261 0.71%Sophomore 45 24 23 2 33 86 213 0.58%Junior 9 13 3 1 2 31 59 0.16%Senior 7 14 2 1 1 15 40 0.11%
Bachelors Current HS Grad Freshman 450 301 201 452 2,060 1,069 4,533 12.41%Other HS Grad Freshman 421 260 170 149 957 572 2,529 6.92%Sophomore 516 359 284 516 2,076 1,291 5,042 13.80%Junior 503 342 308 517 1,964 1,253 4,887 13.38%Senior 704 590 433 715 2,417 1,696 6,555 17.94%Graduate 207 291 148 357 1,296 1,777 4,076 11.16%NP, JD, PharmD, MD, AUD, PT 420 558 978 2.68%Non-Degree Seeking-UG 1,042 919 1,538 132 1,181 1,351 6,163 16.87%Non-Degree Seeking-GR 225 55 364 17 98 203 962 2.63%
Total Class 4,244 3,190 3,587 2,859 12,613 10,038 36,531
Non Resident 1,054 1,083 820 1,506 5,472 3,476 13,411 36.71%Resident 3,190 2,107 2,767 1,353 7,141 6,562 23,120 63.29%Total Residency 4,244 3,190 3,587 2,859 12,613 10,038 36,531
Female 2,731 1,355 2,134 643 6,704 6,111 19,678 53.87%Male 1,513 1,835 1,453 2,216 5,909 3,927 16,853 46.13%Total Gender 4,244 3,190 3,587 2,859 12,613 10,038 36,531
17 AND YOUNGER 341 128 722 72 458 584 2,305 6.31%18-23 2,432 1,847 1,851 2,063 9,085 5,566 22,844 62.53%24-29 555 457 286 235 765 715 3,013 8.25%30-39 311 295 129 96 361 439 1,631 4.46%40-49 110 89 50 16 88 137 490 1.34%50 AND OLDER 61 28 37 3 42 59 230 0.63%Unavailable 2 2 0.01%Subtotal 3,812 2,844 3,075 2,485 10,799 7,500 30,515 83.53%18-23 13 51 30 56 472 518 1,140 3.12%24-29 122 95 118 174 784 920 2,213 6.06%30-39 151 97 150 100 375 635 1,508 4.13%40-49 93 70 115 31 128 296 733 2.01%50 AND OLDER 53 33 99 13 55 169 422 1.16%Subtotal 432 346 512 374 1,814 2,538 6,016 16.47%
Total Age 4,244 3,190 3,587 2,859 12,613 10,038 36,531
Nonresident Alien 64 110 197 173 945 289 1,778 4.87%Race/Ethnicity Unknown 131 40 36 22 68 108 405 1.11%Hispanic of Any Race 208 127 98 138 252 324 1,147 3.14%American Indian or Alaska Native 140 28 56 49 120 197 590 1.62%Multi-Racial (where one is AIAN) 122 55 37 40 129 156 539 1.48%Asian 35 70 45 33 134 144 461 1.26%Black or African American 52 157 49 55 247 290 850 2.33%Native Hawaiian or Other Pacific Islander 5 4 3 3 11 9 35 0.10%White 3,433 2,552 3,035 2,292 10,568 8,390 30,270 82.86%Multi-Racial 54 47 31 54 139 131 456 1.25%Total Ethnic Origin 4,244 3,190 3,587 2,859 12,613 10,038 36,531
SystemPercent
Campus System Total
Associate, Bachelors &UG Non-Degree Seeking
Graduate, First Professional & GR Non-Degree Seeking
Age
Classification
Ethnic Origin
Gender
Residency
Student Profi le by University Fall 2016 Total Enrollment
Source: Regents Information Systems Census Date Extract

Enrollments, High School Preparation, and Degrees ConferredEnrollments, High School Preparation, and Degrees Conferred Fiscal Year 2017
15
High School Dual Credit
Note: Enrollment counts represent the total number of courses students are enrolled in during a given semester. Headcount signifi es the number of unduplicated students enrolled in any given term across one of the six Regental institutions.
High School Dual Credit Course Enrollments by Semester Type
High School Dual Credit Course Enrollments by Semester & Campus
During the 2014 session, the Legislature supported Governor Daugaard’s budget request to provide base funding to offer reduced tuition dual credit courses in South Dakota through the “High School Dual Credit Program.” Students have the opportunity to enroll in coursework that meets the System General Education requirements at all six Regental institutions at the rate of $48.33 per credit hour. These courses are offered face-to-face at the on-campus locations and via distance, as well as at the three University Center locations. Starting with the Fall 2014 semester, current high school juniors and seniors enrolled at public, private and tribal high schools whose schools have signed an MOU with the South Dakota Department of Education (DOE) are eligible to enroll.
High School Dual Credit Unduplicated Headcount by Semester Type
1,333
2,173
2,590
1,632
2,307
352
371
0
500
1,000
1,500
2,000
2,500
3,000
2014 2015 2016
Fall Enrollments
Spring Enrollments
Summer Enrollments
855
1,510
1,743
1,203
1,514
255 283
-
500
1,000
1,500
2,000
2014 2015 2016
Fall Headcount
Spring Headcount
Summer Headcount
Campus Fall 2014 Spring2015
Summer2015 Fall 2015 Spring
2016Summer
2016 Fall 2016 Total
BHSU 290 295 83 381 305 64 430 1,848DSU 48 136 27 148 110 33 180 682NSU 166 188 47 429 412 43 504 1,789SDSMT 41 36 1 80 52 3 79 292SDSU 202 368 107 499 593 119 562 2,450USD 386 609 87 636 835 109 835 3,497System 1,133 1,632 352 2,173 2,307 371 2,590 10,558

Enrollments, High School Preparation, and Degrees Conferred Fiscal Year 2017
16
High School Students Enrolled in University CoursesFall Terms, 2010-2016 Headcount
Source: Regents Information Systems
High School Graduates and University System Enrollment History
Many high school students are capable of university-level academic work. Completing university-level courses while still in high school may allow students to earn their degrees sooner and thus reduce the cost of higher education. For many high school students, a university course may be the most effi cient use of their time. The students depicted in this table refl ect a mixture of Concurrent and High School Dual Credit (HSDC) enrollments. For instance, of the 2,482 high school students enrolled in Regental courses in Fall 2016, there were 1,743 who were completing coursework through the HSDC program. The remainder would refl ect concurrent credit enrollments taught by qualifi ed high school teachers in the partner school districts.
Source: Regents Information Systems and SD Department of Education
SD High School Graduates1997-2016
University System Enrollment1997-2016
Year BHSU DSU NSU SDSMT SDSU USD System
2010 29 31 177 4 30 20 291 2011 59 37 295 10 35 79 515 2012 67 34 480 9 142 66 798 2013 116 47 489 5 42 22 721 2014 271 91 753 22 179 337 1,653 2015 306 178 766 44 411 499 2,204 2016 369 140 815 57 481 620 2,482
25,719
36,531
20,000
22,000
24,000
26,000
28,000
30,000
32,000
34,000
36,000
38,000
10,008
8,765
7,500
8,000
8,500
9,000
9,500
10,000
10,500
11,000

Enrollments, High School Preparation, and Degrees ConferredEnrollments, High School Preparation, and Degrees Conferred Fiscal Year 2017
17
11,00411,581 12,158
13,05614,050
14,604
0
2,000
4,000
6,000
8,000
10,000
12,000
14,000
16,000
Fall 2011 Fall 2012 Fall 2013 Fall 2014 Fall 2015 Fall 2016
Indicator Fall 2011 Fall 2012 Fall 2013 Fall 2014 Fall 2015 Fall 2016 5-Year ChangeUnduplicated Headcount 11,004 11,581 12,158 13,056 14,050 14,604 32.7%Total Enrollment 19,213 20,011 21,463 22,891 24,634 25,566 33.1%Total Credit Hours 48,276 54,518 58,025 62,411 67,288 70,487 46.0%Sections 1,179 1,197 1,275 1,375 1,394 1,388 17.7%Courses 975 1,038 1,112 1,239 1,246 1,283 31.6%Course Names 676 703 767 826 838 860 27.2%
Distance Education In 2000, SDBOR initiated the Electronic University Consortium (EUC) for the purpose of coordinating a statewide system of distance course offerings. The university system’s distance delivery initiative is intended to expand the availability of educational opportunities to the state’s population of place-bound, adult, and otherwise non-traditional learners. The system offers students the opportunity to pursue coursework (and entire degree programs) through a variety of delivery mechanisms, including but not limited to the internet, DDN, and personal correspondence.
The human footprint of the university system’s distance education offerings is large and continues to grow. A range of measures – from student participation to course offerings – have shown evidence of strong growth in recent years. Looking at data from the most recent fall term, it can be seen that distance education had another year of robust expansion in Fall 2016. There was growth in unduplicated headcount, total course enrollment, credit hours, and the number of courses offered, all while slightly reducing the number of sections offered for greater effi ciency. In all, more than14,600 students enrolled in at least one distance course in Fall 2016.
Source: Regents Information Systems
Major Performance Indicators
Students Enrolled in a Distance Course, Five Year Trend
Note: Unduplicated Headcount refl ects the number of unique student IDs each fall term; students are included in headcount tallies on the basis that they enrolled in at least one course delivered off-campus. Total Enrollment indicates the sum of all enrolled students for a given fall term, and Total Credit Hours summarizes the credit hours taken by these students. Sections fi gures represent a tally of total sections (including all cross-listed sections) offered by the university system in a given fall term; duplicate sections among sets of cross-listed sections are removed to compute Courses. Course Names fi gures are derived using section data that remained following the removal of duplicate section names; each course name is counted only once per fall term.

Enrollments, High School Preparation, and Degrees Conferred Fiscal Year 2017
18
1,857 1,9052,072 2,113 2,172
2,3372,481
2,642 2,714 2,756 2,7852,643
3,085 3,092 3,2113,418
3,7023,900
4,2074,496
4,326
4,708 4,644
4,210
0
500
1,000
1,500
2,000
2,500
3,000
3,500
4,000
4,500
5,000
2005 2006 2007 2008 2009 2010 2011 2012 2013 2014 2015 2016
# of Candidates # of AP Exams Taken
Advanced Placement® Exams in South Dakota
The Advanced Placement® (AP) program administered by The College Board offers high school students a chance to take courses that are equivalent to fi rst-year college courses. Following instruction in special AP classes, honors classes, or independent study, the students can take examinations that demonstrate they have obtained the knowledge and skills of comparable college courses. When those students later enroll in a college or university that accepts AP credit, they can present their AP scores. Currently, all South Dakota public universities award credit for acceptable exam scores. The chart below shows the number of high school students taking AP exams and the number of exams taken in 2005 through 2016.
Annual AP Program Participation for South Dakota
Source: College Board
Number of AP Examinations with Scores of 3, 4, or 5
Note: Data reported for all students from South Dakota public school systems. A score of 3, 4, or 5 on an AP exam qualifi es students for college credit at South Dakota public universities.
Source: College Board
1,825 1,902 1,948 2,071 2,373 2,486
2,859 2,964 2,827
3,185 2,994 2,859
3,085 3,092 3,2113,418
3,7023,900
4,2074,496
4,326
4,708 4,644
4,210
-
500
1,000
1,500
2,000
2,500
3,000
3,500
4,000
4,500
5,000
2005 2006 2007 2008 2009 2010 2011 2012 2013 2014 2015 2016
# of AP Exams with Grades 3, 4, or 5 # of AP Exams Taken

Enrollments, High School Preparation, and Degrees ConferredEnrollments, High School Preparation, and Degrees Conferred Fiscal Year 2017
19
ACT - American College Testing
The ACT Assessment is comprised of four curriculum-based achievement tests designed to assess critical reasoning and higher-order thinking skills in English, mathematics, reading, and science. These tests refl ect students’ skills and achievement levels as products of their high school experience and serve as critical measures of their preparation for academic coursework beyond high school. ACT Assessment results are used by postsecondary institutions across the nation for admissions, academic advising, course placement, and scholarship decisions. The academic preparation a student receives in high school correlates with success in college. ACT research indicates that students who prepare academically by taking a core high school program consistently score higher on the ACT Assessment than those who do not. ACT Core consists of: English, 4 years; Social Sciences, 3 years; Mathematics, 3 years; Natural Science, 3 years.
Note: Completion of the ACT high school core is based on student reports of the courses they had completed or planned to complete.
Sources: ACT Assessment 2016
Distribution of ACT Composite Scores, U.S. & South Dakota2016 High School Graduates
SD High School Graduates with ACT ScoresACT Mean by Completion of Core
Source: ACT Assessment 2016
South DakotaACT Number Percent Cum %28 - 36 891 13.6% 14%24 - 27 1,541 23.5% 37%21 - 23 1,416 21.6% 59%18 - 20 1,507 23.0% 82%< 18 1,197 18.3% 100%Total 6,552 100.0%
United StatesACT Number Percent Cum %28 - 36 286,055 13.7% 14%24 - 27 359,683 17.2% 31%21 - 23 368,329 17.6% 49%18 - 20 404,611 19.4% 68%< 18 671,664 32.1% 100%Total 2,090,342 100.0%
Completed ACT High School CoreSchoolYear
H.S.Grads
Gradsw/ACT#
Percentw/ACT N
% of Grads
% of ACT
MeanACT N
% of Grads
% of ACT
MeanACT
2001-02 9,770 7,341 75% 4,465 46% 61% 22.4 2,646 27% 36% 19.92002-03 9,554 7,327 77% 4,427 46% 60% 22.4 2,626 27% 36% 19.92003-04 9,940 7,408 75% 4,383 44% 59% 22.6 2,723 27% 37% 19.92004-05 9,356 7,170 77% 4,383 47% 61% 22.5 2,659 28% 37% 19.92005-06 9,353 6,807 73% 3,949 42% 58% 22.8 2,435 26% 36% 20.22006-07 9,244 6,975 75% 4,041 44% 58% 22.9 2,223 24% 32% 20.02007-08 9,136 6,959 76% 4,742 52% 68% 22.8 1,891 21% 27% 19.82008-09 8,802 6,676 76% 5,144 58% 77% 22.0 1,448 16% 22% 19.42009-10 8,697 6,871 79% 5,890 68% 86% 22.3 895 10% 13% 18.72010-11 8,929 6,983 78% 6,025 67% 86% 22.4 874 10% 13% 18.72011-12 8,955 6,878 77% 5,995 67% 87% 22.3 835 9% 12% 18.72012-13 8,887 6,723 76% 5,877 66% 87% 22.3 761 9% 11% 19.22013-14 8,974 6,724 75% 5,952 66% 89% 22.3 688 8% 10% 19.62014-15 8,802 6,615 75% 5,835 66% 88% 22.3 687 8% 10% 19.32015-16 8,765 6,552 75% 5,714 65% 87% 22.3 729 8% 11% 19.3
High School Grads Less than ACT Core
Enrollments, High School Preparation, and Degrees Conferred Fiscal Year 2017
20
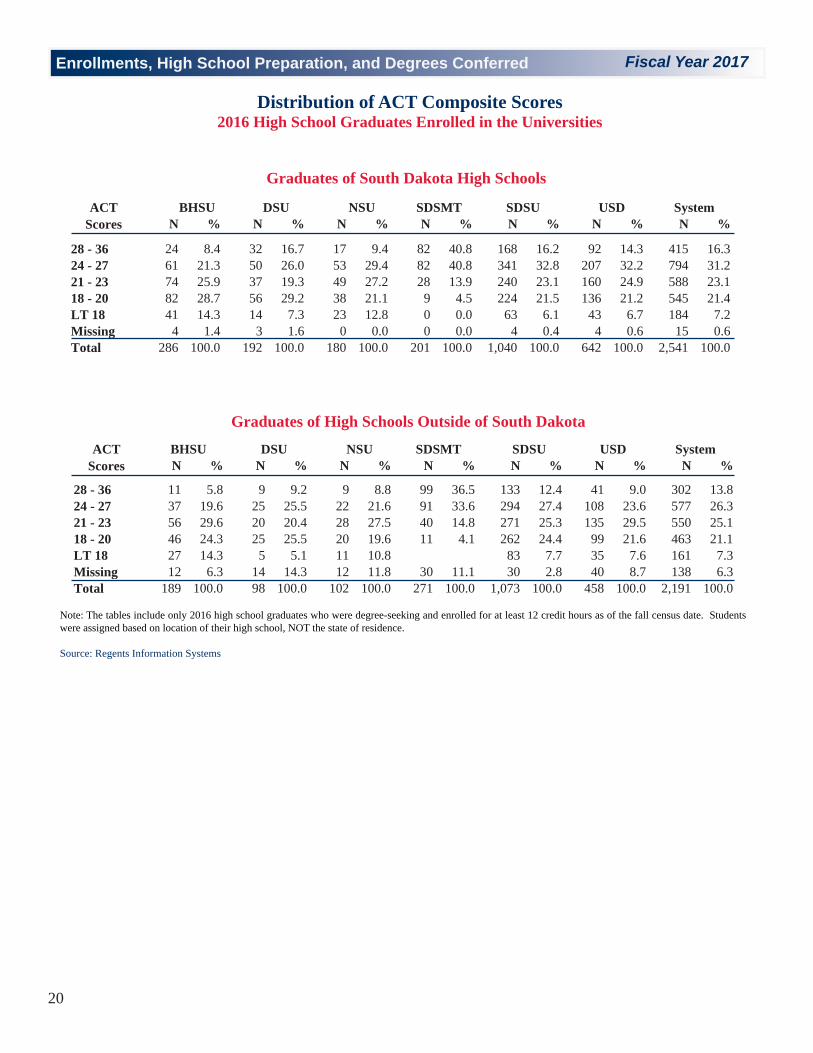
Distribution of ACT Composite Scores 2016 High School Graduates Enrolled in the Universities
Note: The tables include only 2016 high school graduates who were degree-seeking and enrolled for at least 12 credit hours as of the fall census date. Students were assigned based on location of their high school, NOT the state of residence.
Source: Regents Information Systems
Graduates of South Dakota High Schools
Graduates of High Schools Outside of South Dakota
N % N % N % N % N % N % N %
28 - 36 24 8.4 32 16.7 17 9.4 82 40.8 168 16.2 92 14.3 415 16.324 - 27 61 21.3 50 26.0 53 29.4 82 40.8 341 32.8 207 32.2 794 31.221 - 23 74 25.9 37 19.3 49 27.2 28 13.9 240 23.1 160 24.9 588 23.118 - 20 82 28.7 56 29.2 38 21.1 9 4.5 224 21.5 136 21.2 545 21.4LT 18 41 14.3 14 7.3 23 12.8 0 0.0 63 6.1 43 6.7 184 7.2Missing 4 1.4 3 1.6 0 0.0 0 0.0 4 0.4 4 0.6 15 0.6Total 286 100.0 192 100.0 180 100.0 201 100.0 1,040 100.0 642 100.0 2,541 100.0
NSU SDSMT SDSU USD SystemACTScores
BHSU DSU
N % N % N % N % N % N % N %
28 - 36 11 5.8 9 9.2 9 8.8 99 36.5 133 12.4 41 9.0 302 13.824 - 27 37 19.6 25 25.5 22 21.6 91 33.6 294 27.4 108 23.6 577 26.321 - 23 56 29.6 20 20.4 28 27.5 40 14.8 271 25.3 135 29.5 550 25.118 - 20 46 24.3 25 25.5 20 19.6 11 4.1 262 24.4 99 21.6 463 21.1LT 18 27 14.3 5 5.1 11 10.8 83 7.7 35 7.6 161 7.3Missing 12 6.3 14 14.3 12 11.8 30 11.1 30 2.8 40 8.7 138 6.3Total 189 100.0 98 100.0 102 100.0 271 100.0 1,073 100.0 458 100.0 2,191 100.0
SDSU USD SystemACTScores
BHSU DSU NSU SDSMT

Enrollments, High School Preparation, and Degrees ConferredEnrollments, High School Preparation, and Degrees Conferred Fiscal Year 2017
21
Educational Improvement
Graduate and Enrollment Growth Since FY2005
Change in SD High School Graduates vs. Change in SD High School Graduates Entering Regental System
* Indicates that the university system has produced an average of 846 more graduates over the last decade than would have been the case had the system rate held constant at FY2005 production levels.
To stress the importance of expanding educational access and improving student outcomes, the Board of Regents identifi ed “Student Success” as the university system’s foremost priority in its 2014 strategic plan. This goal is driven by fi ve focus areas: 1) growing the number of undergraduate and graduate degrees awarded; 2) increasing the number of degrees awarded to American Indian students; 3) improving fi rst-year retention rates; 4) improving four-year and six-year graduation rates; and 5) reducing the percentage of entering students requiring remediation. Over the last decade, the number of South Dakota high school graduates has continued to decline. A total of 968 fewer students graduated from in-state school districts in 2015 than in 2003, resulting in an average decline of 660 students (from the base year) over this period. Despite these declines, the number of students entering the regental system has remained relatively unchanged. For example, only 108 fewer students enrolled in the regental system in 2015 than in 2003 despite a drop of 968 high school graduates over the same period.
Regental Institutions FY05 FY06 FY07 FY08 FY09 FY10 FY11 FY12 FY13 FY14 FY15 FY16%
GrowthFall FTE Enrollment 23,534 24,089 24,144 24,512 24,926 25,468 26,625 26,720 26,468 26,782 26,736 26,600 13%
Grads - Associate 387 398 452 401 423 419 432 413 485 461 282 230 -40%Grads - Bachelor 3,237 3,330 3,463 3,606 3,798 3,656 3,831 3,994 4,317 4,252 4,364 4,716 45%Grades - Graduate 1,261 1,192 1,168 1,269 1,236 1,285 1,336 1,451 1,553 1,459 1,700 1,668 32%Total 4,885 4,920 5,083 5,276 5,457 5,360 5,599 5,858 6,355 5,172 6,345 6,614 35%
Graduate Growth - 35 198 391 572 475 714 973 1,470 1,287 1,460 1,729 846
-216 -330 -376-471 -526
-634
-1087-847
-780-883
-796
-968
173 133 102 98123 107
53 25758
123
-34-108
-1400
-1000
-600
-200
200
600
FY04 FY05 FY06 FY07 FY08 FY09 FY10 FY11 FY12 FY13 FY14 FY15
SD Graduates Entered Regental
In addition, the table below illustrates the university system’s continued growth in degree completions. Altogether, more than 1,700 more degrees were awarded in FY2016 than in FY2005. Because of this growth, the university system has awarded an average of 846 more degrees each year than would have been the case had production levels remained as they were in FY2005. This growth has been achieved as a function of the increased FTE enrollment growth seen during the same time period.
Enrollments, High School Preparation, and Degrees Conferred Fiscal Year 2017
22
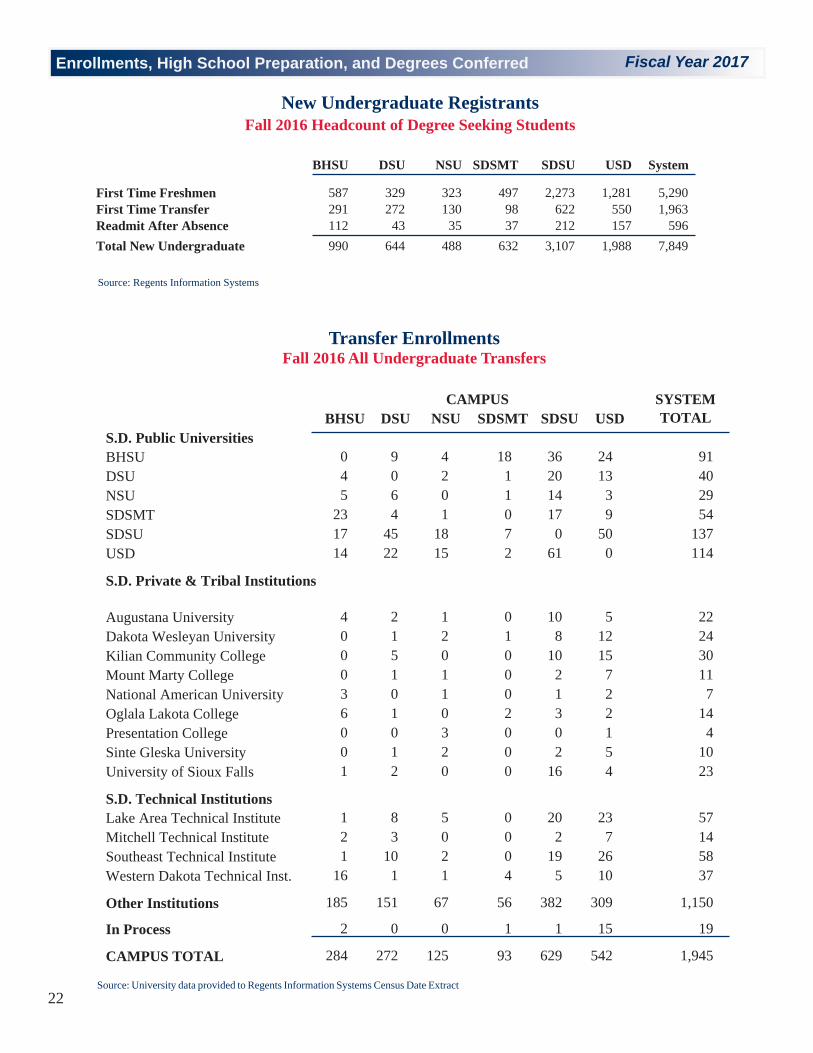
BHSU DSU NSU SDSMT SDSU USDS.D. Public UniversitiesBHSU 0 9 4 18 36 24 91DSU 4 0 2 1 20 13 40NSU 5 6 0 1 14 3 29SDSMT 23 4 1 0 17 9 54SDSU 17 45 18 7 0 50 137USD 14 22 15 2 61 0 114
S.D. Private & Tribal Institutions
Augustana University 4 2 1 0 10 5 22Dakota Wesleyan University 0 1 2 1 8 12 24Kilian Community College 0 5 0 0 10 15 30Mount Marty College 0 1 1 0 2 7 11National American University 3 0 1 0 1 2 7Oglala Lakota College 6 1 0 2 3 2 14Presentation College 0 0 3 0 0 1 4Sinte Gleska University 0 1 2 0 2 5 10University of Sioux Falls 1 2 0 0 16 4 23
S.D. Technical InstitutionsLake Area Technical Institute 1 8 5 0 20 23 57Mitchell Technical Institute 2 3 0 0 2 7 14Southeast Technical Institute 1 10 2 0 19 26 58Western Dakota Technical Inst. 16 1 1 4 5 10 37
Other Institutions 185 151 67 56 382 309 1,150
In Process 2 0 0 1 1 15 19
CAMPUS TOTAL 284 272 125 93 629 542 1,945
CAMPUS SYSTEM TOTAL
Transfer EnrollmentsFall 2016 All Undergraduate Transfers
Source: University data provided to Regents Information Systems Census Date Extract
New Undergraduate RegistrantsFall 2016 Headcount of Degree Seeking Students
Source: Regents Information Systems
BHSU DSU NSU SDSMT SDSU USD System
First Time Freshmen 587 329 323 497 2,273 1,281 5,290First Time Transfer 291 272 130 98 622 550 1,963Readmit After Absence 112 43 35 37 212 157 596Total New Undergraduate 990 644 488 632 3,107 1,988 7,849
Enrollments, High School Preparation, and Degrees ConferredEnrollments, High School Preparation, and Degrees Conferred Fiscal Year 2017
23
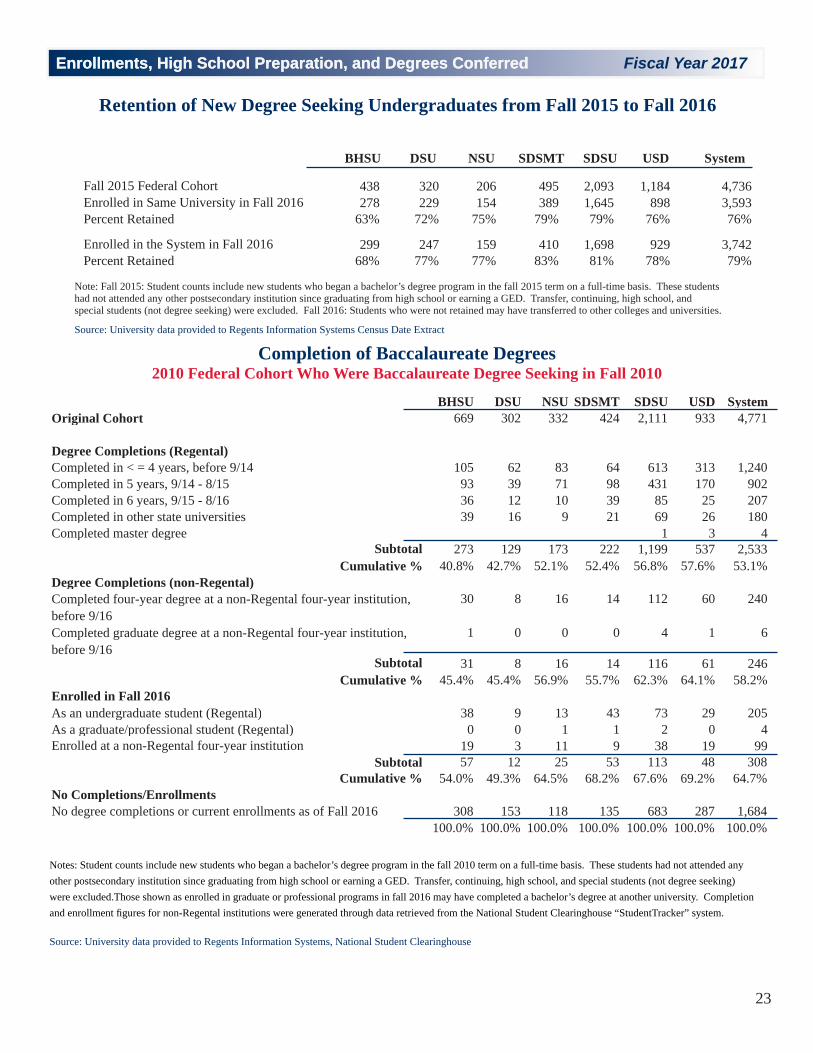
Note: Fall 2015: Student counts include new students who began a bachelor’s degree program in the fall 2015 term on a full-time basis. These students had not attended any other postsecondary institution since graduating from high school or earning a GED. Transfer, continuing, high school, and special students (not degree seeking) were excluded. Fall 2016: Students who were not retained may have transferred to other colleges and universities.
Source: University data provided to Regents Information Systems Census Date Extract
BHSU DSU NSU SDSMT SDSU USD SystemOriginal Cohort 669 302 332 424 2,111 933 4,771
Degree Completions (Regental)Completed in < = 4 years, before 9/14 105 62 83 64 613 313 1,240Completed in 5 years, 9/14 - 8/15 93 39 71 98 431 170 902Completed in 6 years, 9/15 - 8/16 36 12 10 39 85 25 207Completed in other state universities 39 16 9 21 69 26 180Completed master degree 1 3 4
Subtotal 273 129 173 222 1,199 537 2,533Cumulative % 40.8% 42.7% 52.1% 52.4% 56.8% 57.6% 53.1%
Degree Completions (non-Regental)30 8 16 14 112 60 240
1 0 0 0 4 1 6
Subtotal 31 8 16 14 116 61 246Cumulative % 45.4% 45.4% 56.9% 55.7% 62.3% 64.1% 58.2%
Enrolled in Fall 2016As an undergraduate student (Regental) 38 9 13 43 73 29 205As a graduate/professional student (Regental) 0 0 1 1 2 0 4Enrolled at a non-Regental four-year institution 19 3 11 9 38 19 99
Subtotal 57 12 25 53 113 48 308Cumulative % 54.0% 49.3% 64.5% 68.2% 67.6% 69.2% 64.7%
No Completions/EnrollmentsNo degree completions or current enrollments as of Fall 2016 308 153 118 135 683 287 1,684
100.0% 100.0% 100.0% 100.0% 100.0% 100.0% 100.0%
Completed four-year degree at a non-Regental four-year institution, before 9/16Completed graduate degree at a non-Regental four-year institution, before 9/16
Completion of Baccalaureate Degrees2010 Federal Cohort Who Were Baccalaureate Degree Seeking in Fall 2010
Notes: Student counts include new students who began a bachelor’s degree program in the fall 2010 term on a full-time basis. These students had not attended any other postsecondary institution since graduating from high school or earning a GED. Transfer, continuing, high school, and special students (not degree seeking) were excluded.Those shown as enrolled in graduate or professional programs in fall 2016 may have completed a bachelor’s degree at another university. Completion and enrollment fi gures for non-Regental institutions were generated through data retrieved from the National Student Clearinghouse “StudentTracker” system. Source: University data provided to Regents Information Systems, National Student Clearinghouse
Retention of New Degree Seeking Undergraduates from Fall 2015 to Fall 2016
BHSU DSU NSU SDSMT SDSU USD System
Fall 2015 Federal Cohort 438 320 206 495 2,093 1,184 4,736Enrolled in Same University in Fall 2016 278 229 154 389 1,645 898 3,593Percent Retained 63% 72% 75% 79% 79% 76% 76%
Enrolled in the System in Fall 2016 299 247 159 410 1,698 929 3,742Percent Retained 68% 77% 77% 83% 81% 78% 79%

Enrollments, High School Preparation, and Degrees Conferred Fiscal Year 2017
24
Awarded Degrees and Baccalaureate Majors FY16
Source: University data provided to Regents Information Systems
Continued
All Undergraduates BHSU DSU NSU SDSMT SDSU USD SystemHealth Professions 52 66 28 0 539 518 1,203STEM Disciplines 69 154 58 341 341 123 1,086Education & Related 161 49 84 0 180 146 620Social Sciences 105 0 50 0 149 250 554Business and Related 85 46 88 0 138 169 526Humanities & Related 69 23 48 6 245 111 502Agriculture & Related 0 0 0 0 358 0 358Arts/Communication 79 0 34 0 131 83 327Applied Disciplines 13 0 0 0 46 0 59
Total 633 338 390 347 2,127 1,400 5,235
Associate BHSU DSU NSU SDSMT SDSU USD SystemGeneral Studies 24 5 6 6 46 9 96Health Professions 0 35 0 0 0 0 35Biological Sciences 25 0 7 0 0 0 32Agriculture & Related 0 0 0 0 19 0 19Nursing 0 0 0 0 0 16 16Business Management & Related 3 7 4 0 0 0 14Computer Science & Information Systems 0 12 0 0 0 0 12Art & Graphic/Interior Design 0 0 3 0 0 0 3Industrial Technology & Management 3 0 0 0 0 0 3
Total 55 59 20 6 65 25 230
Baccalaureate BHSU DSU NSU SDSMT SDSU USD SystemEducation & Teaching 161 49 84 0 180 146 620Nursing 0 0 0 0 356 233 589Social Sciences 77 0 50 0 149 220 496Business Management & Related 73 36 75 0 138 117 439Engineering 0 0 0 258 129 0 387Health Professions 0 20 5 0 129 210 364Agriculture & Related 0 0 0 0 339 0 339Biological Sciences 34 13 33 10 102 80 272Humanities & Modern Languages 36 18 38 0 71 92 255Health, Fitness, & Recreation 52 11 23 0 54 59 199Computer Science & Information Systems 0 124 5 30 17 11 187Journalism & Communications 44 0 9 0 70 61 184Family & Consumer Sciences 0 0 0 0 108 0 108Art & Graphic/Interior Design 32 0 9 0 52 8 101Accounting 9 3 9 0 0 52 73

Enrollments, High School Preparation, and Degrees ConferredEnrollments, High School Preparation, and Degrees Conferred Fiscal Year 2017
25
Baccalaureate BHSU DSU NSU SDSMT SDSU USD SystemEnvironmental & Atmospheric Sciences 0 0 9 10 51 0 70Public Admin, Health & Human Services 28 0 0 0 0 30 58Industrial Technology & Management 10 0 0 0 46 0 56Chemistry/Biochemistry 1 0 3 10 10 16 40Mathematics 4 4 1 6 16 8 39Music & Theatre 3 0 13 0 9 14 39Earth Sciences, Physics, & Geology 5 1 0 17 6 8 37General Studies 5 0 4 0 20 7 36Ag/Biosystems/Mechanical Engineering 0 0 0 0 10 0 10American Indian Studies 4 0 0 0 0 3 7
Total 578 279 370 341 2,062 1,375 5,005
Master's BHSU DSU NSU SDSMT SDSU USD SystemEducation & Counseling 74 7 72 0 54 73 280Public Admin, Health & Human Services 0 0 0 0 0 123 123Engineering 0 0 0 55 64 1 120Business Management & Related 24 2 3 1 20 68 118Health Professions 0 10 0 0 12 87 109Computer Science & Information Systems 0 82 0 1 13 8 104Education Administration 0 0 7 0 11 52 70Biological Sciences 2 0 0 0 24 11 37Health, Fitness, & Recreation 0 0 9 0 21 4 34Accounting 0 0 0 0 0 31 31Social Sciences 0 0 0 1 17 13 31Humanities & Modern Languages 0 0 0 0 6 18 24Agriculture & Related 0 0 0 0 21 0 21Journalism & Communications 0 0 0 0 11 8 19Industrial Technology & Management 0 0 0 16 0 0 16Chemistry/Biochemistry 0 0 0 0 11 4 15Environmental & Atmospheric Sciences 0 0 0 9 6 0 15Mathematics 0 0 0 0 12 2 14Music & Theatre 0 0 1 0 0 13 14Nursing 0 0 0 0 11 0 11Earth Sciences, Physics, & Geology 0 0 0 7 0 2 9Family & Consumer Sciences 0 0 0 0 9 0 9Ag/Biosystems/Mechanical Engineering 0 0 0 0 8 0 8Art & Graphic/Interior Design 0 0 0 0 0 5 5
Total 100 101 92 90 331 523 1,237
Awarded Degrees and Baccalaureate Majors FY16
Source: University data provided to Regents Information Systems
Continued
Cont.

Enrollments, High School Preparation, and Degrees Conferred Fiscal Year 2017
26
PhD, EdD, Spec, First-Prof Degree BHSU DSU NSU SDSMT SDSU USD System
Education, Administration Specialist 0 0 0 0 0 30 30Counseling & Psychology in Education Specialist 0 0 0 0 0 10 10
00
Education, Administration Ed.D. 0 0 0 0 0 27 27Biological Sciences Ph.D. 0 0 0 0 9 3 12Materials Chemistry Ph.D. 0 0 0 0 0 7 7Nursing Ph.D. 0 0 0 0 6 0 6Education Ed.D. 0 0 0 0 0 6 6Counseling & Psychology in Education Ph.D. 0 0 0 0 0 6 6Geospatial Science & Engineering Ph.D. 0 0 0 0 6 0 6Psychology Ph.D. 0 0 0 0 0 4 4Engineering Ph.D. 0 0 0 3 2 0 5Information Systems D.Sc 0 6 0 0 0 0 6Physician Scientist Ph.D. 0 0 0 0 0 6 6Biomedical Engineering Ph.D. 0 0 0 0 0 4 4Biomedical Sciences Ph.D. 0 0 0 0 0 4 4Chemical and Biological Engineering Ph.D. 0 0 0 4 0 0 4Chemistry Ph.D. 0 0 0 0 5 0 5Sociology Ph.D. 0 0 0 0 4 0 4Ag/Biosystems/Mechanical Engineering Ph.D. 0 0 0 0 4 0 4Atmospheric & Environmental Sciences Ph.D. 0 0 0 2 0 0 2English Ph.D. 0 0 0 0 0 3 3Nutrition, Exercise & Food Sciences Ph.D. 0 0 0 0 2 0 2Pharmaceutical Sciences Ph.D. 0 0 0 0 3 0 3Political Science Ph.D. 0 0 0 0 0 3 3Wildlife & Fisheries Sciences Ph.D. 0 0 0 0 2 0 2Biochemistry Ph.D. 0 0 0 0 2 0 2Nanoscience & Nanoengineering Ph.D. 0 0 0 2 0 0 2Agricultural Sciences Ph.D. 0 0 0 0 1 0 1Pharmacy PHRMD 0 0 0 0 76 0 76Law J.D. 0 0 0 0 0 58 58Medicine M.D. 0 0 0 0 0 55 55Nursing DNP 0 0 0 0 22 0 22Physical Therapy D.PT 0 0 0 0 0 24 24
TD.PT 0 0 0 0 0 6 6Audiology AuD. 0 0 0 0 0 7 7Physician Scientist M.D. 0 0 0 0 0 6 6
00
0 6 0 11 144 269 430
733 445 482 448 2,602 2,192 6,902Grand total all levels
Professional Total
Awarded Degrees and Baccalaureate Majors FY16
Source: University data provided to Regents Information Systems

Enrollments, High School Preparation, and Degrees ConferredEnrollments, High School Preparation, and Degrees Conferred Fiscal Year 2017
27
FY16 Graduates Teacher Education Majors
Source: University data provided to Regents Information Systems
1 Includes Physical Ed.; Health, Physical Ed., and Recreation; Human Perf. and Fitness; Exercise Sci.; Kinesiology & Sport Science 2 Includes Vocal, Instrumental Perf.; Comp. Vocal; Comp. Instrumental; Musical Theatre 3 Includes Art; Art Education; Art History; Graphic Design; Studio Arts 4 Includes Elem. Ed. / Spec. Ed; Early Child./Spec. Ed; Elem. Ed. & Spec. Learn./Behav. Prob. 5 Includes Ag.; Ag. Ed.; Ani. Sci.; Rng. Sci.; Dairy Prod.; Hort.; Ag. Journ.; Ag. Engin.; Ag. Ed., Comm., & Ldr. 6 Includes Composite Science; Environmental Science; Composite Math & Science 7 Includes Pol. Sci.; Psych.; Socio.; Anth.; Geog.; Soc. Sci. for Teachers; Gen. Studies; Human Serv.; Econ.; Int’l Studies; GIS; Global Studies 8 Includes Speech; Speech Ed.; Speech Comm.; Comm. Studies & Theatre; Theatre; Composite Comm/English Note: Major titles in the “Graduates with One Major” subsection are clustered into groups of similar fi elds. In some cases, graduates completed multiple majors within these groups.
BHSU DSU NSU SDSU USD SystemGraduates with One Major (Grouped)Elementary Education 43 23 26 0 41 133Early Childhood Education 0 0 0 66 0 66Physical Education, Health, and Fitness1 13 3 0 13 7 36Music, Music Education2 3 0 11 15 6 35History; History Education 4 0 6 9 6 25Art; Art Education3 7 0 5 4 7 23English; English Education; Journalism 10 2 1 5 4 22Elementary Education / Special Education4 4 15 0 0 0 19Math; Math Education; Accounting 5 4 2 5 2 18Special Education 8 0 8 0 0 16Agriculture; Ag Education5 0 0 0 15 0 15Biology; Biology Education 0 1 2 1 5 9Composite Science6 7 0 0 0 0 7Foreign Language; Language Education 0 0 0 5 1 6Social Sciences7 1 0 0 2 1 4Business Education 2 1 0 0 0 3Family & Consumer Science Education 0 0 0 3 0 3Speech and Communication8 0 0 0 1 1 2Chemistry; Chemistry Education; Biochemistry 0 0 1 0 0 1Graduates with Two Majors (Grouped)Special Education Elementary Education 12 0 8 0 29 49Elementary Education Composite Early Child/Special Education 9 0 0 0 0 9English Art 0 0 0 1 0 1English Special Education 1 0 0 0 0 1History Political Science 0 0 0 0 1 1Physical Education Elementary Education 1 0 0 0 0 1Physical Education Special Education 1 0 0 0 0 1Special Education Composite Early Child/Special Education 1 0 0 0 0 1Special Education Composite Science 1 0 0 0 0 1Special Education English Education 0 0 0 0 1 1Special Education History Education 0 0 0 0 1 1Special Education Physical Education 1 0 0 0 0 1TOTAL 134 49 70 145 113 511

Enrollments, High School Preparation, and Degrees Conferred Fiscal Year 2017
28
Graduate Trends SummaryFY12 - FY16
Source: University data provided to Regents Information Systems
FY 12 FY 13 FY 14 FY 15 FY 16BHSU 28 26 51 46 55 DSU 59 54 66 48 59 NSU 11 15 16 22 20 SDSMT 8 4 7 1 6 SDSU 26 21 35 45 65 USD 281 365 286 121 25 Subtotal 413 485 461 283 230
BHSU 476 537 506 487 499 DSU 227 248 237 230 269 NSU 309 300 313 290 328 SDSMT 255 253 289 292 339 SDSU 1,844 1,988 1,884 1,866 2,015 USD 883 991 1,023 1,202 1,266 Subtotal 3,994 4,317 4,252 4,367 4,716
BHSU 48 112 68 86 100 DSU 64 67 65 91 101 NSU 71 34 61 127 93 SDSMT 86 87 82 91 90 SDSU 315 324 275 286 331 USD Education Specialist 27 51 37 45 40 USD Master's 486 528 478 570 523 Subtotal 1,097 1,203 1,066 1,296 1,278
SDSMT Ph.D. 7 8 18 9 11 SDSU Ph.D. 38 45 47 64 46 USD Ph.D. 29 19 29 32 40 Subtotal 74 72 94 105 97
USD Ed.D. 35 37 34 37 33 Subtotal 35 37 34 37 33
DSU D.Sc. 4 4 7 5 6 Subtotal 4 4 7 5 6
SDSU DNP 0 5 7 22 22 SDSU Pharm.D. 69 68 77 85 76 USD AuD 2 3 4 3 7 USD DPT 26 25 26 26 24 USD J.D. 77 73 80 62 58 USD M.D. 51 53 54 52 61 USD TDPT 15 10 10 7 6 Subtotal 240 237 258 257 254
5,857 6,356 6,172 6,350 6,614
Doctorate - D.Sc
Professional
Total
Associate Degree
Baccalaureate Degree
Master's & Education Specialist
Doctorate - Ph.D
Doctorate - Ed.D

Enrollments, High School Preparation, and Degrees ConferredEnrollments, High School Preparation, and Degrees Conferred Fiscal Year 2017
29
The number tested in a year is NOT usually the same as the number of graduates. Some graduates do not test immediately. The table includes only programs where passing the examination is required to work in the fi eld. Years (calendar, state fi scal, federal fi scal) and months of examination vary due to differences across testing agencies. National pass rates are not available for all fi elds. Data reported to the Board of Regents by the universities unless otherwise noted.(1) July examinations – fi rst time test takers.(2) American Academy of Nurse Practitioners(3) American Nurse Credentialing Center
For Medicine at USD, the number tested and number passed refl ect the respective ‘Graduating Class’ for both the MD-1 and MD-2 exam.
Graduates Testing and Passing Licensure and Certifi cation Examinations
Source: Board of Regents Licensure and Certifi cation Exam Report
Program Univ Degree Year
TestedNumber Tested
Number Passed
PercentPassed
National PercentPassed
Athletic Training SDSU BS 2015-16 17 14 82% 86% Athletic Training SDSU MS 2015-16 4 4 100% 86% Audiology USD AuD 2016 6 5 83% N/A Clinical Psychology USD PhD 2016 3 3 100% N/A Dental Hygiene USD BS 2016 32 32 100% N/A Dietetics SDSU BS 2015 14 12 85.7% N/A Law (1) USD JD 2016 34 20 59% N/A Medicine USD MD-1 2016 60 55 92% 96% Medicine USD MD-2 2016 61 60 98% 96% Nursing SDSU BS 2015 288 263 91% N/A Nursing SDSU BS 2014 275 240 87% 82% Nursing SDSU DNP/FNP 2015 20 20 100% 100% Nursing SDSU DNP/FNP 2014 13 13 100% 86% Nursing SDSU DNP/NNP 2015 1 1 100% 81% Nursing USD AS 2015 106 89 85% 85% Nursing USD BSN 2015 55 47 85% 85% Occupational Therapy USD MS 2016 25 25 100% N/A Pharmacy SDSU PharmD 2015 81 81 100% 94% Physical Therapy USD DPT 2016 24 24 100% 94% Physician Assistant USD MSPAS 2015 25 23 92% 96% Respiratory Care DSU AS/BS 2016 19 19 100% 82% Social Work USD BA/BS 2015 11 10 91% 78% Social Work USD MSW 2015 24 19 79% 81% Social Work (Clinical Exam) USD MSW 2015 3 3 100% 76% Speech/Language Pathology USD MS 2016 23 20 87% N/A

Placement Fiscal Year 2017
30
100.0%
88.5%
80.6%76.3% 73.7%
60.0%
80.0%
100.0%
Year 1 Year 2 Year 3 Year 4 Year 5
In-State Placement of Regental Teacher Education Graduates
Each year, a joint effort is undertaken by SDBOR and SDDOE to examine the extent to which graduates from Regental undergraduate teacher education programs are hired by in-state school districts following graduation. A roster of all undergraduate teacher education degree completers since FY2002 is matched against SDDOE beginning-of-year employment records since FY2003. This process allows SDBOR research staff to analyze the in-state placement outcomes of university system graduates for every year following graduation.
It is important to note that the placement rates cited here refer only to the proportion of teacher education graduates who are hired by in-state school districts. Placement rates do not include graduates who may have been hired by an out-of-state school district, hired by an educational organization other than a school district, hired outside the fi eld of education, or entered graduate school. “Placement rate” should not be interpreted as an equivalent to “employment rate.”
A total of 5,883 students completed an undergraduate degree at one of the fi ve regental teacher education programs from FY2002 through FY2014. Matched data from SDDOE indicate that approximately half (53.8 percent) of these graduates ultimately were placed in an in-state school district following graduation. Placement rates were even higher (65.1 percent) among graduates who originally matriculated from South Dakota. The fi gure below shows the placement destinations of all teacher education graduates from FY2002-FY2014.
SDBOR System: Teacher Education Graduates by County of First Placement
Also of interest is the extent to which these graduates remain in the workforce once hired. The fi gure below displays averaged retention data for nine cohorts of graduates who were placed during the initial year of placement eligibility.1 It can be seen here that nearly nine out of every ten of these teachers (act. 88.5 percent) continued in a South Dakota district during the second year, and almost three in four (73.7 percent) were still employed fi ve years later.
Note: 1 These fi gures refer to graduates from FY2002-FY2010; these are the only cohorts for which fi ve years of data are available.
Statewide Retention of Graduates Placed in First Year
Aurora0%
Beadle2%
Bennett0% Bon
Homme1%
Brookings3%
Brown6%
Brule2%
Buffalo0%
Butte2%
Campbell0%
Charles Mix2%
Clark1%
Clay2%
Codington2%
Corson1%
Custer1%
Davison2%
Day1%
Deuel0%
Dewey1%
Douglas0%
Edmunds1%
Fall River1%
Faulk0%
Grant1%
Gregory0%
Haakon0%
Hamlin1%Hand
0%
Hanson0%
Harding0%
Hughes1%
Hutchinson1%
Hyde1%
Jerauld0%Jones
0%
Kingsbury2%
Lake2%
Lawrence3%
Lincoln5%
Lyman1%
McCook1%
McPherson1%
Marshall0%
Meade3%
Mellette1%
Miner0%
Minnehaha14%
Moody2%
Pennington13%
Perkins0%
Potter0%
Roberts2%
Sanborn0%
Oglala Lakota1%
Spink2%
Stanley1%
Sully0%
Todd1%
Tripp1%
Turner2%
Union4%
Walworth1%
Yankton2%
Jackson0%
Ziebach0%
Teacher Placement
< 1%
1 - 2%
3 - 4%
5 - 9%
> 10%

Placement Fiscal Year 2017
31
State of Origin From SD Not from SD TotalEmployed/Enrolled in SD 71.6% 29.1% 56.2%Not Placed in SD 28.4% 70.9% 43.8%
Total (n) 3,912 2,229 6,141
What becomes of students who complete degrees at the state’s public universities? Examining the placement outcomes of Regental degree completers is vital for understanding the public university system’s contribution to the state’s human capital. Accordingly, the Board of Regents annually examines the extent to which Regental degree completers ultimately remain in South Dakota following graduation, either as a worker or as a continuing student. Data for this project come from three main sources: the South Dakota Board of Regents (SDBOR), the South Dakota Department of Labor and Regulation (SDDLR), and the National Student Clearinghouse (NSC). In the initial step of the placement search, SDDLR employment data systems are queried to determine the fi rst-year job placement outcomes of all degree majors (in a given cohort) identifi ed by SDBOR. Next, the same student list is submitted to the NSC to gather information on students enrolled in collegiate coursework after graduation.
The table below indicates that 56.2 percent (n=3,790) of FY2014 graduates were placed in South Dakota, either by employment or by continued enrollment. Among those FY2014 completers matriculating from South Dakota, the in-state placement rate was 71.6 percent; among all other completers, this fi gure was 29.1 percent. In practical terms, this means that more than 70 percent of in-state students graduating from a public university will remain in South Dakota after graduation, either to work or to pursue additional postsecondary education. The same can be said of nearly 30 percent of out-of-state students.
* Does not account for degree completers who are self-employed, are employed by the federal government (including armed services), or are enrolled in postsecondary institutions outside South Dakota.
As noted above, students matriculating from South Dakota and graduating in FY2014 produced a fi rst-year in-state placement rate of 71.6 percent. The chart below provides analogous placement rates for the last eight student cohorts. As suggested by these data, the university system has been increasingly successful at keeping its graduates in the state following degree completion.
Note: 1 For record searches performed by both the SDDLR and the NSC, matched records are sought for a one-quarter (three-month) window one year following a student’s graduation date. Any employment/enrollment data returned for this time period – including part-time employment/enrollment – are included in the analysis.2 This overall placement rate of 56.2 percent refl ects the sum of in-state employment (approximately 52.4 percent) and enrollment (approximately 3.8 percent). Graduates who were found to be both employed and enrolled are reported under the “Employed” category in this report.* Does not account for degree completers who are self-employed, are employed by the federal government (including armed services), or are enrolled in postsecondary institutions outside South Dakota.
Placement Outcomes of Regental Graduates
First-Year In-State Placement of Graduates Originally from SD
Placement in SD by State of Origin
69.5% 69.7%70.6%
73.4%
71.7%
73.0%73.7%
71.6%
67.0%
68.0%
69.0%
70.0%
71.0%
72.0%
73.0%
74.0%
75.0%
FY2007 FY2008 FY2009 FY2010 FY2011 FY2012 FY2013 FY2014
*

ResearchResearch Fiscal Year 2017
32
Governor Research Center Program
Note: 1BioSystems Networks & Translational Research (SDSU, USD & SDSM&T: FY14-FY19); Advanced Manufacturing Process Technology Transition & Training Center (SDSM&T: FY14-FY18); Composite & Nanocomposite Advanced Manufacturing Center (SDSM&T: FY14-FY18); Repair, Refurbish & Service (SDSM&T: FY09-FY14); Translational Cancer Research (SDSU: FY09-FY14); Biological Control and Analysis by Applied Photonics (SDSU: FY09-FY14); Protection of the Financial Infrastructure (DSU: FY09-FY13); Center for Ultra-Low Background Experiments in the Dakotas (SDSM&T & USD: FY09-FY14); Center for Drought Tolerance Biotechnology (SDSU: FY07-FY09); Bioprocessing Research and Development (SDSM&T & SDSU: FY07-FY11); Center for Light-Activated Materials (USD: FY05-FY09); Accelerated Applications at the Nanoscale (SDSM&T: FY05-FY08); South Dakota Signal Transduction Center (USD: FY05-FY09); and Center for Infectious Disease and Vaccinology (SDSU: FY05-FY09).* Earliest data available
In Fiscal Year 2005 the state Legislature began making an annual appropriation to fund state-supported applied research centers designed to strengthen South Dakota’s research competitiveness and generate commercial activity derived from research. The Research and Commercialization Council (RCC), comprised of fi ve public members appointed by the Governor and four members serving by virtue of their positions, is charged with oversight and selection of the research centers. The program provides funding to research centers for 5-6 years to advance the following goals: 1) develop focused research centers that are competitive for external research funding; 2) develop and license inventions; and 3) support existing and spin off start-up companies. The results of the evaluation of the state’s investment of just over $41 million in the program since its inception in FY05 through FY16 follows:
A Snapshot of the Success
Centers Funded: 141
Funding Leverage: 6:1
Students Trained: 943
Innovations Disclosed: 156
Patent Filings: 70
Patents Issued: 11
License Agreements: 17
Economic Development
The 20 startup companies affi liated with the research centers have:
• Created 187 jobs in South Dakota
• Received 27 federal small business research (SBIR) awards, totaling $7,877,510
• Raised in excess of $23,000,000 in private equity
Broader Impact on University Research Statewide
FY05 Awards: $55.5M FY07* Disclosures: 21 FY07* Licenses: 3 FY07* Patent Filings: 11
FY16 Awards: $102.6M FY16 Disclosures: 52 FY16 Licenses: 13 FY16 Patent Filings: 39
$136,692,895
$92,291,788
$41,156,646
$20,676,519
Research Funding: $290,817,848
Federal Private RCC Other State
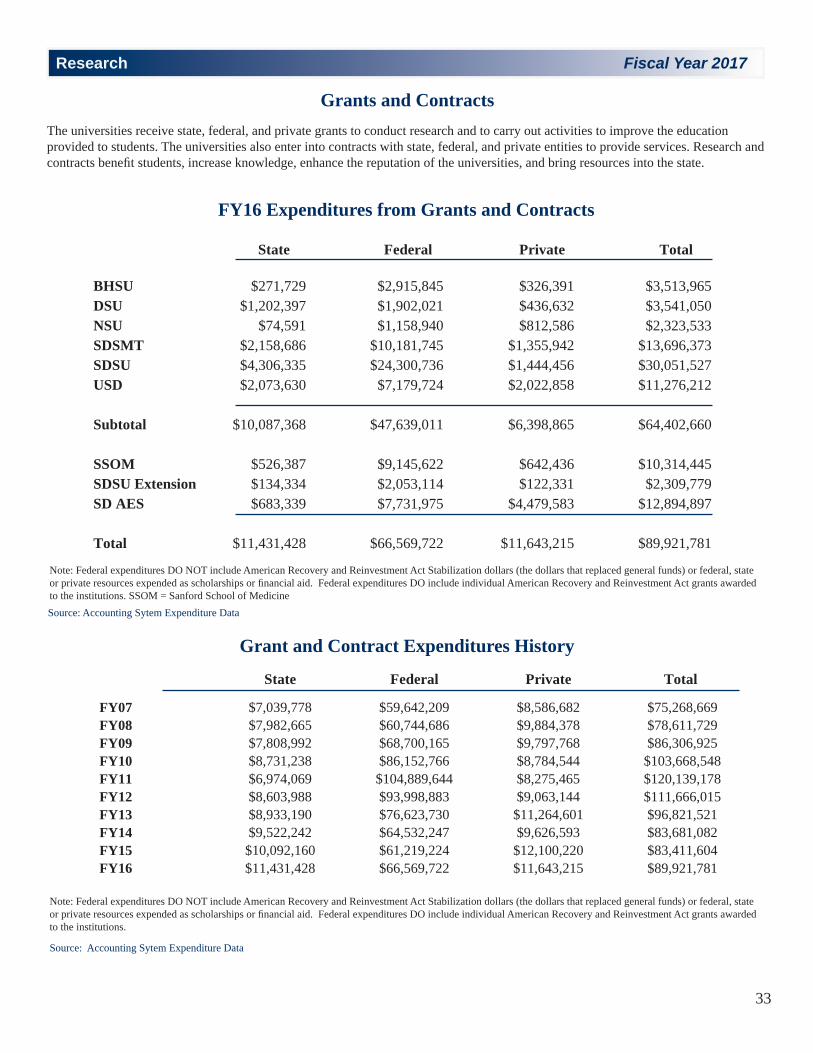
Research Fiscal Year 2017
33
FY16 Expenditures from Grants and Contracts
The universities receive state, federal, and private grants to conduct research and to carry out activities to improve the education provided to students. The universities also enter into contracts with state, federal, and private entities to provide services. Research and contracts benefi t students, increase knowledge, enhance the reputation of the universities, and bring resources into the state.
Grants and Contracts
Note: Federal expenditures DO NOT include American Recovery and Reinvestment Act Stabilization dollars (the dollars that replaced general funds) or federal, state or private resources expended as scholarships or fi nancial aid. Federal expenditures DO include individual American Recovery and Reinvestment Act grants awarded to the institutions. SSOM = Sanford School of Medicine
Grant and Contract Expenditures History
Note: Federal expenditures DO NOT include American Recovery and Reinvestment Act Stabilization dollars (the dollars that replaced general funds) or federal, state or private resources expended as scholarships or fi nancial aid. Federal expenditures DO include individual American Recovery and Reinvestment Act grants awarded to the institutions.
Source: Accounting Sytem Expenditure Data
Source: Accounting Sytem Expenditure Data
State Federal Private Total
BHSU $271,729 $2,915,845 $326,391 $3,513,965DSU $1,202,397 $1,902,021 $436,632 $3,541,050NSU $74,591 $1,158,940 $812,586 $2,323,533SDSMT $2,158,686 $10,181,745 $1,355,942 $13,696,373SDSU $4,306,335 $24,300,736 $1,444,456 $30,051,527USD $2,073,630 $7,179,724 $2,022,858 $11,276,212
Subtotal $10,087,368 $47,639,011 $6,398,865 $64,402,660
SSOM $526,387 $9,145,622 $642,436 $10,314,445SDSU Extension $134,334 $2,053,114 $122,331 $2,309,779SD AES $683,339 $7,731,975 $4,479,583 $12,894,897
Total $11,431,428 $66,569,722 $11,643,215 $89,921,781
State Federal Private Total
FY07 $7,039,778 $59,642,209 $8,586,682 $75,268,669FY08 $7,982,665 $60,744,686 $9,884,378 $78,611,729FY09 $7,808,992 $68,700,165 $9,797,768 $86,306,925FY10 $8,731,238 $86,152,766 $8,784,544 $103,668,548FY11 $6,974,069 $104,889,644 $8,275,465 $120,139,178FY12 $8,603,988 $93,998,883 $9,063,144 $111,666,015FY13 $8,933,190 $76,623,730 $11,264,601 $96,821,521FY14 $9,522,242 $64,532,247 $9,626,593 $83,681,082FY15 $10,092,160 $61,219,224 $12,100,220 $83,411,604FY16 $11,431,428 $66,569,722 $11,643,215 $89,921,781
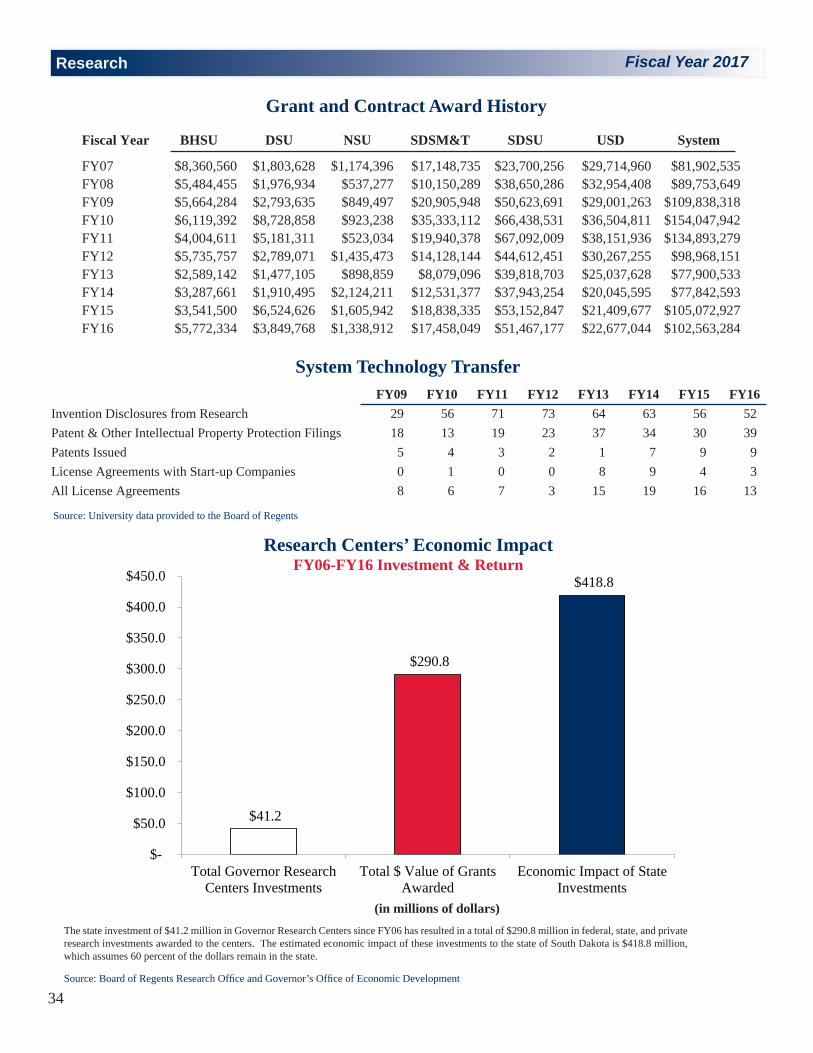
Fiscal Year 2017ResearchResearch Fiscal Year 2017
34
Fiscal Year BHSU DSU NSU SDSM&T SDSU USD System
FY07 $8,360,560 $1,803,628 $1,174,396 $17,148,735 $23,700,256 $29,714,960 $81,902,535 FY08 $5,484,455 $1,976,934 $537,277 $10,150,289 $38,650,286 $32,954,408 $89,753,649 FY09 $5,664,284 $2,793,635 $849,497 $20,905,948 $50,623,691 $29,001,263 $109,838,318 FY10 $6,119,392 $8,728,858 $923,238 $35,333,112 $66,438,531 $36,504,811 $154,047,942 FY11 $4,004,611 $5,181,311 $523,034 $19,940,378 $67,092,009 $38,151,936 $134,893,279 FY12 $5,735,757 $2,789,071 $1,435,473 $14,128,144 $44,612,451 $30,267,255 $98,968,151 FY13 $2,589,142 $1,477,105 $898,859 $8,079,096 $39,818,703 $25,037,628 $77,900,533 FY14 $3,287,661 $1,910,495 $2,124,211 $12,531,377 $37,943,254 $20,045,595 $77,842,593 FY15 $3,541,500 $6,524,626 $1,605,942 $18,838,335 $53,152,847 $21,409,677 $105,072,927 FY16 $5,772,334 $3,849,768 $1,338,912 $17,458,049 $51,467,177 $22,677,044 $102,563,284
$41.2
$290.8
$418.8
$-
$50.0
$100.0
$150.0
$200.0
$250.0
$300.0
$350.0
$400.0
$450.0
Total Governor ResearchCenters Investments
Total $ Value of GrantsAwarded
Economic Impact of StateInvestments
FY09 FY10 FY11 FY12 FY13 FY14 FY15 FY16Invention Disclosures from Research 29 56 71 73 64 63 56 52Patent & Other Intellectual Property Protection Filings 18 13 19 23 37 34 30 39Patents Issued 5 4 3 2 1 7 9 9License Agreements with Start-up Companies 0 1 0 0 8 9 4 3All License Agreements 8 6 7 3 15 19 16 13
Grant and Contract Award History
Research Centers’ Economic ImpactFY06-FY16 Investment & Return
Source: University data provided to the Board of Regents
Source: Board of Regents Research Offi ce and Governor’s Offi ce of Economic Development
The state investment of $41.2 million in Governor Research Centers since FY06 has resulted in a total of $290.8 million in federal, state, and private research investments awarded to the centers. The estimated economic impact of these investments to the state of South Dakota is $418.8 million, which assumes 60 percent of the dollars remain in the state.
(in millions of dollars)
System Technology Transfer
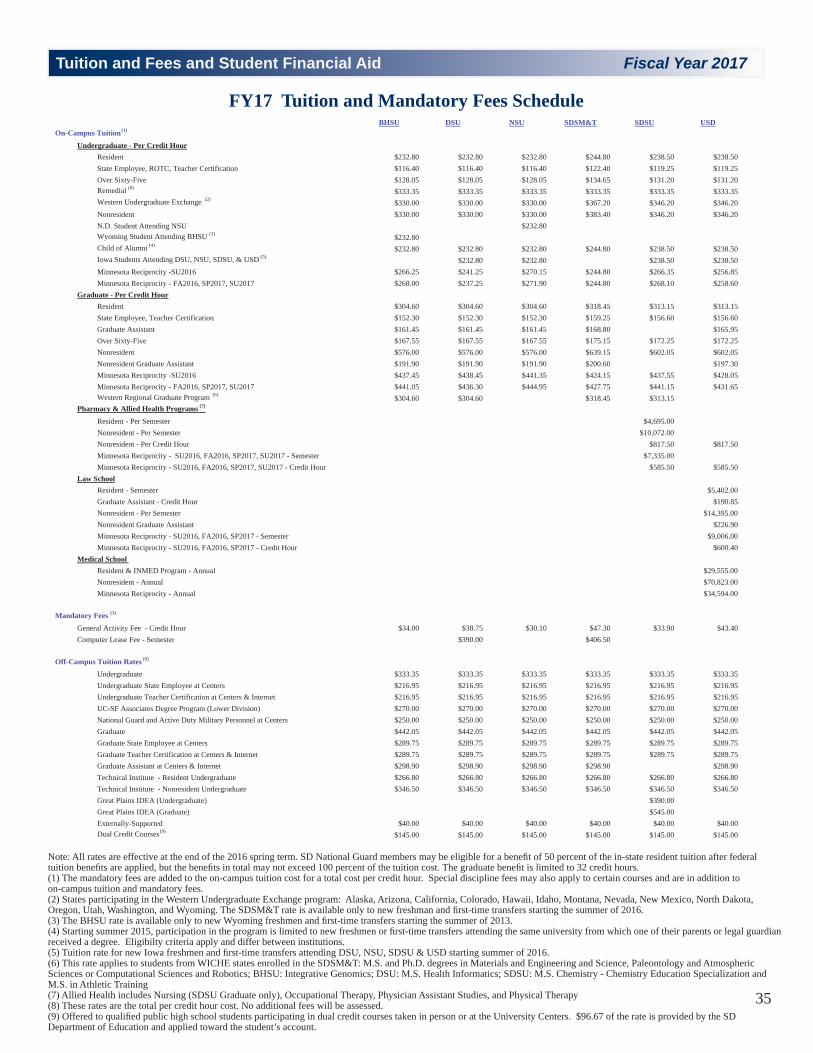
Tuition and Fees and Student Financial Aid Fiscal Year 2017
35
Note: All rates are effective at the end of the 2016 spring term. SD National Guard members may be eligible for a benefi t of 50 percent of the in-state resident tuition after federal tuition benefi ts are applied, but the benefi ts in total may not exceed 100 percent of the tuition cost. The graduate benefi t is limited to 32 credit hours. (1) The mandatory fees are added to the on-campus tuition cost for a total cost per credit hour. Special discipline fees may also apply to certain courses and are in addition to on-campus tuition and mandatory fees. (2) States participating in the Western Undergraduate Exchange program: Alaska, Arizona, California, Colorado, Hawaii, Idaho, Montana, Nevada, New Mexico, North Dakota, Oregon, Utah, Washington, and Wyoming. The SDSM&T rate is available only to new freshman and fi rst-time transfers starting the summer of 2016. (3) The BHSU rate is available only to new Wyoming freshmen and fi rst-time transfers starting the summer of 2013. (4) Starting summer 2015, participation in the program is limited to new freshmen or fi rst-time transfers attending the same university from which one of their parents or legal guardian received a degree. Eligibilty criteria apply and differ between institutions. (5) Tuition rate for new Iowa freshmen and fi rst-time transfers attending DSU, NSU, SDSU & USD starting summer of 2016. (6) This rate applies to students from WICHE states enrolled in the SDSM&T: M.S. and Ph.D. degrees in Materials and Engineering and Science, Paleontology and Atmospheric Sciences or Computational Sciences and Robotics; BHSU: Integrative Genomics; DSU: M.S. Health Informatics; SDSU: M.S. Chemistry - Chemistry Education Specialization and M.S. in Athletic Training (7) Allied Health includes Nursing (SDSU Graduate only), Occupational Therapy, Physician Assistant Studies, and Physical Therapy (8) These rates are the total per credit hour cost. No additional fees will be assessed. (9) Offered to qualifi ed public high school students participating in dual credit courses taken in person or at the University Centers. $96.67 of the rate is provided by the SD Department of Education and applied toward the student’s account.
FY17 Tuition and Mandatory Fees ScheduleBHSU DSU NSU SDSM&T SDSU USD
On-Campus Tuition (1)
Undergraduate - Per Credit HourResident $232.80 $232.80 $232.80 $244.80 $238.50 $238.50
$116.40 $116.40 $116.40 $122.40 $119.25 $119.25Over Sixty-Five $128.05 $128.05 $128.05 $134.65 $131.20 $131.20Remedial (8) $333.35 $333.35 $333.35 $333.35 $333.35 $333.35Western Undergraduate Exchange (2) $330.00 $330.00 $330.00 $367.20 $346.20 $346.20Nonresident $330.00 $330.00 $330.00 $383.40 $346.20 $346.20N.D. Student Attending NSU $232.80Wyoming Student Attending BHSU (3) $232.80Child of Alumni (4) $232.80 $232.80 $232.80 $244.80 $238.50 $238.50Iowa Students Attending DSU, NSU, SDSU, & USD (5) $232.80 $232.80 $238.50 $238.50Minnesota Reciprocity -SU2016 $266.25 $241.25 $270.15 $244.80 $266.35 $256.85Minnesota Reciprocity - FA2016, SP2017, SU2017 $268.00 $237.25 $271.90 $244.80 $268.10 $258.60
Graduate - Per Credit HourResident $304.60 $304.60 $304.60 $318.45 $313.15 $313.15
$152.30 $152.30 $152.30 $159.25 $156.60 $156.60Graduate Assistant $161.45 $161.45 $161.45 $168.80 $165.95Over Sixty-Five $167.55 $167.55 $167.55 $175.15 $172.25 $172.25Nonresident $576.00 $576.00 $576.00 $639.15 $602.05 $602.05Nonresident Graduate Assistant $191.90 $191.90 $191.90 $200.60 $197.30Minnesota Reciprocity -SU2016 $437.45 $438.45 $441.35 $424.15 $437.55 $428.05Minnesota Reciprocity - FA2016, SP2017, SU2017 $441.05 $436.30 $444.95 $427.75 $441.15 $431.65Western Regional Graduate Program (6) $304.60 $304.60 $318.45 $313.15
Pharmacy & Allied Health Programs (7)
Resident - Per Semester $4,695.00Nonresident - Per Semester $10,072.00Nonresident - Per Credit Hour $817.50 $817.50Minnesota Reciprocity - SU2016, FA2016, SP2017, SU2017 - Semester $7,335.00Minnesota Reciprocity - SU2016, FA2016, SP2017, SU2017 - Credit Hour $585.50 $585.50
Law SchoolResident - Semester $5,402.00Graduate Assistant - Credit Hour $190.85Nonresident - Per Semester $14,395.00Nonresident Graduate Assistant $226.90Minnesota Reciprocity - SU2016, FA2016, SP2017 - Semester $9,006.00Minnesota Reciprocity - SU2016, FA2016, SP2017 - Credit Hour $600.40
Medical School Resident & INMED Program - Annual $29,555.00Nonresident - Annual $70,823.00Minnesota Reciprocity - Annual $34,594.00
Mandatory Fees (1)
General Activity Fee - Credit Hour $34.00 $38.75 $30.10 $47.30 $33.90 $43.40Computer Lease Fee - Semester $390.00 $406.50
Off-Campus Tuition Rates (8)
Undergraduate $333.35 $333.35 $333.35 $333.35 $333.35 $333.35Undergraduate State Employee at Centers $216.95 $216.95 $216.95 $216.95 $216.95 $216.95Undergraduate Teacher Certification at Centers & Internet $216.95 $216.95 $216.95 $216.95 $216.95 $216.95UC-SF Associates Degree Program (Lower Division) $270.00 $270.00 $270.00 $270.00 $270.00 $270.00National Guard and Active Duty Military Personnel at Centers $250.00 $250.00 $250.00 $250.00 $250.00 $250.00Graduate $442.05 $442.05 $442.05 $442.05 $442.05 $442.05Graduate State Employee at Centers $289.75 $289.75 $289.75 $289.75 $289.75 $289.75Graduate Teacher Certification at Centers & Internet $289.75 $289.75 $289.75 $289.75 $289.75 $289.75Graduate Assistant at Centers & Internet $298.90 $298.90 $298.90 $298.90 $298.90Technical Institute - Resident Undergraduate $266.80 $266.80 $266.80 $266.80 $266.80 $266.80Technical Institute - Nonresident Undergraduate $346.50 $346.50 $346.50 $346.50 $346.50 $346.50Great Plains IDEA (Undergraduate) $390.00Great Plains IDEA (Graduate) $545.00Externally-Supported $40.00 $40.00 $40.00 $40.00 $40.00 $40.00Dual Credit Courses(9) $145.00 $145.00 $145.00 $145.00 $145.00 $145.00
State Employee, ROTC, Teacher Certification
State Employee, Teacher Certification

Tuition and Fees and Student Financial Aid Fiscal Year 2017
36
FY17 Fee Schedule
Tuition and Fees and Student Financial Aid
(10) Other Sciences: SDSU: Ag & Biological Sciences, Botany, Horticulture, Interdisciplinary, Natural Resource Management, Plant, Wildlife and Fisheries, Geography; SDSM&T: Geography; USD: Earth Science, Meteorology (11) Allied Health Discipline Fee applies to Nursing, Dental Hygiene, Occupational Therapy, Physician Assistant Studies, Physical Therapy, and HSC (SDSU only) (12) Allied Health Off-Campus Delivery Fee applies to Nursing, Physician Assistant Studies and HSC Paramedic Specialization
BHSU DSU NSU SDSM&T SDSU USD
Fees for ServiceApplication Fee - Undergraduate $20.00 $20.00 $20.00 $20.00 $20.00 $20.00Application Fee - Graduate $35.00 $35.00 $35.00 $35.00 $35.00 $35.00Transcript $9.00 $9.00 $9.00 $9.00 $9.00 $9.00Challenge by Exam - Course $90.75 $90.75 $90.75 $90.75 $90.75 $90.75International Student Fee - Fall & Spring $100.00 $100.00 $100.00 $100.00 $100.00 $100.00NSU Exchange Program Fee $110.25Testing Fees
COMPASS, Proficiency, Technology Re-test $18.00 $18.00 $18.00 $18.00 $18.00 $18.00Nursing Assessment (ASN) $240.00Nursing Assessment (BSN) $214.50
Discipline Fees - Credit HourScience/Technology/Engineering/Math
Atmospheric & Environmental Science $80.00Biology/Microbiology/Anatomy $20.00 $20.00 $20.00 $40.00 $40.00 $40.00Chemistry $20.00 $20.00 $20.00 $80.00 $40.00 $40.00Geology/Nanoscience/Paleontology $20.00 $80.00Physics $20.00 $20.00 $20.00 $80.00 $80.00 $80.00Other Sciences(10) $20.00 $20.00 $20.00Computer Science $45.00 $45.00 $45.00 $45.00 $45.00 $45.00Engineering $80.00 $80.00Mathematics/Statistics $15.00 $15.00 $15.00 $40.00 $40.00 $40.00
Allied Health (11)
Undergraduate $97.70 $97.70Graduate $214.70 $97.70
Health and Wellness $15.00 $20.00Fine Arts $15.00 $15.00 $15.00 $15.00 $15.00 $15.00Business
Undergraduate $28.65 $28.65 $28.65 $28.65 $28.65Graduate $51.40 $51.40 $51.40 $51.40 $51.40
Campus Specific FeesRespiratory Care $50.00E-Learning $20.00Architecture $440.90Animal Science $60.95Dairy Science/Food Science $77.85Dietetics Internship - Per Semester $4,500.00Medical Laboratory Science - Per Semester $1,686.70 $1,527.25Neonatal Care - Annual $7,526.00Nutrition $28.00Interior Design /Landscape Design $28.00Pharmacy $197.65Pharmacy - Semester $3,330.00Range Science $44.35Veterinary Science $60.95Communication Disorders $102.15Law - Per Semester $1,154.25
Professional Education MajorsSoph/Junior Field Experience - Semester $170.00 $170.00 $170.00 $170.00 $170.00Senior Field Experience - Semester $340.00 $340.00 $340.00 $340.00 $340.00Master's Level Internship - One Time $170.00 $170.00 $170.00 $170.00 $170.00Specialist Level Intern - One Time $345.00Doctoral Level Intern - One Time $517.00
Off-Campus Delivery Fee - Credit HourInternational Student Delivery Fee $410.45Allied Health, & School of Medicine (12) $43.40 $43.40Masters of Public Health $137.20 $137.20Medical Laboratory Science - Semester $1,051.95Masters of Social Work $43.40pMBA (Sioux Falls) $364.25
$124.75Non-Resident Online Masters In Engineering $168.75
Non-Resident Online Computer Science, Cyber Operations, & Network and Security Administration

Tuition and Fees and Student Financial Aid Fiscal Year 2017
37
FY17 Residence Hall Rates, Food Service Plans and Vehicle Registration RatesBHSU DSU NSU SDSM&T SDSU USD
Residence Hall RatesTraditional Halls - Per Semester
Single $2,249.30 $2,187.60 $2,191.05 $1,950.50 $2,406.55 $2,487.35Single - Crow Peak, Connolly Upperclassmen, Brown $3,485.00 $2,422.85 $2,767.60
$2,458.35Single - Mathews $2,628.55
$3,248.00$3,217.45
Designed Single - Spencer, Thorne, Abbott $2,797.40Double $1,722.35 $1,747.15 $1,722.40 $1,742.85 $1,672.90 $2,043.05Double - Crow Peak, Brown $2,460.00 $2,200.00
$1,842.35 Double - Mathews $1,969.90Double - Caldwell, Spencer, Thorne, Abbott $2,598.60Double - Ben Reifel, Hyde, Honors. Schultz $2,723.80Double Room/Single Occupancy $2,517.95Triple Occupancy $1,450.70 $1,742.85 $1,752.85Quad Occupancy $1,982.50Quad Deluxe $2,141.80Double Room/Single Occupancy - Brookman $2,523.20Double Room/Single Occupancy - Norton, Burgess, Beede, Mickelson, Richardson, Olson $2,656.15Triple Room/Double Occupancy - Norton, Beede, Mickelson, Richardson, Olson $2,278.65
Apartments - SemesterUniversity Apartments $2,113.85Single Occupancy $2,921.35Double Occupancy $2,230.80Double/Single Occupancy $3,274.90Meadows North & Meadows South $2,598.60State Court - Month $349.70Family - 1 Bedroom per Month $463.35Family - 2 Bedroom per Month $743.40 $552.00Single - McFadden $3,022.05Rocker Square II Single - Semester $2,815.00Rocker Square II Double - Semester $2,078.00Rocker Square I - Semester $2,919.00Coyote Village Apartment 2BD $3,785.55Coyote Village Apartment 4BD $3,135.45
SuitesSingle Occupancy $2,928.95Double Occupancy $2,314.45Semi Suite - Double Occupancy $2,203.80Single 2 Bedroom (Coyote Village Super Suite) $3,555.35Single 4 Bedroom (Coyote Village Super Suite) $2,962.95Summer rates may be found at the institution's website.
Food Service Plans for Residence Halls Minimum ( Freshmen Required Plan) $1,625.15 $1,458.45 $1,769.60 $1,624.00 $1,627.10 $1,724.70Maximum $1,817.60 $1,823.95 $2,037.65 $1,834.60 $2,029.30 $1,898.70Variations exist including plans that are available to non-residential students. All rates require Board approval.
Vehicle RegistrationAutomobile - Annual $89.00 $61.00 $70.00 $114.00 $148.00 $138.00Automobile - Annual Secondary Vehicle $15.00Automobile - Annual - University Centers $31.00 $30.00Motorcycle - Annual $35.00 $33.00 $43.00Motorcycle - Annual Secondary Vehicle $15.00Reserved - Annual $276.00 $266.00Commuter - Annual $33.00 $114.00 $148.00Remote - Annual $67.00 $74.00Remote - East - Annual $51.00Remote - Gravel - Annual $5.00Gated - Per Hour $2.00
Double - Binnewies, Pierson, Young
Designed Single - Ben Reifel, Hyde, Honors, & SchultzSingle - Caldwell, Spencer, Thorne, Abbott
Single - Binnewies, Pierson, Young

Tuition and Fees and Student Financial Aid Fiscal Year 2017
38
$7,185 $7,247$8,344 $8,531 $8,565
$9,708
$11,808
$0
$2,000
$4,000
$6,000
$8,000
$10,000
$12,000
$14,000
MT NE SD ND WY IA MN
$5,055$6,304
$7,264$7,288
$8,201 $8,504
$9,888
$0
$2,000
$4,000
$6,000
$8,000
$10,000
$12,000
WY MT ND NE IA SD MN
Regional Comparison System Average Cost and Rank of Public Institutions
Tuition and Required Fees
Undergraduate ResidentFY17 Tuition and Required Fees
Source: Fall 2016 and Fall 2017 Tuition Surveys
Graduate ResidentFY17 Tuition and Required Fees
RankTuition& Fees Rank
Tuition& Fees
PercentChange Rank
Tuition& Fees Rank
Tuition& Fees
PercentChange
Iowa 5 $7,886 5 $8,201 4.0% Iowa 6 $9,361 6 $9,708 3.7%Minnesota 7 $9,842 7 $9,888 0.5% Minnesota 7 $11,743 7 $11,808 0.6%Montana 2 $6,107 2 $6,304 3.2% Montana 3 $7,141 1 $7,185 0.6%Nebraska 3 $6,851 4 $7,288 6.4% Nebraska 1 $6,842 2 $7,247 5.9%North Dakota 4 $6,948 3 $7,264 4.6% North Dakota 4 $8,318 4 $8,531 2.6%South Dakota 6 $8,475 6 $8,504 0.3% South Dakota 5 $8,321 3 $8,344 0.3%Wyoming 1 $4,960 1 $5,055 1.9% Wyoming 2 $6,958 5 $8,565 23.1%
RankTuition& Fees Rank
Tuition& Fees
PercentChange Rank
Tuition& Fees Rank
Tuition& Fees
PercentChange
Iowa 7 $22,250 7 $22,949 3.1% Iowa 7 $22,785 7 $23,504 3.2%Minnesota 4 $14,177 4 $14,542 2.6% Minnesota 4 $16,601 4 $16,714 0.7%Montana 6 $19,862 6 $20,556 3.5% Montana 6 $22,036 6 $22,606 2.6%Nebraska 3 $13,159 3 $13,770 4.6% Nebraska 1 $14,679 2 $15,318 4.4%North Dakota 2 $12,915 2 $13,370 3.5% North Dakota 3 $16,276 3 $16,665 2.4%South Dakota 1 $11,354 1 $11,732 3.3% South Dakota 2 $14,689 1 $15,195 3.4%Wyoming 5 $15,700 5 $16,215 3.3% Wyoming 5 $18,022 5 $18,639 3.4%
Undergraduate Non-Resident Graduate Non-ResidentFY17FY16FY16 FY17
FY17FY16FY16 FY17Undergraduate Resident Graduate Resident

Tuition and Fees and Student Financial Aid Fiscal Year 2017
39
$13,863 $13,948$14,576
$15,387 $15,578$17,338
$18,103
$0
$5,000
$10,000
$15,000
$20,000
ND MT WY SD NE IA MN
$15,026$15,227$15,615 $15,742
$18,086 $18,845$20,170
$0
$5,000
$10,000
$15,000
$20,000
$25,000
MT SD ND NE WY IA MN
Regional Comparison System Average Cost and Rank of Public Institutions
Total Cost
Undergraduate ResidentFY17 Total Cost
Graduate ResidentFY17 Total Cost
Note: Total Cost includes tuition and required fees plus room and board.
Source: Fall 2017 Regional Tuition Survey
RankTotalCost Rank
TotalCost
PercentChange Rank
TotalCost Rank
TotalCost
PercentChange
Iowa 7 $16,602 6 $17,338 4.4% Iowa 6 $18,078 6 $18,845 4.2%Minnesota 6 $17,824 7 $18,103 1.6% Minnesota 7 $19,841 7 $20,170 1.7%Montana 2 $13,471 2 $13,948 3.5% Montana 1 $14,645 1 $15,026 2.6%Nebraska 4 $14,894 5 $15,578 4.6% Nebraska 4 $15,109 4 $15,742 4.2%North Dakota 1 $13,285 1 $13,863 4.3% North Dakota 2 $15,048 3 $15,615 3.8%South Dakota 5 $15,252 4 $15,387 0.9% South Dakota 3 $15,098 2 $15,227 0.9%Wyoming 3 $14,212 3 $14,576 2.6% Wyoming 5 $16,210 5 $18,086 11.6%
RankTotalCost Rank
TotalCost
PercentChange Rank
TotalCost Rank
TotalCost
PercentChange
Iowa 7 $30,967 7 $32,086 3.6% Iowa 7 $31,502 7 $32,641 3.6%Minnesota 4 $21,910 4 $22,540 2.9% Minnesota 4 $24,229 4 $24,611 1.6%Montana 6 $27,225 6 $28,200 3.6% Montana 6 $29,541 6 $30,447 3.1%Nebraska 3 $21,202 3 $22,060 4.0% Nebraska 2 $22,947 3 $23,813 3.8%North Dakota 2 $19,253 2 $19,969 3.7% North Dakota 3 $23,007 2 $23,749 3.2%South Dakota 1 $18,131 1 $18,615 2.7% South Dakota 1 $21,465 1 $22,078 2.9%Wyoming 5 $24,952 5 $25,736 3.1% Wyoming 5 $27,274 5 $28,160 3.3%
FY17
FY16 FY17Graduate Non-Resident
FY16 FY17
FY17 FY16Undergraduate Resident Graduate Resident
Undergraduate Non-Resident
FY16

Tuition and Fees and Student Financial Aid Fiscal Year 2017
40
Jump Start
In October 2014, South Dakota received a U.S. Department of Education First in the World grant to facilitate the South Dakota Jump Start as a statewide program involving the six institutions governed by the South Dakota Board of Regents (SDBOR) and tribal partner Oglala Lakota College. The focus of the program is to improve access and success for American Indian and low-income, under-represented students. Working with students as they transition from high school to college, the program provides continued support for the momentum necessary to achieve success as college students and improve degree completion. SD Jump Start builds upon the Board’s Policy Goal #1 of Student Success, which stresses the importance of expanding education access and improving student retention and completion with particular emphasis on American Indian students. SD Jump Start’s research included the recent BOR study of South Dakota American Indian students, Like Two Worlds, as well as research that addresses the importance of academic momentum and retention advising.
The program provides students with a combination of supports intended to facilitate stronger fi rst-to-second year retention, on-time credit accumulation and ultimately on-time graduation. Using an “Earn and Learn” model, students are exposed to summer campus experiences before their fi rst year, and for two summers thereafter in which they earn college credits. Additionally, students participate in part-time employment that helps pay for their education. The other key component of the program involves the provision of access advisors at the high school level to assist with college-going activities including assistance with college applications and fi nancial aid, and retention advisors on each campus working directly with students in a case management approach to retention advising. The fi rst cohort of new fi rst-time students entered the seven participating institutions in Summer 2015 with a second cohort enrolling in Summer 2016. In Cohort 1, a total of 186 students participated in the Summer Bridge program, with 169 (90 percent) of those students enrolled at their institution at census date and 118 (72 percent) enrolling for their second year. For Cohort 2, a total of 176 students completed the Summer Bridge program with 169 (96 percent) starting the fall semester. The distribution of Jump Start students at each participating institution can be found in the fi gures below.
13
18
9
15
14
36
13
14
22
14
20
15
52
32
0 10 20 30 40 50 60
BHSU
DSU
NSU
OLC
SDSM&T
SDSU
USD
Cohort 1 Headcount
Fall '15 Fall '16
29
44
17
16
9
27
48
0 10 20 30 40 50 60
BHSU
DSU
NSU
OLC
SDSM&T
SDSU
USD
Cohort 2 Headcount Fall 2016
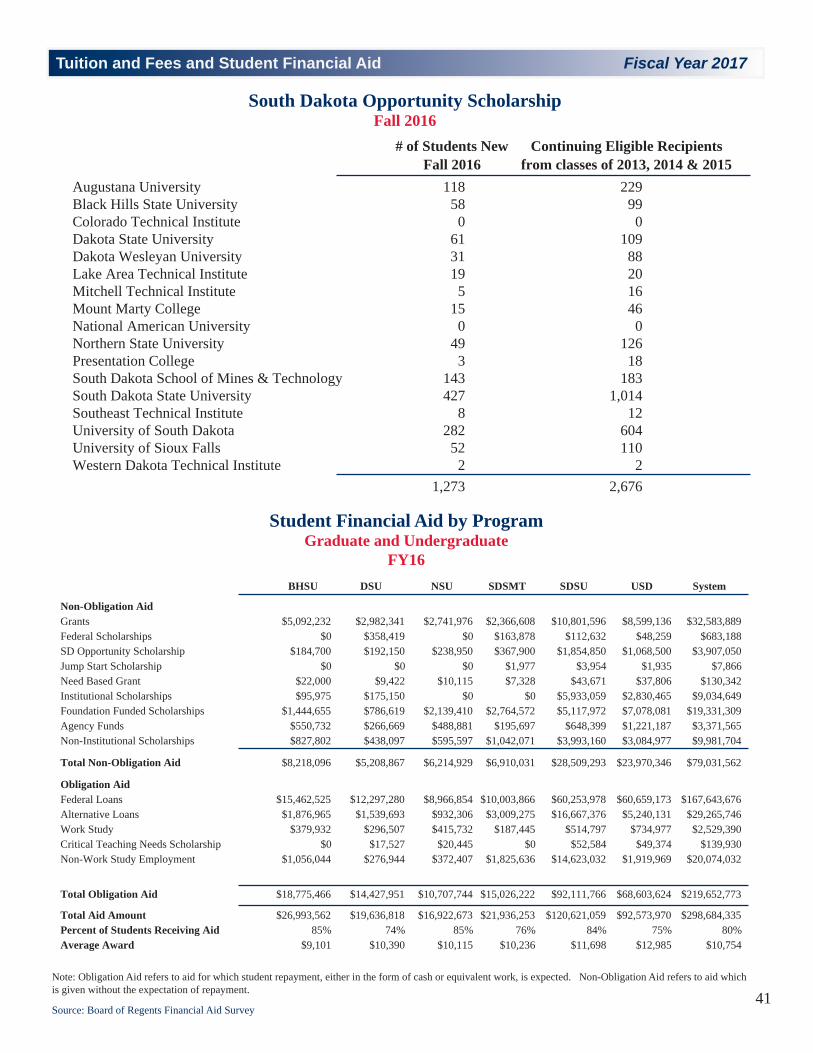
Tuition and Fees and Student Financial Aid Fiscal Year 2017
41
BHSU DSU NSU SDSMT SDSU USD System
Non-Obligation AidGrants $5,092,232 $2,982,341 $2,741,976 $2,366,608 $10,801,596 $8,599,136 $32,583,889Federal Scholarships $0 $358,419 $0 $163,878 $112,632 $48,259 $683,188SD Opportunity Scholarship $184,700 $192,150 $238,950 $367,900 $1,854,850 $1,068,500 $3,907,050Jump Start Scholarship $0 $0 $0 $1,977 $3,954 $1,935 $7,866Need Based Grant $22,000 $9,422 $10,115 $7,328 $43,671 $37,806 $130,342Institutional Scholarships $95,975 $175,150 $0 $0 $5,933,059 $2,830,465 $9,034,649Foundation Funded Scholarships $1,444,655 $786,619 $2,139,410 $2,764,572 $5,117,972 $7,078,081 $19,331,309Agency Funds $550,732 $266,669 $488,881 $195,697 $648,399 $1,221,187 $3,371,565Non-Institutional Scholarships $827,802 $438,097 $595,597 $1,042,071 $3,993,160 $3,084,977 $9,981,704
Total Non-Obligation Aid $8,218,096 $5,208,867 $6,214,929 $6,910,031 $28,509,293 $23,970,346 $79,031,562
Obligation AidFederal Loans $15,462,525 $12,297,280 $8,966,854 $10,003,866 $60,253,978 $60,659,173 $167,643,676Alternative Loans $1,876,965 $1,539,693 $932,306 $3,009,275 $16,667,376 $5,240,131 $29,265,746Work Study $379,932 $296,507 $415,732 $187,445 $514,797 $734,977 $2,529,390Critical Teaching Needs Scholarship $0 $17,527 $20,445 $0 $52,584 $49,374 $139,930Non-Work Study Employment $1,056,044 $276,944 $372,407 $1,825,636 $14,623,032 $1,919,969 $20,074,032
Total Obligation Aid $18,775,466 $14,427,951 $10,707,744 $15,026,222 $92,111,766 $68,603,624 $219,652,773
Total Aid Amount $26,993,562 $19,636,818 $16,922,673 $21,936,253 $120,621,059 $92,573,970 $298,684,335Percent of Students Receiving Aid 85% 74% 85% 76% 84% 75% 80%Average Award $9,101 $10,390 $10,115 $10,236 $11,698 $12,985 $10,754
Note: Obligation Aid refers to aid for which student repayment, either in the form of cash or equivalent work, is expected. Non-Obligation Aid refers to aid which is given without the expectation of repayment.
Student Financial Aid by ProgramGraduate and Undergraduate
FY16
Source: Board of Regents Financial Aid Survey
South Dakota Opportunity ScholarshipFall 2016
Augustana University 118 229Black Hills State University 58 99Colorado Technical Institute 0 0Dakota State University 61 109Dakota Wesleyan University 31 88Lake Area Technical Institute 19 20Mitchell Technical Institute 5 16Mount Marty College 15 46National American University 0 0Northern State University 49 126Presentation College 3 18South Dakota School of Mines & Technology 143 183South Dakota State University 427 1,014Southeast Technical Institute 8 12University of South Dakota 282 604University of Sioux Falls 52 110Western Dakota Technical Institute 2 2
1,273 2,676
Continuing Eligible Recipients from classes of 2013, 2014 & 2015
# of Students New Fall 2016

Fiscal Year 2017Tuition and Fees and Student Financial Aid Fiscal Year 2017
42
57% 63%53%
46% 50%66%
57%
0%
25%
50%
75%
BHSU DSU NSU SDSMT SDSU USD System
State
Need-Based Grant Aid Awarded by
State
Nonneed-BasedGrant Aid
Awarded by StateTotal Grant Aid Funding by State
UndergraduatesReceiving Pell
Grants
Need-BasedFunding Per Pell Eligible Student
South Dakota $227,000 $4,674,000 $4,901,000 16,728 $13.57North Dakota $9,137,000 $8,744,000 $17,881,000 11,722 $779.47Wyoming $15,146,000 $0 $15,146,000 8,420 $1,798.81Colorado $110,110,000 $672,000 $110,782,000 115,621 $952.34Iowa $60,804,000 $4,822,000 $65,626,000 94,131 $645.95Minnesota $186,294,000 $1,512,000 $187,806,000 119,326 $1,561.22Montana $3,700,000 $5,045,000 $8,745,000 18,351 $201.62Nebraska $17,409,000 $0 $17,409,000 36,183 $481.14Total/Average $402,827,000 $25,469,000 $428,296,000 420,482 $958.01
Total Grant & Aid Funding for Surrounding StatesBased on Total Enrollments Receiving Pell Awards
Fall 2014-2015 Academic Year
Source: 46th Annual Survey Report on State Sponsored Student Financial Aid by the National Association of State Student Grant and Aid Programs’ (NASSGAP)
Average Student Loan DebtFall 2015 / Spring 2016 Graduates
Baccalaureate Degrees
Percentage of Total Financial Aid from Federal Loans
$29,237
$23,209 $27,030 $27,285 $26,074 $26,071 $25,408
$- $5,000
$10,000 $15,000 $20,000 $25,000 $30,000 $35,000
BHSU DSU NSU SDSMT SDSU USD System

Financial Resources Fiscal Year 2017
43
11.5%12.0%12.5%13.0%13.5%14.0%14.5%15.0%15.5%16.0%
FY07 FY08 FY09 FY10 FY11 FY12 FY13 FY14 FY15 FY16
15.3
%
15.2
%
15.2
%
15.0
%
15.5
%
13.2
%
13.9
% 15.3
%
13.8
%
15.7
%
General Funds$212,097,277
24.4%
HEFF$30,236,606
3.7%
School & Public Lands
$2,059,945 0.2%
Tuition and Fees$268,025,993
30.6%
Federal Appropriated
$8,455,113 1.1%
Federal Restricted
$121,752,003 17.6%
Other$186,362,161
17.4%
Room & Board$42,567,375
4.9%
Board of Regents Budget by Fund SourceFiscal Year 2017
$871,556,473
Board of Regents Percent of State General Fund Expenditures
Source: Governor’s Budget Book

Financial Resources Fiscal Year 2017
44
History of General Fund Appropriations
FY08 FY09 FY10 FY11 FY12Previous FY General Fund Base $162,881,972 $174,429,288 $185,218,896 $170,902,101 $167,302,956
Salary PackageTotal Salary and Benefit Package $5,061,733 $5,186,796 $0 $705,297 $0
Percent Change of Base 3.11% 2.97% 0.00% 0.41% 0.00%
Maintenance (Maintain Value)ADRDL Lease Payments ($1,348) $2,394 $1,087 ($158) ($1,422)BIT Billings & PEPL Adjust.Utilities $2,042,163 $302,104 $1,152,717 ($12,912) ($297,216)Travel Cut $410,000SDSM&T Audit Cut $40,560Library FundingInstitutional Base Reductions ($1,969,999) ($5,560,686) ($17,209,994)
Total Maintenance $2,491,375 $304,498 ($816,195) ($5,573,756) ($17,508,632)
Percent Change of Base 1.53% 0.17% -0.44% -3.26% -10.47%
New Regental InvestmentsNeed Based Scholarship Funding
National Guard & State Employee Tuition Support
Center for the Prevention of Child MaltreatmentMidwest Education CompactStudent Tech Fellows ($270,000)Electronic University Consortium ($169,314)Tuition Buy-Down for Resident StudentsUSD MD Program ExpansionUSD PA Program ExpansionUSD PA Preceptors ReimbursementNSU E-LearningAES ResearchSDSU - DNP Preceptor ReimbursementBond Payment - PayoffPerformance Fund Match ($500,000)Research $500,000Property Captive PremiumProperty InsuranceGovernor's Faster CAFRGeneral Ed Courses - Tech SchoolsPhD Programs $1,790,057REED Operating & Technical Suport $886,846 ($155,359) $106,2412% M&R Goal $1,632,999 ($1,632,999)Science Facilities - $74.5M Bond $2,306,300 ($1,921) $1,752 $129CUC Lease Payment $34,768Critical Deferred Maintenance $265,740 $437,401 ($3,870) ($4,302) ($4,733)USD Master of Social Work $237,251
Total Regental Investments $2,555,797 $5,298,314 ($1,556,898) ($835,623) ($4,604)Percent Change of Base 1.57% 3.04% -0.84% -0.49% 0.00%
General Fund Increase $10,108,905 $10,789,608 ($2,373,093) ($5,704,082) ($17,513,236)Percent Change of Base 6.21% 6.19% -1.28% -3.34% -10.47%
New Student InvestmentsSD Opportunity Scholarship $1,438,411 ($468,767) $1,995,510 $216,983
Stimulus Fund General/Federal SwapGeneral Fund Inc/Dec ($11,474,935) $109,427 $742,085
Final Base $174,429,288 $185,218,896 $170,902,101 $167,302,956 $150,748,788
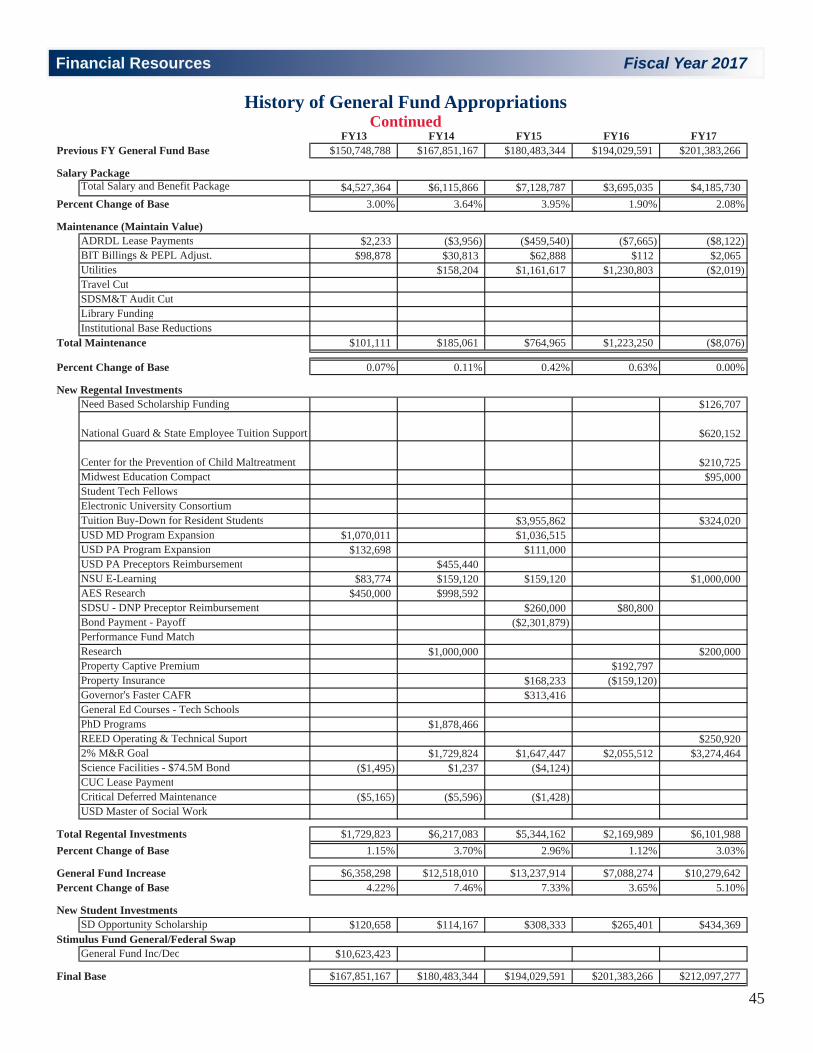
Financial Resources Fiscal Year 2017
45
History of General Fund AppropriationsContinued
FY13 FY14 FY15 FY16 FY17Previous FY General Fund Base $150,748,788 $167,851,167 $180,483,344 $194,029,591 $201,383,266
Salary PackageTotal Salary and Benefit Package $4,527,364 $6,115,866 $7,128,787 $3,695,035 $4,185,730
Percent Change of Base 3.00% 3.64% 3.95% 1.90% 2.08%
Maintenance (Maintain Value)ADRDL Lease Payments $2,233 ($3,956) ($459,540) ($7,665) ($8,122)BIT Billings & PEPL Adjust. $98,878 $30,813 $62,888 $112 $2,065Utilities $158,204 $1,161,617 $1,230,803 ($2,019)Travel CutSDSM&T Audit CutLibrary FundingInstitutional Base Reductions
Total Maintenance $101,111 $185,061 $764,965 $1,223,250 ($8,076)
Percent Change of Base 0.07% 0.11% 0.42% 0.63% 0.00%
New Regental InvestmentsNeed Based Scholarship Funding $126,707
National Guard & State Employee Tuition Support $620,152
Center for the Prevention of Child Maltreatment $210,725Midwest Education Compact $95,000Student Tech FellowsElectronic University ConsortiumTuition Buy-Down for Resident Students $3,955,862 $324,020USD MD Program Expansion $1,070,011 $1,036,515USD PA Program Expansion $132,698 $111,000USD PA Preceptors Reimbursement $455,440NSU E-Learning $83,774 $159,120 $159,120 $1,000,000AES Research $450,000 $998,592SDSU - DNP Preceptor Reimbursement $260,000 $80,800Bond Payment - Payoff ($2,301,879)Performance Fund MatchResearch $1,000,000 $200,000Property Captive Premium $192,797Property Insurance $168,233 ($159,120)Governor's Faster CAFR $313,416General Ed Courses - Tech SchoolsPhD Programs $1,878,466REED Operating & Technical Suport $250,9202% M&R Goal $1,729,824 $1,647,447 $2,055,512 $3,274,464Science Facilities - $74.5M Bond ($1,495) $1,237 ($4,124)CUC Lease PaymentCritical Deferred Maintenance ($5,165) ($5,596) ($1,428)USD Master of Social Work
Total Regental Investments $1,729,823 $6,217,083 $5,344,162 $2,169,989 $6,101,988Percent Change of Base 1.15% 3.70% 2.96% 1.12% 3.03%
General Fund Increase $6,358,298 $12,518,010 $13,237,914 $7,088,274 $10,279,642Percent Change of Base 4.22% 7.46% 7.33% 3.65% 5.10%
New Student InvestmentsSD Opportunity Scholarship $120,658 $114,167 $308,333 $265,401 $434,369
Stimulus Fund General/Federal SwapGeneral Fund Inc/Dec $10,623,423
Final Base $167,851,167 $180,483,344 $194,029,591 $201,383,266 $212,097,277

Financial Resources Fiscal Year 2017
46
All Funds Operating Budgets Fiscal Year 2017
Note: System Support includes Regents Information Systems, System Issues (bonded indebtedness and leases, utilities, Executive Director’s system initiatives, college prep, system library initiative, system research initiative grants, and system scholarships), Enrollment Services Center, Electronic University Consortium, and South Dakota Library Network
Source: FY17 Operating Budgets
General Funds HEFFSchool & Public
Lands Tuition & FeesBHSU $9,689,385 $31,161 $173,360 $23,726,650
FTE 135.3 0.0 0.0 218.9
DSU $9,834,109 $22,362 $173,360 $18,013,984FTE 123.6 0.0 0.0 121.7
NSU NSU Proper $12,088,760 $36,293 $183,393 $13,002,694
FTE 151.5 0.0 0.0 103.1 NSU K-12 E-Learning $2,687,098 $0 $0 $0
FTE 36.4 0.0 0.0 0.0
SDSM&T $16,887,673 $34,093 $133,022 $24,734,874FTE 201.4 0.0 0.0 174.5
SDSU SDSU Proper $46,567,960 $131,975 $548,451 $113,334,258
FTE 568.7 0.0 0.0 679.8 SDSU Extension $8,654,361 $0 $0 $0
FTE 114.1 0.0 0.0 0.0 Ag Experiment Station $12,194,624 $0 $77,745 $0
FTE 150.0 0.0 0.0 0.0 ADRDL $1,849,024 $0 $0 $0
FTE 23.5 0.0 0.0 0.0
USD USD Proper $37,092,974 $87,983 $236,041 $62,171,294
FTE 434.3 0.0 0.0 436.2 SSOM $22,912,215 $0 $0 $15,031,134
FTE 180.2 0.0 0.0 70.2
SDSD $2,805,388 $0 $339,861 $0FTE 24.5 0.0 0.0 0.0
SDSBVI $2,959,855 $0 $194,712 $0FTE 46.1 0.0 0.0 0.0
Regents Central Office Executive Director $4,273,031 $0 $0 $0
FTE 25.5 0.0 0.0 0.0 System Support $21,600,820 $29,892,739 $0 $0
FTE 24.3 0.0 0.0 0.0
System Total $212,097,277 $30,236,606 $2,059,945 $270,014,888FTE 2239.4 0.0 0.0 1804.3
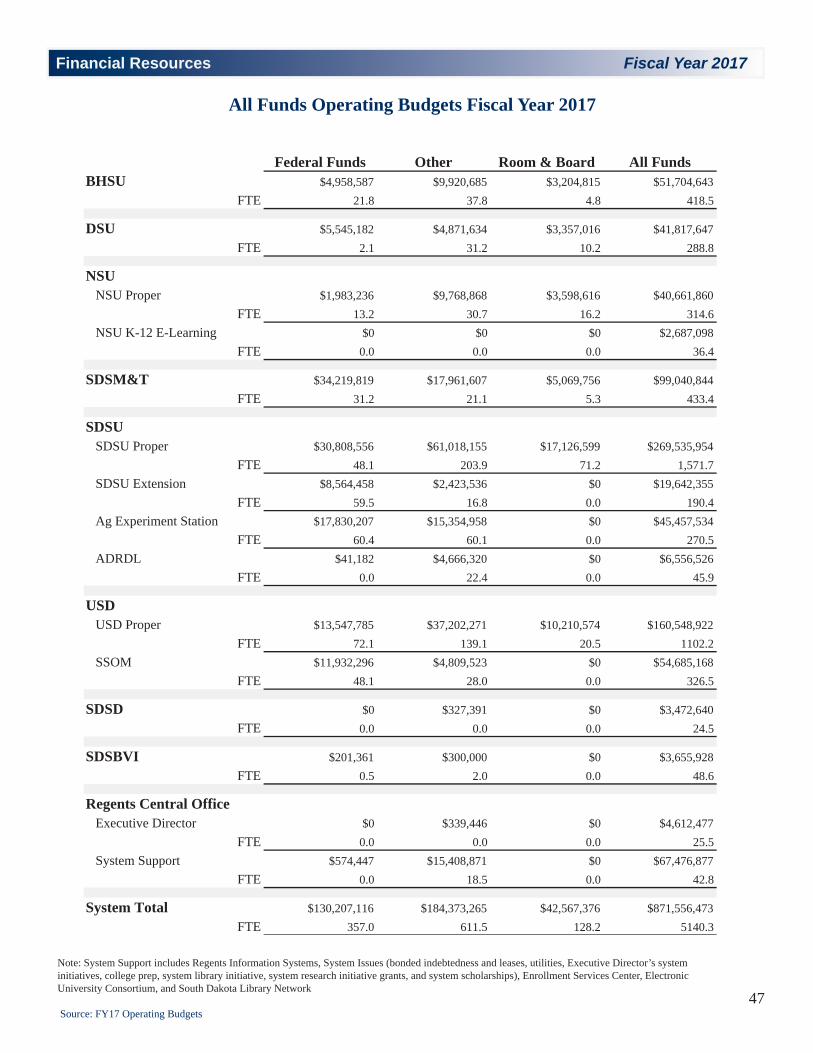
Financial Resources Fiscal Year 2017
47
All Funds Operating Budgets Fiscal Year 2017
Note: System Support includes Regents Information Systems, System Issues (bonded indebtedness and leases, utilities, Executive Director’s system initiatives, college prep, system library initiative, system research initiative grants, and system scholarships), Enrollment Services Center, Electronic University Consortium, and South Dakota Library Network
Source: FY17 Operating Budgets
Federal Funds Other Room & Board All FundsBHSU $4,958,587 $9,920,685 $3,204,815 $51,704,643
FTE 21.8 37.8 4.8 418.5
DSU $5,545,182 $4,871,634 $3,357,016 $41,817,647FTE 2.1 31.2 10.2 288.8
NSU NSU Proper $1,983,236 $9,768,868 $3,598,616 $40,661,860
FTE 13.2 30.7 16.2 314.6 NSU K-12 E-Learning $0 $0 $0 $2,687,098
FTE 0.0 0.0 0.0 36.4
SDSM&T $34,219,819 $17,961,607 $5,069,756 $99,040,844FTE 31.2 21.1 5.3 433.4
SDSU SDSU Proper $30,808,556 $61,018,155 $17,126,599 $269,535,954
FTE 48.1 203.9 71.2 1,571.7 SDSU Extension $8,564,458 $2,423,536 $0 $19,642,355
FTE 59.5 16.8 0.0 190.4 Ag Experiment Station $17,830,207 $15,354,958 $0 $45,457,534
FTE 60.4 60.1 0.0 270.5 ADRDL $41,182 $4,666,320 $0 $6,556,526
FTE 0.0 22.4 0.0 45.9
USD USD Proper $13,547,785 $37,202,271 $10,210,574 $160,548,922
FTE 72.1 139.1 20.5 1102.2 SSOM $11,932,296 $4,809,523 $0 $54,685,168
FTE 48.1 28.0 0.0 326.5
SDSD $0 $327,391 $0 $3,472,640FTE 0.0 0.0 0.0 24.5
SDSBVI $201,361 $300,000 $0 $3,655,928FTE 0.5 2.0 0.0 48.6
Regents Central Office Executive Director $0 $339,446 $0 $4,612,477
FTE 0.0 0.0 0.0 25.5 System Support $574,447 $15,408,871 $0 $67,476,877
FTE 0.0 18.5 0.0 42.8
System Total $130,207,116 $184,373,265 $42,567,376 $871,556,473FTE 357.0 611.5 128.2 5140.3

Financial Resources Fiscal Year 2017
48
Operating Budgets by ProgramAll Funds
Note: System Support includes Regents Information Systems, System Issues (bonded indebtedness and leases, utilities, Executive Director’s system initiatives, college prep, system library initiative, system research initiative grants, and system scholarships), Enrollment Services Center, Electronic University Consortium, and South Dakota Library Network
Source: FY17 Operating Budgets
01-Instruction 02-Research03-PublicService
04-AcademicSupport
05-StudentServices
BHSU $14,654,350 $2,184,521 $1,671,338 $4,670,132 $7,228,534FTE 167.0 8.0 11.3 37.9 66.3
DSU $16,006,003 $2,795,495 $3,236,151 $3,356,640 $4,795,722FTE 119.1 0.0 20.8 24.8 47.0
NSU NSU Proper $18,276,481 $207,664 $637,743 $3,680,125 $6,043,406
FTE 122.1 1.0 6.2 26.9 66.5 NSU K-12 E-Learning $1,958,358 $0 $0 $728,740 $0
FTE 22.4 0.0 0.0 14.0 0.0
SDSM&T $22,250,402 $30,133,995 $520,705 $5,921,154 $5,702,065FTE 169.9 40.1 3.3 38.6 57.7
SDSU SDSU Proper $102,888,320 $27,370,641 $8,041,727 $18,078,885 $22,849,450
FTE 662.5 38.6 33.4 154.9 171.5 SDSU Extension $0 $0 $19,642,355 $0 $0
FTE 0.0 0.0 190.4 0.0 0.0 Ag Experiment Station $0 $45,457,534 $0 $0 $0
FTE 0.0 270.5 0.0 0.0 0.0 ADRDL $0 $0 $6,556,526 $0 $0
FTE 0.0 0.0 45.9 0.0 0.0
USD USD Proper $47,922,295 $6,907,385 $9,056,745 $24,846,091 $15,851,427
FTE 375.1 21.3 76.3 200.4 120.5 SSOM $32,888,095 $8,134,226 $4,399,369 $7,242,692 $956,930
FTE 209.7 19.4 34.0 46.3 10.2
SDSD $1,044,281 $0 $0 $0 $485,142FTE 16.5 0.0 0.0 0.0 5.0
SDSBVI $2,026,904 $0 $0 $213,507 $731,870FTE 25.1 0.0 0.0 3.0 12.4
Regents Central Office Executive Director $0 $0 $0 $0 $0
FTE 0.0 0.0 0.0 0.0 0.0 System Support $0 $0 $0 $1,225,570 $0
FTE 0.0 0.0 0.0 4.5 0.0
System Total $259,915,488 $123,191,460 $53,762,659 $69,963,536 $64,644,546FTE 1889.5 398.9 421.6 551.3 557.0

Financial Resources Fiscal Year 2017
49
Operating Budgets by ProgramAll Funds
Note: System Support includes Regents Information Systems, System Issues (bonded indebtedness and leases, utilities, Executive Director’s system initiatives, college prep, system library initiative, system research initiative grants, and system scholarships), Enrollment Services Center, Electronic University Consortium, and South Dakota Library Network
Source: FY17 Operating Budgets
06-InstitionalSupport
07-OE of Plant
08-Scholarships
09-Auxillary Total
BHSU $5,947,238 $4,027,660 $6,800 $11,314,071 $51,704,643FTE 55.1 51.2 0.0 21.8 418.5
DSU $4,095,644 $1,804,619 $1,292,577 $4,434,796 $41,817,647FTE 37.1 25.2 0.0 14.8 288.8
NSU NSU Proper $3,843,900 $2,685,723 $9,979 $5,276,839 $40,661,860
FTE 33.2 33.9 0.0 24.9 314.7 NSU K-12 E-Learning $0 $0 $0 $0 $2,687,098
FTE 0.0 0.0 0.0 0.0 36.4
SDSM&T $5,627,741 $4,335,594 $17,002,928 $7,546,261 $99,040,844FTE 52.1 57.0 0.0 14.7 433.4
SDSU SDSU Proper $30,954,319 $30,818,425 $1,478,814 $27,055,374 $269,535,954
FTE 226.9 176.6 0.0 107.5 1,571.8 SDSU Extension $0 $0 $0 $0 $19,642,355
FTE 0.0 0.0 0.0 0.0 190.4 Ag Experiment Station $0 $0 $0 $0 $45,457,534
FTE 0.0 0.0 0.0 0.0 270.5 ADRDL $0 $0 $0 $0 $6,556,526
FTE 0.0 0.0 0.0 0.0 45.9
USD USD Proper $31,997,225 $11,404,230 $806,664 $11,756,861 $160,548,922
FTE 134.3 141.1 0.0 33.2 1102.2 SSOM $1,063,857 $0 $0 $0 $54,685,168
FTE 6.9 0.0 0.0 0.0 326.5
SDSD $1,598,504 $344,714 $0 $0 $3,472,640FTE 1.0 2.0 0.0 0.0 24.5
SDSBVI $392,087 $291,561 $0 $0 $3,655,928FTE 4.0 4.2 0.0 0.0 48.6
Regents Central Office Executive Director $4,612,477 $0 $0 $0 $4,612,477
FTE 25.5 0.0 0.0 0.0 25.5 System Support $16,922,707 $41,684,742 $7,643,858 $0 $67,476,877
FTE 38.3 0.0 0.0 0.0 42.8
System Total $107,055,697 $97,397,267 $28,241,620 $67,384,201 $871,556,473FTE 614.3 491.1 0.0 216.9 5140.4

Financial Resources Fiscal Year 2017
50
Operating Budgets by ProgramGeneral Funds Only
Note: System Support includes Regents Information Systems, System Issues (bonded indebtedness and leases, utilities, Executive Director’s system initiatives, college prep, system library initiative, system research initiative grants, and system scholarships), Enrollment Services Center, Electronic University Consortium, and South Dakota Library Network
Source: FY17 Operating Budgets
01-Instruction 02-Research03-PublicService
04-AcademicSupport
05-StudentServices
BHSU $167,113 $57,238 $0 $1,974,050 $2,289,788FTE 2.9 0.4 0.0 24.4 35.4
DSU $2,323,868 $0 $0 $1,478,129 $2,122,084FTE 19.8 0.0 0.0 15.9 35.8
NSU NSU Proper $2,325,203 $0 $0 $2,507,050 $2,856,319
FTE 29.1 0.0 0.0 22.9 43.0 NSU K-12 E-Learning $1,958,358 $0 $0 $728,740 $0
FTE 22.4 0.0 0.0 14.0 0.0
SDSM&T $6,421,001 $94,415 $94,453 $1,839,193 $2,570,061FTE 50.9 1.0 1.0 26.4 40.2
SDSU SDSU Proper $15,526,850 $1,575,296 $0 $4,275,147 $6,015,693
FTE 177.2 12.5 0.0 65.6 83.0 SDSU Extension $0 $0 $8,654,361 $0 $0
FTE 0.0 0.0 114.1 0.0 0.0 Ag Experiment Station $0 $12,194,624 $0 $0 $0
FTE 0.0 150.0 0.0 0.0 0.0 ADRDL $0 $0 $1,849,024 $0 $0
FTE 0.0 0.0 23.5 0.0 0.0
USD USD Proper $7,755,252 $9,409 $232,640 $7,777,769 $6,972,759
FTE 73.6 0.1 3.1 94.5 94.2 SSOM $17,597,522 $0 $147,852 $3,933,657 $890,636
FTE 133.4 0.0 0.6 31.1 10.2
SDSD $1,039,281 $0 $0 $0 $475,142FTE 16.5 0.0 0.0 0.0 5.0
SDSBVI $1,526,765 $0 $0 $213,507 $651,048FTE 22.6 0.0 0.0 3.0 12.4
Regents Central Office Executive Director $0 $0 $0 $0 $0
FTE 0.0 0.0 0.0 0.0 0.0 System Support $0 $0 $0 $0 $0
FTE 0.0 0.0 0.0 0.0 0.0
System Total $56,641,213 $13,930,982 $10,978,330 $24,727,241 $24,843,529FTE 548.3 164.1 142.4 297.7 359.2

Financial Resources Fiscal Year 2017
51
Operating Budgets by ProgramGeneral Funds Only
Note: System Support includes Regents Information Systems, System Issues (bonded indebtedness and leases, utilities, Executive Director’s system initiatives, college prep, system library initiative, system research initiative grants, and system scholarships), Enrollment Services Center, Electronic University Consortium, and South Dakota Library Network
Source: FY17 Operating Budgets
06-InstitionalSupport
07-OE of Plant
08-Scholarships
09-Auxillary Total
BHSU $2,366,951 $2,834,246 $0 $0 $9,689,385FTE 26.9 45.4 0.0 0.0 135.3
DSU $2,445,231 $1,464,797 $0 $0 $9,834,109FTE 27.7 24.5 0.0 0.0 123.6
NSU NSU Proper $2,290,997 $2,109,191 $0 $0 $12,088,760
FTE 24.7 31.9 0.0 0.0 151.5 NSU K-12 E-Learning $0 $0 $0 $0 $2,687,098
FTE 0.0 0.0 0.0 0.0 36.4
SDSM&T $3,459,164 $2,409,386 $0 $0 $16,887,673FTE 48.3 33.6 0.0 0.0 201.4
SDSU SDSU Proper $8,034,015 $11,140,958 $0 $0 $46,567,960
FTE 107.4 123.0 0.0 0.0 568.7 SDSU Extension $0 $0 $0 $0 $8,654,361
FTE 0.0 0.0 0.0 0.0 114.1 Ag Experiment Station $0 $0 $0 $0 $12,194,624
FTE 0.0 0.0 0.0 0.0 150.0 ADRDL $0 $0 $0 $0 $1,849,024
FTE 0.0 0.0 0.0 0.0 23.5
USD USD Proper $7,556,883 $6,788,263 $0 $0 $37,092,974
FTE 90.3 78.5 0.0 0.0 434.3 SSOM $342,548 $0 $0 $0 $22,912,215
FTE 5.0 0.0 0.0 0.0 180.2
SDSD $981,252 $309,714 $0 $0 $2,805,388FTE 1.0 2.0 0.0 0.0 24.5
SDSBVI $315,475 $253,061 $0 $0 $2,959,855FTE 4.0 4.2 0.0 0.0 46.1
Regents Central Office Executive Director $4,273,031 $0 $0 $0 $4,273,031
FTE 25.5 0.0 0.0 0.0 25.5 System Support $6,483,456 $9,591,388 $5,525,976 $0 $21,600,820
FTE 24.3 0.0 0.0 0.0 24.3
System Total $38,549,003 $36,901,003 $5,525,976 $0 $212,097,277FTE 385.0 342.9 0.0 0.0 2239.4

Financial Resources Fiscal Year 2017
52
Note: System Support includes Regents Information Systems, System Issues (bonded indebtedness and leases, utilities, Executive Director’s system initiatives, college prep, system library initiative, system research initiative grants, and system scholarships), Enrollment Services Center, Electronic University Consortium, and South Dakota Library Network
Source: FY17 Operating Budgets
Budgeted Salaries/FTE by CategoryAll Funds FY17
Non-Instructional
AdministratorInstructional
Administrator FacultyProfessional/
TechnicalCivil
ServicePart-time
Temporary TotalBHSU $955,339 $919,332 $10,028,465 $8,379,464 $4,604,716 $1,672,722 $26,560,038
FTE 6.0 10.2 149.6 106.6 128.5 17.6 418.5
DSU $1,028,785 $912,377 $9,021,738 $4,302,307 $3,788,149 $780,108 $19,833,463FTE 7.0 11.6 98.5 75.5 96.2 0.0 288.8
NSU NSU Proper $1,049,042 $649,299 $7,369,103 $5,241,528 $4,020,657 $1,034,561 $19,364,190
FTE 8.2 7.5 95.0 93.4 110.5 0.0 314.6 NSU K-12 E-Learning $15,789 $0 $1,237,020 $221,319 $341,657 $0 $1,815,785
FTE 0.1 0.0 20.0 6.4 9.9 0.0 36.4
SDSM&T $1,725,035 $1,064,284 $14,406,203 $6,326,972 $5,431,152 $1,846,533 $30,800,179FTE 11.0 7.3 145.8 108.8 144.1 16.4 433.4
SDSU SDSU Proper $3,374,623 $5,586,844 $56,230,410 $33,296,979 $20,239,021 $2,422,732 $121,150,608
FTE 21.0 36.5 549.8 398.6 564.7 1.1 1,571.7 SDSU Extension $0 $375,540 $1,984,669 $6,388,810 $1,577,376 $56,771 $10,383,165
FTE 0.0 2.1 23.6 117.8 46.6 0.2 190.4 Ag Experiment Station $181,101 $373,184 $9,433,188 $6,391,327 $1,893,069 $70,819 $18,342,687
FTE 1.0 2.6 77.0 137.9 51.8 0.2 270.5 ADRDL $112,709 $26,203 $715,882 $458,891 $1,223,714 $0 $2,537,400
FTE 0.7 0.2 7.2 8.0 29.8 0.0 45.9
USD USD Proper $2,532,875 $2,424,859 $29,001,008 $17,316,075 $15,996,128 $3,313,410 $70,584,355
FTE 15.8 18.9 328.0 303.9 419.9 15.8 1,102.2 SSOM $1,035,166 $4,867,690 $12,493,624 $4,403,697 $3,139,257 $667,258 $26,606,693
FTE 3.9 19.8 136.1 78.0 87.2 1.6 326.5
SDSD $132,491 $82,592 $523,864 $440,909 $140,819 $0 $1,320,674FTE 0.0 1.0 13.5 6.0 4.0 0.0 24.5
SDSBVI $132,491 $75,544 $927,798 $353,087 $591,686 $183,124 $2,263,730FTE 1.0 1.0 17.0 8.8 19.2 1.7 48.6
Regents Central Office Executive Director $1,246,243 $0 $0 $1,218,718 $3,985 $60,333 $2,529,279
FTE 6.5 0.0 0.0 19.0 3.0 0.0 28.5 System Support $132,723 $0 $0 $906,314 $1,501,659 $92,142 $2,632,838
FTE 1.0 0.0 0.0 10.0 22.0 6.8 39.8
System Total $13,654,411 $17,357,747 $153,372,972 $95,646,397 $64,493,044 $12,200,513 $356,725,083FTE 83.1 118.6 1,661.2 1,478.8 1,737.3 61.4 5,140.4

Financial Resources Fiscal Year 2017
53
Note: System Support includes Regents Information Systems, System Issues (bonded indebtedness and leases, utilities, Executive Director’s system initiatives, college prep, system library initiative, system research initiative grants, and system scholarships), Enrollment Services Center, Electronic University Consortium, and South Dakota Library Network
Source: FY17 Operating Budgets
Budgeted Salaries/FTE by CategoryGeneral Funds FY17
Non-Instructional
AdministratorInstructional
Administrator FacultyProfessional/
TechnicalCivil
ServicePart-time
Temporary TotalBHSU $791,556 $113,782 $225,628 $2,495,809 $2,868,745 $401,401 $6,896,920
FTE 4.9 1.0 2.7 45.3 78.8 2.6 135.3
DSU $1,020,725 $681,464 $1,345,162 $1,879,736 $2,251,172 $165,762 $7,344,020FTE 6.9 8.9 11.4 34.8 61.7 0.0 123.6
NSU NSU Proper $964,320 $589,380 $1,547,937 $2,707,672 $2,722,688 $283,036 $8,815,033
FTE 7.2 5.5 21.1 47.2 70.5 0.0 151.5 NSU K-12 E-Learning $15,789 $0 $1,237,020 $221,319 $341,657 $0 $1,815,785
FTE 0.1 0.0 20.0 6.4 9.9 0.0 36.4
SDSM&T $1,307,377 $397,134 $4,685,145 $2,731,157 $3,375,636 $142,010 $12,638,459FTE 8.8 2.5 40.1 49.4 91.0 9.6 201.4
SDSU SDSU Proper $0 $980,877 $9,298,955 $7,915,227 $12,728,891 $789,517 $31,713,467
FTE 0.0 6.8 98.6 114.8 348.3 0.2 568.7 SDSU Extension $0 $330,452 $1,456,917 $3,913,862 $892,040 $3,746 $6,597,017
FTE 0.0 1.8 17.8 70.2 24.4 0.0 114.1 Ag Experiment Station $135,826 $288,608 $6,005,640 $1,639,234 $1,131,514 $31,505 $9,232,326
FTE 0.8 1.9 67.8 48.8 30.8 0.0 150.0 ADRDL $112,709 $26,203 $574,488 $137,556 $616,804 $0 $1,467,760
FTE 0.7 0.2 5.8 2.4 14.4 0.0 23.5
USD USD Proper $1,534,479 $697,353 $5,740,932 $9,084,666 $8,428,439 $700,452 $26,186,321
FTE 9.5 5.8 61.1 149.3 208.6 0.0 434.3 SSOM $1,035,166 $3,950,432 $6,840,606 $1,570,209 $2,277,375 $20,660 $15,694,448
FTE 3.9 15.1 74.7 23.0 62.4 1.2 180.2
SDSD $132,491 $82,592 $523,864 $440,909 $140,819 $0 $1,320,674FTE 0.0 1.0 13.5 6.0 4.0 0.0 24.5
SDSBVI $132,491 $75,544 $762,781 $326,797 $591,686 $183,124 $2,072,422FTE 1.0 1.0 15.0 8.3 19.2 1.7 46.1
Regents Central Office Executive Director $1,246,243 $0 $0 $1,196,147 $3,985 $60,333 $2,506,708
FTE 6.5 0.0 0.0 17.5 0.0 0.6 24.6 System Support $0 $0 $0 $112,658 $1,030,913 $8,297 $1,151,868
FTE 0.0 0.0 0.0 2.0 17.0 4.7 23.7
System Total $8,429,171 $8,213,819 $40,245,074 $36,372,959 $39,402,364 $2,789,842 $135,453,229FTE 50.2 51.6 449.5 625.1 1,040.9 20.5 2,237.9
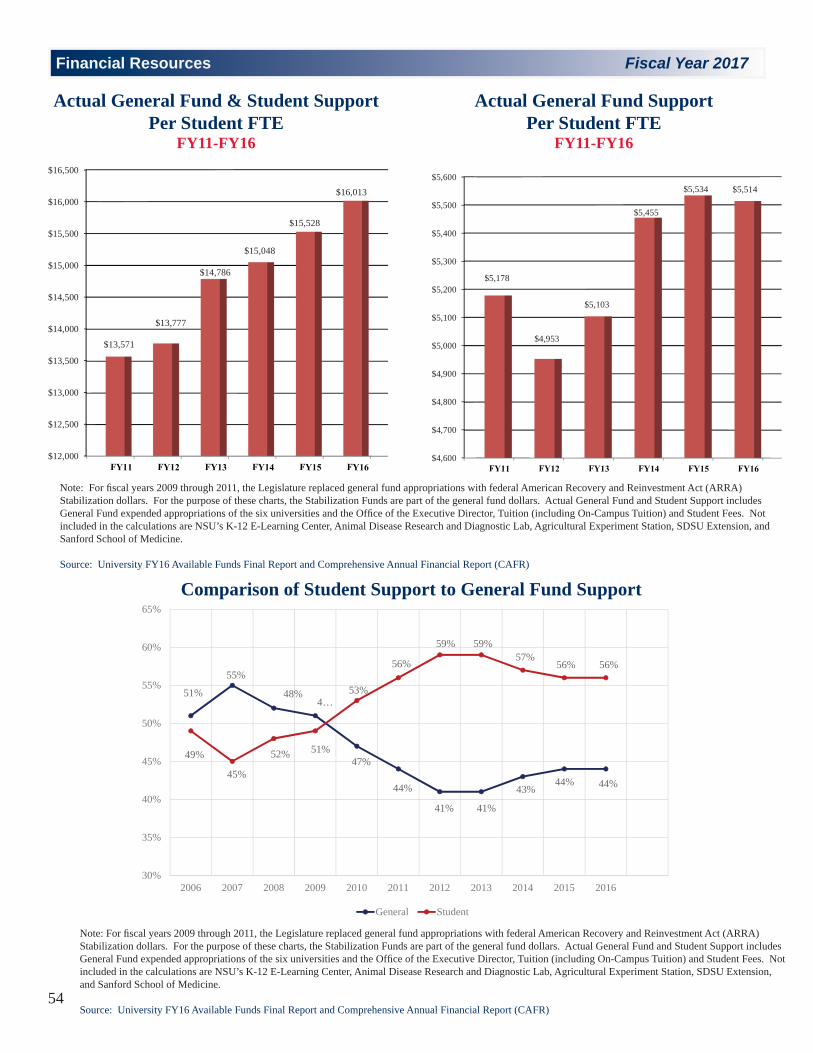
Financial Resources Fiscal Year 2017
54
51%
55%
52% 51%47%
44%
41% 41%
43%44% 44%
49%
45%
48%4…
53%
56%
59% 59%57%
56% 56%
30%
35%
40%
45%
50%
55%
60%
65%
2006 2007 2008 2009 2010 2011 2012 2013 2014 2015 2016
General Student
Note: For fi scal years 2009 through 2011, the Legislature replaced general fund appropriations with federal American Recovery and Reinvestment Act (ARRA) Stabilization dollars. For the purpose of these charts, the Stabilization Funds are part of the general fund dollars. Actual General Fund and Student Support includes General Fund expended appropriations of the six universities and the Offi ce of the Executive Director, Tuition (including On-Campus Tuition) and Student Fees. Not included in the calculations are NSU’s K-12 E-Learning Center, Animal Disease Research and Diagnostic Lab, Agricultural Experiment Station, SDSU Extension, and Sanford School of Medicine.
Source: University FY16 Available Funds Final Report and Comprehensive Annual Financial Report (CAFR)
Actual General Fund SupportPer Student FTE
FY11-FY16
Actual General Fund & Student Support Per Student FTE
FY11-FY16
Comparison of Student Support to General Fund Support
Note: For fi scal years 2009 through 2011, the Legislature replaced general fund appropriations with federal American Recovery and Reinvestment Act (ARRA) Stabilization dollars. For the purpose of these charts, the Stabilization Funds are part of the general fund dollars. Actual General Fund and Student Support includes General Fund expended appropriations of the six universities and the Offi ce of the Executive Director, Tuition (including On-Campus Tuition) and Student Fees. Not included in the calculations are NSU’s K-12 E-Learning Center, Animal Disease Research and Diagnostic Lab, Agricultural Experiment Station, SDSU Extension, and Sanford School of Medicine.
Source: University FY16 Available Funds Final Report and Comprehensive Annual Financial Report (CAFR)
$4,600
$4,700
$4,800
$4,900
$5,000
$5,100
$5,200
$5,300
$5,400
$5,500
$5,600
$5,178
$4,953
$5,103
$5,455
$5,534 $5,514
$12,000
$12,500
$13,000
$13,500
$14,000
$14,500
$15,000
$15,500
$16,000
$16,500
$13,571
$13,777
$14,786
$15,048
$15,528
$16,013

Financial Resources Fiscal Year 2017
55
Source: Appropriations from the Grapevine Study and population from the U.S. Census Bureau
SD Post-Secondary Education Appropriations of State Tax Funds Operational Expenses for Higher Education Per Capita FY16
SD Post-Secondary Educational Appropriations per FTE(Constant 2015 Dollars)
Source: State Higher Education Finance FY2015 Report
$0.00
$100.00
$200.00
$300.00
$400.00
$500.00
$600.00
$700.00
$800.00
MT ID SD IA MN NE ND WY
$241.33 $253.21 $258.68 $271.80$279.22
$393.73
$589.72
$715.14
FY2010 FY2014 FY20151 Year % Change
5 Year % Change
Idaho $8,570 $7,083 $7,379 4.2% -13.9%Iowa $5,985 $5,294 $5,515 4.2% -7.9%Minnesota $6,345 $5,379 $5,695 5.9% -10.2%Montana $4,931 $4,901 $5,248 7.1% 6.4%Nebraska $7,465 $7,855 $8,202 4.4% 9.9%North Dakota $6,375 $7,861 $7,766 -1.2% 21.8%South Dakota $5,403 $4,916 $5,062 3.0% -6.3%Wyoming $14,629 $15,820 $17,300 9.4% 18.3%
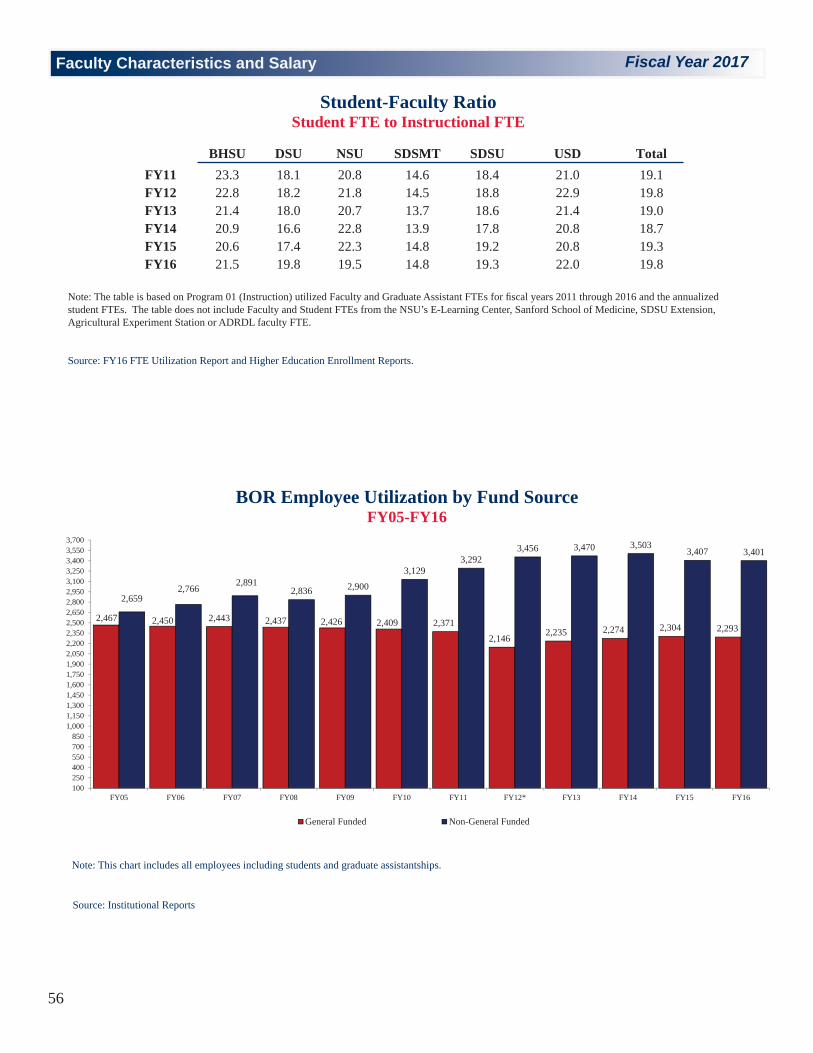
Faculty Characteristics and Salary Fiscal Year 2017
56
BOR Employee Utilization by Fund SourceFY05-FY16
Student-Faculty RatioStudent FTE to Instructional FTE
Source: Institutional Reports
Note: The table is based on Program 01 (Instruction) utilized Faculty and Graduate Assistant FTEs for fi scal years 2011 through 2016 and the annualized student FTEs. The table does not include Faculty and Student FTEs from the NSU’s E-Learning Center, Sanford School of Medicine, SDSU Extension, Agricultural Experiment Station or ADRDL faculty FTE.
Source: FY16 FTE Utilization Report and Higher Education Enrollment Reports.
Note: This chart includes all employees including students and graduate assistantships.
BHSU DSU NSU SDSMT SDSU USD TotalFY11 23.3 18.1 20.8 14.6 18.4 21.0 19.1FY12 22.8 18.2 21.8 14.5 18.8 22.9 19.8FY13 21.4 18.0 20.7 13.7 18.6 21.4 19.0FY14 20.9 16.6 22.8 13.9 17.8 20.8 18.7FY15 20.6 17.4 22.3 14.8 19.2 20.8 19.3FY16 21.5 19.8 19.5 14.8 19.3 22.0 19.8
2,467 2,450 2,443 2,437 2,426 2,409 2,3712,146 2,235 2,274 2,304 2,293
2,6592,766
2,8912,836 2,900
3,1293,292
3,456 3,470 3,5033,407 3,401
100250400550700850
1,0001,1501,3001,4501,6001,7501,9002,0502,2002,3502,5002,6502,8002,9503,1003,2503,4003,5503,700
FY05 FY06 FY07 FY08 FY09 FY10 FY11 FY12* FY13 FY14 FY15 FY16
General Funded Non-General Funded

Faculty Characteristics and Salary Fiscal Year 2017
57
-16.60%
-12.40%-9.80%
-8.30% -7.50% -8.00% -8.66% -7.72%-5.98% -5.59% -5.34% -5.04%
-7.57% -7.02% -6.22% -6.47% -6.03% -6.57% -5.93%
-16.60% -16.60% -17.23%-19.05% -20.07%
-21.95%-23.89% -24.40% -24.00% -25.15%
-26.49%-27.82%
-30.35% -29.80% -29.00%-30.93% -31.29%
-33.27% -33.85%
-40.00%
-35.00%
-30.00%
-25.00%
-20.00%
-15.00%
-10.00%
-5.00%
0.00%FY98 FY99 FY00 FY01 FY02 FY03 FY04 FY05 FY06 FY07 FY08 FY09 FY10 FY11 FY12 FY13 FY14 FY15 FY16
With Salary Comp. Projected Without Salary Comp.
Salary Competitiveness Plan
Salary Policy Average for Peer InstitutionsFY98-FY16
Note: Figures represent a 9-month contract. Source: BOR Human Resource Information System as of November 10, 2016.
Average Faculty Salaries by Professional RankFY17
Source: College and Universities Professional Association - Human Resources Salary Survey of Surrounding Peer Institutions
In 1998, the Board initiated a salary competitiveness program to increase the salaries for faculty and non-faculty exempt employees at all Regental institutions. This program was a strategic effort to compete with regional peers in the labor market. Institutions of higher education must be competitive in total compensation to successfully recruit and retain quality professional staff and faculty. As a part of its strategic efforts, the Board of Regents has utilized this program to attract and retain faculty and staff to ensure delivery of high quality education and limit turnover.
To initially address the situation, the Regents developed a three-year plan to increase the funds available for salary distribution by approximately 10 percent above the normal state salary adjustment. The 10 percent was generated with reductions in staffi ng levels by eliminating 114 positions, a redirection of general funds of $1.6 million to salaries, and an increase in student fees and ancillary charges for service. The three-year plan was completed in FY01 with salaries moving from 16.6 percent to within 8.3 percent of the similar faculty in surrounding states. In order to not lose ground gained by the salary competiveness plan, the Board has continued to increase student fees to bridge the gap between regional salaries and the salaries of SDBOR employees.
This past year (FY16), the salaries of the faculty and exempt staff trailed those of counterparts in regional markets at approximately 5.93 percent (based on the College of University and Professional Association for Human Resources Compensation Survey) and nationally at the rate of 26 percent (based on Oklahoma State University Compensation Survey).
Summary Professor Associate Professor Assistant Professor Instructor
BHSU 78,686 64,031 59,886 48,086DSU 97,997 75,916 69,064 46,856NSU 81,435 65,701 58,955 49,179SDSMT 110,990 85,336 75,302 55,148SDSU 96,101 79,813 72,989 54,134USD 99,949 74,659 70,297 50,562Sanford SOM 102,149 80,923 66,929 64,079
System 96,449 76,677 69,517 53,754

Faculty Characteristics and Salary Fiscal Year 2017
58
3.44%
3.09%
2.40%2.53%
2.92%
3.38%
4.09%
0.00%
0.50%
1.00%
1.50%
2.00%
2.50%
3.00%
3.50%
4.00%
4.50%
SD IA MN MT WY NE ND
Salary Policy Average for Surrounding States History FY99-FY17
Source: Surrounding area public institutions
Salary Policy Average Increase for Surrounding StatesFY17
3.20%
2.50%2.70%
2.00%
0.00%
3.0% 3.00%
0.00%
0.50%
1.00%
1.50%
2.00%
2.50%
3.00%
3.50%
4.00%
4.50%
SD IA MN MT WY NE ND

Faculty Characteristics and Salary Fiscal Year 2017
59
BHSU DSU NSU SDSMT SDSU USD System% of % of % of % of % of % of % of
# Total # Total # Total # Total # Total # Total # TotalAge35 or Younger 26 20.2% 23 23.2% 14 15.1% 23 15.4% 112 18.6% 81 18.6% 279 18.5%36 - 45 32 24.8% 20 20.2% 23 24.7% 42 28.2% 181 30.1% 132 30.3% 430 28.5%46 - 55 26 20.2% 36 36.4% 29 31.2% 41 27.5% 148 24.6% 107 24.5% 387 25.7%56 - 65 42 32.6% 18 18.2% 23 24.7% 32 21.5% 138 22.9% 99 22.7% 352 23.3%66 and over 3 2.3% 2 2.0% 4 4.3% 11 7.4% 23 3.8% 17 3.9% 60 4.0%
GenderFemale 56 43.4% 32 32.3% 37 39.8% 38 25.5% 279 46.3% 211 48.4% 653 43.3%Male 73 56.6% 67 67.7% 56 60.2% 111 74.5% 323 53.7% 225 51.6% 855 56.7%
RankInstructor 25 19.4% 34 34.3% 13 14.0% 23 15.4% 175 29.1% 132 30.3% 402 26.7%Assistant Professor 50 38.8% 26 26.3% 34 36.6% 47 31.5% 169 28.1% 114 26.1% 440 29.2%Associate Professor 22 17.1% 21 21.2% 22 23.7% 36 24.2% 101 16.8% 105 24.1% 307 20.4%Professor 32 24.8% 18 18.2% 24 25.8% 43 28.9% 157 26.1% 85 19.5% 359 23.8%
Highest Degree AttainedOther Accredited 0 0.0% 5 5.1% 0 0.0% 0 0.0% 0 0.0% 8 1.8% 13 0.9%Master 40 31.8% 40 40.4% 21 22.6% 20 13.4% 170 28.2% 138 31.7% 429 28.4%Doctor 89 68.3% 54 54.6% 72 77.4% 129 86.6% 432 71.8% 289 66.4% 1,065 70.4%
Terminal DegreeNon-Terminal Degree 38 29.5% 42 42.4% 16 17.2% 23 15.4% 143 23.8% 108 24.8% 370 24.5%Terminal Degree 91 68.2% 57 57.6% 77 82.8% 126 84.6% 459 76.2% 327 75.0% 1,137 75.2%
TenuredNon-Tenured 74 57.4% 66 66.7% 47 50.5% 78 52.3% 370 61.5% 275 63.1% 910 60.3%Tenured 55 42.6% 33 33.3% 46 49.5% 71 47.7% 232 38.5% 161 36.9% 598 39.7%
Ethnic OriginWhite 117 90.7% 88 88.9% 86 91.2% 126 84.6% 487 80.9% 362 83.0% 1,266 84.0%Black, Non-Hispanic 0 0.0% 0 0.0% 0 0.0% 1 0.7% 12 2.0% 9 2.1% 22 1.5%Hispanic 2 1.6% 1 1.0% 2 2.2% 2 1.3% 12 2.2% 14 3.2% 34 2.3%Asian or Pacific Islander 7 5.4% 10 10.1% 4 5.5% 17 11.4% 87 14.5% 43 9.9% 168 11.1%American Indian/Alaskan Native 3 2.3% 1 1.1% 1 1.1% 2 1.3% 3 0.5% 5 1.1% 15 1.0%Two or More Races 0 0.0% 0 0.0% 0 0.0% 1 0.7% 1 0.2% 3 0.7% 5 0.3%
Total 129 99 93 149 602 436 1,508
Note: This table includes all permanent and temporary benefi t eligible faculty employees greater than or equal to 0.5 FTE.
Source: BOR Human Resources Information System.
Faculty Profi le by UniversityFY17

Special Schools Fiscal Year 2017
60
SDSBVI SDSBVI SDSD SDSDFTE Average Salary FTE Average Salary
2014-2015 15 $46,917 11 $44,8172015-2016 15 $48,325 11 $44,6492016-2017 15 $49,870 11 $46,844
Faculty Salary History
South Dakota School for the Deaf (SDSD)
South Dakota School for the Blind & Visually Impaired (SDSBVI)
Source: BOR Human Resources and Finance System
SDSBVI offers a quality teaching and learning environment and outreach services. All 16 classroom teachers and outreach vision consultants have South Dakota teaching and teachers of the visually impaired certifi cates. In addition, 10 teachers possess a master’s degree, one has a doctorate, fi ve have national certifi cation in orientation and mobility, three have national certifi cation in low vision, and one has a certifi cate of clinical competence in speech/language pathology. SBSBVI meets all state standards, has maintained voluntary regional accreditation for over 20 years, and recently received reaccreditation by AdvancED (a leading accreditor of Pre-K-12 schools and school systems). SDSBVI offers two educational environments. Students served on campus in Aberdeen during the school year receive an academic curriculum, including special education and the expanded core curriculum or skills of blindness. Public school students attend SDSBVI during the summer to learn the specialized skills of blindness they need for independence. SDSBVI serves children, parents, and teachers across South Dakota. Public school students with vision loss receive comprehensive functional vision, academic, cognitive, social, emotional, behavioral, and speech-language educational evaluations performed by expert staff. Transition evaluations are also available. After students complete evaluations, SDSBVI personnel provide assistance with instructional design using materials and methods designed to support children who are blind or visually impaired. Outreach vision consultants provide on-site public school assistance to students and home visits for families with young children. Services include staff training, technical assistance, educational material loans, and development of Individualized Family Service Plan (IFSP), Individualized Education Programs (IEP), or 504 Plans (as necessitated by Section 504 of the Rehabilitation Act of 1973).
SDSD offers quality outreach services. All 10 outreach deaf consultants have South Dakota teaching certifi cates. In addition, seven possess a master’s degree, one has a certifi cate of clinical competence in speech/language pathology, and nine have national certifi cation in deaf education (CED). All three audiologists are licensed by the state of South Dakota and certifi ed by ASHA (Audiology, Speech, Hearing Association); one has a master’s degree and two are doctors of audiology. SDSD offers a supported educational environment and serves children, parents, and teachers across South Dakota. Students who are deaf or hard of hearing receive comprehensive educational evaluations administered by staff with expertise in language development and hearing technologies, such as hearing aids, FM systems, bahas, and cochlear implants. Areas assessed include audiology, academic, cognitive, social, emotional, behavioral, speech-listening-language, and American Sign Language. Transition evaluations are also available. After students complete evaluations, SDSD personnel provide assistance with instructional design using materials and methods designed to support children who are deaf or hard of hearing. The Harrisburg School District offers instruction in the bilingual program. Diagnostic audiological screening and evaluation are available for children (birth to 21 years) in South Dakota. Screening and evaluation locations include the SDSD campus, the new audiology clinic in Rapid City, and the Mobile Diagnostic Hearing Lab (available across the state of South Dakota as scheduled). Outreach consultants provide early intervention, home-based services for children who are deaf or hard of hearing and their families. Services include information on hearing status, assistive technology, language development, and communication options. Outreach consultants also provide school-based services to students receiving educational services through any school program and will provide training and support to school professionals working with deaf or hard of hearing students. Services include staff training, technical assistance, and participation in development of an IFSP, IEP, or 504 Plan.

Special Schools Fiscal Year 2017
61
Specialized Instructional Programs
The South Dakota School for the Blind and Visually Impaired and the South Dakota School for the Deaf provide direct educational programs in two locations.
1. Students with vision loss whose parents/schools determine they need academic or special education instruction and the skills of blindness (Expanded Core Curriculum) are served on the SDSBVI campus in Aberdeen.
2. Students identifi ed as deaf or hard of hearing whose parents/schools prefer an American Sign Language approach to education are served under a contract with the Harrisburg School District.
The South Dakota School for the Blind and Visually Impaired and the South Dakota School for the Deaf have well-trained and experienced staff with expertise to meet the unique learning needs of children with vision or hearing loss. Using a general fund appropriation, services are provided to parents of young children and local school districts throughout the state at no charge. These services provide the fl exibility to serve young children in their own communities. Consultations, lending libraries, educational evaluations, and hearing screenings are valuable resources provided by the state of South Dakota to improve learning for children with vision loss or hearing loss.
Source: South Dakota School for the Blind and Visually Impaired and South Dakota School for the Deaf
SDSBVI and SDSD EnrollmentCampus and Outreach
SDSD SDSDCounty Campus Outreach Outreach County Campus Outreach OutreachAurora 0 0 3 Jerauld 0 2 3Beadle 0 9 19 Jones 0 0 0Bennett 0 0 5 Kingsbury 0 2 8Bon Homme 0 3 6 Lake 0 4 4Brookings 0 10 16 Lawrence 0 12 12Brown 8 15 9 Lincoln 0 11 32Brule 0 2 0 Lyman 0 0 2Buffalo 1 0 2 Marshall 0 2 3Butte 1 1 10 McCook 0 2 8Campbell 0 1 1 McPherson 0 0 3Charles Mix 1 2 11 Meade 0 4 13Clark 0 2 2 Mellette 0 1 1Clay 1 0 7 Miner 0 0 0Codington 0 6 11 Minnehaha 1 39 119Corson 0 0 4 Moody 0 4 0Custer 0 1 3 Pennington 0 7 36Davison 0 3 9 Perkins 0 1 2Day 0 1 3 Potter 1 1 2Deuel 0 0 2 Roberts 1 4 5Dewey 0 2 14 Sanborn 1 0 2Douglas 0 0 0 Oglala Lakota 0 10 18Edmunds 0 2 2 Spink 1 10 7Fall River 0 1 7 Stanley 0 1 1Faulk 0 4 1 Sully 0 2 0Grant 0 1 5 Todd 0 2 4Gregory 0 0 0 Tripp 0 1 1Haakon 0 2 1 Turner 0 3 7Hamlin 0 7 6 Union 0 6 10Hand 1 3 3 Walworth 0 0 0Hanson 0 0 3 Yankton 1 1 10Harding 0 0 1 Ziebach 0 0 2Hughes 0 4 18 SUBTOTALS 19 216 506Hutchinson 0 1 6 Out of State 2 0 0Hyde 0 1 0Jackson 0 0 1 TOTALS 21 216 506
SDSBVI SDSBVI
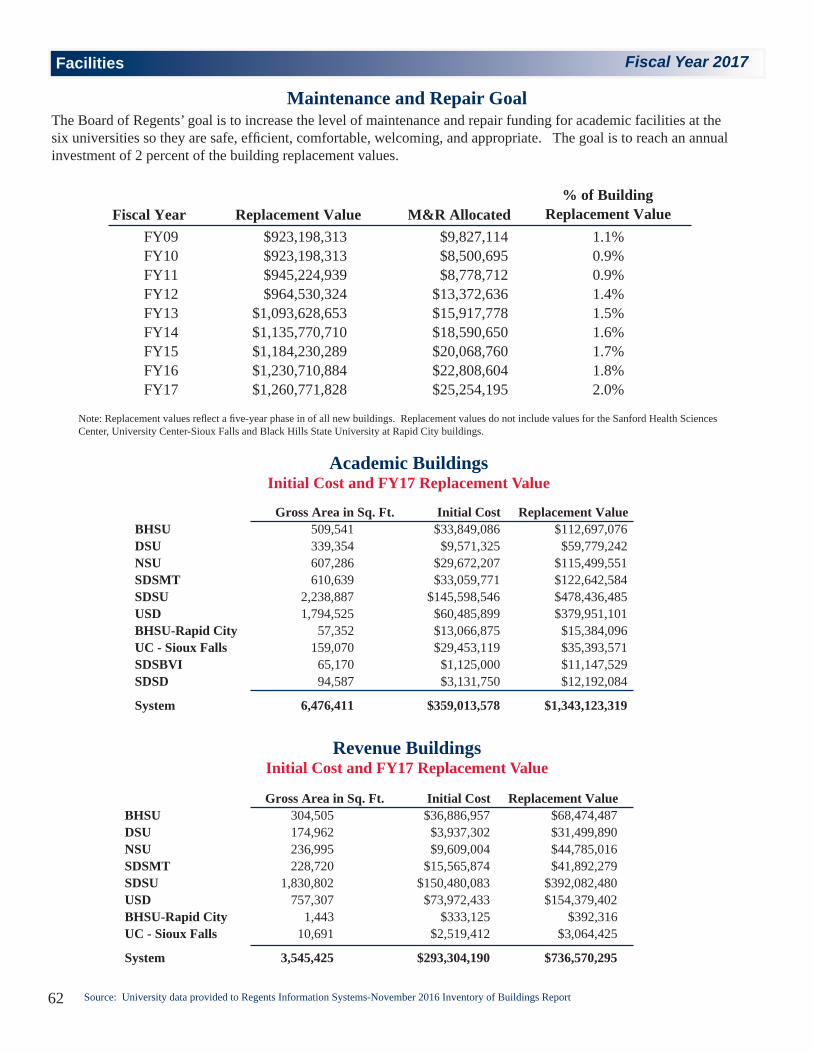
Facilities Fiscal Year 2017
62
Fiscal Year Replacement Value M&R AllocatedFY09 $923,198,313 $9,827,114 1.1%FY10 $923,198,313 $8,500,695 0.9%FY11 $945,224,939 $8,778,712 0.9%FY12 $964,530,324 $13,372,636 1.4%FY13 $1,093,628,653 $15,917,778 1.5%FY14 $1,135,770,710 $18,590,650 1.6%FY15 $1,184,230,289 $20,068,760 1.7%FY16 $1,230,710,884 $22,808,604 1.8%FY17 $1,260,771,828 $25,254,195 2.0%
% of Building Replacement Value
Academic BuildingsInitial Cost and FY17 Replacement Value
Revenue BuildingsInitial Cost and FY17 Replacement Value
Source: University data provided to Regents Information Systems-November 2016 Inventory of Buildings Report
Maintenance and Repair Goal
Note: Replacement values refl ect a fi ve-year phase in of all new buildings. Replacement values do not include values for the Sanford Health Sciences Center, University Center-Sioux Falls and Black Hills State University at Rapid City buildings.
The Board of Regents’ goal is to increase the level of maintenance and repair funding for academic facilities at the six universities so they are safe, effi cient, comfortable, welcoming, and appropriate. The goal is to reach an annual investment of 2 percent of the building replacement values.
Gross Area in Sq. Ft. Initial Cost Replacement ValueBHSU 509,541 $33,849,086 $112,697,076DSU 339,354 $9,571,325 $59,779,242NSU 607,286 $29,672,207 $115,499,551SDSMT 610,639 $33,059,771 $122,642,584SDSU 2,238,887 $145,598,546 $478,436,485USD 1,794,525 $60,485,899 $379,951,101BHSU-Rapid City 57,352 $13,066,875 $15,384,096UC - Sioux Falls 159,070 $29,453,119 $35,393,571SDSBVI 65,170 $1,125,000 $11,147,529SDSD 94,587 $3,131,750 $12,192,084
System 6,476,411 $359,013,578 $1,343,123,319
Gross Area in Sq. Ft. Initial Cost Replacement ValueBHSU 304,505 $36,886,957 $68,474,487DSU 174,962 $3,937,302 $31,499,890NSU 236,995 $9,609,004 $44,785,016SDSMT 228,720 $15,565,874 $41,892,279SDSU 1,830,802 $150,480,083 $392,082,480USD 757,307 $73,972,433 $154,379,402BHSU-Rapid City 1,443 $333,125 $392,316UC - Sioux Falls 10,691 $2,519,412 $3,064,425
System 3,545,425 $293,304,190 $736,570,295
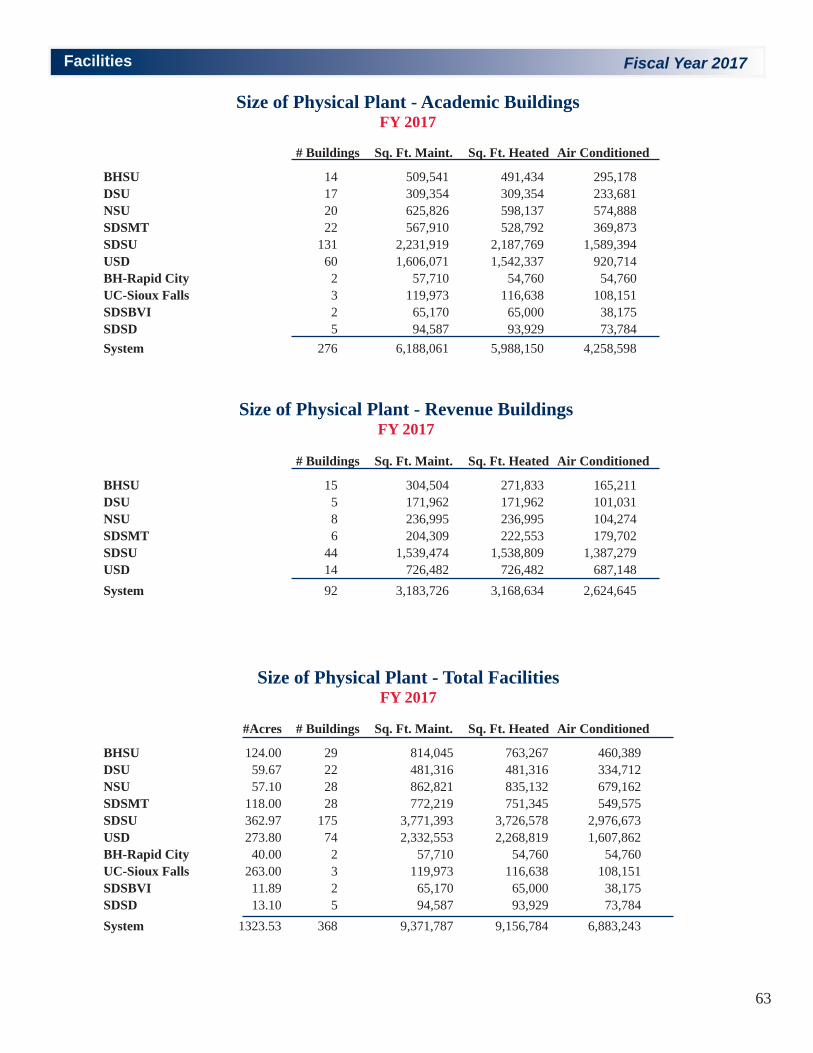
Facilities Fiscal Year 2017
63
Size of Physical Plant - Revenue BuildingsFY 2017
Size of Physical Plant - Academic BuildingsFY 2017
Size of Physical Plant - Total FacilitiesFY 2017
#Acres # Buildings Sq. Ft. Maint. Sq. Ft. Heated Air Conditioned
BHSU 124.00 29 814,045 763,267 460,389DSU 59.67 22 481,316 481,316 334,712NSU 57.10 28 862,821 835,132 679,162SDSMT 118.00 28 772,219 751,345 549,575SDSU 362.97 175 3,771,393 3,726,578 2,976,673USD 273.80 74 2,332,553 2,268,819 1,607,862BH-Rapid City 40.00 2 57,710 54,760 54,760UC-Sioux Falls 263.00 3 119,973 116,638 108,151SDSBVI 11.89 2 65,170 65,000 38,175SDSD 13.10 5 94,587 93,929 73,784System 1323.53 368 9,371,787 9,156,784 6,883,243
# Buildings Sq. Ft. Maint. Sq. Ft. Heated Air Conditioned
BHSU 14 509,541 491,434 295,178DSU 17 309,354 309,354 233,681NSU 20 625,826 598,137 574,888SDSMT 22 567,910 528,792 369,873SDSU 131 2,231,919 2,187,769 1,589,394USD 60 1,606,071 1,542,337 920,714BH-Rapid City 2 57,710 54,760 54,760UC-Sioux Falls 3 119,973 116,638 108,151SDSBVI 2 65,170 65,000 38,175SDSD 5 94,587 93,929 73,784System 276 6,188,061 5,988,150 4,258,598
# Buildings Sq. Ft. Maint. Sq. Ft. Heated Air Conditioned
BHSU 15 304,504 271,833 165,211DSU 5 171,962 171,962 101,031NSU 8 236,995 236,995 104,274SDSMT 6 204,309 222,553 179,702SDSU 44 1,539,474 1,538,809 1,387,279USD 14 726,482 726,482 687,148System 92 3,183,726 3,168,634 2,624,645
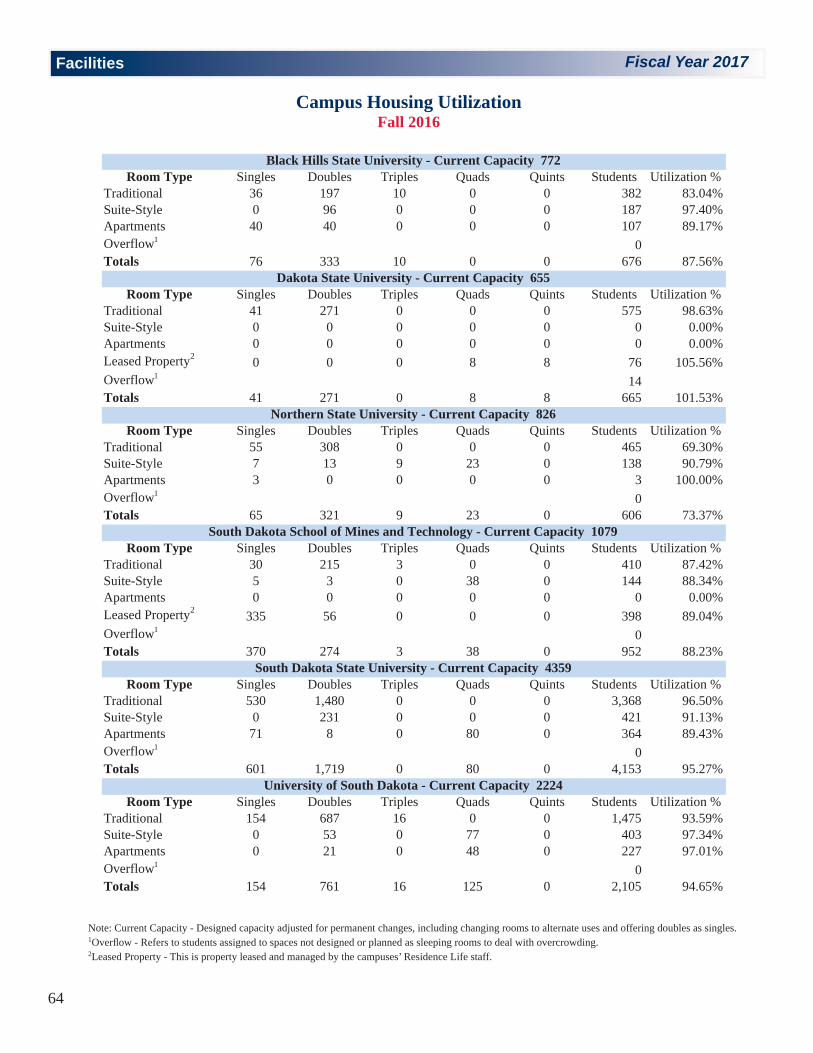
Facilities Fiscal Year 2017
64
Campus Housing UtilizationFall 2016
Note: Current Capacity - Designed capacity adjusted for permanent changes, including changing rooms to alternate uses and offering doubles as singles. 1Overfl ow - Refers to students assigned to spaces not designed or planned as sleeping rooms to deal with overcrowding.2Leased Property - This is property leased and managed by the campuses’ Residence Life staff.
Room Type Singles Doubles Triples Quads Quints Students Utilization %Traditional 36 197 10 0 0 382 83.04%Suite-Style 0 96 0 0 0 187 97.40%Apartments 40 40 0 0 0 107 89.17%Overflow1 0Totals 76 333 10 0 0 676 87.56%
Room Type Singles Doubles Triples Quads Quints Students Utilization %Traditional 41 271 0 0 0 575 98.63%Suite-Style 0 0 0 0 0 0 0.00%Apartments 0 0 0 0 0 0 0.00%Leased Property2 0 0 0 8 8 76 105.56%Overflow1 14Totals 41 271 0 8 8 665 101.53%
Room Type Singles Doubles Triples Quads Quints Students Utilization %Traditional 55 308 0 0 0 465 69.30%Suite-Style 7 13 9 23 0 138 90.79%Apartments 3 0 0 0 0 3 100.00%Overflow1 0Totals 65 321 9 23 0 606 73.37%
Room Type Singles Doubles Triples Quads Quints Students Utilization %Traditional 30 215 3 0 0 410 87.42%Suite-Style 5 3 0 38 0 144 88.34%Apartments 0 0 0 0 0 0 0.00%Leased Property2 335 56 0 0 0 398 89.04%Overflow1 0Totals 370 274 3 38 0 952 88.23%
Room Type Singles Doubles Triples Quads Quints Students Utilization %Traditional 530 1,480 0 0 0 3,368 96.50%Suite-Style 0 231 0 0 0 421 91.13%Apartments 71 8 0 80 0 364 89.43%Overflow1 0Totals 601 1,719 0 80 0 4,153 95.27%
Room Type Singles Doubles Triples Quads Quints Students Utilization %Traditional 154 687 16 0 0 1,475 93.59%Suite-Style 0 53 0 77 0 403 97.34%Apartments 0 21 0 48 0 227 97.01%Overflow1 0Totals 154 761 16 125 0 2,105 94.65%
Black Hills State University - Current Capacity 772
Dakota State University - Current Capacity 655
University of South Dakota - Current Capacity 2224
Northern State University - Current Capacity 826
South Dakota School of Mines and Technology - Current Capacity 1079
South Dakota State University - Current Capacity 4359

Facilities Fiscal Year 2017
65
Original Interest & TotalRetirement Bond Principal Fees Amount
Institution Series Date Issue Outstanding Outstanding Outstanding
BLACK HILLS STATE UNIVERSITYInfrastructure Upgrades Series 2007 6/1/27 $648,000 $406,228 $123,914 $530,142
DAKOTA STATE UNIVERSITYInfrastructure Upgrades Series 2007 6/1/27 $380,000 $238,216 $72,664 $310,880
SOUTH DAKOTA SCHOOL OF MINES & TECHNOLOGYInfrastructure Upgrades Series 2007 6/1/27 $400,000 $250,758 $76,490 $327,248
SOUTH DAKOTA STATE UNIVERSITYInfrastructure Upgrades Series 2007 6/1/27 $4,862,000 $3,047,948 $929,731 $3,977,679Cow/Calf Series 2013B 6/1/38 $1,902,302 $1,780,920 $1,279,443 $3,060,363Football Stadium Series 2014A 6/1/39 $33,910,000 $33,910,000 $25,660,722 $59,570,722
$40,674,302 $38,738,867 $27,869,896 $66,608,763
UNIVERSITY OF SOUTH DAKOTAOld Main Series 1997 6/1/21 $2,463,000 $788,000 $141,902 $929,902Dakota Dome Roof Series 2000 9/1/24 $6,505,000 $3,500,000 $1,035,876 $4,535,876Infrastructure Upgrades Series 2007 6/1/27 $2,300,000 $1,441,850 $439,815 $1,881,665Arena Series 2013B/C 6/1/33 $21,260,371 $19,305,982 $10,603,057 $29,909,039
$32,528,371 $25,035,832 $12,220,649 $37,256,482
GRAND TOTAL $74,630,673 $64,669,901 $40,363,613 $105,033,515
Campus Housing Utilization HistoryFall 2012 thru Fall 2016
Campus Funded South Dakota Building Authority LeasesAs of June 30, 2016
Fall 2012 Fall 2013 Fall 2014 Fall 2015 Fall 2016
BHSU 92.93% 99.37% 89.41% 84.08% 87.56%DSU 85.89% 90.41% 86.26% 93.59% 101.53%NSU 97.22% 91.50% 82.65% 76.94% 73.37%SDSMT 100.59% 102.96% 98.55% 99.55% 88.23%SDSU 99.24% 97.82% 95.43% 92.29% 95.27%USD 99.86% 98.96% 98.82% 98.43% 94.65%
System 97.81% 97.58% 94.29% 92.48% 92.36%

Facilities Fiscal Year 2017
66
Original TotalRetirement Bond Principal Interest Amount
Institution Series Date Issue Outstanding Outstanding 1 Outstanding
BLACK HILLS STATE UNIVERSITYParking Lot Improvement Series 2006 4/1/2026 $1,270,000 $780,000 $177,184 $957,184Student Union Expansion Series 2007 10/1/2028 $8,150,000 $5,980,000 $1,633,868 $7,613,868Crow Peak Hall and Refinance Series 2004 Series 2014A 4/1/2039 $10,220,000 $9,410,000 $5,241,100 $14,651,100Refinance of Series 2004A Series 2014B 4/1/2026 $1,825,000 $1,555,000 $449,250 $2,004,250
$21,465,000 $17,725,000 $7,501,402 $25,226,402
DAKOTA STATE UNIVERSITYExisting Residence Hall Renovations Series 2007 10/1/2028 $390,000 $285,000 $77,115 $362,115Residence Hall Renovations Series 2008A 4/1/2028 $4,770,000 $3,280,000 $884,252 $4,164,252Refinance of Series 2004A Series 2014B 4/1/2025 $1,695,000 $1,415,000 $367,450 $1,782,450Renov. Of Trojan Center and Renov of Hospital Series 2015 4/1/2040 $10,920,000 $10,920,000 $8,012,850 $18,932,850
$17,775,000 $15,900,000 $9,341,667 $25,241,667
NORTHERN STATE UNIVERSITYKramer Hall Renovation Series 2008B 4/1/2028 $1,095,000 $795,000 $254,573 $1,049,573Kramer Hall Renovation Series 2009 4/1/2034 $1,440,000 $1,140,000 $729,369 $1,869,369Student Union Renovation and Expansion Series 2011 4/1/2036 $5,780,000 $5,185,000 $2,825,300 $8,010,300Refinance of Series 2004A Series 2014B 4/1/2029 $3,770,000 $3,325,000 $1,265,650 $4,590,650
$12,085,000 $10,445,000 $5,074,892 $15,519,892
SOUTH DAKOTA SCHOOL OF MINES & TECHNOLOGYSurbeck Center Renovation Series 2008B 4/1/2028 $4,135,000 $3,000,000 $958,458 $3,958,458Surbeck Center Renov. and Connolly & Palmerton Halls Renovation Series 2009 4/1/2034 $10,140,000 $8,690,000 $5,542,006 $14,232,006Wellness Center Series 2014A 4/1/2039 $6,820,000 $6,505,000 $4,200,700 $10,705,700Refinance of Series 2003 Series 2014B 4/1/2033 $6,470,000 $5,890,000 $2,968,100 $8,858,100
$27,565,000 $24,085,000 $13,669,264 $37,754,264
SOUTH DAKOTA STATE UNIVERSITYResidence Hall, Food Service, Wellness Center Series 2006 4/1/2026 $7,745,000 $4,770,000 $1,086,820 $5,856,820New Residence Hall; Mathews Renov.; Dining Addition; Parking Series 2009 4/1/2034 $34,270,000 $27,310,000 $17,401,288 $44,711,288New Residence Hal, Student Union Addition, Parking Series 2011 4/1/2036 $57,700,000 $53,035,000 $28,888,344 $81,923,344Remodel Brown Hall and Refinance Series 2004 Series 2014A 4/1/2025 $22,865,000 $19,720,000 $5,118,600 $24,838,600Refinance of Series 2005A Series 2015 4/1/2030 $1,940,000 $1,870,000 $720,050 $2,590,050
$124,520,000 $106,705,000 $53,215,102 $159,920,102
UNIVERSITY OF SOUTH DAKOTAWellness Center & Coyote Village Series 2009 4/1/2039 $44,475,000 $38,335,000 $30,018,759 $68,353,759Refinance of Series 2003 Series 2013A 4/1/2028 $11,990,000 $10,120,000 $2,649,000 $12,769,000Refinance of Series 2005A Series 2015 4/1/2030 $9,665,000 $9,325,000 $3,602,450 $12,927,450
$66,130,000 $57,780,000 $36,270,209 $94,050,209
GRAND TOTAL $269,540,000 $232,640,000 $125,072,536 $357,712,536
Auxiliary System Bonded DebtAs of June 30, 2016
Source: University Data
Note: 1 The Interest Outstanding assumes the bonds will be held to maturity and not refi nanced.

Facilities Fiscal Year 2017
67
Original Interest & TotalRetirement Bond Principal Fees Amount
Institution Series Date Issue Outstanding Outstanding Outstanding
BLACK HILLS STATE UNIVERSITYAcademic Facility Series 2002 9/1/26 $2,500,000 $1,477,500 $510,157 $1,987,657Woodburn Hall Series 2010A 6/1/27 $5,400,000 $3,687,630 $1,256,001 $4,943,631M&R Bond Series 2011 6/1/26 $1,172,080 $854,945 $231,452 $1,086,397Jonas Science Series 2013B 6/1/38 $1,188,934 $1,113,243 $800,619 $1,913,862Infrastructure Upgrade Series 2013B 6/1/38 $3,804,588 $3,562,369 $2,468,711 $6,031,081
$17,979,161 $10,695,687 $5,266,940 $15,962,628DAKOTA STATE UNIVERSITYCommunity Center Series 1999 9/1/19 $1,515,000 $433,390 $60,681 $494,071Technology Building Series 2002 9/1/26 $2,500,000 $1,477,500 $510,157 $1,987,657Infrastructure Upgrade Series 2010A 6/1/27 $3,000,000 $2,048,685 $697,779 $2,746,464Infrastructure Upgrade Series 2013B 6/1/38 $1,212,712 $1,135,502 $786,900 $1,922,402
Series 2015 6/1/40 $5,421,928 $5,314,785 $4,201,666 $9,516,451$13,649,640 $10,409,862 $6,257,183 $16,667,045
NORTHERN STATE UNIVERSITYTechnology Center Series 2005C 9/1/29 $6,940,000 $4,935,000 $1,899,710 $6,834,710Lincoln & Graham Hall Renovations Series 2010A 6/1/27 $3,000,000 $2,048,685 $697,779 $2,746,464M&R Bond Series 2011 6/1/26 $1,455,440 $1,061,635 $287,407 $1,349,042Johnson Fine Arts Series 2013B 6/1/38 $4,755,734 $4,452,972 $3,202,477 $7,655,450Infrastructure Upgrade Series 2013B 6/1/38 $570,688 $534,364 $370,313 $904,676
$16,721,863 $13,032,656 $6,457,686 $19,490,342SOUTH DAKOTA SCHOOL OF MINES & TECHNOLOGYEngineering Building Renovation Series 1999 9/1/19 $2,540,000 $726,610 $101,736 $828,346Library Renovation & Infrastructure Upgrade Series 2003A 9/1/28 $2,040,000 $1,303,415 $504,123 $1,807,538Infrastructure Upgrade Series 2013B 6/1/38 $2,606,142 $2,440,222 $1,691,067 $4,131,289
Series 2015 6/1/40 $5,458,072 $5,350,215 $4,229,674 $9,579,889$12,644,214 $9,820,462 $6,526,599 $16,347,061
SOUTH DAKOTA STATE UNIVERSITYBiostress Lab Series 1992 9/1/17 $230,000 $35,231 $3,546 $38,777Engineering Building Renovation Series 1999 9/1/19 $2,540,000 $726,610 $101,736 $828,346Shepard Hall Series 2007 6/1/32 $24,000,000 $18,207,194 $8,748,587 $26,955,781M&R Bond Series 2011 6/1/26 $5,628,560 $4,105,615 $1,111,477 $5,217,092Headhouse-Greenhouse Bldg/Architecture Bldg/Cow-Calf Bldg Series 2013B 6/1/38 $11,318,648 $10,598,037 $7,621,869 $18,219,907Infrastructure Upgrade Series 2013B 6/1/38 $6,658,028 $6,234,146 $4,320,245 $10,554,391
$50,375,236 $39,906,833 $21,907,460 $61,814,294UNIVERSITY OF SOUTH DAKOTALee Medical Building Series 2003A 9/1/28 $12,500,000 $7,986,588 $3,088,980 $11,075,568Business School and Slagle Hall Series 2007 6/1/32 $10,000,000 $7,586,331 $3,645,245 $11,231,576M&R Bond Series 2011 6/1/26 $4,623,920 $3,372,805 $913,090 $4,285,895Science-Health Center / Patterson Hall Series 2013B 6/1/38 $14,452,677 $13,532,524 $9,732,286 $23,264,811Infrastructure Upgrade Series 2013B 6/1/38 $7,609,175 $7,124,717 $4,937,408 $12,062,126
$49,185,772 $39,602,966 $22,317,009 $61,919,975UNIVERSITY CENTER - SIOUX FALLSGear Building Series 2006C 9/1/26 $2,000,000 $1,335,000 $449,797 $1,784,797Classroom Building Series 2007 6/1/32 $7,700,000 $5,841,475 $2,806,838 $8,648,313Science and Technology Building Series 2010B 6/1/35 $8,970,000 $8,970,000 $8,797,822 $17,767,822
$18,670,000 $16,146,475 $12,054,458 $28,200,932UNIVERSITY CENTER - RAPID CITYClassroom Building Series 2009 6/1/34 $13,585,000 $10,855,000 $8,136,669 $18,991,669
GRAND TOTAL $223,527,327 $179,715,371 $106,703,962 $286,419,333
South Dakota Building Authority HEFF Leases & Science Facility LeasesAs of June 30, 2016
Note -Bond Series 2000 and Bond Series 2007 are not listed above. The above totals do not include any Build America Bond Rebates.

Minimum Admission Requirements Fiscal Year 2017
68
All baccalaureate or general studies students under twenty-four (24) years of age, including students transferring with fewer than twenty-four (24) credit hours, must meet the following minimum high school course requirements with an average grade of “C”(2.0 on a 4.0 scale):
1. Four years of English - courses with major emphasis upon grammar, composition, or literary analysis; one year of debate instruction may be included to meet this requirement.
2. Three years of advanced mathematics -Algebra, geometry, trigonometry or other advanced mathematics including accelerated or honors mathematics (algebra) provided at the 8th grade level; not included are arithmetic, business, consumer or general mathematics or other similar courses.
3. Three years of laboratory science - courses in biology, chemistry, or physics in which at least one (1) regular laboratory period is scheduled each week. Accelerated or honors science (biology, physics or chemistry) provided in the 8th grade shall be accepted. Qualifying physical science courses (with lab) will be decided on a case-by-case basis.
4. Three years of social science - history, economics, sociology, geography, government—including U.S. and South Dakota, American Problems, etc.
5. One year of fi ne arts – art, theater, or music appreciation, analysis or performance.
Students who have not completed the minimum course requirements may demonstrate equivalent competency by attaining the following ACT (American College Testing) or Advanced Placement Examination scores:
English: ACT English sub-test score of 18 or above OR AP Language/Composition or Literature/Composition score of 3 or above.
Mathematics: ACT Mathematics sub-test score of 20 or above OR AP Calculus AB or Calculus BC score of 3 or above.
Science: ACT Science sub-test score of 17 or above OR AP Biology, Chemistry, Physics B score of 3 or above.
Social Science: ACT Social Studies/Reading sub-test score of 17 or above OR AP Microeconomics, Macroeconomics Comparative or United States Government and Policies,
European or United States History, or Psychology score of 3 or above.
Fine Arts: AP History of Art, Studio Art 9 drawing or general portfolio or Music Theory score of 3 or above.
In addition, students must meet at least ONE of the following criteria to be granted admission:
1. ACT (American College Testing) composite score of 18 or above.
2. Rank in the top 60% of high school graduating class.3. High school grade point average (GPA) of at least 2.6
on a 4.0 scale.
Mathematics and English Placement
For English all incoming freshmen are placed into their initial courses according to their ACT Scores. For mathematics, placement is determined using a Math Index scores drawing upon both ACT and student GPA. Students without valid ACT scores or a high school GPA are required to take placement examinations.
Exception Group
Each university may admit a group of baccalaureate students, limited in size to 3% of the previous year’s freshmen class, at the discretion of the university.
Transfers to Baccalaureate Program
Students under twenty-four (24) years of age transferring into baccalaureate degree programs with fewer than 24 transfer credit hours must meet baccalaureate degree admissions requirements. Students with 24 or more transfer credit hours with a GPA of at least 2.0 may transfer at the discretion of the university.
Non-Traditional Students
Non-traditional students who are at least twenty-four (24) years of age or older and who have not previously attended college will be admitted in good standing if they have graduated from high school or have completed the GED with specifi ed scores.
Certifi cate and Associate Degree Programs
Students seeking admission to certifi cate and associate degree programs shall meet baccalaureate admissions requirements or demonstrate equivalency as provided above.
Note: The minimum requirements listed for admissions are condensed from actual Board Policy.
Minimum Admission Requirements