fleet operations - san diego
TRANSCRIPT
Fleet Operations

Page Intentionally Left Blank

Fleet Operations
- 247 - City of San DiegoFiscal Year 2018 Proposed Budget
Department Description
The Fleet Operations Department provides City departments with comprehensive fleet management services bysupplying a dependable fleet of over 4,200 vehicles and equipment in addition to the following functions:Acquisition, Disposition, and Up-Fitting, Maintenance and Repair of motive vehicles and equipment, Fuel Facilitiesand Fuel System Management, Car Wash Facilities, Metal Fabrication and Repair, Rental Fleet, and OperatorTraining.
The Department's mission is:
Provide our customers, the employees of the City of San Diego, with comprehensive fleet managementservices by delivering environmentally-friendly, safe, and dependable vehicles, equipment, and fuel
The Department's vision is:
An award-winning fleet recognized for its safety, dependability, and reduction of greenhouse gasses
Did you know?
• In Fiscal Year 2017, the Public Works Department's Fleet Services Division became the Fleet OperationsDepartment under the Internal Operations branch of the CIty of San Diego. This change reflected thecitywide mission of the Department to provide reliable fleet services and long-term planning for all Citydepartments.
• In accordance with the City of San Diego’s Climate Action Plan (CAP), which calls for a reduction ingreenhouse gas, the Department is analyzing potential conversions to zero emissions vehicles andalternative fuels. In 2016, the Fleet Operations Department added renewable diesel as a replacement fuelfor the existing diesel-powered heavy and medium duty fleet. Renewable diesel can reduce greenhouse

Fleet Operations
- 248 -City of San DiegoFiscal Year 2018 Proposed Budget
gas emissions by up to 80% when compared to petroleum diesel. More than 1,100 vehicles and equipment,or 25%, of the City's fleet is now powered by this renewable source.
• Connected with the CAP, the City is opening its first CNG filling station. The CNG station will be locatedat the Miramar Repair Facility and will serve as the fuel source for CNG refuse packers.
• In April 2017, the City opened its first CNG filling station. The CNG station is located at the MiramarRepair Facility and will serve as the fuel source for CNG refuse packers.
• In August 2016, the City of San Diego entered into an agreement with Carolina Software Technologies(CST) to upgrade the existing fleet asset management system. The upgrade of the system will allow forimproved metrics which will drive operational efficiencies, improved vehicle reliability, and high qualityservice to all departments.
Goals and Objectives
Goal 1: Provide quality fleet services efficiently and economically
• Provide excellent customer service
• Improve communications to our customers
• Provide reliable vehicles
Goal 2: Advance a Green Fleet program
• Reduce greenhouse gas emissions
• Advance the knowledge of alternative fuel options
Goal 3: Continue to develop a trained and certified team of professionals
• Develop a new safety program
• Develop a new training program
Goal 4: Improve internal controls and accountability
• Improve internal fleet operations information system
• Improve policies and procedures
Key Performance Indicators
Performance IndicatorFY2016 Target
FY2016 Actual
FY2017 Target
FY2017 Estimate
FY2018 Target
1. Percentage of fleet within designated lifecycle1 N/A N/A N/A N/A > 85%
2. Number of low or zero-emission vehicles in fleet1 N/A N/A N/A N/A > 100%
3. Number of OSHA reportable injuries1 N/A N/A N/A N/A 0
4. Completion of scheduled preventative
maintenance on time1 N/A N/A N/A N/A > 95%
5. Maintain availability of Priority 1 vehicles1 N/A N/A N/A N/A > 95%
1. The Fleet Operations Department was created in Fiscal Year 2017 and key performance indicators were not yetcreated. As such, prior year data is not available.

Fleet Operations
- 249 - City of San DiegoFiscal Year 2018 Proposed Budget
Fleet Services Operating Fund1
Department SummaryFY2016Actual
FY2017Budget
FY2018Proposed
FY2017–2018Change
FTE Positions (Budgeted) 0.00 0.00 206.00 206.00Personnel Expenditures $ - $ - $ 21,400,631 $ 21,400,631Non-Personnel Expenditures - - 78,623,676 78,623,676
Total Department Expenditures $ - $ - $ 100,024,307 $ 100,024,307Total Department Revenue $ - $ - $ 84,625,920 $ 84,625,920
1. Beginning in Fiscal Year 2018, the Fleet Services Operating Fund is now budgeted in the Fleet OperationsDepartment. As a result, Fiscal Year 2016 actuals and Fiscal Year 2017 budget are reflected in the InternalOperations Department.
Department Expenditures FY2016Actual
FY2017Budget
FY2018Proposed
FY2017–2018Change
Fleet Administration $ - $ - $ 11,211,347 $ 11,211,347Fleet Maintenance - - 46,039,214 46,039,214
Total $ - $ - $ 57,250,561 $ 57,250,561
Department Personnel FY2016Budget
FY2017Budget
FY2018Proposed
FY2017–2018Change
Fleet Administration 0.00 0.00 33.00 33.00Fleet Maintenance 0.00 0.00 173.00 173.00
Total 0.00 0.00 206.00 206.00
Significant Budget Adjustments FTE Expenditures Revenue
Department RestructureRestructure of the Fleet Services Division to the new Fleet Operations Department.
207.00 $ 48,572,759 $ 50,769,656
Fire Fleet Repair FacilityAddition of 1.00 Fleet Manager and associated revenue and non-personnel expenditures for a new Fire Fleet Repair Facility.
1.00 7,034,712 3,400,000
Non-Discretionary AdjustmentAdjustment to expenditure allocations that are determined outside of the department's direct control. These allocations are generally based on prior year expenditure trends and examples of these include utilities, insurance, and rent.
0.00 4,061,377 -
Support for Information TechnologyAdjustment to expenditure allocations according to a zero-based annual review of information technology funding requirements.
0.00 1,460,451 -

Fleet Operations
- 250 -City of San DiegoFiscal Year 2018 Proposed Budget
Salary and Benefit AdjustmentsAdjustments to reflect savings resulting from vacant positions for any period of the fiscal year, retirement contributions, retiree health contributions, and labor negotiations.
0.00 12,853 -
Reclassification of PositionsAddition of 1.00 Business Systems Analyst offset by the reduction of 1.00 Information Systems Analyst 4 to better align the position classification with services of the Department.
0.00 (2,085) -
Reduction of Non-Personnel ExpendituresReduction of non-personnel expenditures associated with operational efficiencies.
(2.00) (1,898,362) -
Fuel AdjustmentsAdjustment of non-personnel expenditures and associated revenue to reflect revised gasoline and motor fuel costs.
0.00 (1,991,144) (1,991,144)
Revised RevenueAdjustment to reflect revised revenue projections.
0.00 - 499,395
IAM Reimbursable RevenueAdjustment to reflect revised revenue projections for reimbursement of SAP Infrastructure Asset Management (IAM) project labor.
0.00 - 65,317
Total 206.00 $ 57,250,561 $ 52,743,224
Expenditures by Category FY2016Actual
FY2017Budget
FY2018Proposed
FY2017–2018Change
PERSONNELPersonnel Cost $ - $ - $ 11,487,093 $ 11,487,093Fringe Benefits - - 9,913,538 9,913,538
PERSONNEL SUBTOTAL - - 21,400,631 21,400,631
NON-PERSONNELSupplies $ - $ - $ 7,645,527 $ 7,645,527Contracts - - 15,967,601 15,967,601Information Technology - - 1,460,451 1,460,451Energy and Utilities - - 10,261,057 10,261,057Capital Expenditures - - 250,000 250,000Debt - - 265,294 265,294
NON-PERSONNEL SUBTOTAL - - 35,849,930 35,849,930Total $ - $ - $ 57,250,561 $ 57,250,561
Revenues by Category FY2016Actual
FY2017Budget
FY2018Proposed
FY2017–2018Change
Charges for Services $ - $ - $ 48,951,785 $ 48,951,785Other Revenue - - 391,439 391,439Transfers In - - 3,400,000 3,400,000
Total $ - $ - $ 52,743,224 $ 52,743,224
Significant Budget Adjustments (Cont’d)FTE Expenditures Revenue

Fleet Operations
- 251 - City of San DiegoFiscal Year 2018 Proposed Budget
Personnel Expenditures JobNumber Job Title / Wages
FY2016Budget
FY2017Budget
FY2018Proposed Salary Range Total
FTE, Salaries, and Wages
20000011 Account Clerk 0.00 0.00 3.00 $31,491 - $37,918 $ 108,995
20000088 Assistant Engineer-Mechanical 0.00 0.00 1.00 57,866 - 69,722 57,866
20000443 Assistant Fleet Technician 0.00 0.00 27.00 36,587 - 43,618 1,128,860
20000119 Associate Management Analyst 0.00 0.00 1.00 54,059 - 65,333 54,059
20000193 Body and Fender Mechanic 0.00 0.00 5.00 44,366 - 53,206 266,030
20001246 Business Systems Analyst 3 0.00 0.00 1.00 65,416 - 79,061 79,061
20001101 Department Director 0.00 0.00 1.00 59,155 - 224,099 157,000
20001168 Deputy Director 0.00 0.00 1.00 46,966 - 172,744 109,855
20000430 Equipment Operator 2 0.00 0.00 1.00 41,350 - 49,462 47,904
20000438 Equipment Painter 0.00 0.00 2.00 44,366 - 53,206 106,412
20000433 Equipment Trainer 0.00 0.00 1.00 47,570 - 57,533 57,426
21000191 Fleet Attendant 0.00 0.00 2.00 30,534 - 36,296 69,830
20000774 Fleet Manager 0.00 0.00 4.00 76,773 - 93,018 330,970
20000183 Fleet Parts Buyer 0.00 0.00 4.00 44,637 - 54,059 202,361
20000182 Fleet Parts Buyer Supervisor 0.00 0.00 1.00 51,355 - 62,442 62,442
20000062 Fleet Repair Supervisor 0.00 0.00 10.00 62,421 - 75,525 730,197
21000195 Fleet Team Leader 0.00 0.00 10.00 50,003 - 61,402 591,222
20000420 Fleet Technician 0.00 0.00 80.00 44,366 - 53,206 4,121,970
20000293 Information Systems Analyst 3 0.00 0.00 1.00 59,363 - 71,760 59,363
20000618 Machinist 0.00 0.00 1.00 46,134 - 55,266 55,266
20000439 Master Fleet Technician 0.00 0.00 17.00 47,715 - 57,158 952,800
20000644 Metal Fabrication Supervisor 0.00 0.00 2.00 54,309 - 65,666 119,975
20000445 Motive Service Technician 0.00 0.00 2.00 34,195 - 40,976 75,171
20000680 Payroll Specialist 2 0.00 0.00 1.00 34,611 - 41,787 41,787
20001222 Program Manager 0.00 0.00 1.00 46,966 - 172,744 108,000
20000847 Safety Officer 0.00 0.00 1.00 57,907 - 69,930 69,930
20000951 Stock Clerk 0.00 0.00 9.00 30,056 - 36,275 310,181
20000955 Storekeeper 1 0.00 0.00 4.00 34,611 - 41,517 165,650
20000970 Supervising Management Analyst 0.00 0.00 1.00 66,768 - 80,891 66,768
20001041 Training Supervisor 0.00 0.00 1.00 59,363 - 71,760 67,154
20001058 Welder 0.00 0.00 10.00 44,366 - 53,206 524,680
ASE Cert 47,008
ASE Damage Estimate 936
ASE Master Cert 200,273
Budgeted Vacancy Savings (325,185)
Class B 50,960
Collison Repair Cert 3,640
Exceptional Performance Pay-Classified 3,000
Night Shift Pay 145,457
Overtime Budgeted 412,853
Plant/Tank Vol Cert Pay 29,810

Fleet Operations
- 252 -City of San DiegoFiscal Year 2018 Proposed Budget
Fleet Services Replacement Fund1
Welding Certification 22,776
FTE, Salaries, and Wages Subtotal 0.00 0.00 206.00 $ 11,490,713
FY2016Actual
FY2017Budget
FY2018Proposed
FY2017–2018Change
Fringe BenefitsEmployee Offset Savings $ - $ - $ 23,132 $ 23,132Flexible Benefits - - 2,344,983 2,344,983Medicare - - 150,180 150,180Other Post-Employment Benefits - - 1,194,995 1,194,995Retiree Medical Trust - - 8,442 8,442Retirement 401 Plan - - 8,307 8,307Retirement ADC - - 4,633,157 4,633,157Retirement DROP - - 47,778 47,778Risk Management Administration - - 201,388 201,388Supplemental Pension Savings Plan - - 688,787 688,787Unemployment Insurance - - 18,897 18,897Workers' Compensation - - 593,492 593,492
Fringe Benefits Subtotal $ – $ – $ 9,913,538 $ 9,913,538
Total Personnel Expenditures $ 21,404,251
1. Beginning in Fiscal Year 2018, the Fleet Services Replacement Fund is now budgeted in the Fleet Opera-tions Department. As a result, Fiscal Year 2016 actuals and Fiscal Year 2017 budget are reflected in the Inter-nal Operations Department.
Department Expenditures FY2016Actual
FY2017Budget
FY2018Proposed
FY2017–2018Change
Vehicle Acquisition $ - $ - $ 42,773,746 $ 42,773,746Total $ - $ - $ 42,773,746 $ 42,773,746
Significant Budget Adjustments FTE Expenditures Revenue
Department RestructureRestructure of the Fleet Services Division to the new Fleet Operations Department.
0.00 $ 22,994,920 $ 29,225,898
Non-Discretionary AdjustmentAdjustment to expenditure allocations that are determined outside of the department's direct control. These allocations are generally based on prior year expenditure trends and examples of these include utilities, insurance, and rent.
0.00 11,094,531 -
Vehicle PurchasesAddition of non-personnel expenditures to reflect vehicle cash replacement funding based on Fleet's Five-Year Vehicle Replacement Schedule.
0.00 5,284,295 -
Personnel Expenditures (Cont’d)JobNumber Job Title / Wages
FY2016Budget
FY2017Budget
FY2018Proposed Salary Range Total
Fleet Operations
- 253 - City of San DiegoFiscal Year 2018 Proposed Budget
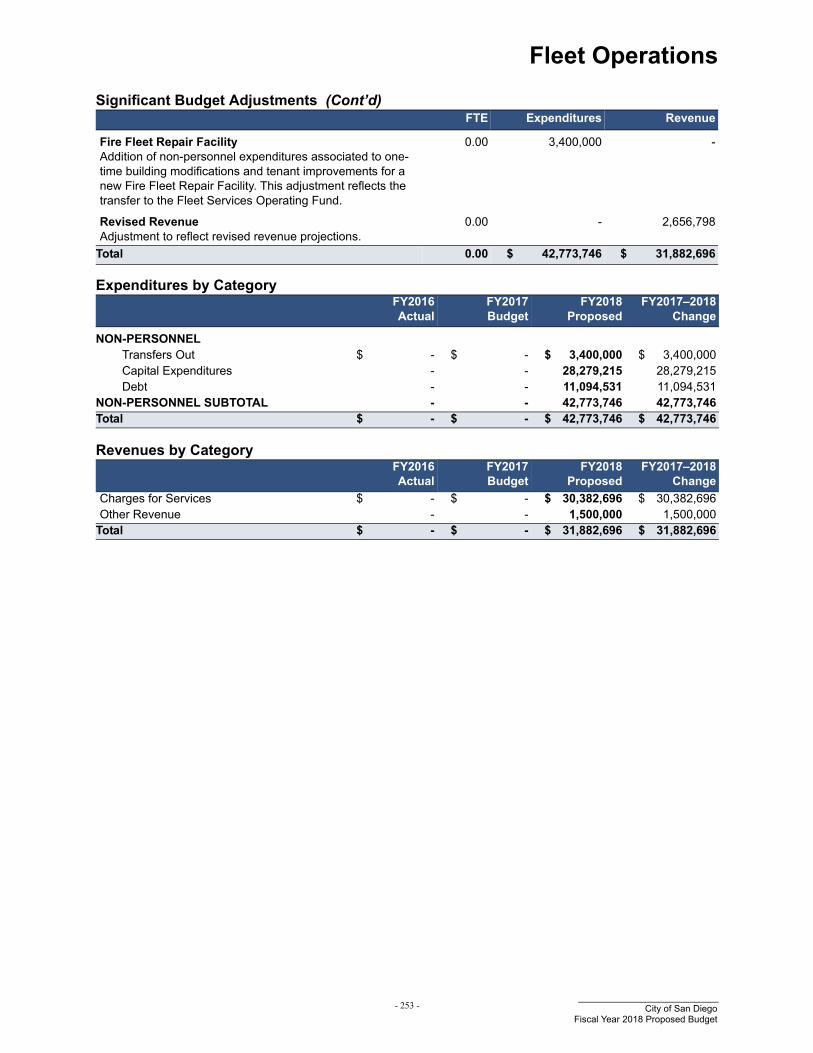
Fire Fleet Repair FacilityAddition of non-personnel expenditures associated to one-time building modifications and tenant improvements for a new Fire Fleet Repair Facility. This adjustment reflects the transfer to the Fleet Services Operating Fund.
0.00 3,400,000 -
Revised RevenueAdjustment to reflect revised revenue projections.
0.00 - 2,656,798
Total 0.00 $ 42,773,746 $ 31,882,696
Expenditures by Category FY2016Actual
FY2017Budget
FY2018Proposed
FY2017–2018Change
NON-PERSONNELTransfers Out $ - $ - $ 3,400,000 $ 3,400,000Capital Expenditures - - 28,279,215 28,279,215Debt - - 11,094,531 11,094,531
NON-PERSONNEL SUBTOTAL - - 42,773,746 42,773,746Total $ - $ - $ 42,773,746 $ 42,773,746
Revenues by Category FY2016Actual
FY2017Budget
FY2018Proposed
FY2017–2018Change
Charges for Services $ - $ - $ 30,382,696 $ 30,382,696Other Revenue - - 1,500,000 1,500,000
Total $ - $ - $ 31,882,696 $ 31,882,696
Significant Budget Adjustments (Cont’d)FTE Expenditures Revenue
Fleet Operations
- 254 -City of San DiegoFiscal Year 2018 Proposed Budget
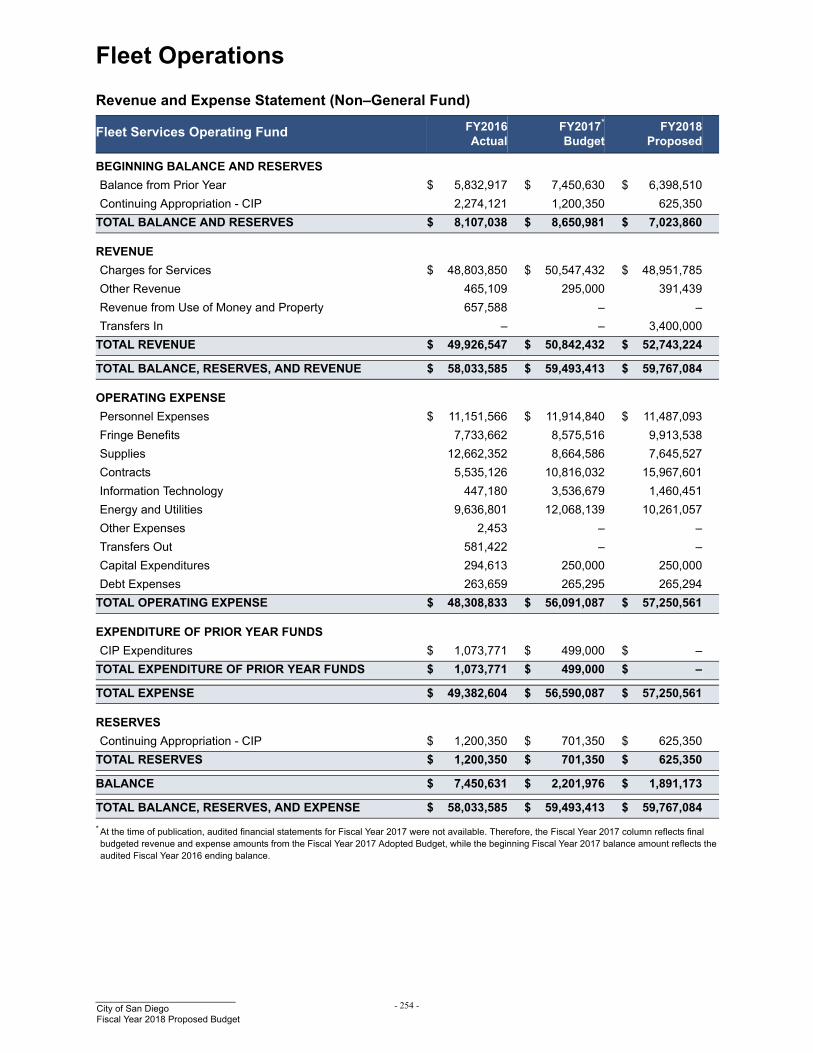
Revenue and Expense Statement (Non–General Fund)
Fleet Services Operating Fund FY2016Actual
FY2017*
BudgetFY2018
Proposed
BEGINNING BALANCE AND RESERVES
Balance from Prior Year $ 5,832,917 $ 7,450,630 $ 6,398,510
Continuing Appropriation - CIP 2,274,121 1,200,350 625,350
TOTAL BALANCE AND RESERVES $ 8,107,038 $ 8,650,981 $ 7,023,860
REVENUE
Charges for Services $ 48,803,850 $ 50,547,432 $ 48,951,785
Other Revenue 465,109 295,000 391,439
Revenue from Use of Money and Property 657,588 – –
Transfers In – – 3,400,000
TOTAL REVENUE $ 49,926,547 $ 50,842,432 $ 52,743,224
TOTAL BALANCE, RESERVES, AND REVENUE $ 58,033,585 $ 59,493,413 $ 59,767,084
OPERATING EXPENSE
Personnel Expenses $ 11,151,566 $ 11,914,840 $ 11,487,093
Fringe Benefits 7,733,662 8,575,516 9,913,538
Supplies 12,662,352 8,664,586 7,645,527
Contracts 5,535,126 10,816,032 15,967,601
Information Technology 447,180 3,536,679 1,460,451
Energy and Utilities 9,636,801 12,068,139 10,261,057
Other Expenses 2,453 – –
Transfers Out 581,422 – –
Capital Expenditures 294,613 250,000 250,000
Debt Expenses 263,659 265,295 265,294
TOTAL OPERATING EXPENSE $ 48,308,833 $ 56,091,087 $ 57,250,561
EXPENDITURE OF PRIOR YEAR FUNDS
CIP Expenditures $ 1,073,771 $ 499,000 $ –
TOTAL EXPENDITURE OF PRIOR YEAR FUNDS $ 1,073,771 $ 499,000 $ –
TOTAL EXPENSE $ 49,382,604 $ 56,590,087 $ 57,250,561
RESERVES
Continuing Appropriation - CIP $ 1,200,350 $ 701,350 $ 625,350
TOTAL RESERVES $ 1,200,350 $ 701,350 $ 625,350
BALANCE $ 7,450,631 $ 2,201,976 $ 1,891,173
TOTAL BALANCE, RESERVES, AND EXPENSE $ 58,033,585 $ 59,493,413 $ 59,767,084
* At the time of publication, audited financial statements for Fiscal Year 2017 were not available. Therefore, the Fiscal Year 2017 column reflects final budgeted revenue and expense amounts from the Fiscal Year 2017 Adopted Budget, while the beginning Fiscal Year 2017 balance amount reflects the audited Fiscal Year 2016 ending balance.

Fleet Operations
- 255 - City of San DiegoFiscal Year 2018 Proposed Budget
Revenue and Expense Statement (Non–General Fund)
Fleet Services Replacement Fund FY2016Actual
FY2017*
BudgetFY2018
Proposed
BEGINNING BALANCE AND RESERVES
Balance from Prior Year $ 12,634,066 $ 10,408,215 $ 33,553,147
Continuing Appropriation - Operating 37,277,962 36,855,003 21,769,751
TOTAL BALANCE AND RESERVES $ 49,912,029 $ 47,263,217 $ 55,322,898
REVENUE
Charges for Services $ 27,179,989 $ 24,106,408 $ 30,382,696
Other Revenue 1,800,666 2,000,000 1,500,000
Transfers In – 3,119,490 –
TOTAL REVENUE $ 28,980,655 $ 29,225,898 $ 31,882,696
TOTAL BALANCE, RESERVES, AND REVENUE $ 78,892,683 $ 76,489,115 $ 87,205,594
OPERATING EXPENSE
Supplies $ 1,366,327 $ – $ –
Contracts 452,619 – –
Transfers Out – – 3,400,000
Capital Expenditures 23,207,322 22,994,920 28,279,215
Debt Expenses 6,603,198 7,375,261 11,094,531
TOTAL OPERATING EXPENSE $ 31,629,466 $ 30,370,181 $ 42,773,746
EXPENDITURE OF PRIOR YEAR FUNDS
Operating Expenditures $ 422,960 $ 1,144,283 $ –
TOTAL EXPENDITURE OF PRIOR YEAR FUNDS $ 422,960 $ 1,144,283 $ –
TOTAL EXPENSE $ 31,629,466 $ 30,370,181 $ 42,773,746
RESERVES
Continuing Appropriation - Operating $ 36,855,003 $ 35,710,720 $ 21,769,751
TOTAL RESERVES $ 36,855,003 $ 35,710,720 $ 21,769,751
BALANCE $ 10,408,214 $ 10,408,214 $ 22,662,097
TOTAL BALANCE, RESERVES, AND EXPENSE $ 78,892,683 $ 76,489,115 $ 87,205,594
* At the time of publication, audited financial statements for Fiscal Year 2017 were not available. Therefore, the Fiscal Year 2017 column reflects final budgeted revenue and expense amounts from the Fiscal Year 2017 Adopted Budget, while the beginning Fiscal Year 2017 balance amount reflects the audited Fiscal Year 2016 ending balance.
Page Intentionally Left Blank