florida’s families and children below the federal...
TRANSCRIPT

The Florida LegislatureOffice of Economic and Demographic Research850.487.1402http://edr.state.fl.us
Presented by:
Florida’s Families and Children Below the Federal Poverty Level
Florida Senate Committee on Children, Families, and Elder Affairs
February 17, 2016

The Official Federal Poverty Threshold…• What does the official federal poverty threshold measure?
– Whether the cash income of related persons in a household is below a certain monetary threshold.
• What is the poverty monetary threshold based on?– The poverty threshold is the cost of a minimum annual food diet in 1963 (times 3 to
allow for other expenses) in today’s prices.
• Who estimates poverty rates?– Today, the US Census Bureau calculates poverty thresholds for different family sizes and
individuals from income data based on surveys. • The methodology was originally developed in 1963 by the Social Security Administration staff.
• What are the major groups that are included/excluded in poverty calculations?– Included:
• All persons living in households, even if it is a household consisting of one person.– Excluded:
• Foster children under age 15.• Institutionalized population (such as prisons and mental hospitals).
Page 1

The Official Federal Poverty Statistics…• How are poverty statistics used?
– The official federal poverty measures are primarily used to determine eligibility for federal and state programs. They are also used as a measure of a state’s well‐being relative to other states.
• What are the limitations?– There are different views on how the official poverty threshold should be measured.
– Survey data are typically self‐reported, and thus may underestimate income.
• In fact, some researchers are concerned the official survey measuring poverty rates may be overestimating the percent of people in poverty.
• What is meant by the term “in poverty”?– Throughout this presentation, the term “in poverty” refers to those households or individuals below the poverty threshold.
Page 2

How Cash Income Is Measured…
Page 3
• Includes:– Earnings– Unemployment compensation– Workers' compensation– Social Security– Supplemental Security Income– Public assistance – Veterans' payments– Survivor or disability benefits– Pension or retirement income– Interest, dividends– Income from rents– Income from estates, trusts– Educational assistance– Alimony, child support– Assistance from outside the household
• Measured before taxes
• Excludes:– Noncash benefits
• Supplemental Nutrition Assistance Program (SNAP)
• Special Supplemental Food Program for Women, Infants and Children (WIC)
• National school lunch• Housing subsidies• Low‐income home energy assistance• Medical care (such as Medicare and Medicaid)
– Capital gains or losses– Assets (liquid or illiquid)
• Home ownership• Bank accounts• Retirement accounts
Government programs may have additional and/or different criteria to determine poverty status for eligibility and may define income and poverty differently depending on the purpose.

Florida’s Population in Poverty…
Population for whom poverty is determined (18,946,215)
Adults (14,989,964)• 14.7% of adults are in poverty (2,205,911)•Poverty rates for adults:
Children (3,956,251)•24.1% of children are in poverty (953,348)• Poverty rates for children:
Page 4
Age Group Percent of Age Group in Poverty
0‐5 26.8%
6‐11 24.3%
12‐17 21.3%
Age Group Percent of Age Group in Poverty
18‐24 25.1%
25‐34 17.4%
35‐44 14.9%
45‐54 13.3%
55‐64 12.9%
65‐74 9.7%
75+ 10.9%
Source: US Census Bureau, American Community Survey, 5-Year, 2010-2014, Table B17024.

Florida Households and Families in Poverty…
• Households (7,217,508):– 4,650,162 family. – 2,567,346 non‐family (a householder living alone or with non‐relatives only).
• Households in poverty (1,094,402):– 566,521 family households in poverty (12.2% of families or 2,300,543 people)
– 527,881 non‐family households in poverty (20.6% of non‐family households or 858,716 people).
Households (7,217,508)
Families(4,650,162)
Families in Poverty (566,521)
Families in Povertywith Related Children under the Age of 18
(399,922)
Page 5Source: US Census Bureau, American Community Survey, 5-Year, 2010-2014, Tables B17010, B17017, and B17021.

Children in Poverty...
• In Florida, 24.1% of all children under 18 years for whom poverty is determined are in poverty (953,348 children).
– Of the children in poverty, 44.3 percent are in deep poverty (below 50% of poverty threshold).
– This means that 10.7 percent of all children in the state are in deep poverty.
Page 6

Children in Poverty...
• Of the 556,521 families in poverty in Florida:– 70.6% (399,922 families) have related children under the age of 18.
• These 399,922 families have 937,243 related children under the age of 18.
• There are an additional 16,105 children in poverty who are unrelated to the householder, including foster children aged 15‐17.
• There are a total of 953,348 children in poverty in Florida.
Page 7
556,521 families399,922 families with related
children under 18937,243 children
953,348 children
16,105 children
Families and Children in Poverty in Florida
Source: US Census Bureau, American Community Survey, 5-Year, 2010-2014, Tables B17006, B17010, & B17024.

Recent Children’s Poverty Rate Is Higher than Pre‐Recession Levels but Is Starting to Improve
• In 2006, 17.6% of all children under 18 were in poverty. The poverty rate for children peaked at 25.6% in 2012. More recently in 2014, the rate was slightly above 24%.
• In the economic boom years of 2004 to 2007, Florida had slightly lower poverty rates for children than the nation, but since then Florida’s poverty rate has been higher than the nation.
• For all persons of all ages, the percent in poverty increased from 12.6 in 2006 to 16.6 in 2014.
Page 8

Characteristics of Floridians in Poverty...
• Families – Family Structure– Family Size– Children
• Educational Attainment• Age
• Race/Ethnicity• Population Diversity
– 65 and Older– Disability Status by Employment Status
• Geographic Representation
Page 9
Size of family unit Weighted
averagethresholds
One person (unrelated individual)...... 12,071 Under 65 years.............................. 12,316 12,316 65 years and over........................... 11,354 11,354
Two people..................................... 15,379 Householder under 65 years........... 15,934 15,853 16,317 Householder 65 years and over........ 14,326 14,309 16,256
Three people.................................... 18,850 18,518 19,055 19,073Four people..................................... 24,230 24,418 24,817 24,008 24,091Five people...................................... 28,695 29,447 29,875 28,960 28,252 27,820Six people........................................ 32,473 33,869 34,004 33,303 32,631 31,633…Nine people or more.......................... 49,021 52,430 52,685 51,984 51,396 50,430 45,768Source: U.S. Census Bureau.
Related children under 18 yearsPoverty Thresholds by Size of Family and Number of Children - 2014
None One Two Three Four … Eight or more

Families in Poverty are Usually Single‐Parent...
• Nearly 70% of families in poverty with children are headed by a single‐parent.– Of the 566,521 Florida families with or without children in poverty, almost half are families where there is a female householder, with no husband present.
Source: US Census Bureau, American Community Survey, 5-Year, 2010-2014, Table B17010.
Page 10

Children in Poverty by Family Structure...
• Two‐thirds of all children in poverty live with a single parent.
– More children in poverty live in families with a female householder, no husband present than in married‐couple families and in male householder, no wife present families combined.
• Over two‐thirds of children at or above poverty live in married couple families.
Page 11Source: US Census Bureau, American Community Survey, 5-Year, 2010-2014, Table B17006.

Families in Poverty Compared to US...• Compared to the US, Florida currently has a slightly larger percent of
families in poverty (12.2% in Florida vs. 11.5% in the US).
• Married couples represent a higher percentage of families in poverty in Florida, than in the US (39.6% vs. 36.3%).
• Female householder, no husband present represent a smaller percentage of those families in poverty in Florida than in the US (49.3% vs. 53.0%), while the share of male householder, no wife present is larger.
Page 12

Family Size is Larger...
• Florida’s families in poverty are typically larger in size than those at or above poverty.
• Only 38.7% of families in poverty contain 2 people, while the majority of families at or above the poverty threshold are comprised of 2 people (52.8%).
• 18.2% of families in poverty have 5 or more people, while 9.5% of families at or above the poverty threshold contain 5 or more people.
Page 13

Families in Poverty with Related Children...
• 20.3% of Florida’s families in poverty have 3 or more related children, compared to 5.8% of those families that are at or above poverty.
– Of the families below poverty with 3 or more related children, 56.4% (64,953 families) are female householders, no husband present.
Page 14
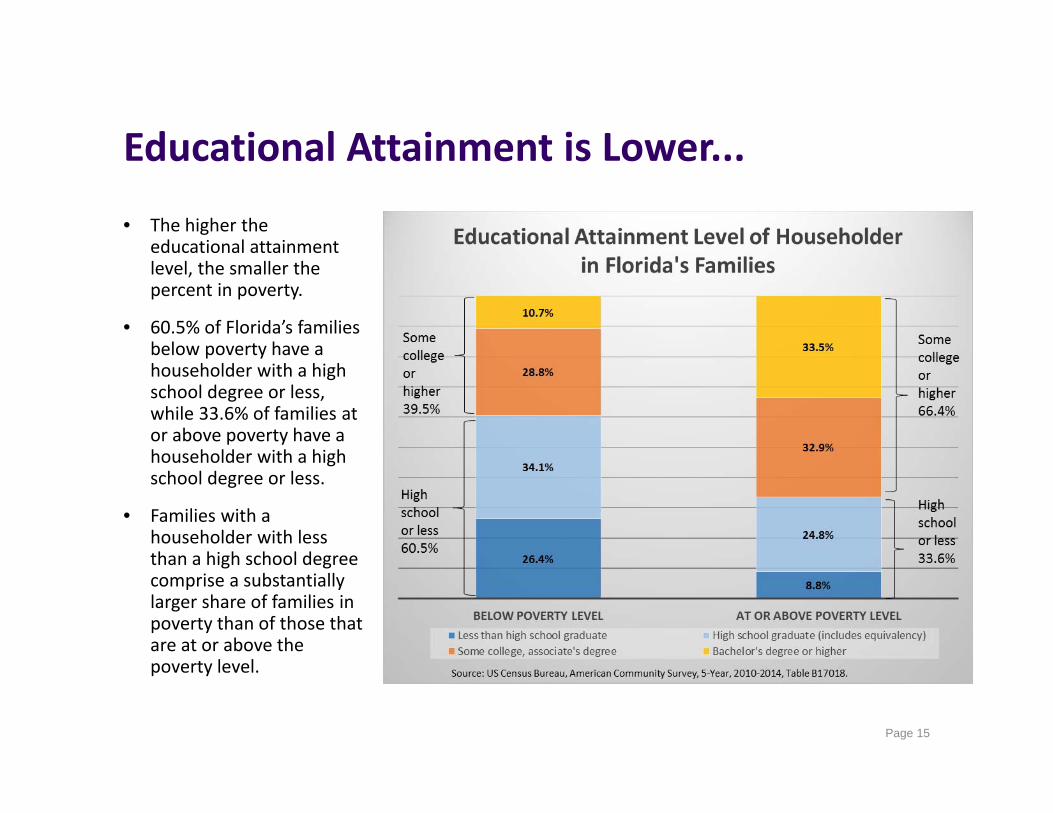
Educational Attainment is Lower...
• The higher the educational attainment level, the smaller the percent in poverty.
• 60.5% of Florida’s families below poverty have a householder with a high school degree or less, while 33.6% of families at or above poverty have a householder with a high school degree or less.
• Families with a householder with less than a high school degree comprise a substantially larger share of families in poverty than of those that are at or above the poverty level.
Page 15

Age of Householder is Younger...
• For Florida’s family and non‐family households:– Of households in poverty, 9.1%
have a householder under 25 years old, while 2.2% of households above poverty are in this age group.
– Of households in poverty, 34.1% have a householder 25‐44 years old, while 28.3% of households above poverty are in this age group.
• In contrast, a larger share of older householders make up the families and non‐families that are at or above the poverty level.
Page 16
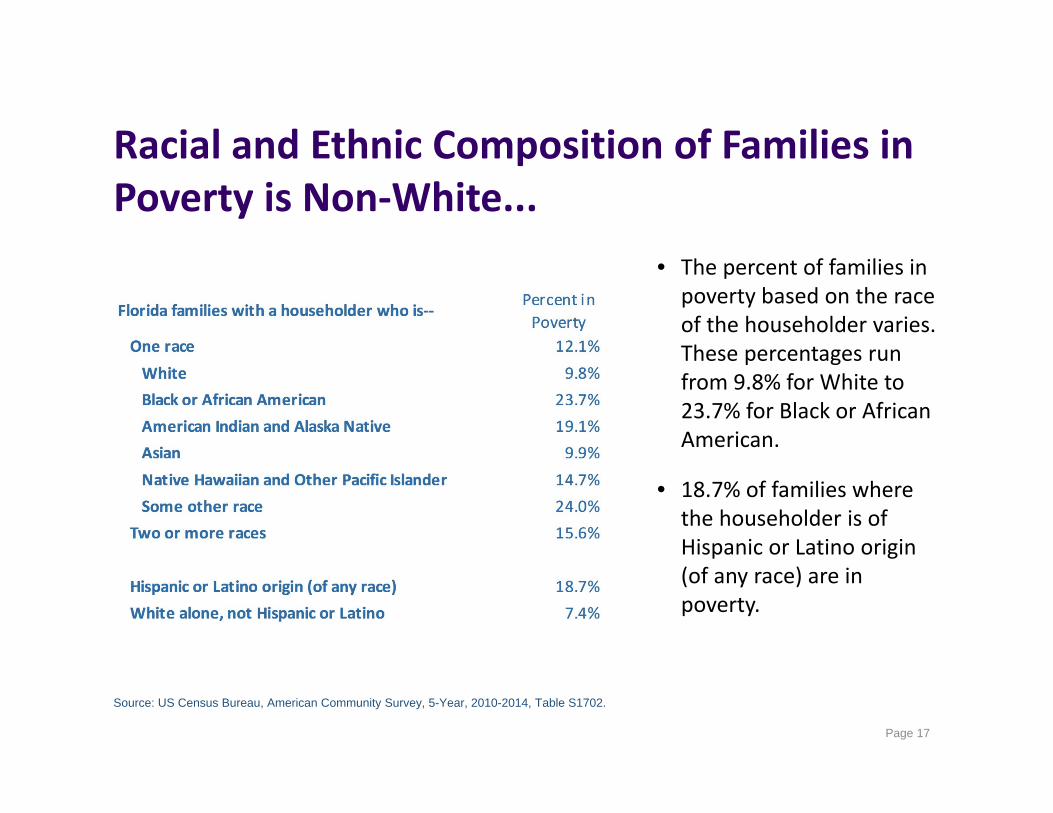
Racial and Ethnic Composition of Families in Poverty is Non‐White...
• The percent of families in poverty based on the race of the householder varies. These percentages run from 9.8% for White to 23.7% for Black or African American.
• 18.7% of families where the householder is of Hispanic or Latino origin (of any race) are in poverty.
Source: US Census Bureau, American Community Survey, 5-Year, 2010-2014, Table S1702.
Page 17
Population 65 Years and Over in Florida...
• Of the 3,453,205 Floridians 65 years and over for whom poverty status is determined, 10.2% or 353,406 people are in poverty. – This represents 11.2% of all Floridians in poverty.
• Of the people 65 years and over in poverty, 29.8% are in deep poverty (income below 50% of the poverty level).
• There are 240,254 households in poverty, where the householder is 65 years and over:– 70,989 are family households. – 169,265 are non‐family (people living alone or with nonrelatives).
Page 18

Disability Status by Employment Status for Floridians in Poverty• For Florida’s population
aged 20 to 64 in poverty 18.0% (315,238) have a disability.
• The majority of these individuals with a disability are not in the labor force (75.2%).
• Of the 24.8% that are in the labor force, they are almost equally split between those that are employed and unemployed.
• These statistics differ from the disabled who are not in poverty, where a greater percentage are employed (37.4%).
Page 19
Persons 20-64 in Poverty
Disabled Persons in Poverty

Florida’s Poverty Rates by County
Page 20
• Poverty rates vary by county.• 40 of Florida’s counties have a poverty rate at or above the state’s rate of 16.6%.– Most of these areas are in the Heartland and Northern part of the state.
– Many of these counties would be considered rural.
– However, half of Florida’s most populous 10 counties also have rates above the state average: • Hillsborough (16.8%), Polk
(18.1%), Duval (18.2%), Orange (18.2%), and Miami‐Dade (20.4%).
Source: US Census Bureau, Small Area Income and Poverty Estimates, 2014.
Highest Poverty Rate of 31.7% in Hamilton CountyLowest Poverty Rate of 8.2% in St. Johns County
Florida16.6%

Change in Poverty Rates between 2006 and 2014
Page 21
Florida4.0%
• The poverty rate in 35 of Florida’s counties increased by 4.0 percentage points or more between 2006 and 2014.
– In five counties, the poverty rate declined over this time horizon.
• Sumter (‐2.2%), DeSoto (‐0.6%), Escambia (‐0.6%), Alachua (‐0.2%), and Jackson (‐0.1%).
– The greatest increase in the poverty rate was in Okeechobee County (9.9percentage points).
Source: US Census Bureau, Small Area Income and Poverty Estimates, 2006 and 2014.

SUPPLEMENTAL INFORMATION:Examples of Poverty and Low‐Income Programs…
These examples of major poverty and low‐income programs are primarily federally funded, federally funded with a required level of state effort, or funded by shared federal/state funds. They typically try to address specific needs.
• Healthcare Assistance– KidCare/CHIP (200K enrolled, $418M)– Medicaid (4M enrolled, $24.6B)
• Housing Assistance– Florida Low‐Income Home Energy Assistance
Program (LIHEAP) ($69M)– Florida Weatherization Assistance Program ($2M)– Low‐Income Emergency Home Repair Program– Emergency Financial Assistance for Housing Program (EFAHP)– HUD Programs e.g. public housing, housing choice vouchers, Section 8 (195,737
housing units, 421,696 occupants)
Page 22

Examples of Poverty and Low‐Income Programs(continued)…
• Food Assistance– Emergency Food Assistance Program (TEFAP) ($23M)– Florida Special Supplemental Nutrition Program for Women, Infants, and Children (WIC)
(467K recipients, $103M)– National School Lunch Program (NSLP) (1.7M participants)
• School Breakfast Program (SBP) (787K participants)• Summer Food Service Program (SFSP) (163K participants)• Afterschool Snack Program• Seamless Summer Option Program• Special Milk Program (SMP) (110K half pints served)
– Child Care Food Program (CCFP)• Afterschool Meals Program• Homeless Children Nutrition Program
– SNAP/Florida Food Assistance Program (3.7M recipients, $5.7B)
• Tax Breaks and Cash Assistance to Alleviate the Conditions of Poverty– Federal Earned Income Tax Credit (2.2M recipients, $5.1B)– Community Services Block Grant Program ($22M)– TANF (49K recipients, $160M)
Page 23

• At‐Risk and Prevention Programs– Florida Head Start Program (46K participants)– School Readiness Program (226K participants)– Take Stock in Children ($6.1M)– College Reach Out Program ($1.0M)– Adult Education – GED ($22.2M state dollars)– First Generation in College Matching Grants (8.7K recipients, $10.6M)– Florida Student Assistance Grants (131.8K recipients, $146.8M)– Florida Work Experience Program (629 recipients, $1.6M)– Florida Prepaid Scholarships ‐ Project STARS ($7.0M)– Pell Grants (596K recipients at Florida institutions, $2.1B)– CareerSource Florida e.g. SNAP Employment and Training, TANF Welfare Transition
• Poverty Avoidance– Florida Reemployment Assistance – Social Security
Page 24
Examples of Poverty and Low‐Income Programs(continued)…