flow regime transmons inidgh-pressure inclined pipelines ... · flow regime transmons...
TRANSCRIPT

FLOW REGIME TRANSmONS IN IDGH-PRESSURE INCLINED PIPELINES
R. Wilkens!, M. Gopal1, and W. P. Jepson1
lSHELL E&P TECHNOLOGY COMPANYWESTHOLLOW TECHNOLOGY CENTER
3333 IDGHW AY 6 SOUTHHOUSTON, TX 77082-3101
lNSF IfUCRC, CORROSION IN MULTIPHASE SYSTEMS CENTERDEPARTMENT OF CHEMICAL ENGINEERING
OIDO UNIVERSITY.ATHENS, omo 45701
Abstract
An 18-m long, 9.72-cm i.d., inclinable 316 stainless steel pipeline has been commissioned for thestudy of multiphase flow and its subsequent effects on corrosion. The effect of inclination andpressure on flow regime transitions and slug flow characteristics is studied. The fluids used arecarbon dioxide for the gas phase and ASTM substitute seawater with light oil in the liquid phase.The superficial gas and liquid velocities varied from 1.0-11 mfs and 0.1-1.5 mfs respectively.Additionally, the pressure varied from 0.27 to 1.48 MPa and the inclination varied from 0° to ::1:5°.
The results show that inclination has a dramatic effect on flow regime transitions. Even at aninclination of +2°, the stratified flow has completely disappeared within the range of velocitiesstudied. Froude numbers are higher at the same velocities in upward inclined flow. Increasingpressure causes transitions to annular flow at lower gas velocities. Maps are presented for flowregime transitions at different pressures and inclinations.
Introduction
Previous work at the Corrosion Center (Lee, 1993) has explained multiphase flow regimes and themechanisms governing their transitions. A great deal of work has been carried out for two phaseflows in small diameter pipes. This is not scalable to larger pipes. Jepson and Taylor (1993) haveshown that the pipe diameter should be at least 10 em to mimic the mechanisms observed in largediameter pipelines.
Mandhane et af. (1974) created a two-phase flow map based on the superficial gas and superficialliquid velocities. Fluid properties, diameter, and inclination specify the flow map which applies.The Mandhane plots have become a standard format for publishing flow regime data in multiphase
flow.The first realistic two-phase mechanistic flow regime transition model was produced by Taitel andDukler (1976). For the transition from stratified to intermittent or annular flow using the Taitel andDukler model, the simultaneous solution of two relations is required, namely, the combined

. .'
momentum balance equation for gas and liquid, and the instability criteria. This model has beenverified (Barnea et al., 1980, etc.) for small-diameter, low pressure, two phase systems at horizontalto near-horizontal pipe flow. The model has been shown to not work well if the diameter is large(Jepson and Taylor, 1993) or with the presence of a third phase (Lee, 1993).
Lin (1985) reported large and small diameter flow regime maps for horizontal air-water flow.Similarly, Jepson and Taylor (1993) and Wallis and Dobson (1973) reported large diameter flowregime maps, but they were also for horizontal air-water systems. Lee (1993) reported the flowregime transitions for a large diameter pipe with horizontal three phase flow. This data was forcarbon dioxide gas, water, and a light-oil which is commercially available. Limited flow map dataexists for inclined pipelines. Gould et al. (1974) introduced +45° and +90° flow pattern maps.Govier and Aziz (1972) presented a commonly used method of establishing flow patterns forinclined flow. Barnea et al. (1985) proposed a model predicting transitions in inclined pipelines.Stanislav et al. (1986) reported inclined flow pattern data. Kokal and Stanislav (1986)characterized, extensively, the upflow and downflow patterns. The models and data compared well,however all of these studies involved two-phase flow. Additionally, flow in large-diameter pipesand at high-pressure have not been reported in inclined pipelines. Further, little research has beendone on three phase flow regimes and their transitions. This work will provide the data necessaryin large diameter three phase flow to include the effects of inclination and pressure.
Experimental Setup
An 18-m long, 9.72-cm i.d., high-pressure (13 MPa), high temperature (90°C), inclinable 316stainless steel flow loop has been commissioned for the study of multiphase flow and its subsequenteffects upon corrosion. Figure 1 is a schematic of the system. A predetermined oil and watermixture is stored within a 1.4 m3 mixing tank. The liquid is moved through the system by acentrifugal pump powered by a 3 - 15 kW variable speed Baldor motor and its flow rate maintainedby the gate valves labeled A and B. The flow rate is determined with a TMfR 510 frequencyanalyzer which was calibrated to a GH Flow Automation (model 6531) in-line turbine flow meter.
A 2-MPa feed line supplies carbon dioxide gas from a 20,000 kg receiver. After passing througha pressure regulator, the gas flow rate is set by adjusting ball valve C. A Hedland variable area flowmeter is used to determine the gas flow rate. The gas temperature and pressure are monitoredbetween the flow meter and the pressure regulator. The gas then passes through a check valve, toavoid possible liquid backflow, and into the liquid flow. The multiphase mixtures then enters thetest loop through a compression flange, allowing the inclination to be set at any angle. Uponentering the inclined portion of the test loop, the multiphase mixture travels 18 meters beforereaching the test section.
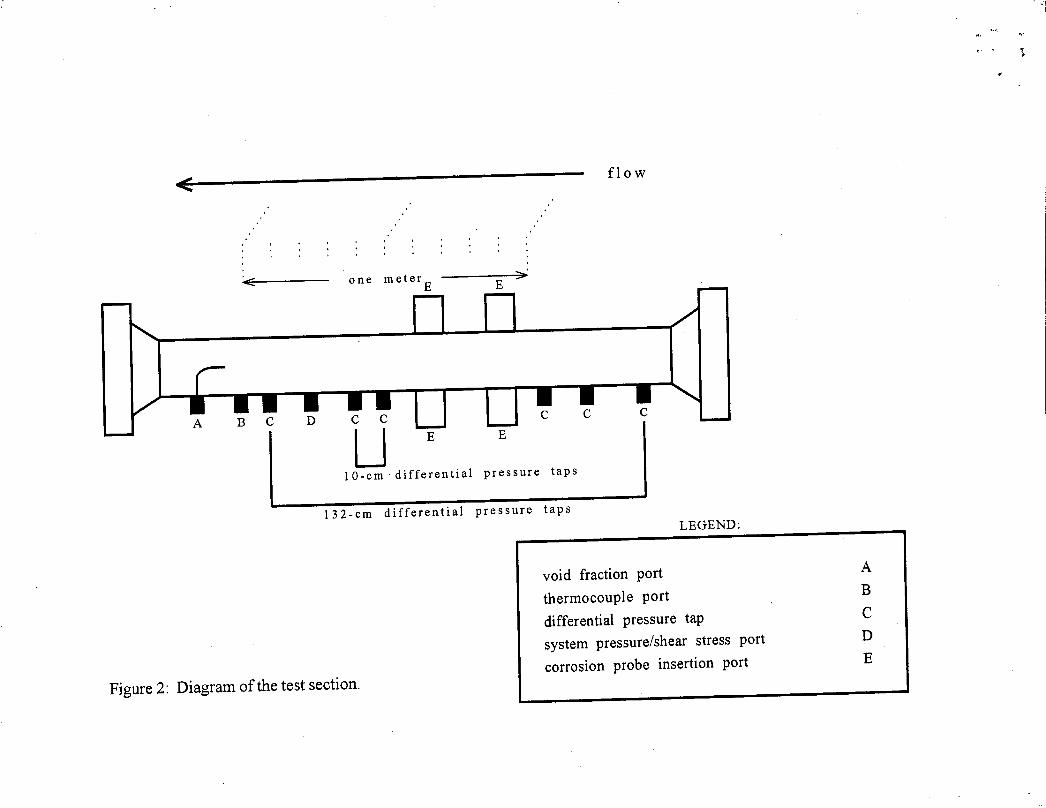
Figure 2 illustrates the test section with the instrument port locations. Port A is a fluid samplingport used primarily when preparing for corrosion experiments. System temperature is measuredthrough port B with a type-K thermocouple connected to an OMEGA DP3200- TC electronicanalyzer with display. Any of the ports labeled C can be coupled and used to measure differentialpressure. In these experiments, the differential pressures are measured between the two sets oftapsplaced lOand 132-cmapart. The measurements are made with Oto35 kPaOMEGAPX-750heavy

-'
duty differential pressure transducers. The entire pressure-signal based system has been patented ina non-visual technique to determine flow regime transition and is not described here. Port D is usedto monitor the test section pressure. This pressure is measured with a 0 to 2.8 MPa Noshok pressuregauge. The ports marked E can be used to insert corrosion probes if necessary. Additional data canbe taken using two upflow and two downflow acoustic sensors provided by BP Research.
Upon leaving the test section, the multiphase flow passes through a separator to prevent siphoningdue to the declined angle of flow return and to destroy the flow pattern. The mixture passes backthrough another compression flange and then re-enters the mixing tank. The gas passes through ade-entrainment plate through a back-pressure regulating control valve, through a separator, and isvented to the atmosphere. The liquid from the separator is collected to be re-injected into the
system.
Test Matrix
The matrix studied is listed in Table 1. ASTM Dl14l-52 substitute seawater with an oil of density800 kg/m3 and viscosity 2 cP were used in the liquid phase with carbon dioxide in the gas phase.
I property I range Iwater cut 40,80, 100%
pressure 0.27,0.45,0.79 MPa
inclination horizontal, :t: 2°, :t: 5°
temperature 20 DC
diameter 0.0972m
superficial gas velocity 0- 13 mls
superficial liquid velocity 0.1, 0.5, 1.0, 1.5 mls
Table 1: Experimental test matrix for flow regime and flow property determination.
Results and Discussion
The flow regimes were determined from the criteria established by Wilkens and Jepson (1996). Theflow regimes identified were plug flow, stratified flow, slug flow, pseudo-slug flow, and annularflow. Plug flow, slug flow, and pseudo-slug flow will often be collectively termed slug flow. Plugflow is actually of little interest and is not known to occur in downflow. Slug flow was found todominate the flow regime map as the inclination was increased to as little as +2°. This is expectedas it has been found by many researchers (Kokal and Stanislav, 1989, etc.). Figure 3 is a flowregime map for 100% saltwater, horizontal, 0.45 MPa flow. At superficial liquid velocities of upto 0.3 mis, stratified flow is observed to occur while slug flow was observed to occur at a superficialliquid velocity of 0.4 mls. Pseudo-slug and annular flow occurred at the higher gas flow rates while
. .,
plug flow occurred at the lower gas flow rates. Figure 4 represents the flow regime map for 100%saltwater, +5° inclined, 0.27 MPa flow. No stratified flow was observed to occur. In its place atequal flow rates is slug flow. At a superficial liquid velocity as low as 0.1 mfs, slug flow is stillobserved to occur, allowing slug flow to dominate the flow regime map.
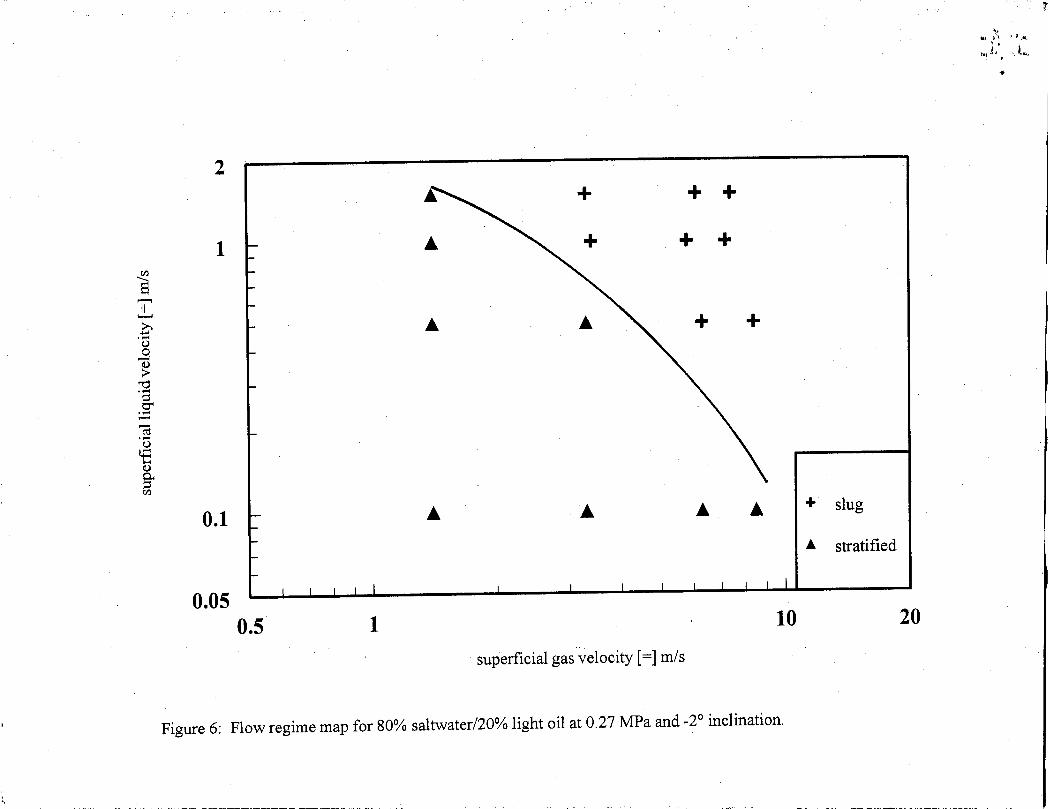
In downward flow, stratified flow dominates the flow regime map. The transition from stratifiedto slug flow also becomes much more dependent upon the superficial gas velocity. Figure 3 showedthat the transition from stratified to slug flow on the axes given was relatively horizontal (i.e.,occurring at a similar superficial liquid velocity for all superficial gas velocities studied). Figure5 shows that if the pipe inclination is set to _2°, the transition becomes much more dependent uponthe gas flow rate. At a superficial gas velocity of about 1 mfs, only stratified flow is observed atsuperficial liquid velocities as high as 1.5 mfs. At a superficial gas velocity of about 3 mIs, slugflow occurs at a superficial liquid velocity as low as 1 mfs while stratified flow occurs at asuperficial liquid velocity of 0.5 mfs. At a superficial gas velocity of around 9 mfs, slug flow isobserved to occur at a superficial liquid velocity as low as 0.5 mfs while stratified flow occurs at asuperficial liquid velocity of 0.1 m/s. This trend is observed at other water cuts and at otherpressures.Figure 6 shows that with 80% water cut, the transition from stratified to slug flow doesnot changes greatly compared to 100% water cut in Figure 5.
These stratified-slug transition results are expected and have been seen by other researchers (Kokaland Stanislav, 1989, etc.). In downflow, the liquid film is thinner and faster. At lower superficialgas velocities, more liquid is required to bridge across the pipe. At higher gas velocities, the filmthickness is not much different from that in horizontal flow at high gas velocities, and the transitionoccurs near where it is expected to occur in horizontal flow. Further downward inclination causesthe transition from stratified to slug flow to occur at higher liquid flow rates.
The transition to annular flow was found to occur in roughly the same location for all conditionstested at a superficial gas velocity around 10 mfs. The transition occurred at lower gas flow ratewith low liquid flow rates and at a higher gas flow rate for the higher liquid flow rates. This wasalso observed by Kokal and Stanislav (1989). Inclination was found to have little effect on thetransition in the range of conditions tested here. It appears that the gas flow rate required to reachannular flow is slightly lower in upflow and slightly higher in downflow. But nothing is observedwhich exceeds the uncertainties associated with the superficial gas velocity. Kokal and Stanislavalso observed a slight decrease in gas required to reach annular flow with an increase in inclination,but it was on the order of their uncertainty. They concluded that this transition was relativelyinsensitive to inclination (_9° to +9°). Water cut was also found to have little observable effect onthe transition to annular flow for the conditions tested.
Pressure was found to have a marked effect on the transition. As the pressure was increased, thetransition to annular flow was observed to occur at lower superficial gas velocities. This effect hasbeen observed in the field (Green, 1997) and is reasonable. Since annular flow is largely a densitydriven effect, it follows that the ratio of densities of the process fluids should affect this transition.In oil-water flows, when annular flow conditions occur, the less-dense and more viscous fluid (oil)flows in the core. In gas-liquid annular flow, the less-dense and less viscous fluid (gas) flows in thecore. Since liquid-liquid annular flow occurs at a less-dense fluid superficial velocity of around 1

mfs for an oil with a specific gravity of near unity and around 5mfs for an oil with a specific gravityof around 0.8 (Brauner and Maron, 1992), and since for gas-liquid annular flow occurs at a less-dense fluid superficial velocity of around 10mfs, the closer the densities are, the lower the velocityrequirement. Brauner and Maron demonstrated that as the oil specific gravity approached unity, theeffect increased rapidly. As listed earlier, the gas density increases from 5.02 to 14.9 kg/m
3as the
pressure is increased from 0.27 to 0.79 MPa. Although this is a slight change with respect to theliquid density, there is a large effect on the ratio of the two.
Figures 4 and 7 represent the same flow conditions at pressures of 0.27 and 0.79 MPa, respectively.At 0.27 MPa and a superficial liquid velocity of 0.1 mfs, slug flow was observed to occur at asuperficial gas velocity of about 8 mfs. At 0.79 MPa and a superficial liquid velocity of 0.1 mfs,annular flow was found to occur at a superficial gas velocity as low as 7 mfs. This effect can alsobe seen at other water cuts and at other inclinations.
Conclusions
Inclination is found to have a dramatic effect on flow regime transitions. Stratified flow waseliminated in upflow while slug flow was found to dominate. In downflow stratified flow wasdominant while slug flow was reduced. In downflow, water cut was found to have little measurableeffect on the transition from stratified to slug flow. Water cut was found to have little effect on thetransition from slug to annular flow. Increasing pressure caused the stratified to slug transition tooccur at slightly higher liquid flow rates. The transition from slug to annular flow was found to notbe largely dependent on the inclination. Increasing pressure caused the annular transition to occurat lower gas flow rates.
References
Bamea, D., Shoham, 0., Taitel, Y., and Dukler, A> E., "Flow Pattern Transitions for Gas-LiquidFlow in Horizontal and Inclined Pipes: Comparison of Experimental Data with Theory," Int. JMultiphase Flow, 6, 217-225, 1980.
Gould, T. L., Tek., M., Katz., D. L., "Two Phase Flow Through Vertical, Inclined or Curved Pipes,"J Petrol. Tech., 26, 915-926, 1974.
Govier, G. W., and Aziz, K., "The Flow of Complex Mixtures in Pipes", Van Nostrand Reinhold.New York, 1972.
Jepson, W. P., and Taylor, R. E., "Slug Flow and its Transitions in Large-Diameter HorizontalPipes", Int. J Multiphase Flow, 19,411-420, 1993.
Kokal, S. L., and Stanislav, 1.F., "An Experimental Study of Two-Phase Flow in Slightly InclinedPipes-I. Flow Patterns, "Chemical Engineering Science, 44,665-679, 1989.
Lee, AJ-Hsin, "A Study of Flow Regime Transitions for Oil-Water-Gas Mixtures in Large DiameterHorizontal Pipelines", M.S. Thesis, Ohio University, Athens, Ohio 1993.
~.
Lin, P. Y., "Flow Regime Transitions in Horizontal Gas-Liquid Flow", Ph.D. Thesis, University ofIllinois, Urbana-Champaign, 1985.
Mandhane, 1. M., Gregory, G. A., and Aziz, K, "A Flow Pattern Map for Gas-Liquid Flow inHorizontal Pipes: Predictive Models, " Int. J Multiphase Flow, 1, 537-553, 1974.
Taitel, Y, and Dukler, A. E., "A Model for Predicting Flow Regime Transitions in Horizontal andNear Horizontal Gas-Liquid Flow", AlChEJ, 22, 47-55, 1976.
Wallis, G. B., and Dobson, J. E., "The Onset of Slugging in Horizontal Stratified Air-Water Flow",Int. J Multiphase Flow, 1, 173-193, 1973.

centrifugal pump
LEGEND:
pressure gauge 0temperature gauge <Dflow gauge <Dcheck valve I<J I mixing
gate valve I><J
ball valve ••rupture disk "compression flange []X[]
test section
separator
carbon dioxide feed line
Figure 1: High-pressure, inclinable flow loop orientation.
~
oEE one meterE
~E
flow
,,
E E
1D-cm differential pressure taps
l32-cm differential pressure tapsLEGEND:
void fraction portthermocouple portdifferential pressure tapsystem pressure/shear stress portcorrosion probe insertion port
Figure 2: Diagram of the test section.
ABCD
E

•••• i.)
+ +
o pseudo-slug
+ slug
C plug
•••
++-•
++
+
•
+o
o
•
2
• annular
A stratified
0.050.5 1 10 20
superficial gas velocity [=] m/s
Figure 3: Flow regime map for 100% saltwater at 0.45 MPa and horizontal.

'0
qJ 'I
.,
20 + + + IC plug
I
+ slug
0I
1~
+ ++ I <> pseudo-slugCIl
8.--.II'--'
~p + + + +.-<(.)0-Q):>
"d.-<6-.-<-ca.-<(.)
'€Q)g-CIl
0.1 ~ + +
0.050.5 1 10 20
superficial gas velocity [=] m/s.
Figure 4: Flow regime map for 100% saltwater at 0.27 MPa and +5° inclination.

2
1ell
S,.......,II•.....•0....•t)0•....•~:>"Cl....•6-....••....••....•co....•t)
'€~g.ell
0.1
•
• • • • + slug
A stratified
. .,~~:. ~ , ...
0.050.5 1 10
superficial gas velocitY [=] m/s
20
Figure 5: Flow regime map for 100% saltwater at 0.45 MPa and _2° inclination.
~I
I
"tI) ~): ,~ .•.
hoI JA L,'l•.•,
•
2I
+ + +
1 l- • " + + +ell
S,......,II•.....• l-e • • "- + +.....C,)0•....•Q)
>"'d....•g.....••....•ca.....C,)
'€Q)g.ell
0.1~ • • • • 1+ slug
I
~
A stratified
, I I I I I I I I I I I I0.050.5 1 10 20
superficial gas velocity [=]m/s
Figure 6: Flow regime map for 80% saltwater/20% light oil at 0.27 MPa and _2° inclination.

I
"_) III II.A •••,
•~.. t t .••••
r
2 .0 \ + + + +
1 ~ 0 + + + +ell
'8II
~'--' \~ 0 + + +.....u0-~:>
'"d.....6-.....-ta.....ut£ I \ I IC plug~0-::l
~
ell \ I I+ slug
0.1 0 + + <>I I 0 pseudo-slug
t• annular
0.05 ! ! ! ! I ! ! ! ! ! ! ! ! II
0.5 1 10 20 Isuperficial gas velocity [=]mls
\
Figure 7: Flow regime map for 100% saltwater at 0.79 MPa and +5° inclination.
i