foaming of cyclic olefin copolymer (coc) and...
TRANSCRIPT
Foaming of Cyclic Olefin Copolymer (COC)
and Nanocomposites by Carbon Dioxide
Yan Li & Changchun Zeng
Department of Industrial & Manufacturing
Engineering
High-Performance Materials Institute
Florida State University
Tallahassee, FL 32310 USA
ANTEC 2014, Las Vegas
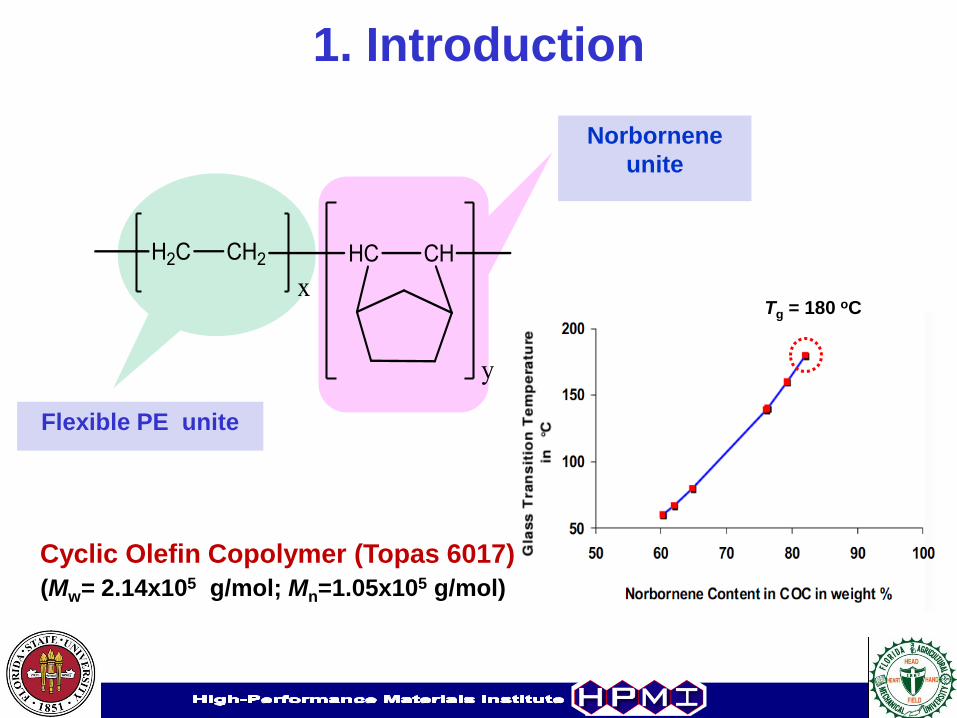
1. Introduction
Cyclic Olefin Copolymer (Topas 6017)
(Mw= 2.14x10⁵ g/mol; Mn=1.05x10⁵ g/mol)
Flexible PE unite
Norbornene
unite
Tg = 180 oC
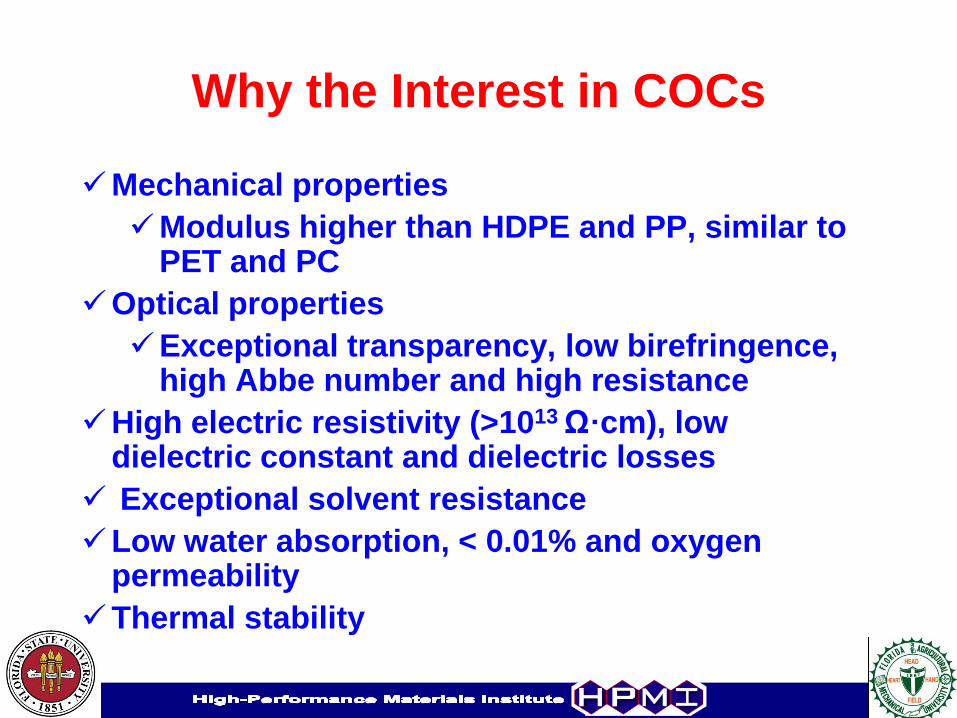
Why the Interest in COCs
Mechanical properties
Modulus higher than HDPE and PP, similar to PET and PC
Optical properties
Exceptional transparency, low birefringence, high Abbe number and high resistance
High electric resistivity (>1013 Ω·cm), low dielectric constant and dielectric losses
Exceptional solvent resistance
Low water absorption, < 0.01% and oxygen permeability
Thermal stability
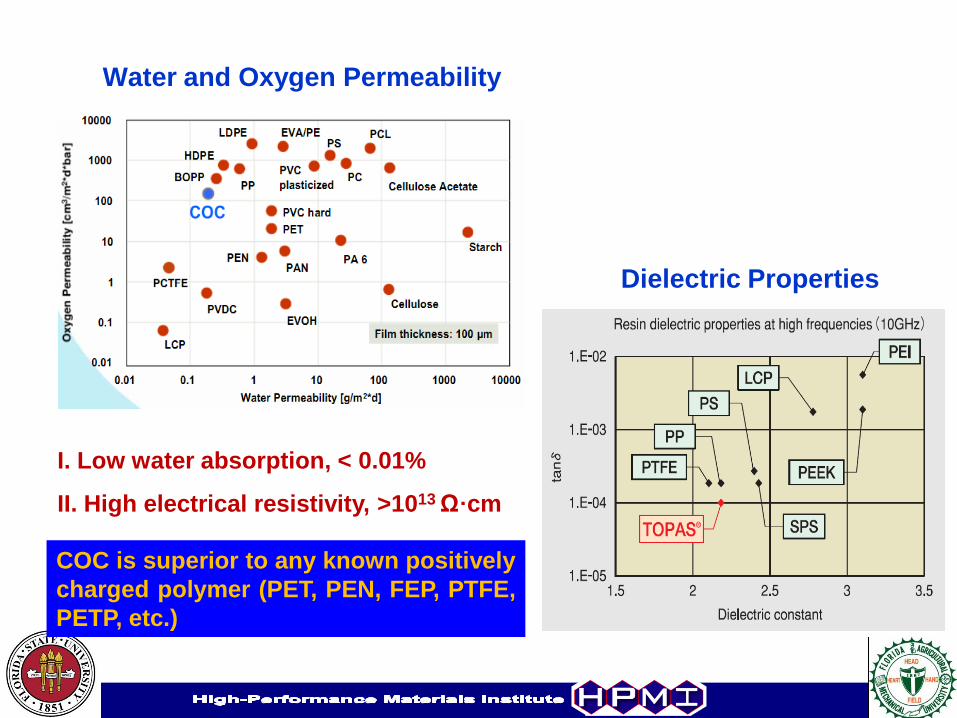
Water and Oxygen Permeability
Dielectric Properties
COC is superior to any known positively
charged polymer (PET, PEN, FEP, PTFE,
PETP, etc.)
I. Low water absorption, < 0.01%
II. High electrical resistivity, >1013 Ω·cm

COCs are ideal for use in high performance film, optical lens
and packaging application such as DVD players, shrink film and
in pharmaceutical packaging such as blister packs.

Our Previous Work on COCs COC piezoelectres
Sensitivity
Raing (pC/N)
Max Operating
Temperature (oC)
Market Standard
(PP)
1000 60
Our Standard
(COC)
750-1000 120 0 5 10 15 2010
0
101
102
103
104
105
w = 3 mm
w = 2.5 mm
w = 2 mm
w = 1.5 mm
w = 3 mm (no offset)
Pie
zo
ele
ctr
ic c
oe
ffic
ien
t d
33
(p
C/N
)
Applied pressure (kPa)
15 pC/N
The cellular voids with charges of
opposite signs on the upper and lower
walls form macroscopic dipoles.
Yan Li, Changchun Zeng, Macromolecular Chemistry and Physics 2013, 214, 2733-2738.
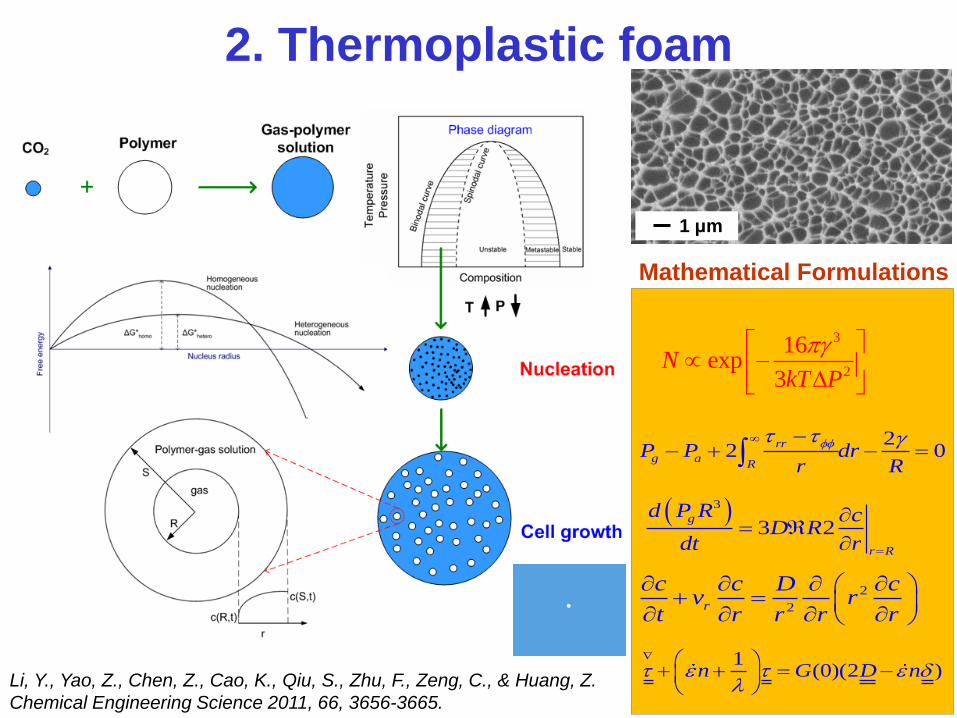
2. Thermoplastic foam
Mathematical Formulations
3
2
16exp
3N
kT P
22 0
rr
g aR
P P drr R
3
3 2g
r R
d P R cD R
dt r
2
2r
c c D cv r
t r r r r
1(0)(2 )n G D n
1 μm
Li, Y., Yao, Z., Chen, Z., Cao, K., Qiu, S., Zhu, F., Zeng, C., & Huang, Z.
Chemical Engineering Science 2011, 66, 3656-3665.

High pressing foaming system
3. Solid-State Foaming of COC by CO2
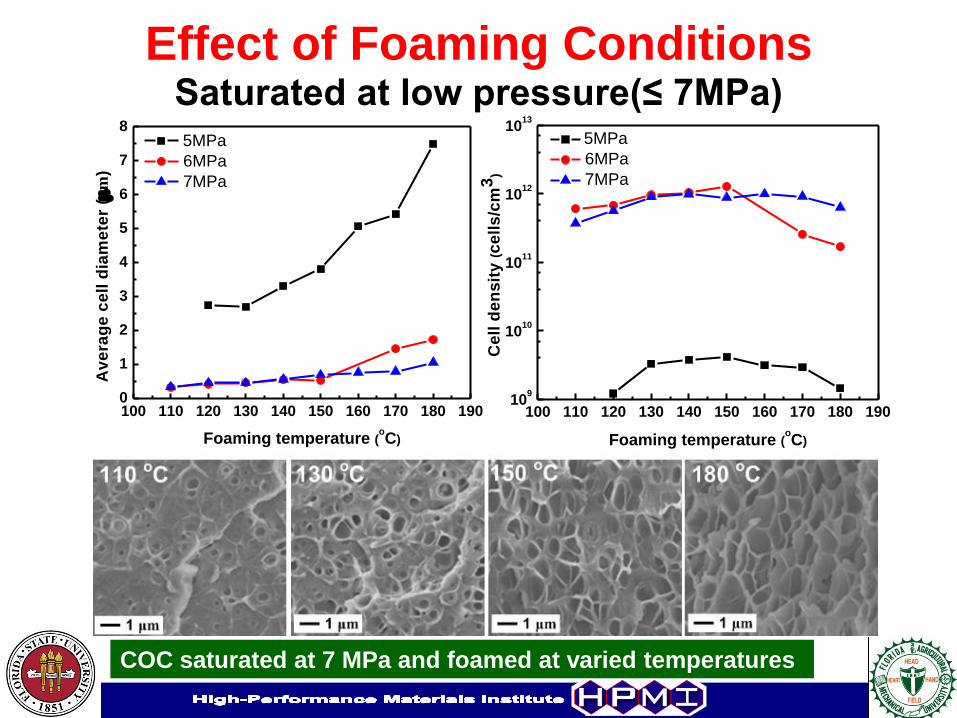
Effect of Foaming Conditions Saturated at low pressure(≤ 7MPa)
COC saturated at 7 MPa and foamed at varied temperatures
100 110 120 130 140 150 160 170 180 1900
1
2
3
4
5
6
7
8 5MPa
6MPa
7MPa
A
ve
rag
e c
ell
dia
me
ter
(m
)
Foaming temperature (oC)
100 110 120 130 140 150 160 170 180 19010
9
1010
1011
1012
1013
5MPa
6MPa
7MPa
Ce
ll d
en
sit
y (
ce
lls
/cm
3)
Foaming temperature (oC)
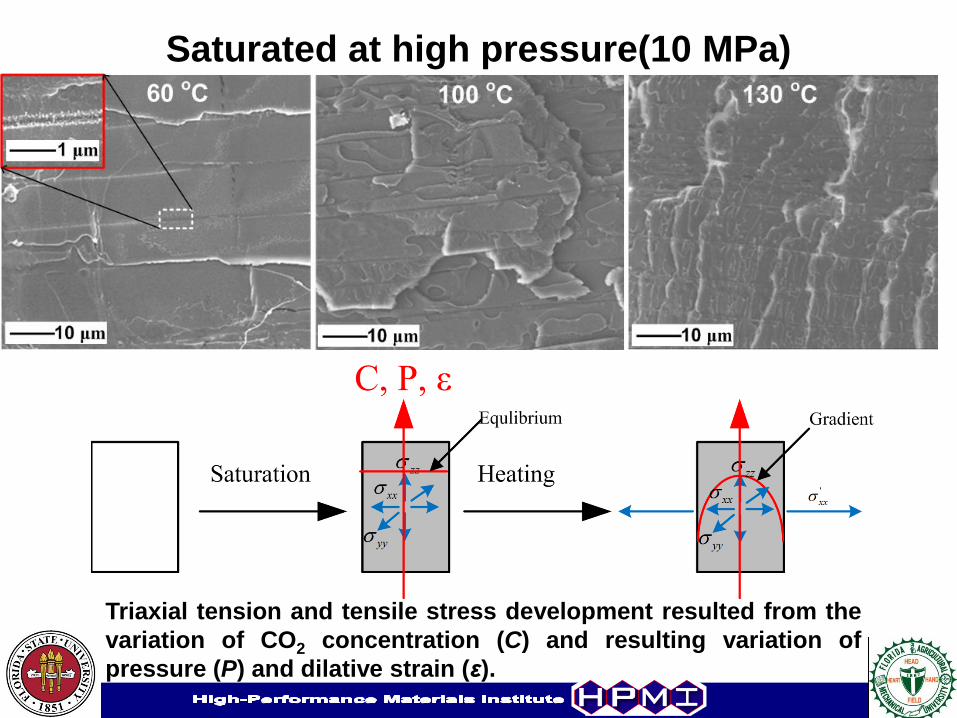
Saturated at high pressure(10 MPa)
Triaxial tension and tensile stress development resulted from the
variation of CO2 concentration (C) and resulting variation of
pressure (P) and dilative strain (ε).

0 2 4 6 8 10 12 14 16 18 20 22 240.00
0.01
0.02
0.03
0.04
0.05
0.06
0.07
0.08 453.15K
473.15K
493.15K
453.15K (SL, kij=-0.0507 )
473.15K (SL, kij=-0.0571)
493.15K (SL, kij=-0.0678)
So
lub
ilit
y(g
-ga
s/g
-po
lym
er)
Pressure (MPa)
57 oC
13.8 MPa
Sanchez-Lacombe equation of state
Gibbs-DiMarzio thermodynamic criterion
The line were cracks that can only result from growth of crazes.
Solubility of CO2 in COC Predicted Tg as a function of the
pressure for the CO2-COC system
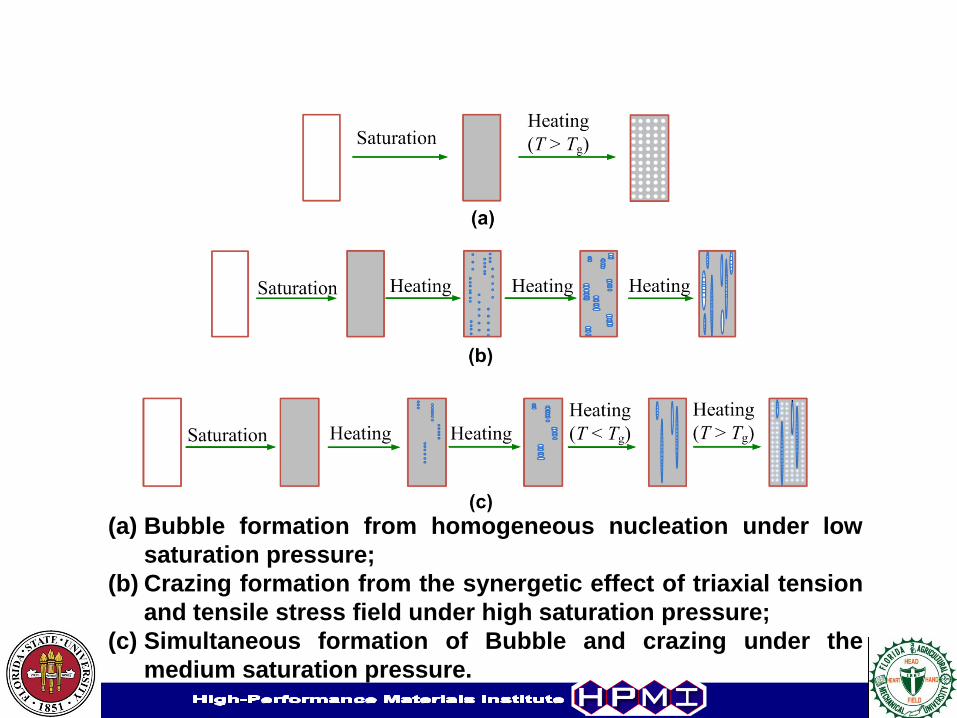
(a) Bubble formation from homogeneous nucleation under low
saturation pressure;
(b) Crazing formation from the synergetic effect of triaxial tension
and tensile stress field under high saturation pressure;
(c) Simultaneous formation of Bubble and crazing under the
medium saturation pressure.
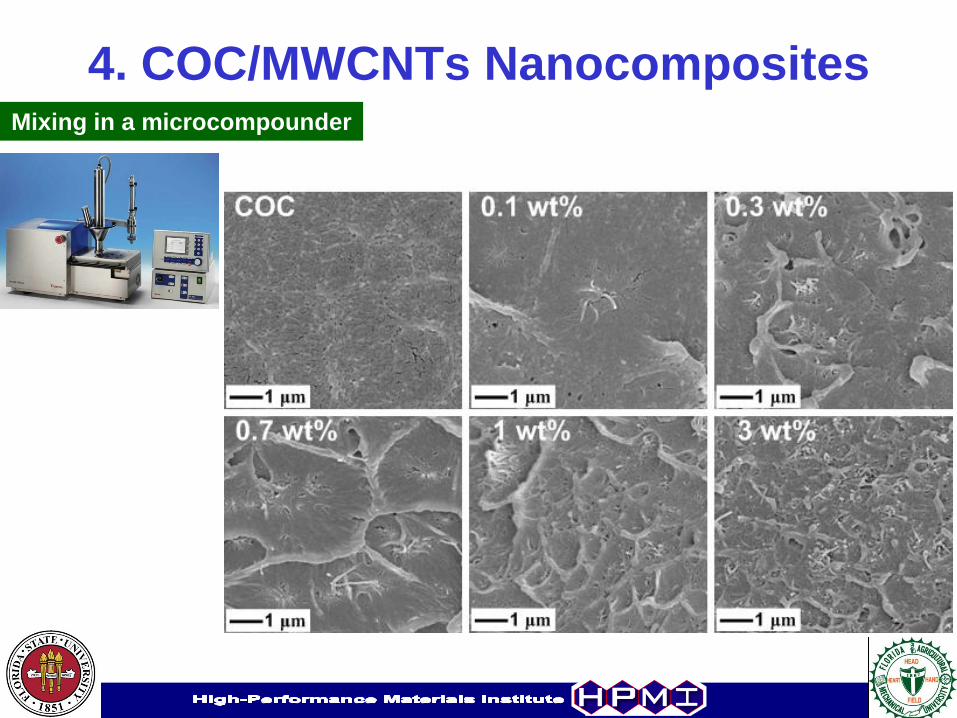
4. COC/MWCNTs Nanocomposites Mixing in a microcompounder
10-1
100
101
102
101
102
103
104
105
COC
0.1 wt%
0.3 wt%
0.5 wt%
0.7 wt%
1 wt%
3 wt%
G' (P
a)
(rad/s)
10-1
100
101
102
102
103
104
105
COC
0.1 wt%
0.3 wt%
0.5 wt%
0.7 wt%
1 wt%
3 wt%
G" (
Pa
)(rad/s)
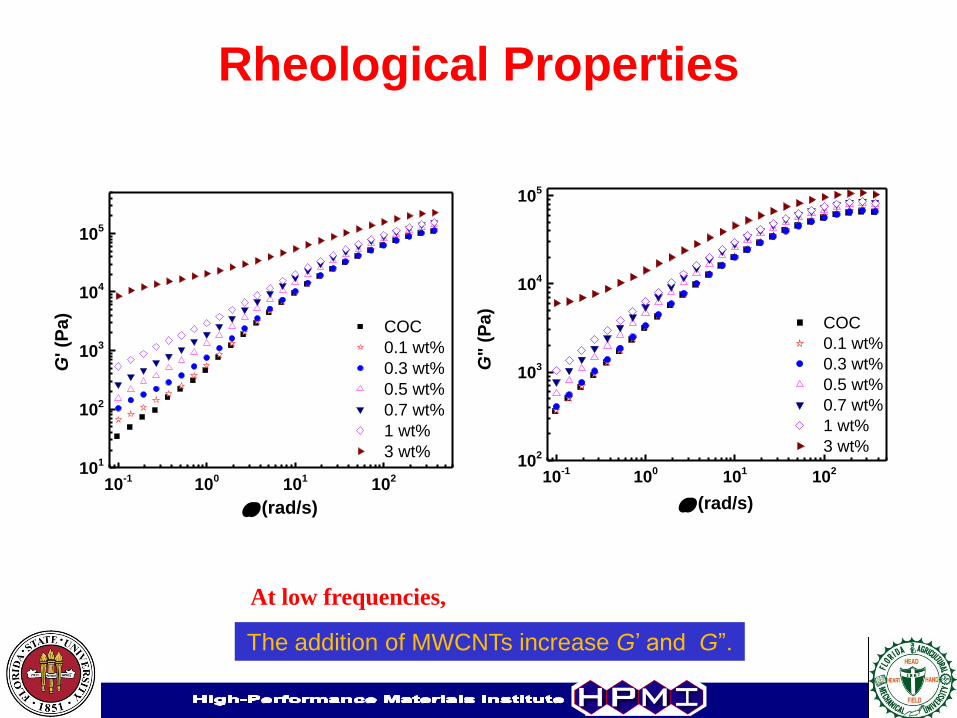
Rheological Properties
The addition of MWCNTs increase G’ and G”.
At low frequencies,
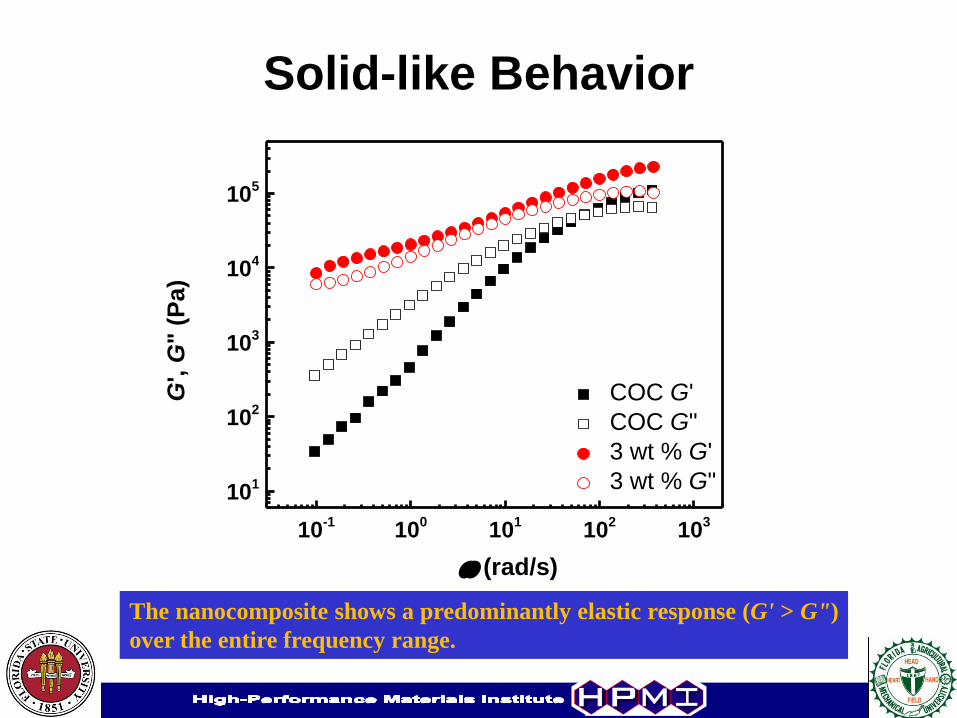
Solid-like Behavior
10-1
100
101
102
103
101
102
103
104
105
COC G'
COC G"
3 wt % G'
3 wt % G"
G', G
" (
Pa)
(rad/s)
The nanocomposite shows a predominantly elastic response (G' > G")
over the entire frequency range.

Complex Viscosity, η*
10-1
100
101
102
103
102
103
104
105
COC
0.1 wt%
0.3 wt%
0.5 wt%
0.7 wt%
1 wt%
3 wt%
(P
as
)
(rad/s)
Above 1 wt%, there is a significant jump in viscosity.
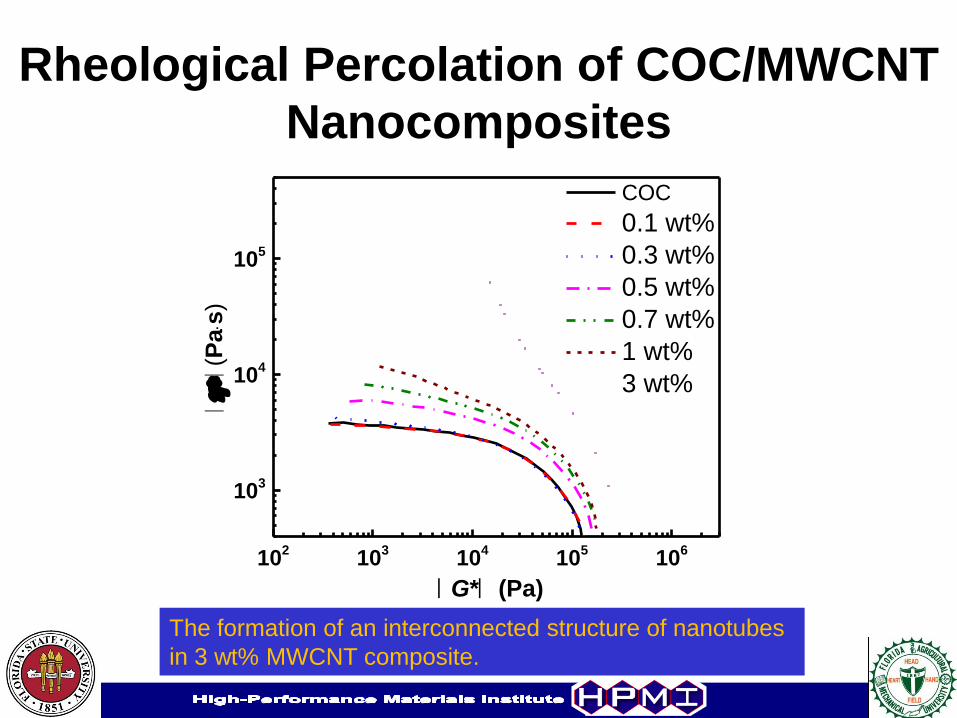
Rheological Percolation of COC/MWCNT
Nanocomposites
102
103
104
105
106
103
104
105
COC
0.1 wt%
0.3 wt%
0.5 wt%
0.7 wt%
1 wt%
3 wt%
(P
as
)
G* (Pa)
The formation of an interconnected structure of nanotubes
in 3 wt% MWCNT composite.

102
103
104
105
20
30
40
50
60
70
80
90
COC
0.1 wt%
0.3 wt%
0.5 wt%
0.7 wt%
1 wt%
3 wt%
(
De
g.)
G* (Pa)
The vGP plot was useful for elucidation of change of elasticity resulting
from “rheological percolation”. At 3 wt% MWCNT content, a sudden
decrease of |G*| was found, indicating the existence of a rheological
percolation threshold between 1 wt% and 3 wt% MWCNT.
Van Gurp plot

Electrical Conductivity,σ´
10-1
100
101
102
103
104
105
106
10-16
10-14
10-12
10-10
10-8
10-6
10-4
10-2
COC 0.1 wt%
0.3 wt% 0.5 wt%
0.7 wt% 1 wt%
3 wt%
A
C (
S/c
m)
Frequence (Hz)
The low-frequency conductivity changes significantly.
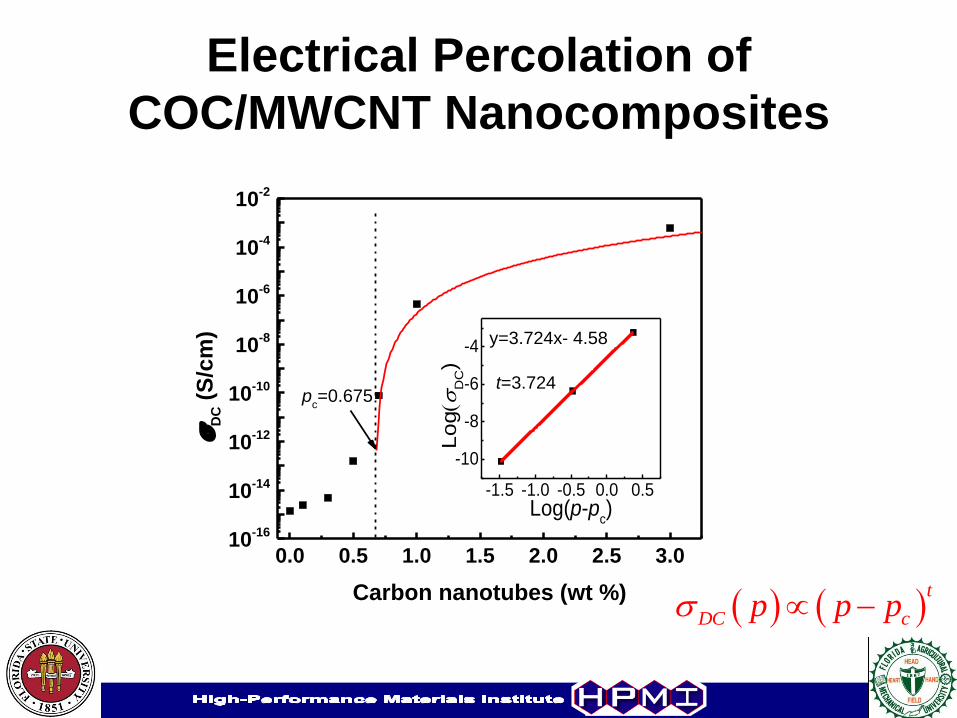
Electrical Percolation of
COC/MWCNT Nanocomposites
0.0 0.5 1.0 1.5 2.0 2.5 3.010
-16
10-14
10-12
10-10
10-8
10-6
10-4
10-2
-1.5 -1.0 -0.5 0.0 0.5
-10
-8
-6
-4
Lo
g
DC)
Log(p-pc)
D
C (
S/c
m)
Carbon nanotubes (wt %)
y=3.724x- 4.58
pc=0.675
t=3.724
t
DC cp p p
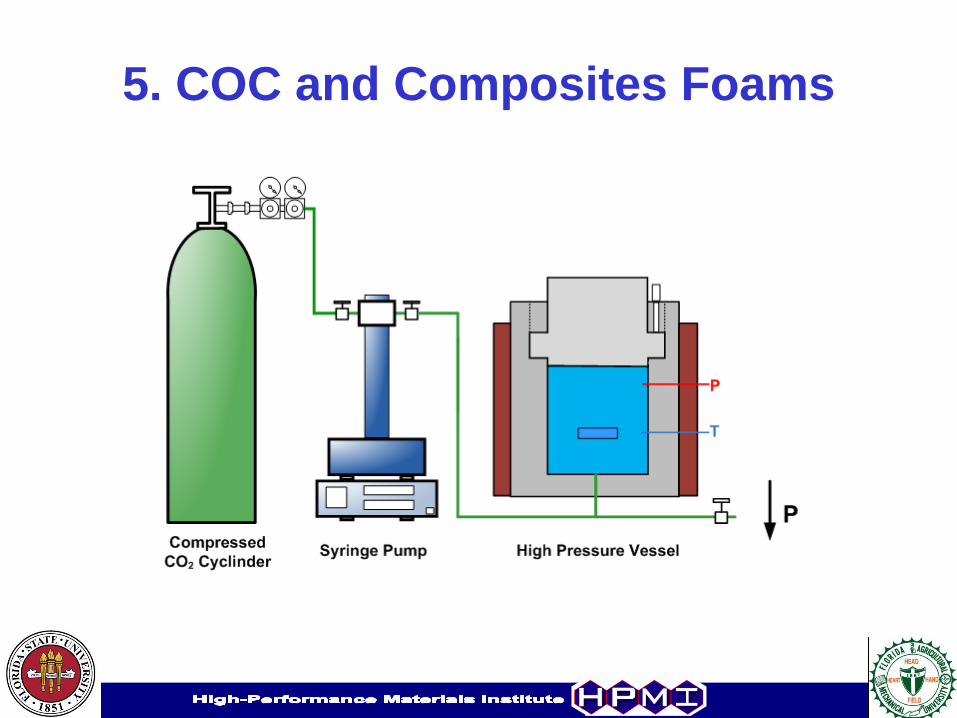
5. COC and Composites Foams
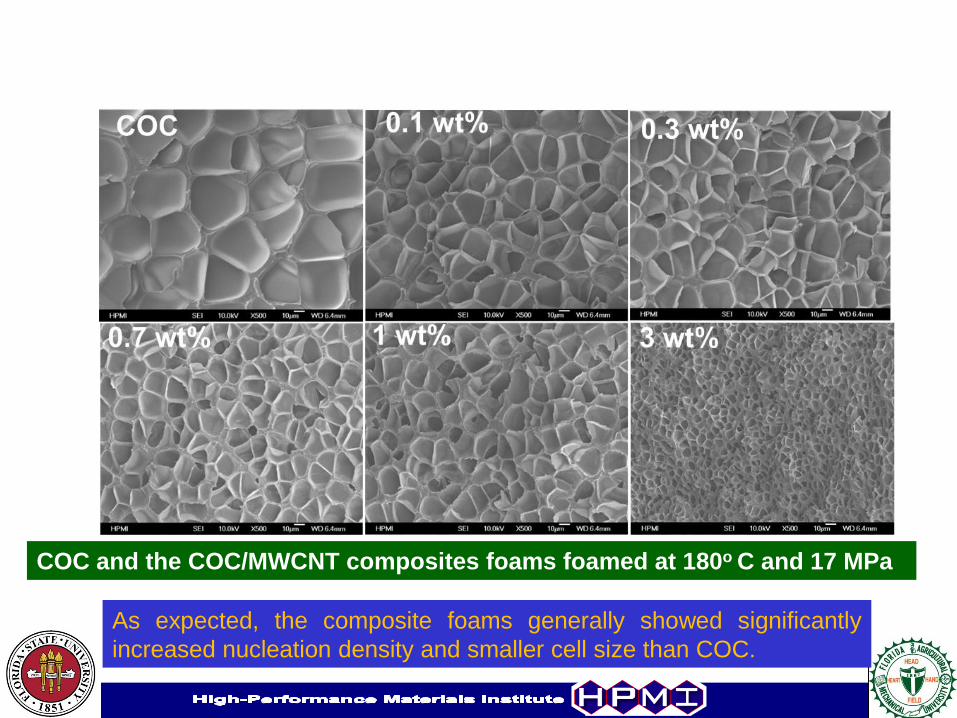
As expected, the composite foams generally showed significantly
increased nucleation density and smaller cell size than COC.
COC and the COC/MWCNT composites foams foamed at 180o C and 17 MPa
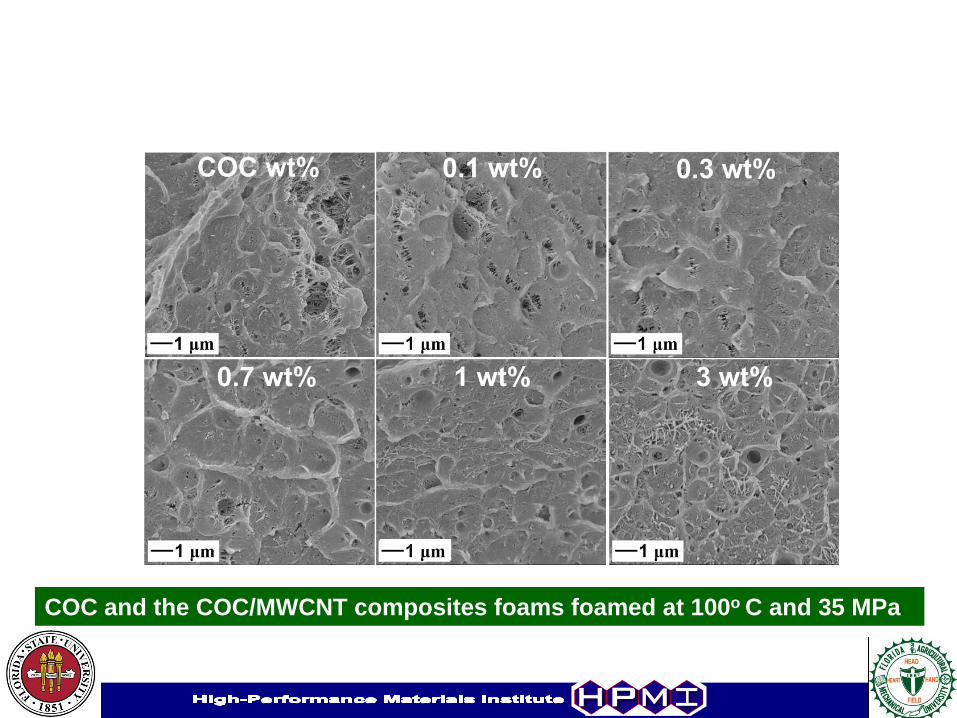
COC and the COC/MWCNT composites foams foamed at 100o C and 35 MPa
0.0 0.5 1.0 1.5 2.0 2.5 3.00
5
10
15
20
25
30
35
40
45
Ce
ll d
iam
ete
r (
m)
Content of nanotubes (wt %)
107
108
109
1010
Ce
ll d
en
sit
y (
ce
ll/c
m3)
I II III
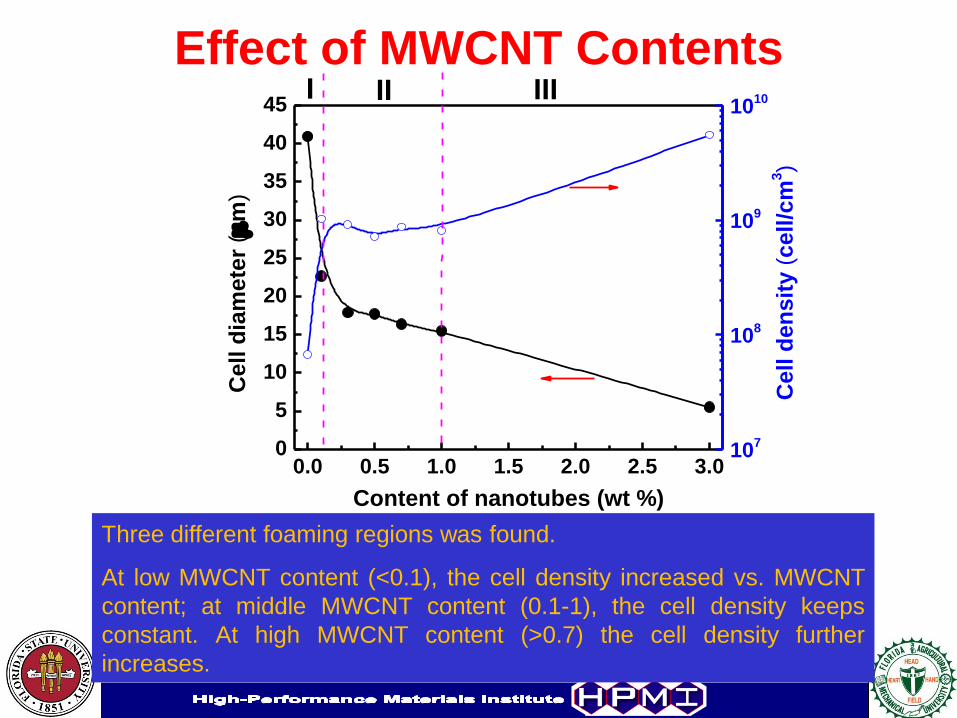
Effect of MWCNT Contents
Three different foaming regions was found.
At low MWCNT content (<0.1), the cell density increased vs. MWCNT
content; at middle MWCNT content (0.1-1), the cell density keeps
constant. At high MWCNT content (>0.7) the cell density further
increases.

170 175 180 185 190
107
108
109
1010
Ce
ll d
en
sit
y (
ce
ll/c
m3)
Temperature (oC)
COC
0.3 wt%
1 wt%
3 wt%
170 175 180 185 1900
20
40
60
80
100
120
Cell
dia
mete
r (
m)
Temperature (oC)
COC
0.3 wt%
1 wt%
3 wt%
Effect of foaming temperature
At lower temperatures (170 oC-185 oC), COC composites show a
increase of cell density due to the enhanced nucleation rate, while at
higher temperature (185 oC), bubble rupture and collapse reduce the
cell density.
3
2
16exp
3N
kT P

10 12 14 16 18 20 22 240
10
20
30
40
50
60
70
80
Ce
ll d
iam
ete
r (
m)
Pressure (MPa)
COC
0.3 wt%
1 wt%
3 wt%
10 12 14 16 18 20 22 2410
7
108
109
1010
1011
Ce
ll d
en
sit
y (
ce
ll/c
m3)
Pressure (MPa)
COC
0.3 wt%
1 wt%
3 wt%
Effect of foaming pressure
For COC and the composites, the cell density increased, with the
increase of foaming pressure from 10 MPa to 20 MPa. However
further increase of pressure (>20 MPa), the cell density decreases.

Rheological explanation
0 1 8 910
0
102
104
106 /dTr d
Tr
c0 =210-3
c0 =410-3
c0 =810-3
Sta
bil
ity
Co
nd
itio
n
t (s)
The generalized Considère stability criterion.
Chemical Engineering Science, 66, 3656-3665.
Strong COC-CO2 interaction and associated severe depression of bulk
glass transition temperature.
CO2 Foaming of COC by temperature jump was explored.
Ultramicrocelluar foams with a cell size of 0.5 μm and cell density over
1012 cells/cm3 were successfully prepared. Moreover, it was observed that
the system, which was strongly plasticized by CO2, would transition from
foaming to crazing under certain conditions.
MWCNTs loading leads to an increase of viscosity and conductivity in
this nanocomposite system.
CO2 Foaming of COC and nanocomposites by pressure quench was
explored. The foam morphology was highly sensitive to the foaming
conditions (pressure and temperature). Three different foaming regions
were found.
6. Summary

Thanks for your attention!