food research international - physics.umanitoba.ca et al food... · dough rheology (chin, martin,...
TRANSCRIPT

Contents lists available at ScienceDirect
Food Research International
journal homepage: www.elsevier.com/locate/foodres
Bubbles in noodle dough: Characterization by X-ray microtomography
R.-M. Guillermica, F. Kokselb, X. Sunb, D.W. Hatcherb,c, M.T. Nickersond, G.S. Beleve,1,M.A. Webbe, J.H. Pagea, M.G. Scanlonb,⁎
a Department of Physics & Astronomy, University of Manitoba, Winnipeg, Manitoba R3T 2N2, CanadabDepartment of Food & Human Nutritional Sciences, University of Manitoba, Winnipeg, Manitoba R3T 2N2, Canadac Canadian Grain Commission, Grain Research Laboratory, 1404-303 Main St., Winnipeg, Manitoba R3C 3G8, Canadad Department of Food and Bioproduct Sciences, University of Saskatchewan, 51 Campus Drive, Saskatoon, SK, Canadae Canadian Light Source Inc., 44 Innovation Boulevard, Saskatoon, SK, Canada
A R T I C L E I N F O
Keywords:X-ray microtomographySynchrotron sourceNoodle doughBubble size distributionBubble orientationWork input
A B S T R A C T
Bubbles, found in a huge variety of food products, are known to afford desirable quality attributes, especiallythose related to texture, mouthfeel and taste. However, the presence of bubbles and their effects on wheat flournoodles is an aspect that has been, until now, largely overlooked, despite the positive and negative connotationsof bubbly inclusions on Asian noodle quality. X-rays from a synchrotron source (Biomedical Imaging andTherapy facility at the Canadian Light Source) were used to rapidly and non-destructively acquire tomographicimages of noodle dough. Appropriate image analysis protocols were used to determine the bubble size dis-tribution, the orientation of bubbles, and their position within the dough sheet. The effect of processing (one ormultiple lamination steps) on bubble properties in the dough that was subsequently sheeted (gradual elongationand reduction in thickness) was investigated. Bubble size distributions, well captured by lognormal distributionfunction, showed that the lamination process induced bubble entrapment and reduction in bubble size. Bubbleswere found to be flat, elongated and oriented in the sheeting direction, this effect being less for doughs laminatedten times (90° rotations between lamination steps). Interestingly, a gradient in concentration of bubbles withinthe dough sheet was found from the noodle core to the sheet edges. Aging effects were also apparent. This firstnon-destructive study of bubbles in wheat-flour noodle dough provides a more complete knowledge of the doughsheet's internal structure, and how it originates via processing, and this has repercussions on the overall qualityof Asian noodles.
1. Introduction
Asian noodle quality for the consumer is largely determined by thetexture and mouth feel of the product (Hou, Otsubo, Okuso, & Shen,2010; Ross, 2006; Smewing, 2016). In optimizing noodle texture, agood number of studies have focused on the influence of the compo-sition of the noodle dough (Diep et al., 2014; Fu, 2008; Hatcher et al.,2014; Miskelly & Moss, 1985; Ross & Crosbie, 2010) or the work inputduring noodle making (Edwards, Scanlon, Kruger, & Dexter, 1996;Hatcher & Anderson, 2007). However, the influence of bubbles onnoodle properties has not been investigated, despite some researchersmentioning the possibility of the presence of bubbles (Bellido &Hatcher, 2010; Hatcher, Bellido, & Anderson, 2009; Salimi-Khorshidi,2016), and substantial industrial interest in how vacuum mixing affectsnoodle rheology and texture (Li et al., 2014; Li et al., 2016; Liu et al.,2015).
Bubbles in food are important for two reasons. Firstly, they areknown to contribute to good mouthfeel and texture in many foods(Campbell, Scanlon, & Pyle, 2008; Campbell, Webb, Pandiella, &Niranjan, 1999). In bread making for example, the bubble distributionis strongly affected by the rheological properties of the dough (Bellido,Scanlon, Page, & Hallgrimsson, 2006) and the bubbles in turn affectdough rheology (Chin, Martin, & Campbell, 2005); bubbles also governthe quality of the resulting product (Baker & Mize, 1941; Campbell,Rielly, Fryer, & Sadd, 1998; Scanlon & Zghal, 2001). Secondly, bubblesrepresent a separate phase within the food material, which can nega-tively influence the quality of the food product. For example, vacuummixing of pasta dough is important for product appearance because ofthe reduction in bubble numbers that occurs (Dawe, Johnston, &Dintheer, 2001). In addition, since the majority of both pasta (Johnston& Dintheer, 2001) and noodle (Hou et al., 2010) products are dried toattain shelf-stability, bubbles can be problematic since they represent
https://doi.org/10.1016/j.foodres.2017.11.050Received 31 August 2017; Received in revised form 9 November 2017; Accepted 19 November 2017
⁎ Corresponding author.
1 Current address: Department of Electrical and Computer Engineering, University of Saskatchewan, 57 Campus Drive, Saskatoon, SK, Canada.E-mail address: [email protected] (M.G. Scanlon).
Food Research International 105 (2018) 548–555
Available online 22 November 20170963-9969/ © 2017 Published by Elsevier Ltd.
T

discontinuities in the noodle dough matrix from which uneven ther-mohygroscopic stresses can emanate during drying (Inazu, Iwasaki, &Furuta, 2005; Mercier, Mondor, Moresoli, Villeneuve, & Marcos, 2016);the resulting checking that develops during distribution and retailing isperceived negatively by consumers (Inazu et al., 2005; Smewing, 2016).
Because dough products are not transparent, bubbles cannot beobserved by direct visual observation techniques, and preparativetechniques for electron microscopy thwart accurate determinations ofbubble distributions. X-Ray microtomography is a method that has beensuccessfully used for bread dough products to non-invasively measurebubble size distributions and their evolution over time (Babin, DellaValle, Dendievel, Lourdin, & Salvo, 2007; Falcone et al., 2006; Koksel,Aritan, Strybulevych, Page, & Scanlon, 2016; Turbin-Orger et al.,2015). However, bubbles in noodle dough have to our knowledge notbeen a subject of direct observation, perhaps due to their lower con-centration (based on density measurements (Bellido & Hatcher, 2010)),but also because noodle doughs are not leavened, as bread dough is,examination of bubbles has not been deemed important. Nevertheless,the presence of bubbles will affect the quality of the manufacturednoodles and the texture of the cooked product. Bubbles will also affectnoodle dough drying performance and the appearance of the packagedproduct. As a consequence, an understanding of bubbles and theirorigin during noodle dough sheet manufacturing is important for op-timizing quality for this global food staple.
The objective of this work is to show that noodle dough contains airbubbles whose properties are altered by the manufacturing process.One of the main interests of this work is the use of X-Ray micro-tomography and powerful image analysis techniques to characterize thedistribution and orientation of the bubbles, outcomes that can be usedin other food processing applications.
2. Materials and methods
2.1. Materials and sample preparation
A hard red spring wheat flour (made from a blend of CanadaWestern Red Spring varieties which graded #1 CWRS) was used toprepare noodle dough sheets at 37% water (fwb) absorption with foodgrade NaCl (1% w/w of flour) added as a solution. Doughs were pre-pared using an asymmetrical speed mixer (Model DAC 150 FV, FlackTecInc., Landrum, SC), by mixing for 30 s at 3000 rpm in a Pin Max 80bowl (Hatcher & Preston, 2004).
The mixed dough crumb was subject to one of two laminating(compounding) processes (Hou, 2010; Hou et al., 2010) on a laboratorynoodle machine (Ohtake, Tokyo, Japan) with a ten inch diameter pairof rolls at an initial gap setting of 3.0 mm (Salimi-Khorshidi, 2016).After a first lamination step to create a coherent dough sheet from thedough crumb, the dough sheet was folded in half and laminated at thesame roll gap (3.0 mm) either once or ten times. For the dough lami-nated ten times, a 90° rotation was performed at lamination steps 2, 4, 6and 8, resulting in a dough sheet that was rotated 4 times in total.Following lamination (compounding), dough sheets were submitted toseven reduction passes reducing dough sheet thickness gradually (Houet al., 2010) by passing through roll gaps from 3.00 mm to 1.10 mm
(Table 1). The two noodle dough treatments (referred to as 1lam and10lam) were therefore different in terms of processing and the amountof work input during processing (Ross & Crosbie, 2010), with controlover differences attributable to the number of folding steps occurringduring lamination.
Dough sheets were placed in plastic bags and were refrigerated inbetween experiments. Dough sheet thickness was measured using acaliper prior to experiments in the synchrotron. Dough samples wereexcised from random locations in the dough sheets: three samples from10lam, and two samples from 1lam. Analysis of bubble size distribu-tions occurred primarily between 32 and 40 h after noodle dough sheetmanufacturing (see Table 2), except for one sample (1lam2).
2.2. Tomography experiments
Experiments were conducted on the Biomedical Imaging andTherapy Facility Insertion Device beamline (BMIT-05ID-2 SOE-1) at theCanadian Light Source (Saskatoon, Saskatchewan). The source is amulti-pole superconducting 4.3 T wiggler. Monochromatic X-rays of25 keV energy were produced using a bent double-Laue crystal mono-chromator. (Wysokinski et al., 2015). Filtering of the beam wasachieved by inserting an aluminum filter (thickness 1 mm). The de-tector was an AA-60 beam-monitor with a 10 μm Gadox (Gadoliniumoxysulfide) scintillator with a Hamamatsu C9300-124 CCD camera. Thepixel size was 8.75 μm/pixel resolution at the scintillator. Preliminaryexperiments were performed to choose the optimum distance betweensample and detector, finally chosen to be 80 cm. A flat-field correctionwas performed before each noodle dough scan: the flat image (shutteropen and no sample) and the dark image (no beam) were taken se-quentially in order to correct the background. The dark image measuresthe electronic background of the CCD. The flat field measures in-homogeneities in the source and effects of all the optics (filters,monochromator, scintillator, detector optics).
For each experiment, the chosen dough sheet was taken out of thefridge, a sample was cut and placed in a circular plastic holder, whichwas covered with parafilm to prevent moisture loss. The holder wasthen immediately mounted on the rotation stage in the experimentalhutch of the X-ray beamline. Sample scanning involved a rotationthrough 180° with 0.3° steps at an exposure time of 0.04 s for each X-rayimage. A complete scan with data download was performed in 74 s.From the 600 projections (4000 × 248 pixels) obtained with the scan,we performed a reconstruction with NRecon software to get 200 slices(4000 × 4000 pixels) of the noodle dough sample (slice height of8.75 μm).
2.3. Extracting bubble size distributions
Image analysis was performed with the open source software Fiji(Schindelin et al., 2012), and the “3D Object Counter” (Bolte &Cordelières, 2006) and “BoneJ” Particle Analyzer (Doube et al., 2010)plugins. We chose to analyze a selection of 948 × 948 pixels in themiddle of each sample slice in stacks of 120 or 160 slices depending onthe sample; for example, accurate assessments of bubble sizes in slicesclose to the edge are not attainable. On the slices, bubbles were clearlyvisible (black pixels) and were well separated from the grey backgroundof noodle dough matrix (Fig. 1a and b). After thresholding (Fig. 1c), thebubbly structure of the noodle dough sheet was readily visualized in theimage in 3D using Fiji's 3D viewer. An example for a sample that hadbeen laminated once is shown in Fig. 1.
The centre position of each bubble, in x, y and z coordinates, and itsvolume in voxels were calculated from the binary image stacks(Fig. 1c), using the particle analyzer plugin of Fiji. Bubbles touching theside of the 3D Region Of Interest (ROI) were not taken into account, anda cut-off of 10 voxels (corresponding to 11 μm equivalent radius) waschosen so as to remove objects that were small compared to the re-solution limit. More particularly, setting this cut-off removed noise
Table 1Sheeting roll gaps for the noodle dough sheet manufacturing process.
Pass number Reduction roll gap (mm)
1 3.002 2.553 2.154 1.855 1.556 1.357 1.10
R.-M. Guillermic et al. Food Research International 105 (2018) 548–555
549

from the X-Ray images which produced black dots that would otherwisebe considered as bubbles, and which would give rise to erroneousbubble size distributions. In order to calculate an equivalent radius forbubble distribution characterizations, we considered each bubble to bespherical, i.e., size was defined as the radius of a sphere that wouldcontain a volume equivalent to that of the real bubble. Nevertheless, theelongation of the bubbles was also characterized by measuring theiractual dimensions.
3. Results and discussion
The microtomography images allow, via careful image analysis, anextensive study of the presence of bubbles, their size and spatial dis-tribution, and their elongation due to the processing of the dough sheet.From a study of two different manufacturing techniques of one unitoperation – the sheeting process, the effect that noodle processing hason bubble characteristics within the noodles was observed.
3.1. Bubble size distributions
The bubble equivalent radius distribution was measured for allsamples; typical results for both processing regimes (i.e., one lamina-tion step and ten lamination steps) are shown in Fig. 2.
It has been shown that the bubble size distributions in bread doughare well characterized by lognormal distributions (Bellido et al., 2006;Koksel et al., 2016; Shimiya & Nakamura, 1997). The mechanism oc-cluding bubbles in bread dough during mixing of the dough is that airpockets are entrapped and subdivided iteratively into randomly sizedbubbles (Campbell, 1991; Shimiya & Nakamura, 1997), with the finalvolume fraction of bubbles in the dough determined by rates of airentrainment and disentrainment (Chin, Martin, & Campbell, 2004). Thehigh viscosity of the noodle dough (Liao, Chung, & Tattiyakul, 2007),and the fact that most gluten development takes place during lami-nating and sheeting rather than during mixing (Hou et al., 2010),means that bubbles in noodle dough are not necessarily nucleated by
Table 2Lognormal distribution characterization parameters for bubble sizes in noodle dough sheets subject to one or ten lamination steps during manufacturing. Standard error (SE) of the fit formedian radius, polydispersity ε and mean radius are given, as well as the coefficient of determination R2. Volume fraction of bubbles is calculated by doing the ratio of total volumeoccupied by bubbles to the total volume of the region of interest.
Treatment 1lam1 1lam2 10lam1 10lam2 10lam3
Bubble number 10,842 6304 30,891 24,709 25,975Age 32 h 9 min 51 h 23 min 32 h 47 min 39 h 35 min 39 h 40 minMedian radius 22.3 ± 0.1 μm 21.9 ± 0.1 μm 19.5 ± 0.1 μm 19.2 ± 0.1 μm 18.5 ± 0.2 μmPolydispersity ε 31.1 ± 0.4% 28.9 ± 0.5% 27.0 ± 0.7% 26.2 ± 0.6% 26.4 ± 0.9%Mean radius 23.4 ± 0.1 μm 22.9 ± 0.1 μm 20.2 ± 0.2 μm 19.9 ± 0.1 μm 19.2 ± 0.2 μmCoefficient of Determination R2 0.9949 0.9914 0.9949 0.9912 0.9816Volume fraction of bubbles 0.89% 0.62% 1.3% 1.01% 1.0%
Fig. 1. A region of interest of 948 × 948 pixels ischosen in the image of a noodle dough sheetsample, and a threshold is chosen to binarize theimage. This process is repeated for stacks of 120to 160 image slices.
R.-M. Guillermic et al. Food Research International 105 (2018) 548–555
550

similar mechanisms to those occurring in bread dough. Nevertheless,the bubble size distributions in noodle dough sheets were all well de-scribed by a lognormal distribution probability density function (pdf)given by:
⎜ ⎟= ⎛⎝
− ⎞⎠
f Rπ εR
ln R Rε
( ) 12
exp [ ( / )]2
02
2 (1)
where R is bubble radius, R0 is the median of the lognormal distribu-tion, and ε is the polydispersity of the distribution. The fitting para-meters of the lognormal distribution pdf for the samples are summar-ized in Table 2.
From Fig. 2 and Table 2, it can be seen that the number of lami-nation steps during manufacturing has a pronounced effect on thebubble size distribution in noodle dough sheets. The total number ofbubbles and the volume fraction of bubbles are significantly higher inthe ten lamination noodle dough sheets compared to sheets preparedwith only one lamination step. Median bubble size and polydispersityare also significantly lower in the noodle dough sheets prepared withten laminations. Although conventional understanding is that lamina-tion (compounding) “fills in gaps and holes” (Hou et al., 2010; Ross &Hatcher, 2005a; Ross & Hatcher, 2005b), nucleation of bubbles by airentrapment is expected during lamination when the dough sheet isfolded in two. The creation of finer, and more numerous, bubbles hasbeen reported for multiple lamination passes of bread dough(Morgenstern, Zheng, Ross, & Campanella, 1999) and pastry dough(Bousquieres, Deligny, Riaublanc, & Lucas, 2014). An illustration of thedifference in bubble size distributions according to processing regime isshown in Fig. 3 where typical slice images were extracted from stacks
corresponding to the middle (in depth) of the dough sheet.
3.2. Gradient in dough sheet thickness
A gradient in the quantity of bubbles is visible in the xz and yz cutsin Fig. 3, where we see clearly, before image processing, that thenumber of bubbles is higher in the middle of the thickness of the doughsheets. To investigate quantitatively how the repetitive nature of thelamination process affected the bubble distribution, the distributionwithin the thickness of the dough sheet was probed. To do so, the datawas split along the z-coordinate direction (thickness) to create sectionsthat were 8 slices thick, i.e., 70 μm. For each section, mean bubbleequivalent radius, volume fraction, and the total number of bubbleswere calculated. Since the analyzed stack of slices was not necessarilyin the middle of the noodle dough sheet, a correction for position wasadded (based on thickness determination from caliper measurements)in order to legitimately compare depth across all samples. The thicknessindicated in Figs. 4, 5 and 6 is the real position of sections relative to thebottom surface of the noodle sheet (z = 0).
Bubbles were clearly distributed non-uniformly inside the noodledough sheets (Fig. 4). In general, their number was higher in the middleof the dough sheet, and this was very evident for noodle doughs madewith a greater number of lamination steps. The volume fraction ofbubbles was also larger in sheets that were laminated multiple times(Fig. 5). The mean bubble equivalent radius for the dough laminatedmultiple times, was also larger in the center of the noodle sheet (Fig. 6).More layers of bubbles are potentially created in the ten laminationprocess vs one layer of bubbles; the lamination (compounding) process
Fig. 2. Typical bubble size distributions in noodledoughs processed with one lamination step (a) andten laminations (b); solid lines are lognormal fits tothe distributions (see Table 2 for fitting parameters).
Fig. 3. Slices extracted from the middle of doughsheets processed with one lamination (a) and tenlaminations (b). Images on the right and bottomof the xy slices are slices in the yz and xz planes,respectively, extracted along the yellow lines.(For interpretation of the references to color inthis figure legend, the reader is referred to theweb version of this article.)
R.-M. Guillermic et al. Food Research International 105 (2018) 548–555
551

is clearly a source of bubble entrapment, and a modification of thebubble distribution.
3.3. Aging of bubbles in noodle doughs
It has been shown that disproportionation is a powerful mechanismchanging the bubble size distribution in bread doughs that are madewithout yeast (Koksel, Scanlon, & Page, 2016). Bubble sizes from Fig. 6are such that we would expect substantial Laplace-pressure-generatedelevations in pressure in the bubbles (van Vliet, 1999), perhaps as largeas 7% above atmospheric pressure (from ΔP = 2γ/R, where γ is theinterfacial tension); this pressure difference will drive disproportiona-tion and so alter bubble sizes in noodle doughs. Two bubble agingphenomena are evident in Table 2 and in Figs. 4-6 that are consistentwith changes in bubble numbers and sizes arising from dis-proportionation.
The gas volume fraction, the number of bubbles and the mean
bubble radius decrease as one approaches either surface of the noodlesheet, regardless of the number of laminations. The open atmospherewill act as a sink for gas diffusing out of the bubbles where the gas is ata higher pressure (van Vliet, 1999). Shorter diffusion paths for the gasin bubbles nearer the edge will accelerate shrinkage for the bubblescloser to the edges of the noodle dough sheet (Fig. 6). Loss of gas will befurther enhanced if oxygen is consumed in the dough, for example byfree fatty acids and polyphenol oxidase (Hatcher, 2010), since this willpotentially increase the partial pressure of nitrogen to almost 30% morethan the partial pressure of nitrogen in the atmosphere around thenoodle dough sheet.
A second factor is the progression in all three bubble parameters(Figs. 4-6) due to delays in analyzing the bubbles tomographically. Thenumber of bubbles decreases with time (Table 2), as expected for pro-cesses governed by disproportionation (Meinders & van Vliet, 2004),and in the samples laminated once, where there was a greater delay inanalyzing samples compared to the samples laminated ten times, thereis a greater percentage drop in bubble numbers (Table 2).
Fig. 4. Number of bubbles per m3 (70 μm sections) as a functionof position in the thickness direction of the noodle sheets. Opensymbols: 10 lamination samples, Closed symbols: 1 laminationsamples. lam1: , lam2: , 10lam1: , 10lam2: , 10lam3: .Lines are guides for the eye.
Fig. 5. Air volume fraction in each 70 μm section as a function of position in the thicknessdimension of noodle dough sheets processed by different lamination techniques. Opensymbols: 10 lamination subsamples, Closed symbols: 1 lamination subsamples. lam1: ,lam2: , 10lam1: , 10lam2: , 10lam3: .
Fig. 6. Mean equivalent radius of bubbles in each 70 μm section as a function of positionin the thickness dimension of noodle dough sheets processed by different laminationtechniques. Open symbols: 10 lamination samples, Closed symbols: 1 lamination samples.lam1: , lam2: , 10lam1: , 10lam2: , 10lam3: .
R.-M. Guillermic et al. Food Research International 105 (2018) 548–555
552

3.4. Bubble orientations
Cursory examination of the tomography images revealed that thebubbles appeared more elongated in the direction of sheeting (y di-rection in Fig. 3). The effect was more obvious for the sheets laminatedonly once, where the lamination and elongation due to sheeting areperformed in the same direction. The processing used to manufacturethe 10 lamination sample involves rotation of the sheet between la-minations, followed by elongation steps in one direction. Therefore, ifthe orientation of bubbles is determined mainly by the laminationprocess, we would expect to have a more homogeneous orientation ofbubbles in the samples processed with ten lamination steps.
We performed a quantitative analysis of bubble orientation usingthe plugin BoneJ (Doube et al., 2010) in Fiji. To measure any anisotropyof the bubbles in the dough sheet, we used BoneJ to determine themoments of inertia along the short, medium and long axes for eachbubble. Although this was conducted for all bubbles, we report resultsfor bubbles with sizes> 97 voxels, even though results for all bubblesare consistent with anisotropy results for the larger bubbles. From themoments of inertia two parameters, flatness and elongation can bedefined :
=FlatnessLength of intermediate axis
Length of shortest axis
=ElongationLength of longest axis
Length of intermediate axis
The results are shown in Table 3. From this, one can see that bothlamination processes induced a flattening of the bubbles, and this wasslightly more so for bubbles in the noodle doughs subject to one lami-nation. These flattened bubbles were also elongated, with this elonga-tion being greater for the one lamination process.
By extracting the x, y and z components of the unit vector of thelongest principal axis of each bubble in the region of Interest, we cancalculate the angles (orientations) of the bubbles relative to the thick-ness of the sheet and the sheeting direction that corresponded to theseanisotropic parameters, flatness and elongation.
From the Cartesian projection with ρ = 1 (unit vector) for eachbubble's longest principal axis, angles θ and φ can be recovered forevery bubble:
⎧
⎨⎩
===
x ρ sin θ cos φy ρ sin θ sin φz ρ cos θ
The angle θ corresponds to the orientation of the longest principalaxis with respect to the thickness of the dough sheet. The histograms inFig. 7 indicate that regardless of the extent of lamination, this angle wasclose to 90° with the longest axis almost exclusively located in thehorizontal xy planes of the dough sheet. This is not unexpected since wewould expect any preferential elongation of bubbles to occur in theplane perpendicular to the roll gap where dough compression takesplace (Levine, 1998). CLSM images of pastry dough that was subject to
multiple laminations demonstrated that elongation of bubbles occurredin the sheeting direction (Bousquieres et al., 2014).
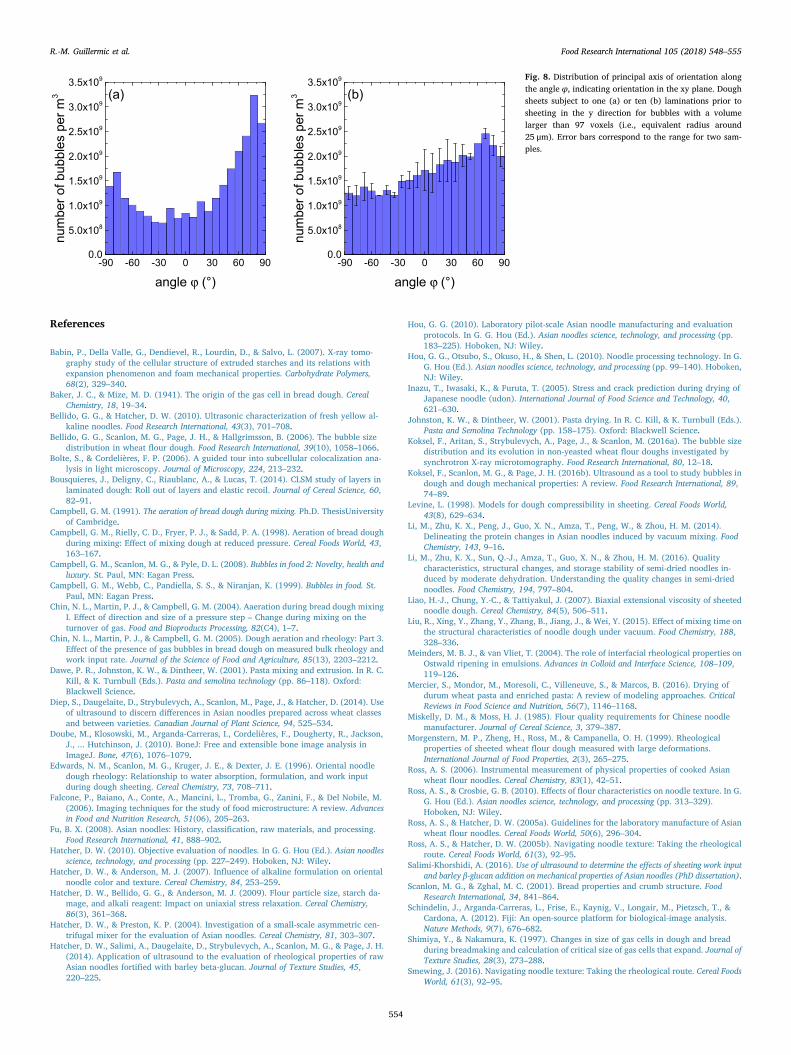
Although it is quite clear for both lamination treatments that therewas no tendency for bubbles to orient in the z direction, the histogramof bubble orientations in the xy plane (angle φ) differs depending onwhether the dough was subject to one or ten laminations. A pronouncedorientation in the sheeting direction (φ) was observed for dough subjectto one lamination with the fewest number of bubbles being orientedperpendicular (within the x-y plane) to the sheeting direction (Fig. 8a).Orientation in the x-y plane was less clear for noodle sheets made with10 lamination steps. Evidently, dough sheets prepared with multipleperpendicular laminations are a much more homogeneous product.
4. Conclusions
This study clearly demonstrated that noodle doughs contain manybubbles, despite their relatively low volume fraction. Bubble size dis-tributions were well captured by a lognormal distribution. Because thegas volume fraction of multiply-laminated sheets was significantlyhigher, we conclude that lamination steps entrap bubbles within thedough sheet, and these bubbles are smaller and more homogeneous insize. Bubbles were essentially localized around the centre (in thickness)of the noodle dough sheet, and this was more pronounced for doughsheets prepared with 10 laminations. This is likely associated withbubble aging, due to gas in bubbles close to the surface escaping morereadily. The sheeting process that compresses the dough between therolls, flattens the bubbles and elongates them in the sheeting direction(and this is pronounced for larger than average bubble size). Despite theunidirectional process of sheeting, a persistent effect of laminationhistory affected the bubble distribution in the final noodle dough sheet.These findings provide a more complete knowledge of the structure ofnoodle dough sheets, findings that have implications for noodle quality.
Acknowledgements
Research described in this paper was performed at the BMIT facilityat the Canadian Light Source, which is supported by the CanadaFoundation for Innovation, Natural Sciences and Engineering ResearchCouncil of Canada, the University of Saskatchewan, the Government ofSaskatchewan, Western Economic Diversification Canada, the NationalResearch Council Canada, and the Canadian Institutes of HealthResearch. Financial support for this research from NSERC Strategicgrant (STPGP 463167 – 14) and Discovery grants (RGPIN/138588-2013), and for research funds from Saskatchewan Agriculture & Food isvery much appreciated. The authors would like to thank personnel fromthe Grain Research Laboratory who supplied the samples, the CanadianLight Source in Saskatoon for the opportunity to perform this study aswell as for their great help during the experiments, Andrew Pankewyczfor the design and machining of the sample holder, all the team fromthe University of Saskatchewan who helped during the experimentalshiftwork and S. Kerhervé for fruitful discussions and comments.
Table 3Mean, median and standard deviations (SD) of flatness and elongation for all noodle sheetsamples (one lamination or ten laminations) for bubbles larger than 97 voxels.
Subsample 1lam1 1lam2 10lam1 10lam2 10lam3
# of bubbles(> 97 voxels)
3752 2102 5273 3687 3376
Flatness (mean) 1.10 1.13 1.09 1.11 1.10Flatness (median) 1.10 1.13 1.08 1.11 1.10Flatness SD 0.05 0.06 0.04 0.05 0.05Elongation (mean) 1.40 1.43 1.40 1.33 1.36Elongation (median) 1.28 1.30 1.26 1.19 1.22Elongation SD 0.36 0.41 0.38 0.37 0.37
Fig. 7. Distribution of principal axis of orientation along the angle θ, indicating pre-ferential orientation of bubbles at right angles to the roll gap (i.e., flattening in the z axisdirection): one lamination (a) and ten laminations (b). Note that the scales on the figuresare different. Error bars correspond to the range for two samples.
R.-M. Guillermic et al. Food Research International 105 (2018) 548–555
553
References
Babin, P., Della Valle, G., Dendievel, R., Lourdin, D., & Salvo, L. (2007). X-ray tomo-graphy study of the cellular structure of extruded starches and its relations withexpansion phenomenon and foam mechanical properties. Carbohydrate Polymers,68(2), 329–340.
Baker, J. C., & Mize, M. D. (1941). The origin of the gas cell in bread dough. CerealChemistry, 18, 19–34.
Bellido, G. G., & Hatcher, D. W. (2010). Ultrasonic characterization of fresh yellow al-kaline noodles. Food Research International, 43(3), 701–708.
Bellido, G. G., Scanlon, M. G., Page, J. H., & Hallgrimsson, B. (2006). The bubble sizedistribution in wheat flour dough. Food Research International, 39(10), 1058–1066.
Bolte, S., & Cordelières, F. P. (2006). A guided tour into subcellular colocalization ana-lysis in light microscopy. Journal of Microscopy, 224, 213–232.
Bousquieres, J., Deligny, C., Riaublanc, A., & Lucas, T. (2014). CLSM study of layers inlaminated dough: Roll out of layers and elastic recoil. Journal of Cereal Science, 60,82–91.
Campbell, G. M. (1991). The aeration of bread dough during mixing. Ph.D. ThesisUniversityof Cambridge.
Campbell, G. M., Rielly, C. D., Fryer, P. J., & Sadd, P. A. (1998). Aeration of bread doughduring mixing: Effect of mixing dough at reduced pressure. Cereal Foods World, 43,163–167.
Campbell, G. M., Scanlon, M. G., & Pyle, D. L. (2008). Bubbles in food 2: Novelty, health andluxury. St. Paul, MN: Eagan Press.
Campbell, G. M., Webb, C., Pandiella, S. S., & Niranjan, K. (1999). Bubbles in food. St.Paul, MN: Eagan Press.
Chin, N. L., Martin, P. J., & Campbell, G. M. (2004). Aaeration during bread dough mixingI. Effect of direction and size of a pressure step – Change during mixing on theturnover of gas. Food and Bioproducts Processing, 82(C4), 1–7.
Chin, N. L., Martin, P. J., & Campbell, G. M. (2005). Dough aeration and rheology: Part 3.Effect of the presence of gas bubbles in bread dough on measured bulk rheology andwork input rate. Journal of the Science of Food and Agriculture, 85(13), 2203–2212.
Dawe, P. R., Johnston, K. W., & Dintheer, W. (2001). Pasta mixing and extrusion. In R. C.Kill, & K. Turnbull (Eds.). Pasta and semolina technology (pp. 86–118). Oxford:Blackwell Science.
Diep, S., Daugelaite, D., Strybulevych, A., Scanlon, M., Page, J., & Hatcher, D. (2014). Useof ultrasound to discern differences in Asian noodles prepared across wheat classesand between varieties. Canadian Journal of Plant Science, 94, 525–534.
Doube, M., Klosowski, M., Arganda-Carreras, I., Cordelières, F., Dougherty, R., Jackson,J., ... Hutchinson, J. (2010). BoneJ: Free and extensible bone image analysis inImageJ. Bone, 47(6), 1076–1079.
Edwards, N. M., Scanlon, M. G., Kruger, J. E., & Dexter, J. E. (1996). Oriental noodledough rheology: Relationship to water absorption, formulation, and work inputduring dough sheeting. Cereal Chemistry, 73, 708–711.
Falcone, P., Baiano, A., Conte, A., Mancini, L., Tromba, G., Zanini, F., & Del Nobile, M.(2006). Imaging techniques for the study of food microstructure: A review. Advancesin Food and Nutrition Research, 51(06), 205–263.
Fu, B. X. (2008). Asian noodles: History, classification, raw materials, and processing.Food Research International, 41, 888–902.
Hatcher, D. W. (2010). Objective evaluation of noodles. In G. G. Hou (Ed.). Asian noodlesscience, technology, and processing (pp. 227–249). Hoboken, NJ: Wiley.
Hatcher, D. W., & Anderson, M. J. (2007). Influence of alkaline formulation on orientalnoodle color and texture. Cereal Chemistry, 84, 253–259.
Hatcher, D. W., Bellido, G. G., & Anderson, M. J. (2009). Flour particle size, starch da-mage, and alkali reagent: Impact on uniaxial stress relaxation. Cereal Chemistry,86(3), 361–368.
Hatcher, D. W., & Preston, K. P. (2004). Investigation of a small-scale asymmetric cen-trifugal mixer for the evaluation of Asian noodles. Cereal Chemistry, 81, 303–307.
Hatcher, D. W., Salimi, A., Daugelaite, D., Strybulevych, A., Scanlon, M. G., & Page, J. H.(2014). Application of ultrasound to the evaluation of rheological properties of rawAsian noodles fortified with barley beta-glucan. Journal of Texture Studies, 45,220–225.
Hou, G. G. (2010). Laboratory pilot-scale Asian noodle manufacturing and evaluationprotocols. In G. G. Hou (Ed.). Asian noodles science, technology, and processing (pp.183–225). Hoboken, NJ: Wiley.
Hou, G. G., Otsubo, S., Okuso, H., & Shen, L. (2010). Noodle processing technology. In G.G. Hou (Ed.). Asian noodles science, technology, and processing (pp. 99–140). Hoboken,NJ: Wiley.
Inazu, T., Iwasaki, K., & Furuta, T. (2005). Stress and crack prediction during drying ofJapanese noodle (udon). International Journal of Food Science and Technology, 40,621–630.
Johnston, K. W., & Dintheer, W. (2001). Pasta drying. In R. C. Kill, & K. Turnbull (Eds.).Pasta and Semolina Technology (pp. 158–175). Oxford: Blackwell Science.
Koksel, F., Aritan, S., Strybulevych, A., Page, J., & Scanlon, M. (2016a). The bubble sizedistribution and its evolution in non-yeasted wheat flour doughs investigated bysynchrotron X-ray microtomography. Food Research International, 80, 12–18.
Koksel, F., Scanlon, M. G., & Page, J. H. (2016b). Ultrasound as a tool to study bubbles indough and dough mechanical properties: A review. Food Research International, 89,74–89.
Levine, L. (1998). Models for dough compressibility in sheeting. Cereal Foods World,43(8), 629–634.
Li, M., Zhu, K. X., Peng, J., Guo, X. N., Amza, T., Peng, W., & Zhou, H. M. (2014).Delineating the protein changes in Asian noodles induced by vacuum mixing. FoodChemistry, 143, 9–16.
Li, M., Zhu, K. X., Sun, Q.-J., Amza, T., Guo, X. N., & Zhou, H. M. (2016). Qualitycharacteristics, structural changes, and storage stability of semi-dried noodles in-duced by moderate dehydration. Understanding the quality changes in semi-driednoodles. Food Chemistry, 194, 797–804.
Liao, H.-J., Chung, Y.-C., & Tattiyakul, J. (2007). Biaxial extensional viscosity of sheetednoodle dough. Cereal Chemistry, 84(5), 506–511.
Liu, R., Xing, Y., Zhang, Y., Zhang, B., Jiang, J., & Wei, Y. (2015). Effect of mixing time onthe structural characteristics of noodle dough under vacuum. Food Chemistry, 188,328–336.
Meinders, M. B. J., & van Vliet, T. (2004). The role of interfacial rheological properties onOstwald ripening in emulsions. Advances in Colloid and Interface Science, 108–109,119–126.
Mercier, S., Mondor, M., Moresoli, C., Villeneuve, S., & Marcos, B. (2016). Drying ofdurum wheat pasta and enriched pasta: A review of modeling approaches. CriticalReviews in Food Science and Nutrition, 56(7), 1146–1168.
Miskelly, D. M., & Moss, H. J. (1985). Flour quality requirements for Chinese noodlemanufacturer. Journal of Cereal Science, 3, 379–387.
Morgenstern, M. P., Zheng, H., Ross, M., & Campanella, O. H. (1999). Rheologicalproperties of sheeted wheat flour dough measured with large deformations.International Journal of Food Properties, 2(3), 265–275.
Ross, A. S. (2006). Instrumental measurement of physical properties of cooked Asianwheat flour noodles. Cereal Chemistry, 83(1), 42–51.
Ross, A. S., & Crosbie, G. B. (2010). Effects of flour characteristics on noodle texture. In G.G. Hou (Ed.). Asian noodles science, technology, and processing (pp. 313–329).Hoboken, NJ: Wiley.
Ross, A. S., & Hatcher, D. W. (2005a). Guidelines for the laboratory manufacture of Asianwheat flour noodles. Cereal Foods World, 50(6), 296–304.
Ross, A. S., & Hatcher, D. W. (2005b). Navigating noodle texture: Taking the rheologicalroute. Cereal Foods World, 61(3), 92–95.
Salimi-Khorshidi, A. (2016). Use of ultrasound to determine the effects of sheeting work inputand barley β-glucan addition on mechanical properties of Asian noodles (PhD dissertation).
Scanlon, M. G., & Zghal, M. C. (2001). Bread properties and crumb structure. FoodResearch International, 34, 841–864.
Schindelin, J., Arganda-Carreras, L., Frise, E., Kaynig, V., Longair, M., Pietzsch, T., &Cardona, A. (2012). Fiji: An open-source platform for biological-image analysis.Nature Methods, 9(7), 676–682.
Shimiya, Y., & Nakamura, K. (1997). Changes in size of gas cells in dough and breadduring breadmaking and calculation of critical size of gas cells that expand. Journal ofTexture Studies, 28(3), 273–288.
Smewing, J. (2016). Navigating noodle texture: Taking the rheological route. Cereal FoodsWorld, 61(3), 92–95.
Fig. 8. Distribution of principal axis of orientation alongthe angle φ, indicating orientation in the xy plane. Doughsheets subject to one (a) or ten (b) laminations prior tosheeting in the y direction for bubbles with a volumelarger than 97 voxels (i.e., equivalent radius around25 μm). Error bars correspond to the range for two sam-ples.
R.-M. Guillermic et al. Food Research International 105 (2018) 548–555
554

Turbin-Orger, A., Babin, P., Boller, E., Chaunier, L., Chiron, H., Della Valle, G., ... Salvo, L.(2015). Growth and setting of gas bubbles in a viscoelastic matrix imaged by X-raymicrotomography: The evolution of cellular structures in fermenting wheat flourdough. Soft Matter, 11, 3373–3384.
van Vliet, T. (1999). Physical factors determining gas cell stability in a dough duringbread making. In G. M. Campbell, C. Webb, S. S. Pandiella, & K. Niranjan (Eds.).
Bubbles in food (pp. 121–127). St. Paul, MN: Eagan Press.Wysokinski, T., Chapman, D., Adams, G., Renier, M., Suortti, P., & Thomlinson, W.
(2015). Beamlines of the biomedical imaging and therapy facility at the CanadianLight Source – Part 3. Nuclear Instruments and Methods in Physics Research A,775(1), 1–4.
R.-M. Guillermic et al. Food Research International 105 (2018) 548–555
555