food trend
TRANSCRIPT

L/O/G/O
FOOD TRENDIN INDONESIA
TREESIA

Agenda
1. Company Profile
2. “Foodiology”
3. Conclusion

Company Profile
Takasago is a leading manufacturer of flavours and fragrances• Founded in 1920
• More than 3000 numbers of employees
• The global Takasago organization maintains offices, production sites and R & D centers in 24 countries
• Our lines of business are an outgrowth of both our purpose and our wish to contribute to society through technology. The flavors and fragrances we create are used in a wide variety of consumer products across the retail landscape, such as:
• Dairy • Cosmetics
• Beverages • Personal Care Products
• Confectionery • Home Care Products
• Savory • Cleaning Products
• Bakery • Fine Fragrances
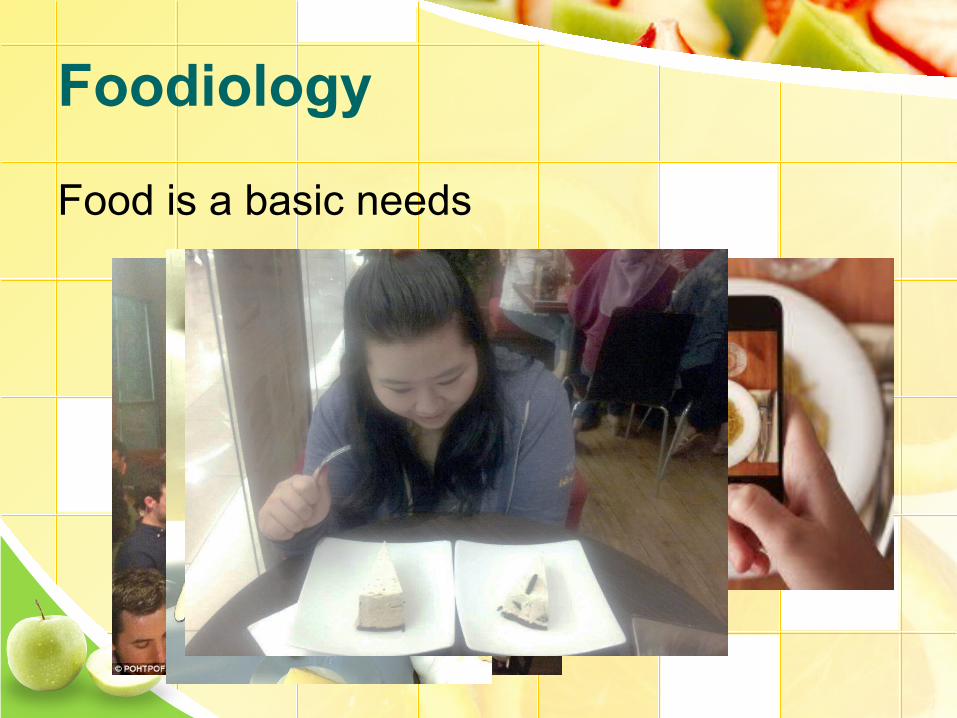
Foodiology
Food is a basic needs

Foodiology(cont.)Percentage of Monthly Average per Capita Expenditure by Commodity Group,
Indonesia, 1999, 2002-2013
Commodity Group 1999 2002 2003 2004 2005 2006 2007 2008 2009 2010
2011 2012 2013
March September March Sept March Sept
Foods:
- Cereals/Grain 16.78 12.47 10.36 9.44 8.54 11.37 10.15 9.57 8.86 8.89 7.48 8.37 9.14 7.90 8.24 7.46
- Tubers 0.78 0.64 0.65 0.76 0.58 0.59 0.56 0.53 0.51 0.49 0.51 0.48 0.44 0.42 0.45 0.47
- Fish 5.58 5.17 5.37 5.06 4.66 4.72 3.91 3.96 4.29 4.34 4.27 4.12 4.20 4.08 4.03 3.98
- Meat 2.29 2.86 2.90 2.85 2.44 1.85 1.95 1.84 1.89 2.10 1.85 2.19 2.06 2.26 1.88 1.80
- Eggs & Milk 2.91 3.28 3.04 3.05 3.12 2.96 2.97 3.12 3.27 3.20 2.88 2.86 3.00 2.74 3.06 2.85
- Vegetables 6.23 4.73 4.80 4.33 4.05 4.42 3.87 4.02 3.91 3.84 4.31 3.72 3.78 3.62 4.43 3.91
- Legumes 2.33 2.02 1.90 1.75 1.70 1.63 1.47 1.55 1.57 1.49 1.26 1.31 1.33 1.32 1.34 1.24
- Fruits 2.07 2.84 2.97 2.61 2.16 2.10 2.56 2.27 2.05 2.49 2.15 2.06 2.44 2.28 2.33 1.84
- Oil and Fats 3.04 2.25 2.23 2.31 1.93 1.97 1.69 2.16 1.96 1.92 1.91 1.79 1.95 1.79 1.64 1.56
- Spices 1.65 1.55 1.46 1.43 1.33 1.37 1.10 1.12 1.08 1.09 1.06 1.02 1.02 0.96 0.96 0.94
- Prepared food 9.48 9.70 9.81 10.28 11.44*) 10.29*) 10.48*) 11.44*) 12.63*) 12.79*) 13.73*) 11.83*) 12.72*) 11.65*) 13.11*) 12.46*)
Note : *) includes Alcoholic beverages
Source: National Socio Economic Survey, Module Consumption, 1999, 2002, and 2005 (2003, 2004 and 2006 only include panel 10.000 households while in 2007, 2008 dan 2009 include 68.800 households). The data in 2011-2012 were from first and third quarter of National Socio Economic Survey data (Maret and
September) include 75.000 households.

Foodiology (cont.)
Food is a basic needsFood is NOT ONLY a basic needs
Food is a trend
Food is a life-style

Conclusion
• Eat to live now change into live to eat
• Statistic Data shown that prepared food expenditures are growingGOOD FOOD
INSTANT TIME

L/O/G/O
Thank You!