foodservice industry seminar 2018 mar 2019...foodservice industry seminar 2018 foodservice solutions...
TRANSCRIPT

Foodservice Industry Seminar 2018

Foodservice Solutions

• Since April 2016, Decision Lab is tracking the out of home eating and
drinking market in the key cities Hanoi, Ho Chi Minh City and Da Nang
• The Foodservice Monitor tracks all food & drink consumed out of home
on a daily basis with an annual sample size of 15,000 completed
interviews
• The respondents are Vietnamese consumers aged 15+ who also report
on the consumption by children (under 15 years) who were present at
the eating out occasion
How is Decision Lab tracking Foodservice Consumption?

Methodology
H O W W E T R A C K O U T - O F - H O M E
C O N S U M P T I O N

752,057ONLINE VIETNAMESE COMMUNITY MEMBERS
Annual Sample: 15,000
in HCMC, Hanoi, Danang are asked about what they ate
and drank out of home on the previous day
We cover three main cities HA NOI.
40%
HO CHI MINH
50%
DA NANG
10%

12,387,681
Total
adult population(Vietnamese aged 15 years old and above in
HCMC, Hanoi, Danang)
The data is extrapolated based on the GSO’s yearly population projection
HA NOI.
5,204,798
HO CHI MINH
6,432,322
DA NANG
750,561

FULL SERVICE
RESTAURANTS
(FSR)
FINE DINING
Average spend above
VND110K per person). Fine
Dining is segmented by
cuisine type (Vietnamese,
Japanese, Korean, Chinese,
French, Mexican etc..
FAST CASUAL
Average spend under
VND110K per person & pre-
coded chains). Fast Casual is
segmented by cuisine type
(Vietnamese, Japanese,
Korean, Chinese, French,
Mexican etc.), Fast Casual
example chains: Kichi Kichi,
Gogi House, Vietnammm,
Pizza Hut, Mon Hue, Thai
Express etc..
We monitor 7 Main Channels

QUICK SERVICE
RESTAURANTS
(QSR)
QS COFFEE/TEA
(Highlands Coffee,
Starbucks etc.)
QS BURGER
(McDonald’s, Burger King,
Lotteria etc.)
QS CHICKEN
(KFC, Jollibee etc.)
QS
SANDWICHES/WRAPS/
KEBAB/BAKERY
(Subway, Tous Les Jours
etc.)
QS BBQ
QS JAPANESE
QS VIETNAMESE
QS CHINESE
QS THAI
QS INDIAN
QS KOREAN
QS FRENCH
QS MEXICAN
QS PIZZA
(Domino’s, Pizza Inn etc.)
QS ICE CREAM
(Fanny, Baskin Robbins
etc.)
QS JUICE/SMOOTHIE
BAR
(Jamba Juice, Jungle Juice
etc.)
QS OTHER
We monitor 7 Main Channels

STREET FOOD
Food & Drink bought
from:
• Wet market
• Street vendor
• Mobile cart
ALCOHOL
PL ACES
Outlets that mainly
serve alcohol:
• Bar
• Club
• Karaoke
CONVENIENCE
STORES
Standard convenience
store such as
FamilyMart, 7-Eleven
that also offers meals
(some heated up) to
eat on- or off-premise
HOTELS
Establishments
providing
accommodation,
meals, and other
services for travelers
and tourists.
CANTEEN
• Workplace
• School
• University
We monitor 7 Main Channels

Track record in F&B industry

How has 2018 been for Vietnam’s Foodservice
industry?
L E T ’ S T A K E A L O O K !

Vietnam
Foodservice
Monitor
KEY INDICATORS FOR YEAR
ENDING Q3 2018
AVERAGE EATER SPENDING/ VISIT (IN VND)
31.4T33.7T
31.6T
26.0T28.0T
30.2T 29.7T
25.6T
31.6T27.6T
436M 443M 453M418M 435M
478M 474M452M
496M 492M
300M
350M
400M
450M
500M
550M
600M
650M
700M
750M
800M
T
5T
10T
15T
20T
25T
30T
35T
40T
Q2 Q3 Q4 Q1 Q2 Q3 Q4 Q1 Q2 Q3
2016 2017 2018
Sales Visits
AVERAGE ANNUAL VISITS / CAPITA
HANOI
61,771 4%
HCMC
59,929 9%
DA NANG
49,236 15%
TOTAL
59,903 8%
HCMC
133 8%
HCMC
170 5%
DA NANG
166 4%
TOTAL
154 5%

The diverging development paths of FSR and QSR

• Market share of FSR & QSR across demographic groups - % visits
34%
24%22%
30%
39%
28%30%
25%28%
25%28%
25%
28%
25%
0%
10%
20%
30%
40%
50%
Male Female 15-24 25-34 35+ Ha Noi HCMC
Gender Age group Location
Full service Restaurants (n = 10,288) Quick service Restaurants (n = 7,293)
Market share of FSR and QSR across demographic groups - % visits
Source: Decision Lab’s Foodservice Monitor Aggregate data from Q4 2016 to Q3 2018
14
These two channels currently account for the majority of OOH visits by consumers across all demographic groups in Vietnam

• Market share of FSR & QSR - % visits and servings
29%
21%
32%
17%
26%
20%
14%
33%
0%
5%
10%
15%
20%
25%
30%
35%
Total OOH visits Total Non-alcohol RTD
consumption
Total Alcohol
consumption
Total Dairy-based
product consumption
Full service restaurants (n = 10,288) Quick service restaurants (n = 7,293)
Market share of Full Service (FSR) & Quick Service (QSR) restaurants - % visits and servings
Source: Decision Lab’s Foodservice Monitor Aggregate data from Q4 2016 to Q3 2018
15
Full service and Quick service restaurants are the two most important channels for Manufacturers of various product categories

• Visits to Full service & Quick service restaurants by quarter (in million)
144M
131M
118M
129M
138M145M
135M
151M
142M
150M 151M
138M 140M
114M
102M98M
122M
109M
50M
70M
90M
110M
130M
150M
170M
Q3 Q4 Q1 Q2 Q3 Q4 Q1 Q2 Q3
2016 2017 2018
Full service Restaurants (n = 10,288) Quick service Restaurants (n = 7,293)
Visits to Full Service (FSR) & Quick Service (FSR) restaurants by quarter (in million)
Source: Decision Lab’s Foodservice Monitor Aggregate data from Q4 2016 to Q3 2018
16
Meanwhile, Quick service
segment continued to slip away
from its past heyday.
Starting from Q3 2017, Full service restaurants officially took over as the largest Foodservice channel in Vietnam
-21%
+11%

17
The growth of Full service restaurants has been fueled mostly by women, and consumers above 35 years old
7%
20%
12% 12%
3%
12%
4%
20%
8%7%
18%
5%
0%
5%
10%
15%
20%
Male Female Ha Noi HCMC Da Nang 15-24 25-34 35+ Class A Class B Class C Class D
Gender Location Age group SEC
Year over Year Traffic Growth rate of key demographic groups in FSR
n = 10288Source: Decision Lab’s Foodservice Monitor Aggregate data from Q4 2016 to Q3 2018
Channel’s growth
11%

• Visit and Average spending per head per visit to Full service Restaurants
131M
118M
129M
138M
145M135M
151M
142M
89K78K
95K83K 89K 85K 88K
77K
0K
50K
100K
150K
200K
250K
60M
80M
100M
120M
140M
160M
Q4 Q1 Q2 Q3 Q4 Q1 Q2 Q3
2016 2017 2018
Visits Average spending per head per visit
n = 10288
Visit and Average spending per head per visit to Full service Restaurants (FSR)
Source: Decision Lab’s Foodservice Monitor Aggregate data from Q4 2016 to Q3 2018
18
Indeed, improving traffic has been the key to the revival of Full service restaurants
-7%
+11%

• YOY Traffic growth of key sub-segments in FSR
19
Within Full service channel, Casual restaurants serving BBQ and Japanese dishes are the ones with highest growth rate in 2018
YOY Traffic growth of key sub-segments in FSR
n = 10288
Market share of key sub-segments in FSR -% visits
n = 10288
81%
4%
2%
2%
1%
1%1% 8%
FCR Vietnamese
Fine Dining
Vietnamese
FCR Italian Kitchen
FCR BBQ
FCR Hotpot
FCR Korean
FCR Japanese
Other
Source: Decision Lab’s Foodservice Monitor Aggregate data from Q4 2016 to Q3 2018
53%
40% 37%
13%5% 3%
-23%
-40%
-20%
0%
20%
40%
60%
FCR
Japanese
FCR BBQ FCR Hotpot FCR
Vietnamese
Fine Dining
Vietnamese
FCR Korean FCR Italian
Kitchen
20
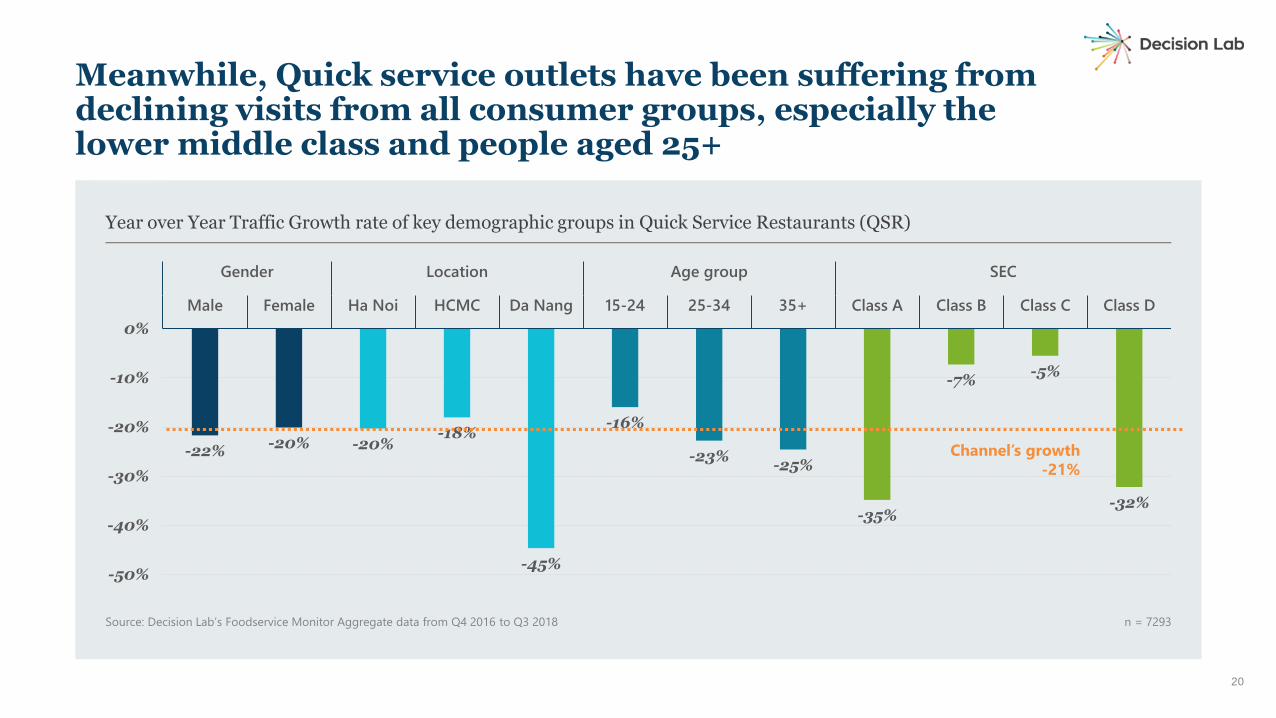
Meanwhile, Quick service outlets have been suffering from declining visits from all consumer groups, especially the lower middle class and people aged 25+ • Year over Year Traffic Growth rate of key demographic groups in Quick service restaurants
-22%-20% -20%
-18%
-45%
-16%
-23%-25%
-35%
-7%-5%
-32%
-50%
-40%
-30%
-20%
-10%
0%
Male Female Ha Noi HCMC Da Nang 15-24 25-34 35+ Class A Class B Class C Class D
Gender Location Age group SEC
Year over Year Traffic Growth rate of key demographic groups in Quick Service Restaurants (QSR)
n = 7293Source: Decision Lab’s Foodservice Monitor Aggregate data from Q4 2016 to Q3 2018
Channel’s growth
-21%

151M
138M 140M
114M
102M98M
122M
109M
68K58K
51K 54K 50K 52K62K 57K
0K
50K
100K
150K
200K
250K
50M
70M
90M
110M
130M
150M
170M
Q4 Q1 Q2 Q3 Q4 Q1 Q2 Q3
2016 2017 2018
Visits Average spending per head per visit
Visit and Average spending per head per visit to Quick service Restaurants (QSR)
21
It is plummeting footfall that has damaged Quick service restaurants over the past 2 years

Among various types of Quick service outlets, Cafes, Bakeries and Juice/Smoothie shops are those that witness the biggest drop in visits
YOY Traffic growth of key sub-segments in QSR
n = 7293
Market share of key sub-segments in QSR -% visits
n = 7293
32%
25%
22%
8%
5%8%
QS Vietnamese
Coffee/Tea
Bakery
Fast Food
Juice/ Smoothie
Other
-10%
-29%
-22%
-17%
-30%
-40%
-30%
-20%
-10%
0%
QS
Vietnamese Cafes Bakery
Fast Food
restaurants
Juice/
Smoothie
shops
Source: Decision Lab’s Foodservice Monitor Aggregate data from Q4 2016 to Q3 2018

258M
329M
0M
100M
200M
300M
400M
Q4 2016 to Q3
2017
Q4 2017 to Q3
2018
This does not mean Vietnamese are cutting down on these products. On the contrary, consumption of coffee, juice, and smoothies has increased in the past year
* Include non-RTD, freshly prepared
drinks only
Coffee beverage* servings
n=2237
* Include non-RTD, freshly prepared
drinks only
Juice & Smoothies* servings
n=2805
Baked goods* servings
n=5206
567M 543M
0M
200M
400M
600M
Q4 2016 to Q3
2017
Q4 2017 to Q3
2018
4%
254M271M
0M
100M
200M
300M
Q4 2016 to Q3
2017
Q4 2017 to Q3
2018
6%
Source: Decision Lab’s Foodservice Monitor Aggregate data from Q4 2016 to Q3 2018
*Baked goods include types of
bread, sandwich, cookies, cakes, etc.
27%

Vietnamese are switching to other channels to consume these daily food and drink items, leaving QSR to suffer
*Including Non-RTD, freshly
prepared coffee only
YOY Traffic growth with Coffee* consumption in channels - % visits
n=2237
*Including Non-RTD, freshly
prepared juice/smoothie only
YOY Traffic growth with Juice/Smoothie* consumption in channels - % visits
n=2805
YOY Traffic growth with Baked goods consumption in channels - % visits
n=5206
Source: Decision Lab’s Foodservice Monitor Aggregate data from Q4 2016 to Q3 2018
12%
-29%
39%43%
59%
99%
-40%
-20%
0%
20%
40%
60%
80%
100%
120%
Total OOH QSR
FSR Street food
CVS Canteen
18%
-9%
20%14%
6%
117%
-40%
-20%
0%
20%
40%
60%
80%
100%
120%
Total OOH QSR
FSR Street food
CVS Canteen
-3%
-29%
-4%
9%19%
87%
-40%
-20%
0%
20%
40%
60%
80%
100%
120%
Total OOH QSR
FSR Street food
CVS Canteen
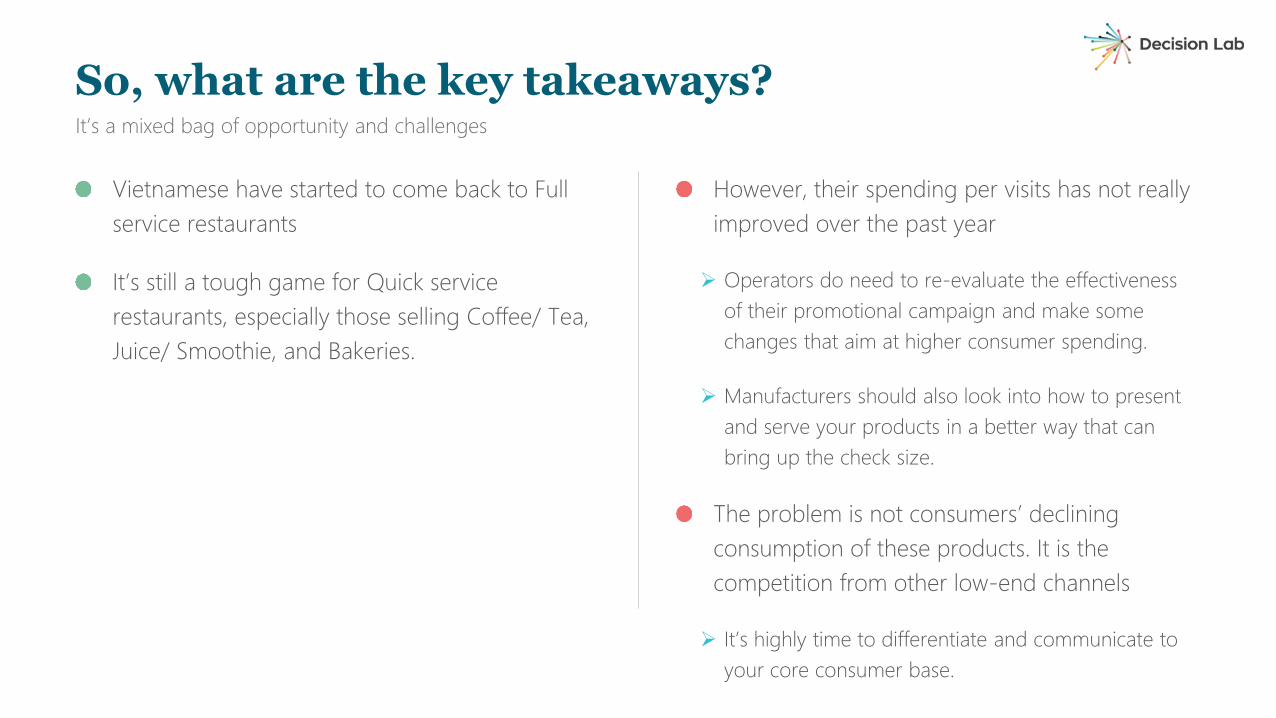
Vietnamese have started to come back to Full
service restaurants
It’s still a tough game for Quick service
restaurants, especially those selling Coffee/ Tea,
Juice/ Smoothie, and Bakeries.
It’s a mixed bag of opportunity and challenges
However, their spending per visits has not really
improved over the past year
➢ Operators do need to re-evaluate the effectiveness
of their promotional campaign and make some
changes that aim at higher consumer spending.
➢ Manufacturers should also look into how to present
and serve your products in a better way that can
bring up the check size.
The problem is not consumers’ declining
consumption of these products. It is the
competition from other low-end channels
➢ It’s highly time to differentiate and communicate to
your core consumer base.
So, what are the key takeaways?

The March of the Women
26

27
“Women are the CEO of the household. They often act as the chief purchasing officer. They purchase on behalf of themselves, but also their husbands and kids.”
Mary Van Note, partner of Ginger Consulting LLC, a Minneapolis-based branding firm
that’s served names in the industry such as Starbucks, McDonald’s, Taco Bell, and
Sonic Drive-In.

The myths about female diners
28

MYTH 1:
Women are more likely to be concerned about health when eating out


Compared to men, a significantly lower proportion of women state “health” as a driver to select a foodservice outlet
16%CHOSE HEALTHY FOOD AND
DRINKS AS THE REASON TO V IS IT
A CERTAIN OOH OUTLET
MEN
12%CHOSE HEALTHY FOOD AND
DRINKS AS THE REASON TO
CHOOSE A CERTAIN OOH OUTLET
WOMEN
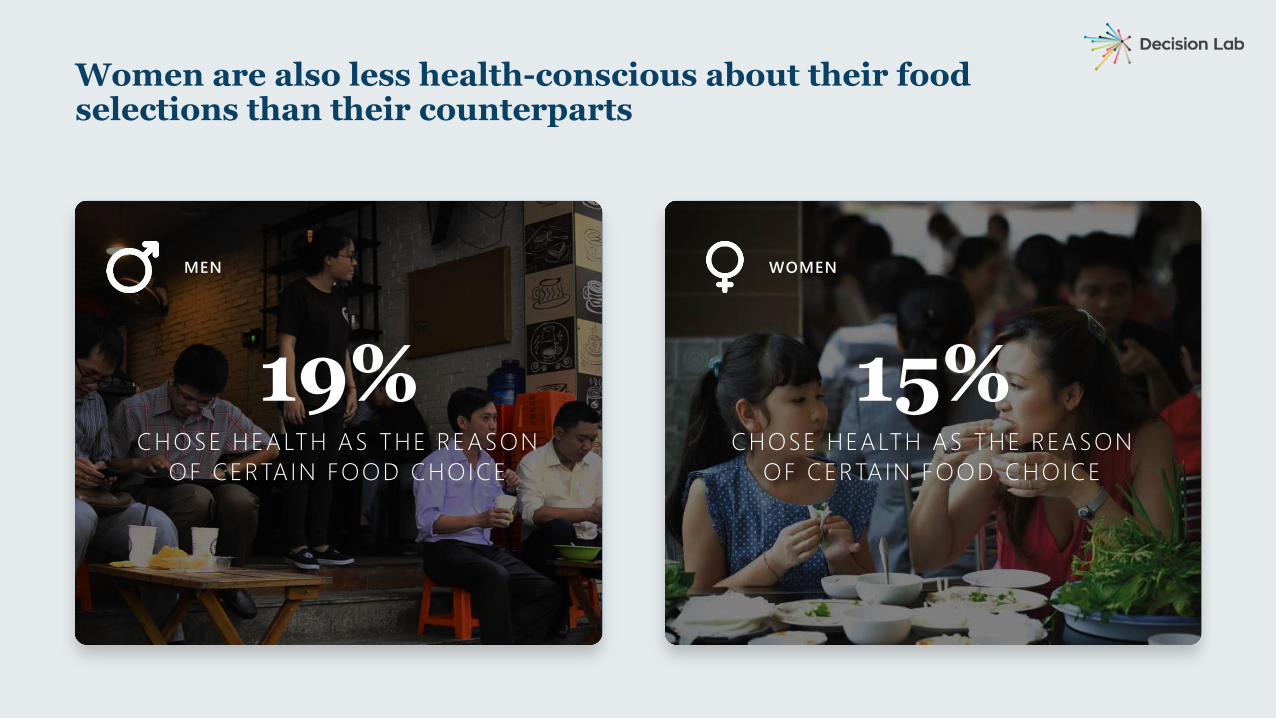
Women are also less health-conscious about their food selections than their counterparts
19%CHOSE HEALTH AS THE REASON
OF CERTAIN FOOD CHOICE
MEN
15%CHOSE HEALTH AS THE REASON
OF CERTAIN FOOD CHOICE
WOMEN

Women only show more deliberate health concern when it comes to the drinks they consume
21%CHOSE HEALTH AS THE REASON
OF CERTAIN DRINK CHOICE
MEN
26%CHOSE HEALTH AS THE REASON
OF CERTAIN DRINK CHOICE
WOMEN

MYTH 2:
Women prefer to sit down and enjoy their meal on premises


Women consume on-premises much less than men. They instead show a higher preference for off-premises consumption
60%OF MALE OOH VIS ITS WERE ON
PREMISE
MEN
47%OF FEMALE OOH VIS ITS WERE ON
PREMISE
WOMEN

MYTH 3:
Women love a good discount and would use vouchers much more than men


Women and men are not so different when it comes to using vouchers/promotions for eating out
6%OF MALE OOH VIS ITS UT IL IZED
VOUCHERS
MEN
7%OF FEMALE OOH VIS ITS UT IL IZED
VOUCHERS
WOMEN

The 15-34 year-olds account for 82%
of the female visits, and more than
half of the visits come from white-
collar workers. Students are also
proven to be the driving force of
female visits at 25%.
814 mil.FEMALE OOH VISITS IN THE PAST
YEAR*
• 15 - 34
• White collar and students
• Classes C or D (SEC)
Who are the typical female consumers in the Out of Home market?
* Source: Decision Lab Foodservice Monitor Aggregate data from Q4 2017 to Q3 2018

To be fair, the traffic growth in the past year came from both genders, with men bringing in the bigger increase
Male
Decision Lab Foodservice Monitor Data from Q4 2016 to Q3 2018 n = 27591
AVG. ANNUAL VIS ITS PER CAPITA
172 183 7%
Female 121 128 5%
Q4-16 | Q3-17 Q4-17 | Q3-18

42
However, male consumers’ spending has dropped dramatically
70,230 đ 15%
Q4-16 | Q3-17
60,034 đ
Q4-17 | Q3-18

43
While female consumers have started to spend visibly more
57,829 đ 3%
Q4-16 | Q3-17
59,732 đ
Q4-17 | Q3-18

n = 27591
YOY Average spending growth by Gender
Source: Aggregate Foodservice Monitor data from Q4 2016 to Q3 2018
Indeed, women have spent more for Out of Home consumption across all the channels in the past year
-4%
-12%-10%
-22%
-9%
2%2%
5%
1%
5%
16%
12%
-25%
-20%
-15%
-10%
-5%
0%
5%
10%
15%
20%
FSR QSR Street food CVS Canteen Alcohol
places
Male
Female

45
The boost in women’s spending partly comes from their increased preference to consume both food and drink when going out
Source: Aggregate Foodservice Monitor data from Q4 2016 to Q3 2018
YOY Traffic growth by consumption type – in %
2%
0%
16%
-2%
-12%
23%
-20%
-10%
0%
10%
20%
30%
Eat only Drink only Eat & Drink
Male Female
n = 27591
Average spending by consumption type – in VND
EAT ONLY
42,907 VND
EAT & DRINK
81,224 VND
FEMALE AVERAGE SPENDING IN TOTAL OOH
n = 13339

FROM Q4 2016 – Q3 2017
TO Q4 2017 – Q3 2018
-8%MALE SALES CONTRIBUTION TO THE TOTAL OOH
FROM Q4 2016 – Q3 2017
TO Q4 2017 – Q3 2018
+10%FEMALE SALES CONTRIBUTION TO THE TOTAL OOH
As a result, women’s contribution to the market revenue has increased by a whopping 10%
Source: Aggregate Foodservice Monitor data from Q4 2016 to Q3 2018
n = 14252 n = 13339

32%
11%
30%
9%
12%
6%
31%
14% 24%18%
9%
3%Breakfast Morning snack Lunch Afternoon snack Dinner Late night snack
Male Female
Women consume Out of Home much more than men during daytime snacking occasions
3.7 billions VISITS TO OOH OUTLETS IN
YEAR ENDING Q3 2018
Male visits are concentrated on
Breakfast and Lunch, while
female visits are more spread out
across occasions.
Source: Aggregate Foodservice Monitor data from Q4 2016 to Q3 2018

65%
52%
12%
11%
8%
14%
8%
12%
1%4%
5% 7%
0%
20%
40%
60%
80%
100%
Male Female
VN Cuisine Coffee/Tea Bakery Non-VN Cuisine Juice/Smoothie Other
n = 17578
Preference in Full Service & Quick Service Restaurants by Gender - % visits
Source: Aggregate Foodservice Monitor data from Q4 2016 to Q3 2018
When it comes to cuisine selection, women are more keen to try foreign cuisine and visit outlets that offer non-Vietnamese dishes

Among the foreign cuisines, women are showing more and more appetite for Hotpot, BBQ and Japanese food
-21% -27%
27%19%
30%
-15%
47%
-71%
-13%
-52%
68%62%
68%
2%
-2%
-33%
-100%
-50%
0%
50%
100%
Fast Food Italian Kitchen BBQ Hotpot Japanese Korean Other Asian Western
Male
Female
YOY Traffic growth of cuisines in Foreign cuisines
n = 2962Source: Aggregate Foodservice Monitor data from Q4 2016 to Q3 2018
*Low sample size (<30). Use with caution

FOR MANUFACTURERS
• For Food manufacturers, convenient
solutions for take-away and deliveries
to ease the off-premise consumption
will definitely get the interest of the
female population
• For Drink manufacturers, “health” is
important in your key product
message. In addition, make sure you
have products that capture women
during daytime snacking occasions.
FOR OPERATORS
• The growing influence of women on the foodservice market is
real: they are going out more and they are willing to spend
more
• They are not as health conscious when eating out as perceived
so no need to stress out on healthy food options for now.
• Make sure most of your offerings include both food and drink
items to capture women’s habit.
• Look into your menu to see if you can tailor particular items to
meet women’s snacking needs.
51
Implications

Vietnamese’ quest to explore foreign cuisine

TOTAL CUISINE
Quick service restaurants and Full service restaurants
that serve cuisines as below:
• Vietnamese
• Fast Food
• Italian Kitchen
• Western
• BBQ
• Hotpot
• Japanese
• Korean
• Other Asian (e.g. Chinese, Thai, Indian)
*Quick Service outlets such as Coffee/Tea, Bakery,
Juice/Smoothie and Ice Cream are excluded
Definitions
53
VIETNAMESE CUISINE
Quick service restaurants and Full service restaurants
specialized in Vietnamese cuisine. Pre-coded chains
include:
• Mon Hue
• Pho 24
• 37th Street
• Wrap & Roll
• Hoang Yen
• Com Tam Cali
• Net Hue
• Pho 10 Ly Quoc Su
and etc.
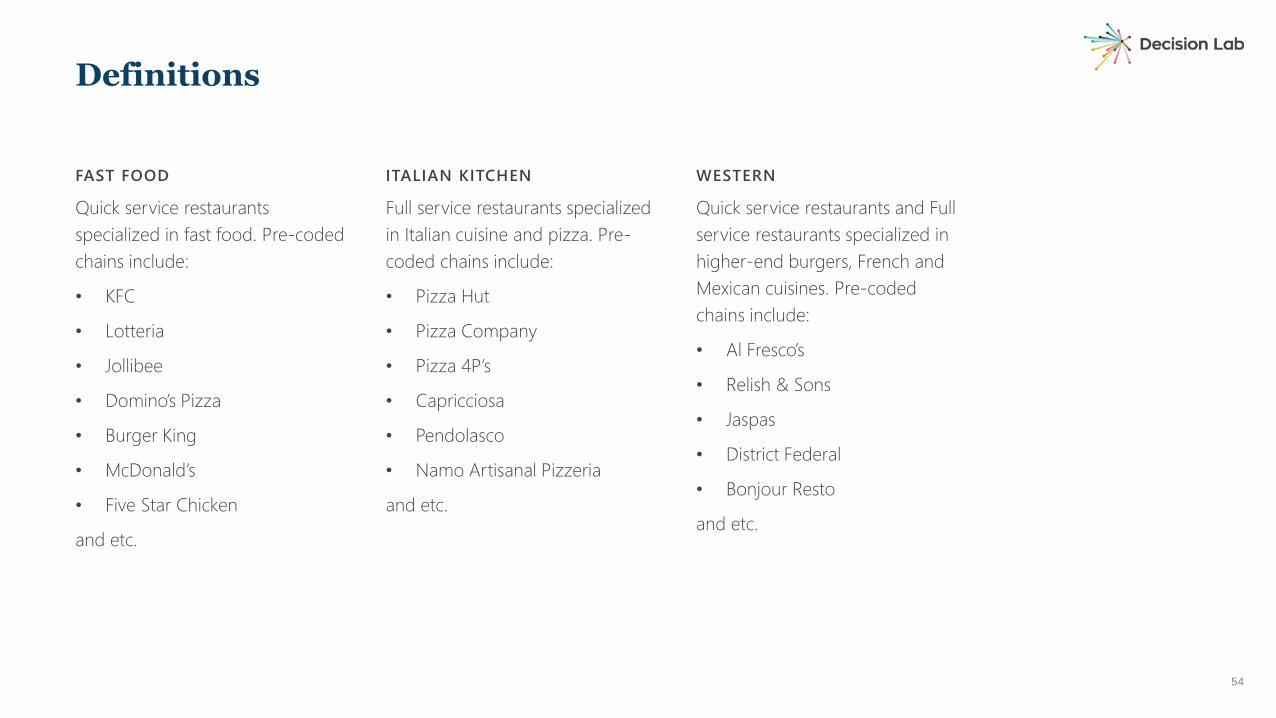
FAST FOOD
Quick service restaurants
specialized in fast food. Pre-coded
chains include:
• KFC
• Lotteria
• Jollibee
• Domino’s Pizza
• Burger King
• McDonald’s
• Five Star Chicken
and etc.
Definitions
54
ITALIAN KITCHEN
Full service restaurants specialized
in Italian cuisine and pizza. Pre-
coded chains include:
• Pizza Hut
• Pizza Company
• Pizza 4P’s
• Capricciosa
• Pendolasco
• Namo Artisanal Pizzeria
and etc.
WESTERN
Quick service restaurants and Full
service restaurants specialized in
higher-end burgers, French and
Mexican cuisines. Pre-coded
chains include:
• Al Fresco’s
• Relish & Sons
• Jaspas
• District Federal
• Bonjour Resto
and etc.

BBQ
Quick service restaurants and Full
service restaurants specialized in
BBQ, regardless of the grill style
(e.g. Western, Japanese, Korean…).
Pre-coded chains include:
• Quan Ut Ut
• SumoBBQ
• Gogi House
• King BBQ
• Tasaki BBQ
• Mr. Park
• Pepper Lunch
• Hotto
and etc.
Definitions
55
HOTPOT
Full service restaurants specialized
in Hotpot. Pre-coded chains
include:
• Kichi Kichi
• Hutong – Hot Pot Paradise
• Ashima
• Hotpot Story
• ThaiExpress
• MK Restaurants
and etc.
JAPANESE
Quick service restaurants and Full
service restaurants specialized in
Japanese cuisine, including sushi,
ramen and udon outlets. Pre-
coded chains include:
• Sushi Hokkaido Sachi
• Tokyo Deli
• Marukame Udon
• Daruma
• Sushi Kei
• YEN Sushi & Sake Pub
• Sukiya
• NamBento
and etc.

KOREAN
Quick service restaurants and Full service restaurants
specialized in Korean cuisine, including Korean fried
chicken outlets. Pre-coded chains include:
• K-Food
• Poki Poki
• Mi Han Quoc
• Hanuri
• GAXEO Chicken
• Don Chicken
• Papa’s Chicken
and etc.
Definitions
56
OTHER ASIAN
Quick service restaurants and Full service restaurants
specialized in Chinese, Thai and Indian cuisine. Pre-
coded chains include:
• Crystal Jade Kitchen
• San Fu Lou
• Baozi
• Bamboo Dimsum
• Lac Thai
• Tuk Tuk Thai Bistro
• Tandoor
• Spices
and etc.

n = 13730
Preference of cuisines in Full Service and Quick Service Restaurants - % visits
*Full Service and Quick Service Restaurants, excluding Coffee/Tea, Bakery, Juice/Smoothie and Ice Cream
outlets
The dominance of Vietnamese cuisine in the Out of Home market is undisputable
80% 5% 2%1%1%1%1%%1%
0% 20% 40% 60% 80% 100%
Vietnamese Fast Food Italian Kitchen BBQ Hotpot
Japanese Korean Western Other Asian

58
Besides the obvious advantage of convenience, Vietnamese cuisine claims its dominance thanks to the innate ability to replace home cooked meals
53%
44%41%
35% 33% 33%27%
47%
32%
40%36% 37%
30% 31%
0%
20%
40%
60%
Convenient
location
Did not want to
cook
Quality of food Clean
environment
Taste of food Good value for
money
Friendly service
Vietnamese Cuisine Non-Vietnamese Cuisine
Reason for outlet choice - % visits
n = 13730Source: Aggregate Foodservice Monitor data from Q4 2016 to Q3 2018

59
Vietnamese dishes are typically chosen to satisfy hunger quickly, conveniently, and at a good value for money
51%
35%
27% 27% 25%21%
10% 9%6% 5%
2%
51%
30%
24% 23% 22% 21%17%
9%13%
8%
3%
0%
20%
40%
60%
Favorite dish Convenience Good value
for money
Hunger To energize Health To share To eat alone To treat
myself
To try
something
new
Other
Vietnamese cuisine Non-Vietnamese cuisine
Reason for food choice - % visits
n = 9511Source: Aggregate Foodservice Monitor data from Q4 2016 to Q3 2018

Fast food, the biggest type of non-Vietnamese cuisine consumed, has been suffering from a significant lost of traffic year over year…
Market share of non-VN cuisines in FSR and QSR in year ending Q3 2018 - % visits
n = 2962
Fast food outlet visits
-17%YOY TRAFFIC GROWTH
39%
13%10%
10%
9%
9%
8%
1%
Fast Food
BBQ
Other Asian
Hotpot
Italian Kitchen
Japanese
Korean
Western
Source: Aggregate Foodservice Monitor data from Q4 2016 to Q3 2018

-17%
46%
23%
37%
-40%
49%
-6%
-61%
-80%
-60%
-40%
-20%
0%
20%
40%
60%
Fast Food BBQ Other
Asian
Hotpot Italian
Kitchen
Japanese Korean Western
n = 2962
YOY Traffic growth of non-VN cuisines
Source: Aggregate Foodservice Monitor data from Q4 2016 to Q3 2018
61
…leaving the market to the giant hands of players specialized in BBQ, Hotpot and Japanese cuisine

• YOY average spending growth of non-VN cuisines
-10%
-2%
12%16%
-3%
1%
42%
5%
105K
271K
184K
225K210K
280K
191K209K
-25%
0%
25%
50%
75%
Fast Food BBQ Other
Asian
Hotpot Italian
Kitchen
Japanese Korean Western
YOY average spending growth % Average spending in year ending 2018 (VND)
n = 2962
Average spending per head per visit and YOY growth among types of Non-Vietnamese cuisine
Source: Aggregate Foodservice Monitor data from Q4 2016 to Q3 2018
62
Among the 3 rising cuisines, Hotpot is the only one that enjoys the luxury of increasing consumer spending in the past year

63
Consequently, the market pie has shifted significantly: further away from Western foods and heavily toward Asian-centric cuisine
YOY sales contribution growth of non-VN cuisines
-25%
43%51%
59%
-42%
38% 34%
-59%-80%
-40%
0%
40%
80%
Fast
Food
BBQ Japanese Hotpot Italian
Kitchen
Other
Asian
Korean Western
n = 2962
Market share of non-VN cuisines in FSR and QSR in year ending 2018 - % sales
23%
20%
14%
12%
11%
10%
8%1%Fast Food
BBQ
Japanese
Hotpot
Italian Kitchen
Other Asian
Korean
Western
n = 2962
Source: Aggregate Foodservice Monitor data from Q4 2016 to Q3 2018

BBQ
YOY VISITS INCREASE
+4.0m
↓
73% FROM FEMALE 15-34
23% FROM MALE 25-34
HOTPOT
YOY VISITS INCREASE
+2.5m
↓
51% FROM FEMALE 25-34
33% FROM MALE 15-24
JAPANESE
YOY VISITS INCREASE
+2.8m
↓
51% FROM FEMALE 15-34
64
Young female consumers are the core growth engine for restaurants offering the 3 cuisines over the past year
Source: Aggregate Foodservice Monitor data from Q4 2016 to Q3 2018

The drivers of consumer choice for these cuisines may differ, but all hint at Vietnamese’ underlying expectations toward a dining destination
BBQ Restaurants:
CELEBRATION/ TREAT
QUALITY OF FOOD/DRINK
FRIENDLY SERVICE
Hotpot Restaurants:
GOOD FOR SOCIALIZING
SPECIAL OCCASION
CELEBRATION
CLEAN ENVIRONMENT
Japanese Restaurants:
QUALITY OF FOOD/DRINK
HEALTHY OFFERINGS
GOOD VALUE FOR MONEY

31% 48%
40% 42%
38% 50%
Lunch time Dinner time
30.7 million TOTAL VISITS IN YEAR ENDING
Q3 2018
BBQ and Japanese cuisine are
more preferred for dinner, while
Hotpot strikes a balance and is
equally chosen for both meals.
BBQ restaurants have become more attractive destinations for dinner, while Hotpot and Japanese outlets enjoy increasing footfall during lunch
Source: Aggregate Foodservice Monitor data from Q4 2016 to Q3 2018

• Party size - % visits
35%27%
55%
44%
39%
27%
21%
35%
19%
0%
20%
40%
60%
80%
100%
BBQ Restaurants Hotpot Restaurants Japanese Restaurants
<=2 people 3-4 people 5+ people
n=602
Party size by cuisine - % visits
Source: Aggregate Foodservice Monitor data from Q4 2016 to Q3 2018
Hotpot and BBQ restaurants show amazing capability to accommodate consumers’ needs across different party sizes

Vietnamese eat Vietnamese food, but they have
also shown more appetite for BBQ and Asian-
centric cuisine such as Hotpot and Japanese
foods.
Young female consumers are the growth
engine of restaurants offering these cuisines.
➢ To Operators currently in these winning
segment, stay focused, listen to your consumers
and be ready to adapt as competition from new
and current players is definitely getting more
fierce.
➢ To all Operators that specialize in foreign cuisine,
look into how you can adapt some of these
restaurants’ success drivers, e.g. facilitative
environment for special occasions, appeal to
women, great service, exciting interaction
between consumers and food, etc.
➢ To Drinks and Fresh food Manufacturers, focus
your effort in winning BBQ, Hotpot and Japanese
chains if you are looking for growth.
So, what are the key takeaways?

Reach out to us
4 4 F L O O R - B I T E X C O F I N A N C I A L T O W E R
2 H A I T R I E U , D I S T R I C T 1
H O C H I M I N H C I T Y , V I E T N A M
+ 8 4 2 8 3 9 1 5 1 9 1 9 | D E C I S I O N @ D E C I S I O N L A B . C O
W W W . D E C I S I O N L A B . C O