for personal use only - australian securities exchange · • experience in ipo’s, private...
TRANSCRIPT

1
Investor PresentationJune 2016
For
per
sona
l use
onl
y
22
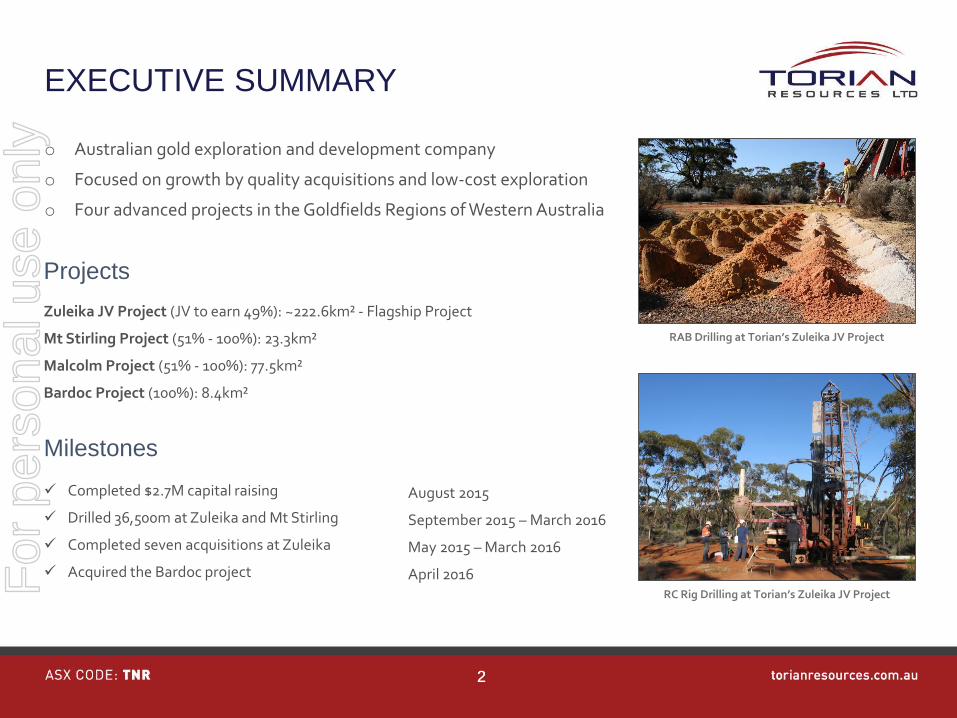
o Australian gold exploration and development company
o Focused on growth by quality acquisitions and low-cost exploration
o Four advanced projects in the Goldfields Regions of Western Australia
EXECUTIVE SUMMARY
RAB Drilling at Torian’s Zuleika JV Project
Completed $2.7M capital raising
Drilled 36,500m at Zuleika and Mt Stirling
Completed seven acquisitions at Zuleika
Acquired the Bardoc project
Milestones
August 2015
September 2015 – March 2016
May 2015 – March 2016
April 2016RC Rig Drilling at Torian’s Zuleika JV Project
Projects
Zuleika JV Project (JV to earn 49%): ~222.6km² - Flagship Project
Mt Stirling Project (51% - 100%): 23.3km²
Malcolm Project (51% - 100%): 77.5km²
Bardoc Project (100%): 8.4km²
For
per
sona
l use
onl
y

33
Simple Ownership Structure
KEY STATISTICS
Share Price Performance (ASX:TNR)
Current Shares: 77,238,430
Debt: Nil
Options: Nil
Note: Share price and figures as at 17th June 2016
Sh
are
Pri
ce (
A$
): Sh
are volu
me:
For
per
sona
l use
onl
y

4
BOARD & MANAGEMENT
Mr Matthew SullivanManaging DirectorB.App. Sc (Applied Geology) and AusIMM• Experienced geologist and listed company
director• Many years experience working in the Goldfields• Significant discoveries include:
• Kanowna Belle (6.5Moz’s), and• East Kundana (4.5Moz’s)
Mr Andrew SparkeNon-Executive ChairmanB.Bus (Marketing), M.Fin (Current) and GAICD• Experience in IPO’s, private placements,
secondary market transactions and listed company compliance
• Advised numerous ASX listed companies on capital raising and corporate transactions
• Director of a number of public and private companies including Olive Capital Pty Ltd
Ms Elissa HansenNon-Executive DirectorB.Comm, Grad Dip Applied Corporate Governance,GAICD and AGIA• Experience in advising boards on corporate
governance, compliance and investor relations• Chartered Secretary with strong governance and
compliance skills• Director and/or Company Secretary of a number of
public, listed and private companies
Mr Glenn JardineNon Executive DirectorB.Eng, (Mining Engineering) and GAICD• Mining Executive with 25+ years experience in
project development, operations and corporate activities.
• Previously CEO of Kimberley Metals Group Pty Ltd, Managing Director of Southern Cross Goldfields Limited and Managing Director of LionOreAustralia Pty Ltd. F
or p
erso
nal u
se o
nly

5
“Our aggressive exploration
strategy will fast track resource
definition.”Matthew Sullivan, Torian Resources’ MD
For
per
sona
l use
onl
y

6
Note: The above graphs show the value of Tribune and Delta Gold’s share price after the discovery of significant gold deposits by Torian’s Managing Director, Matthew Sullivan. Please note that past performance is not an indicator of future performance.
TRACK RECORD
Delivering Value For Shareholders
$-
$1.00
$2.00
$3.00
$4.00
$5.00
$6.00
$7.00
EAST KUNDANA PROJECTTribune Resources Ltd (ASX:TBR)
Barrick GoldAcquires 51%
East KundanaDiscovery Production
Commences
Northern StarAcquires 51%
$-
$0.50
$1.00
$1.50
$2.00
$2.50
$3.00
$3.50
$4.00
$4.50
$5.00
KANOWNA BELLE PROJECTDelta Gold NL (ASX:DGD)
Discovered Kanowna Belle
$0.13
$0.15
$0.17
$0.19
$0.21
$0.23
$0.25
$0.27
ZULEIKA JV PROJECTTorian Resources Ltd (ASX:TNR)
For
per
sona
l use
onl
y

7
o Low Cost Exploration
o Regional Consolidation
o Fast Track Development
.
THE STRATEGY
For
per
sona
l use
onl
y

88
o Focused on acquiring and developing Western Australian gold assets.
o Torian has four advanced projects located in the Goldfields Region.
o The Goldfields produced 146.9 Million ounces of gold up until 2014.
o Western Australia represents over 70% of Australia’s total gold production.
Zuleika JV – 50km NW of Kalgoorlie, WA
Mt Stirling – 40km NW of Leonora, WA
Malcolm – 15km E of Leonora, WA
Bardoc – 40km N of Kalgoorlie, WA
Overview
THE PROJECTS
For
per
sona
l use
onl
y

9
o High Grade Deposits
o Many Recent Discoveries
o Numerous Operating Mines
o Strong Margins
o Significant Corporate Activity
WHY THE ZULEIKA SHEAR?
For
per
sona
l use
onl
y
10
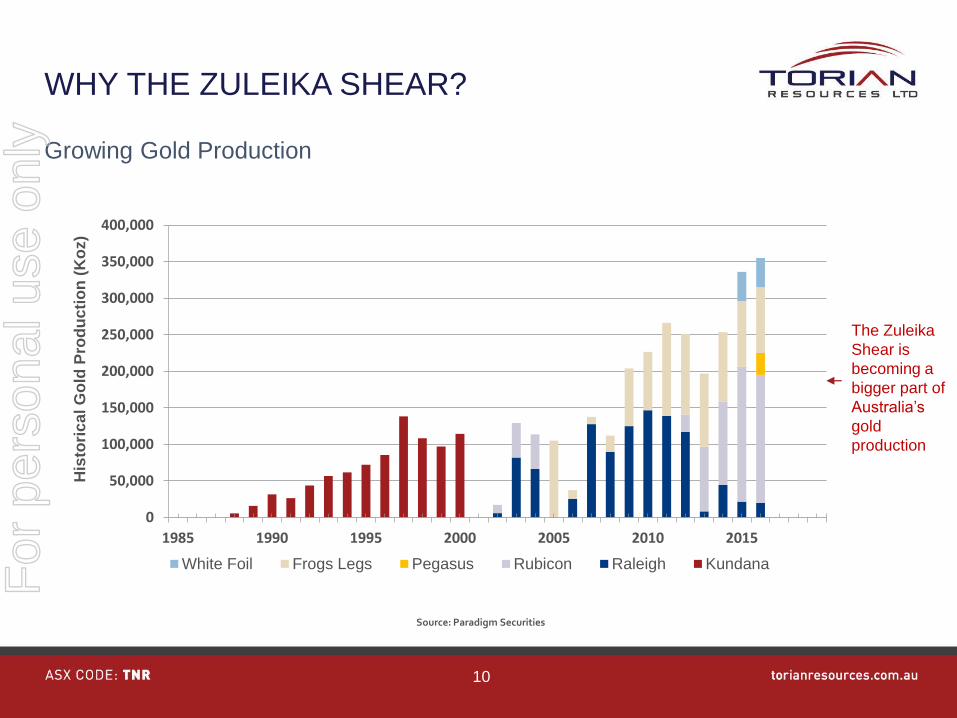
WHY THE ZULEIKA SHEAR?
Growing Gold Production
Source: Paradigm Securities
0
50,000
100,000
150,000
200,000
250,000
300,000
350,000
400,000
1985 1990 1995 2000 2005 2010 2015
His
tori
ca
l G
old
Pro
du
cti
on
(K
oz)
White Foil Frogs Legs Pegasus Rubicon Raleigh Kundana
The Zuleika
Shear is
becoming a
bigger part of
Australia’s
gold
production
For
per
sona
l use
onl
y

11
“The Zuleika is renowned for
consistently producing high
grade gold deposits”
Matthew Sullivan, Torian’s MD.
For
per
sona
l use
onl
y

12
WHY THE ZULEIKA SHEAR?
High Grade Gold Production
0
2
4
6
8
10
12
14
16
1985 1990 1995 2000 2005 2010 2015
Res
ou
rce
Gra
de
(g
/t):
East Kundana KundanaFrog's Legs White FoilPhoenix Average Grade in Australian Gold Production
Source: Paradigm Securities
Grade of
Average
Australian
Gold Mine
For
per
sona
l use
onl
y

1313
o Second largest landholder in the region.
o Holds the second largest strike of the black shale line.
o 125 tenements including 2 Mining Leases, 1 Exploration License and 121 Prospecting Licenses.
o Since May 2015, Torian has made seven acquisitions in this region adding ~ 75% to the overall project size.
o Total land area now approximately 222.6km².
ZULEIKA JV
Map showing Torian’s Zuleika project in relation to other companies’ landholdings.
Overview
For
per
sona
l use
onl
y

1414
ZULEIKA JV
Figures are an estimate only based on Torian’s research and market information. As at 17/06/2016
Regional Comparison - Cheap entry point relative to peers
Company: Code: Market Cap (A$M): Strike Length: Gold Discovered: Land Area:
Rand Mining Ltd ASX:RND A$150.4 Million ~11.5km ~2.5Moz ~50km²
Northern Star Resources Ltd ASX:NST A$3.05 Billion ~15.0km ~7.5Moz ~150km²
Zijin Mining Group Ltd HK:2899 HK$53.9 Billion ~2.0km ~6.0Moz ~100km²
Tribune Resources Ltd ASX:TBR A$368.0 Million ~11.5km ~2.5Moz ~50km²
Evolution Mining Ltd ASX:EVN A$3.6Billion ~45.0km ~2.6Moz ~920km²
Torian Resources Ltd ASX:TNR $16.99 Million 25.0km N/A 222km²
Cheapest
Entry Point
2nd Largest
Landholding
2nd Largest
Strike Length
For
per
sona
l use
onl
y

15
“With A$1 Billion worth of
acquisitions in recent years, the
Zuleika Shear is undoubtedly the
most sought after gold region in
Australia.”Matthew Sullivan, Torian Resources’ MD
For
per
sona
l use
onl
y

1616
Companies: Code: Market Cap (A$): Corporate Activity: Price (A$): Date:
La Mancha Pty Ltd Private Private CompanyPurchase 49% of Frogs Legs from
AlacerA$138 Million
08-Apr-13
Northern Star Resources Ltd ASX:NST A$3.05 BillionPurchased 51% of EKJV & Kanowna
Belle from Barrick GoldA$75 Million 28-Feb-14
Zijin Mining Group Co HK:2899 HK$53.9 Billion Zijin acquires Norton GoldifeldsA$226 Million
13-Jan-15
Evolution Mining Ltd ASX:EVN A$3.57 BillionEvolution acquires La Mancha's
Australian operations~A$442 Million
20-Apr-15
Evolution Mining Ltd ASX:EVN A$3.57 BillionEvolution are currently in the process
of acquiring Phoenix GoldA$76 Million 31-Dec-15
Torian Resources Ltd ASX:TNR A$16.99MillionCompleted a JV with Cascade
Resources to earn 49%A$5 million 22-Apr-15
Total:A$962 Million
Note: Figures are indicative only and were taken from the ASX on 17/06/2016.
ZULEIKA JV
Recent Acquisitions – Demonstrates cheap acquisition cost
Cheapest
Entry Point
Cheapest
Acquisition
For
per
sona
l use
onl
y

1717
o Road: Projects are located close to Kalgoorlie and are accessible via well kept sealed and all weather gravel roads
o Laboratories: Numerous labs located in Perth and Kalgoorlie
o Utilities: Water and power are located nearby the Zuleika JV project
o Workforce: Abundant skilled local workforce
o Processing: Located within close proximity to numerous operating plants with excess capacity
o Plant and Equipment: Multiple drilling and mining contractors readily available
ZULEIKA JV
Regional Infrastructure
Regional Infrastructure surrounding Torian’s Zuleika Project.
For
per
sona
l use
onl
y
1818
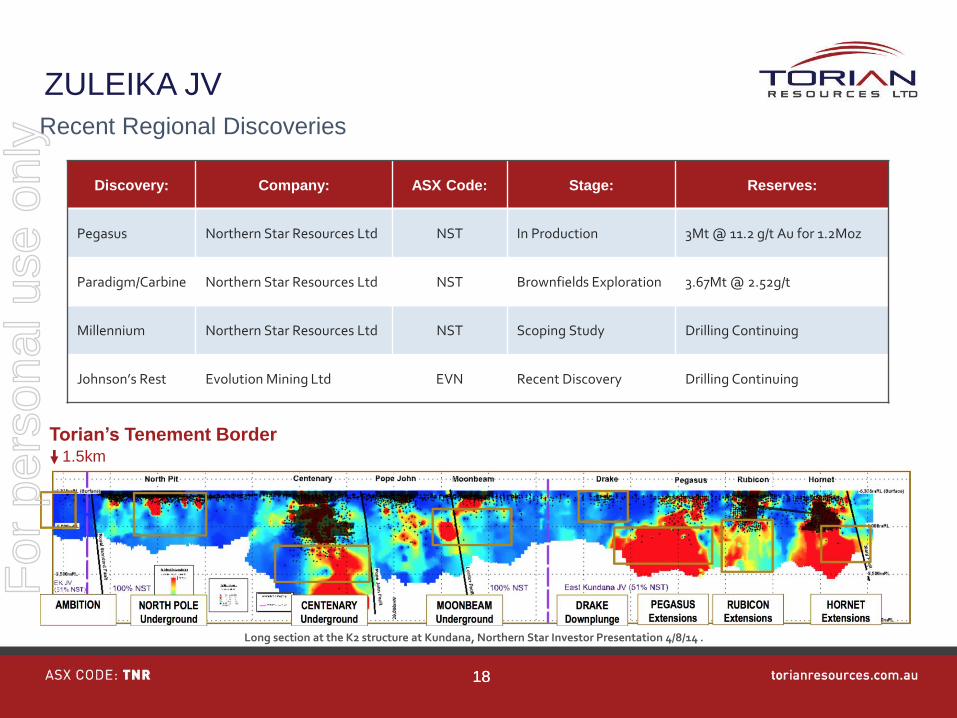
ZULEIKA JV
Recent Regional Discoveries
Discovery: Company: ASX Code: Stage: Reserves:
Pegasus Northern Star Resources Ltd NST In Production 3Mt @ 11.2 g/t Au for 1.2Moz
Paradigm/Carbine Northern Star Resources Ltd NST Brownfields Exploration 3.67Mt @ 2.52g/t
Millennium Northern Star Resources Ltd NST Scoping Study Drilling Continuing
Johnson’s Rest Evolution Mining Ltd EVN Recent Discovery Drilling Continuing
Long section at the K2 structure at Kundana, Northern Star Investor Presentation 4/8/14 .
1.5km
Torian’s Tenement Border
For
per
sona
l use
onl
y

19
Torian’s Target 10 showing 1.5km of mineralise strike.Evolutions recent Johnson’s Rest Discovery. Northern Star’s recent Paradigm discovery.
ZULEIKA JV
Recent Regional Discoveries
Johnson's Rest Discovery (Evolution Mining) 10m @22.3g/t Au from 118m.
Paradigm Discovery (Northern Star) 107.5m @ 3.1g/t Au inc. 10.1m @28.8g/t Au; and
197.5m @ 2.4g/t Au inc. 10.1m @17.7g/t Au
Millennium Discover (Northern Star) 15.0m @ 6.2g/t Au inc. 4m @ 14.7g/t Au
6.3m @ 17.3g/t Au including 0.7m @ 140g/t Au
For
per
sona
l use
onl
y
20
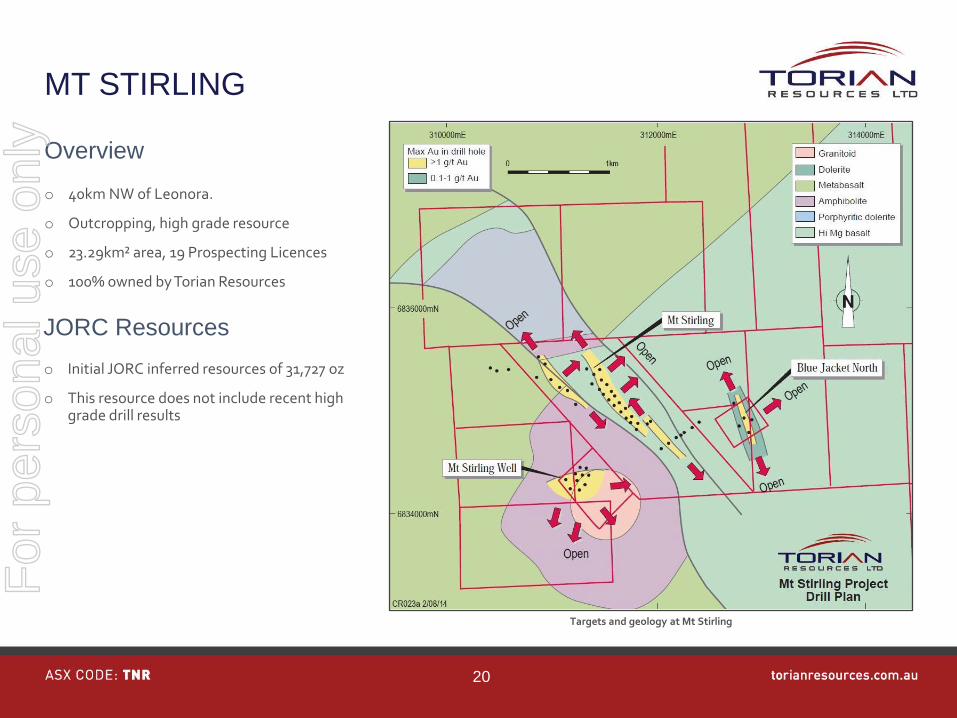
Targets and geology at Mt Stirling
MT STIRLING
o 40km NW of Leonora.
o Outcropping, high grade resource
o 23.29km² area, 19 Prospecting Licences
o 100% owned by Torian Resources
Overview
o Initial JORC inferred resources of 31,727 oz
o This resource does not include recent highgrade drill results
JORC Resources
For
per
sona
l use
onl
y

21
Cross section showing results of Torian’s recent drill program
MT STIRLING
o 3,535t @ 52.22g/t Au for 5,935 oz.
o Currently undertaking metallurgical test work.
o Approvals received for Phase 2 of the drilling program.
Historic Production
What’s Next?
o Step out drilling to determine size of deposit
o Metallurgical test work
For
per
sona
l use
onl
y
22
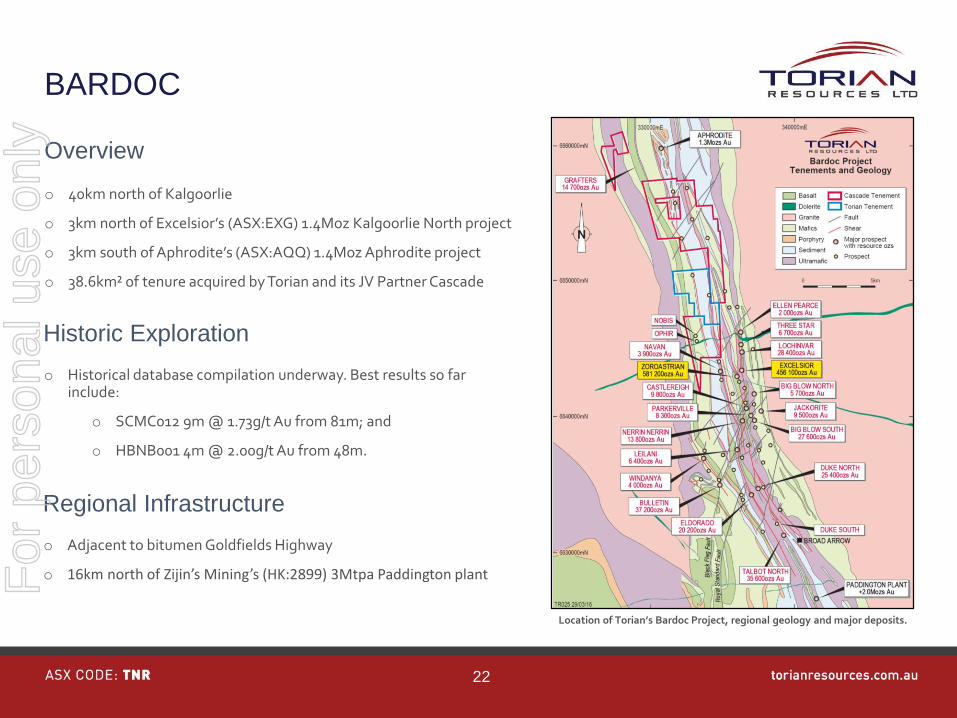
Location of Torian’s Bardoc Project, regional geology and major deposits.
o 40km north of Kalgoorlie
o 3km north of Excelsior’s (ASX:EXG) 1.4Moz Kalgoorlie North project
o 3km south of Aphrodite’s (ASX:AQQ) 1.4Moz Aphrodite project
o 38.6km² of tenure acquired by Torian and its JV Partner Cascade
Overview
o Historical database compilation underway. Best results so far include:
o SCMC012 9m @ 1.73g/t Au from 81m; and
o HBNB001 4m @ 2.00g/t Au from 48m.
Historic Exploration
BARDOC
o Adjacent to bitumen Goldfields Highway
o 16km north of Zijin’s Mining’s (HK:2899) 3Mtpa Paddington plant
Regional Infrastructure
For
per
sona
l use
onl
y
23
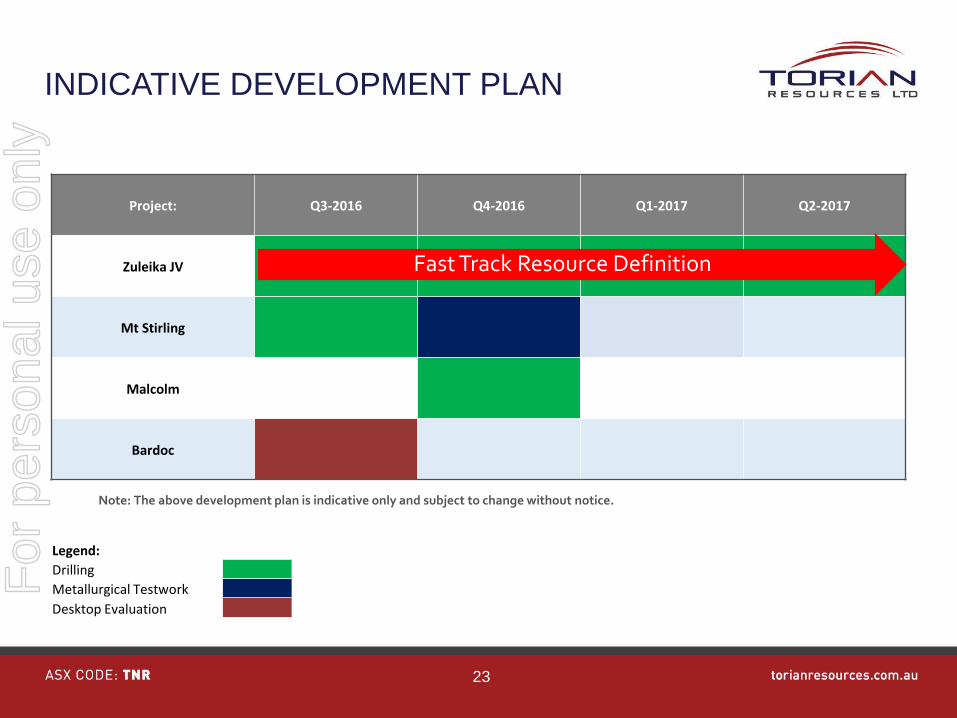
Note: The above development plan is indicative only and subject to change without notice.
INDICATIVE DEVELOPMENT PLAN
Project: Q3-2016 Q4-2016 Q1-2017 Q2-2017
Zuleika JV
Mt Stirling
Malcolm
Bardoc
Fast Track Resource Definition
Legend:
Drilling
Metallurgical Testwork
Desktop Evaluation
For
per
sona
l use
onl
y

24
COMPARABLES
Market Capitalisation (A$ Million):
For
per
sona
l use
onl
y

25
Historic Newsflow
2015 2016Mar May Jul Sep Nov Jan Mar
Completion of Cascade Transaction
Strategic Acquisition at Zuleika
Further Acquisition at Zuleika
R&R Ventures Becomes Substantial Holder
Further Acquisition at Zuleika
North Kundana Discovery?
Torian Strengthens Board & Management Team
Drill Results from Zuleika
Torian Earns Initial Interest in Zuleika
More Encouraging Drill Results at Zuleika
Joint Venture on Zuleika Project
Further Acquisition at Zuleika
Drilling Commences at Zuleika
Drilling Commences at Mt Stirling
Mt Stirling Shines with More High Grade Results
Further Acquisition at Zuleika
DELIVERING ON OUR OBJECTIVES
For
per
sona
l use
onl
y

26
SYDNEY OFFICELevel 26, 1 Bligh StSydney NSW 2000(02) 8313 7166
PERTH OFFICESuite G4, 29 Melville Pde
South Perth WA 6151(08) 6216 0424
CONTACTS
KALGOORLIE OFFICE17 Hopkins St
Boulder WA 6432(08) 9093 4818
For
per
sona
l use
onl
y

27
AppendixF
or p
erso
nal u
se o
nly
2828
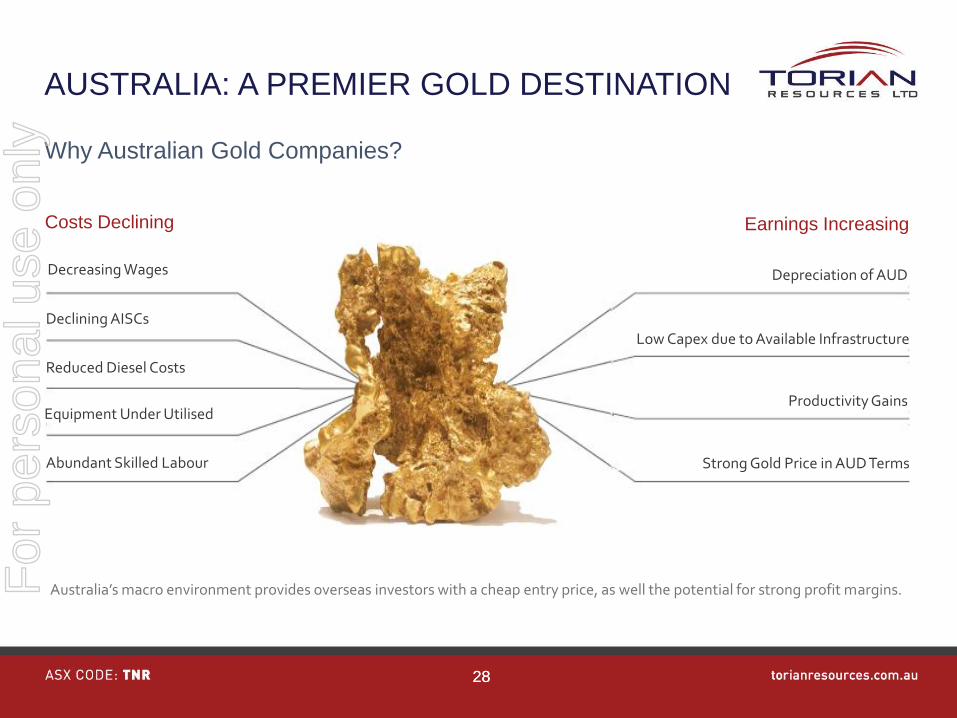
Why Australian Gold Companies?
AUSTRALIA: A PREMIER GOLD DESTINATION
Australia’s macro environment provides overseas investors with a cheap entry price, as well the potential for strong profit margins.
Costs Declining Earnings Increasing
Declining AISCs
Decreasing Wages
Equipment Under Utilised
Abundant Skilled Labour
Depreciation of AUD
Low Capex due to Available Infrastructure
Productivity Gains
Strong Gold Price in AUD Terms
Reduced Diesel Costs
For
per
sona
l use
onl
y

29
0
100
200
300
400
500
600
700
Australian Gold Production Companies in the Current S&P ASX 300 Gold Index
XGD: Australian Producers: Overseas Produucers:
Note: This graph shows that the S&P ASX 300 Gold Index is negatively impacted by companies with majority of their operations outside of Australia – Paradigm Securities.
AUSTRALIA: A PREMIER GOLD DESTINATION
Source: Paradigm Securities
1000
1100
1200
1300
1400
1500
1600
1700
1800
1900
2/3/10 2/3/11 2/3/12 2/3/13 2/3/14 2/3/15 2/3/16G
old
Pri
ce:
Date:
Gold Price in USD vs AUD
USD AUD
For
per
sona
l use
onl
y

30
0%
2%
4%
6%
8%
10%
12%
14%
16%
18%
Australia SouthAfrica
Russia Chile Indonesia UnitedStates
Brazil Peru
Global Economic Reserves
AUSTRALIA: A PREMIER GOLD DESTINATION
Source: Western Australian Mineral and Petroleum Statistics Digest 2014-15
0%
2%
4%
6%
8%
10%
12%
14%
China Australia Russia UnitedStates
SouthAfrica
Peru Indonesia Brazil
Global Gold Production
For
per
sona
l use
onl
y

31
Western Australia accounts for over 70% of Australia’s total gold production (DMP 2014).
Figure: Levels of Gold Production in WA compared to the rest of Australia
Figure: Exploration Expenditure in WA compared to the rest of Australia
WA: THE BEST PLACE TO FIND GOLD
Source: Western Australian Mineral and Petroleum Statistics Digest 2014-15
For
per
sona
l use
onl
y

32
Note: During the last decade Junior Companies have accounted for 72% of all discoveries made in Australia
Figure: Expenditures and number of discoveries by company type.Figure: Gold discoveries by company type.
Source: MinEx Consulting 2015, Van Eck Global 2016
Note: Juniors spent ~50% of total exploration spent but made 72% of the discoveries
JUNIORS - MOST EFFECTIVE EXPLORERS
For
per
sona
l use
onl
y

3333
IMPORTANT INFORMATION
This presentation has been prepared by and issued by Torian Resources Limited ABN 72 002 261 565 (Torian or Company) to assist in informing interested parties about theCompany and should not be considered as an offer or invitation to subscribe for or purchase any securities in the Company or as an inducement to make an offer or invitation withrespect to those securities. No agreement to subscribe for securities in the Company will be entered into on the basis of this presentation.
This presentation is limited to persons who are sophisticated investors for the purposes of s708(8) or professional investors for the purposes of s708(11) of the Corporations Act2001 or persons who hold Australian financial services licences and any of their representatives. By attending and/or receiving this presentation you warrant to Torian that you aresuch a person. This presentation may contain forward looking statements. Whilst Torian has no reason to believe that any such statements are either false, misleading orincorrect, it cannot and does not warrant or guarantee that through either the passage of time or actions beyond the control of Torian they will not become so.
You should not act and you must refrain from acting in reliance on any of this presentation material. Nothing contained in this presentation constitutes investment, legal, tax orother advice. This overview of Torian does not purport to be all inclusive or to contain all information which its recipients may require in order to make an informed assessment ofthe Company’s prospects. Before making an investment decision, you should conduct, with the assistance of your broker or other financial or professional adviser, your owninvestigation in light of your particular investment needs, objectives and financial circumstances and perform your own analysis in order to satisfy yourself as to the accuracy andcompleteness of the information, statements and opinions contained in this presentation prior to making any investment decision.
Neither the Company nor its advisers has verified the accuracy or completeness of the information, statements and opinions contained in this presentation. Accordingly, to themaximum extent permitted by law, the Company make’s no representation and give no assurance, guarantee or warranty, express or implied, as to, and take no responsibility andassume no liability for, the authenticity, validity, accuracy, suitability or completeness of, or any errors in or omissions, from any information, statement or opinion contained inthis presentation. The contents of this presentation are confidential. This presentation is being provided to you on the condition that you do not reproduce or communicate it ordisclose it to, or discuss it with, any other person without the prior written permission of the Company.
Torian, its officers, employees, authorised representatives, consultants and its associates, officers and family members do currently and in the future may have interests in thesecurities of the Company. In addition, Torian’s advisors will earn commissions, fees and other benefits and advantages, whether pecuniary or not and whether direct or indirect inconnection with the Capital Raising(s) for the Company, advising and providing services to the Company.
This presentation contains information, ideas and analysis which are proprietary to Torian. By agreeing to receive this information you also agree to respect the confidentialnature of this entire presentation. Specifically you agree not to reproduce in any manner or distribute any part of the information contained herein without the prior writtenconsent of the Company.
Information in this report pertaining to mineral resources and exploration results was compiled by Mr Matthew P. Sullivan, who is a member of Aus.I.M.M. Mr Sullivan is theprincipal of Jemda Pty Ltd, geological consultants to the company. Mr Sullivan has sufficient experience which is relevant to the style of mineralisation and the type of depositthat is under consideration and to the activity that he is undertaking to qualify as a competent person as defined in the 2012 Edition of the “Australasian Code for Reporting ofExploration Results, Mineral Resources and Ore Reserves”. Mr Sullivan consents to the inclusion in the report of the matters based on his information in the form and context inwhich is appears.F
or p
erso
nal u
se o
nly