for personal use only · presentation 21 february 2013 capral limited ... june 2010 june 2011 march...
TRANSCRIPT

1 21 FEBRUARY 2013CAPRAL FULL YEAR RESULTS
2012 Full Year Results Presentation
21 February 2013 CAPRAL LIMITED
This presentation includes forward-looking estimates that are subject to risks, uncertainties and assumptions outside of Capral’s control and should be viewed accordingly.
For
per
sona
l use
onl
y

2 21 FEBRUARY 2013CAPRAL FULL YEAR RESULTS
HIGHLIGHTS FULL YEAR TO DECEMBER 2012
... EBITDA¹ profit of $4.0m (before restructuring & LME mark to market)
... $9.5m positive Operating cash flow
... Progress with Anti Dumping measures
... Safety is a core value
... Net loss of $11.0m
... A robust balance sheet with no net debt
... High levels of customer service and product quality
• Achieved in tough trading conditions - Housing at a cyclical low - High A$ sustaining imports (dumped) - Ill-timed capacity expansion in the Australian industry resulting in sub optimal plant utilisation• Anchored by ongoing productivity improvements and cost savings
• Tight control of working capital, inventory reductions
• Government is progressing wide ranging reforms• Customs Compliance resources have strengthened• Market impact to date has been modest
• 37% reduction in Lost Time/Medical Treatment Injuries• Hours lost due to injuries below 0.06%
Net cash of $19.8m at 31 December 2012
• Customer feedback is positive• Market share maintained
¹ Earnings before net interest, tax, depreciation and amortisation
• Impacted by a high $12.5m ongoing depreciation charge, $1.3m in restructuring costs and a $0.6m LME devaluation
For
per
sona
l use
onl
y
3 21 FEBRUARY 2013CAPRAL FULL YEAR RESULTS
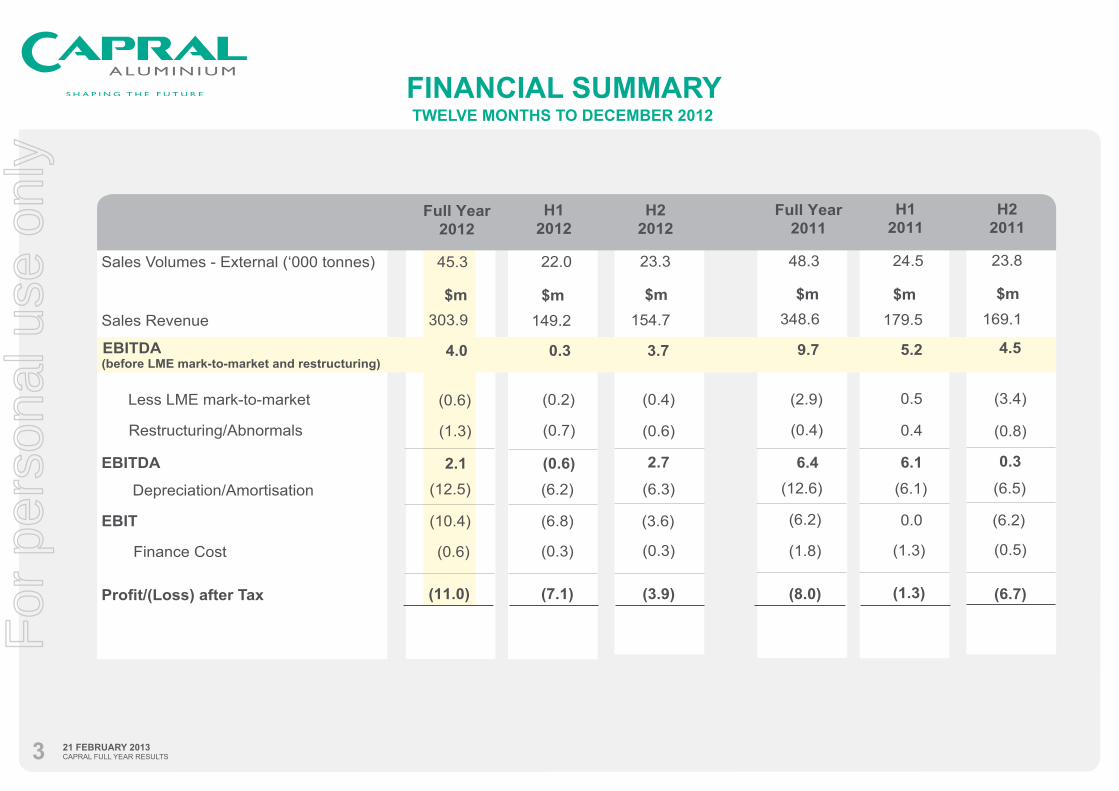
FINANCIAL SUMMARYTWELVE MONTHS TO DECEMBER 2012
Sales Volumes - External (‘000 tonnes)
Sales Revenue
4.0 EBITDA
(before LME mark-to-market and restructuring)
Depreciation/Amortisation
EBIT
Finance Cost
$m
Restructuring/Abnormals
EBITDA
(1.3)
2.1
Full Year2012
H22012
H12012
154.7
(6.3)
(3.6)
(0.3)
(3.9)
$m
2.7
149.2
0.3
(6.2)
(6.8)
(0.3)
(7.1)
$m
(0.7)
(0.6)
23.322.0
3.7
45.3
(0.6)
303.9
(12.5)
(10.4)
(0.6)
(11.0)
9.7
$m
(0.4)
6.4
Full Year2011
H22011
H12011
169.1
(6.5)
(6.2)
(0.5)
(6.7)
$m
0.3
179.5
5.2
(6.1)
0.0
(1.3)
(1.3)
$m
0.4
6.1
23.824.5
4.5
48.3
(0.8)
348.6
(12.6)
(6.2)
(1.8)
(8.0)
Less LME mark-to-market (0.6) (0.2) (0.4)
(2.9) 0.5 (3.4)
For
per
sona
l use
onl
y
4 21 FEBRUARY 2013CAPRAL FULL YEAR RESULTS
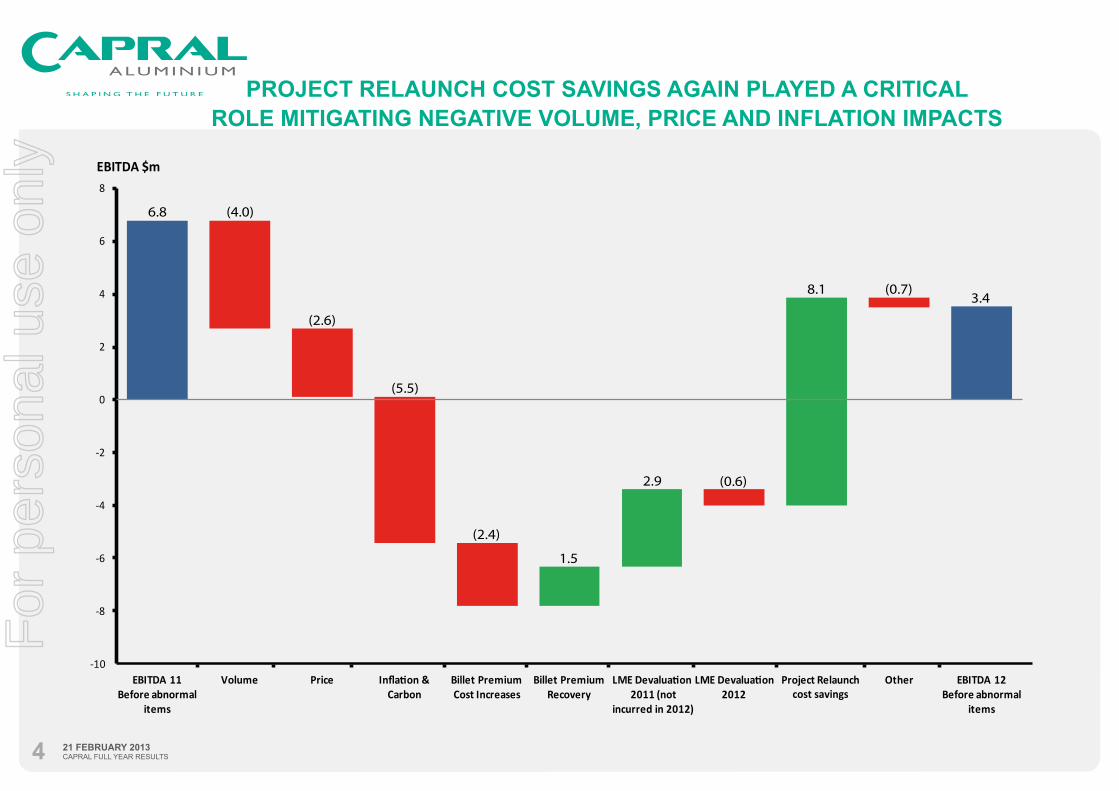
PROJECT RELAUNCH COST SAVINGS AGAIN PLAYED A CRITICAL ROLE MITIGATING NEGATIVE VOLUME, PRICE AND INFLATION IMPACTS
-10
-8
-6
-4
-2
0
2
4
6
8
EBITDA 11 Before abnormal
items
Volume Price Inflation & Carbon
Billet Premium Cost Increases
Billet Premium Recovery
LME Devaluation 2011 (not
incurred in 2012)
LME Devaluation 2012
Project Relaunchcost savings
Other EBITDA 12 Before abnormal
items
EBITDA $m
6.8
1.5
2.9 (0.6)
8.1 (0.7)3.4
(2.4)
(5.5)
(2.6)
(4.0)
For
per
sona
l use
onl
y

5 21 FEBRUARY 2013CAPRAL FULL YEAR RESULTS
350
150
200
250
300
100
173178
230
295
327
168
40%
FY ‘10FY ‘09FY ‘08FY ‘07 FY ‘12 FY ‘11
Tonnes per day
The Trading EBITDA1 break even of the business has reduced by over 40% since 2008
Underlying costs have reduced by $40m pa over the 2008 base.
• Employee head count has reduced in excess of 40% since 2008 to around 790 employees
• Manufacturingefficiency
• Metal recovery % improvement
• Warehouse consolidation
• Aluminium Centres rationalisation and revitalisation
• FreightandLogisticsefficiencies
• Procurement savings
• Corporate cost reductions
• General costs pruning.
For
per
sona
l use
onl
y

6 21 FEBRUARY 2013CAPRAL FULL YEAR RESULTS
$m $m Dec 12 Dec 11
EBITDA 6.4
Working Capital 2.3
Finance Cost (1.6)
Equity Compensation Amortisation 1.2
Other 0.5
Operating Cash Flow 8.8
Capex Spend (5.5)
Increase in Net Cash 3.5
12 months to
19.2
(2.3)
(2.7)
3.7
1.9
19.8
(3.0)
17.2
$mDec 10
Sale of property - 1.4
Acquisition - (1.3)
Interest received 0.3 0.2
2.1
6.7
(0.6)
1.2
0.1
9.5
(4.5)
5.1
-
-
0.1
$m $m $m Dec 12 Dec 11 Dec 10
Net Assets 146.7 156.2 162.1
Net Cash 19.8 14.7 11.3
Franking Credits 27.1 27.1 27.1
Accumulated unrecognisedTax Losses
282.2 275.9 268.1
As at
$m $m BalanceCapral Finance Facilities Limit Dec 12 Dec 11
GE Term Debt 30 Nil
GE Revolver 60 Nil Nil
ANZ Overdraft 0.4 0.2 0.3
Dec 10
21.7
-
0.3
Nil
STRONG FINANCIAL POSITION
Operating Cash Flow is positive
Resulting in a robust balance sheet with a positive cash balance1, no net debt and large accumulated tax losses and franking credits
¹ Intra month debt levels ranged up to $8m
ThefinancefacilitywithGEisprimarily utilised for intra month¹ working capital funding
For
per
sona
l use
onl
y

7 21 FEBRUARY 2013CAPRAL FULL YEAR RESULTS
LEVERAGE TO RECOVERY IN RESIDENTIAL CONSTRUCTION
RESIDENTIAL50%INDUSTRIAL
35%
COMMERCIAL15%
UNDERLYING DEMAND (‘000) 2012/13 - 2016/17 ANNUAL AVERAGE
New South Wales 43.2
Victoria 39.5
Queensland 42.1
South Australia 10.6
Western Australia 28.5
Tasmania 2.2
Northern Territory 2.3
A.C.T 2.6
Australia 172.7
SOURCE: BIS SHRAPNEL MAY/JUNE 2012
COMMENCEMENTS ARE FORECAST TO RISE BY 15% BY 2014MONTHLY DWELLING APPROVALS AND QUARTERLY DWELLING COMMENCEMENTS
CAPRAL SEGMENT EXPOSURE
March 2010
June 2010
June 2011
March 2011
Sept 2010
Dec 2010
Dec 2011
March 2012
Sept 2011
June 2012
Sept 2012
Dec 2012F
10,000
13,000
14,000
15,000
16,000
11,000
12,000
MONTHLYUNITS
APPROVALS
COMMENCEMENTS
Source: ABS and BIS Shrapnel
SOURCE: BIS SHRAPNEL,JAN 2013
2010 2011 2012F
75
100
125
150
200
ANNUAL DWELLING COMMENCEMENTS
168
150-17% fall
139
‘000
Underlying demand
148
160
2013E 2014E
175
25
50
0
+15%
173
-7%
For
per
sona
l use
onl
y
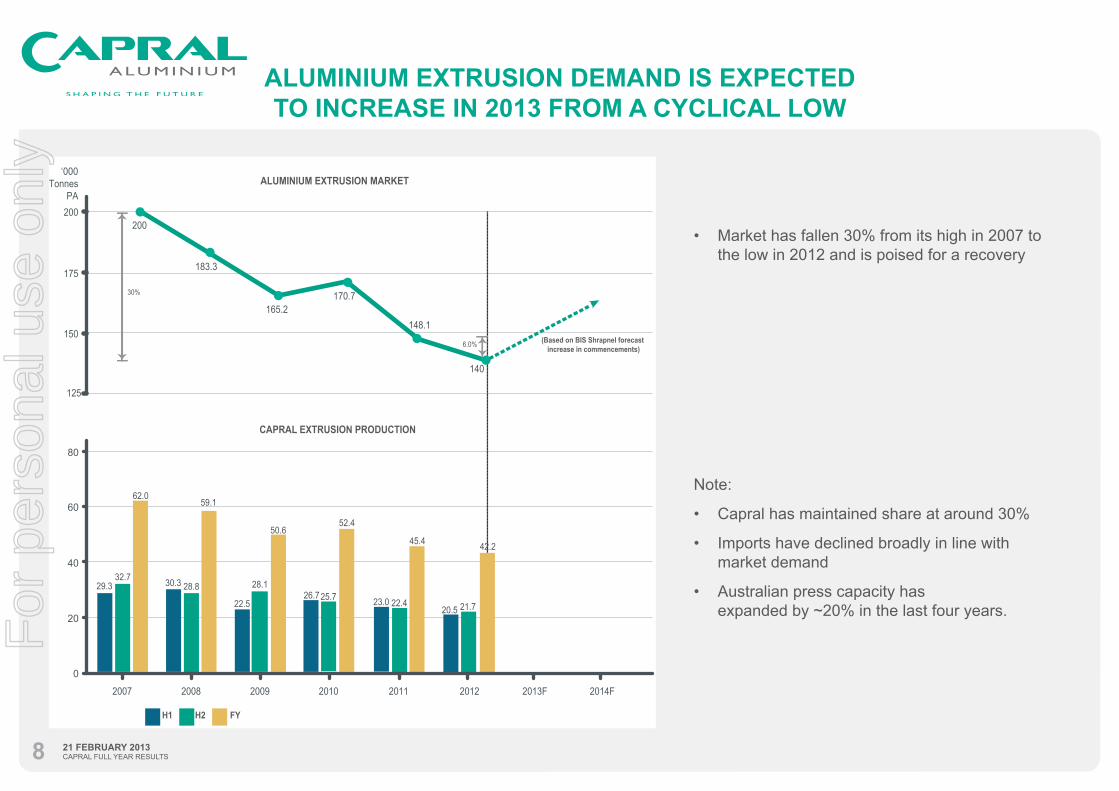
8 21 FEBRUARY 2013CAPRAL FULL YEAR RESULTS
2007 2008 2009 2010 2011
0
20
40
60
80
29.332.7
62.0
30.3 28.8
22.5
28.1
50.6
26.725.7 23.0
52.4
59.1
150
175
200
‘000Tonnes
PA
200
183.3
165.2170.7
148.1
ALUMINIUM EXTRUSION MARKET
CAPRAL EXTRUSION PRODUCTION
H2 FY
140
22.4
45.4
H1
2012
20.5
6.0%
125
30%
21.7
42.2
2013F
(Based on BIS Shrapnel forecast increase in commencements)
2014F
ALUMINIUM EXTRUSION DEMAND IS EXPECTED TO INCREASE IN 2013 FROM A CYCLICAL LOW
• Market has fallen 30% from its high in 2007 to the low in 2012 and is poised for a recovery
Note:
• Capral has maintained share at around 30%
• Imports have declined broadly in line with market demand
• Australian press capacity has expanded by ~20% in the last four years.
For
per
sona
l use
onl
y

9 21 FEBRUARY 2013CAPRAL FULL YEAR RESULTS
Dumping & Countervailing Duties (Avg)40%
10%
20%
30%
0%Canada USAAustralia
CAPRAL HAS BEEN AT THE FOREFRONT OF A CAMPAIGN TO REFORM AUSTRALIAN
ANTI DUMPING REGIME
Key issues being pursued
Response
• Capral won a case in 2010 but the levels of duties are relatively low
• There are indications of a concerning level of circumvention by importers
• Some elements of the 2010 case are being contested by importers
• Achieve legislation change to enable the use of “surrogate” methodology in Australia, similar to the USA, Canada and the E.U.
• Further strengthen anti circumvention measures to capture surreptitious practices before the Border controls, as well as “sales at a loss” and “rebates” once the imports are in Australia.
• The Australian Government is implementing an Anti Dumping reform agenda with 28 measures announced. Four tranches of legislation have now been approved by Parliament
• The Federal Government have set up a taskforce “Bluenet” to pursue anti circumvention activities
• Following a review by John Brumby (ex Premier of Victoria), the Federal Government in December 2012 announced a far reaching reform of the Trade Measures Branch of Customs
The impact of the imposed anti dumping measures to date has been modest
For
per
sona
l use
onl
y

10 21 FEBRUARY 2013CAPRAL FULL YEAR RESULTS
SAFETY
ENVIRONMENTALCapral is committed to minimising the environmental impacts of its extrusion and distribution activities. Capral has a relatively modest carbon footprint and is not included in the top 500 site emitters.
Emissions come from two sources: KTPAScope 1 Mainly from the use of gas for 10 heating ovens Scope 2 From electricity 40
At current production levels the additional direct cost from the carbon tax linkage to electricity charges is around $1.0m p.a.
Safety performance improved again in 2012 with indicators at record lows
Measure/Year 2008 2009 2010 2011 2012
Lost Time Injuries 15 7 16 12 4
LTI/MTI’S 41 31 43 31 21
LTI/MTI Frequency* 17.5 16.3 23.6 18.4 13.2
Hours Lost Through Injury 2,880 1,436 3,731 2,350 1,003
% Hours Lost 0.12 0.08 0.21
* Frequency = No. of injuries per million work hours
0.14 0.06
For
per
sona
l use
onl
y

11 21 FEBRUARY 2013CAPRAL FULL YEAR RESULTS
CEO TRANSITION
• Phil Jobe is stepping down as CEO in mid April after four years in the role. Phil will remain as a non-executive Director of Capral and continue to spearhead the Anti Dumping advocacy
• Tony Dragicevich has been appointed as the CEO Designate. Tony is an experienced CEO with a relevant background in manufacturing and distribution in the building materials sector
Previous roles include CEO and Managing Director of the Wattyl group, Chief Executive of the GWA Bathroom and Kitchens group, MD of the Red Paper group and GM of Tasman Insulation
• Capral has in place a capable, experienced and tenacious leadership team.
For
per
sona
l use
onl
y

12 21 FEBRUARY 2013CAPRAL FULL YEAR RESULTS
A COMPREHENSIVE STRATEGIC PLAN IS BEING IMPLEMENTED
• Leading Market Share• Long term customer relationships• Experienced and committed workforce• Commitment to excellence• National footprint of world class extrusion plants• National distribution and logistics capability• Largest product range• Strong balance sheet
• Project Relaunch cost savings• Local press transition• Lean Manufacturing implementation• Variablise the cost base• Right size Bremer• Rationalise the product range• Exitunprofitableactivities• Pricing
• Leverage the inevitable housing cycle upswing• Boost the internal distribution channel to market• Develop innovative new products• Target geographic and market channel initiatives• Evaluate “Bolt ons” in the medium term.
and PURSUE A BETTER ANTI DUMPING OUTCOME
DEFENDWhat we have
OPTIMISEWhat we do
GROWIn the future
For
per
sona
l use
onl
y

13 21 FEBRUARY 2013CAPRAL FULL YEAR RESULTS
OUTLOOK • Housing commencements are forecast to be around 148k for calendar 2013, up 6%
on the prior year, skewed to the second half
• A sustained high $A will continue to put pressure on pricing and gross margins and sustain import levels
• ProjectRelaunchcostsavingsaretargetedtoatleastcoverinflationandcarbontaximpacts
• Following the closure of the Aluminium Smelter at Kurri Kurri NSW, Capral has secured billet supply including from imports. The payment terms on the billet imports and the revised credit terms from the remaining Australian billet supplier have significantlytightened
This impact, along with the need for additional working capital associated with a risingmarket,andananticipatedrisingLME,willresultinamaterialcashoutflowinH12013,partiallyreversinginH22013.Capralexpectstocovertheoutflowsandremain net cash positive at balance dates
• Current expectations are for trading EBITDA during H1 2013 to be broadly in line with H1 2012, whilst for FY13 it is expected to exceed FY12 provided the anticipated upturn in housing commencements eventuates.
CAPRAL IS WELL PLACED, WITH EXISTING CAPACITY TO LEVERAGE ANY DEMAND UPTURN.
THE STRATEGIC AND TURNAROUND PLANS ARE STRENGTHENING THE UNDERLYING BUSINESS.
For
per
sona
l use
onl
y
14 21 FEBRUARY 2013CAPRAL FULL YEAR RESULTS
APPENDIX 1
CAPRAL PROFILE
•Australia’slargestmanufactureranddistributorofaluminiumprofiles
•ANationalfootprintofworldclassextrusionplants 8 operating presses with annual capacity of 70KT
•Anetworkof5majordistributionfacilities,6regionalcentresand7metropolitantradecentres with an extensive range of products and logistics capabilities
•Marketleaderinsupplytofabricatorsanddistributors,focussingontheResidential,Commercial and Industrial segments
•790employees,withsignificantindustryskillsandexpertise
•InnovativeR&Dcapability,wellpositionedtotakeadvantageofchangingbuildingregulations in Australia
•AlistedASXcompany,witha76yearheritage.
For
per
sona
l use
onl
y

15 21 FEBRUARY 2013CAPRAL FULL YEAR RESULTS
APPENDIX 2
THE TURNAROUND STRATEGY IS DELIVERING
The First Phase has been completed
The Third Phase
The Second Phase is progressing well
• Stabilise the Business - Recapitalise the Balance Sheet - Embed a new operating philosophy - Implement a lean management structure with increased accountability -Realisesignificantcostsavings - Launch an Anti Dumping Case -Achievepositiveunderlyingcashflowandprofitability.
- Leverage capability - Pursue strategic growth options
• Optimise Business Performance “Project Relaunch”Extrusion - Transition to a state based manufacturing approach -Fixorexitunprofitable“valueadding”activities - Consolidate space requirements at the Bremer facilityDistribution - Lift under performing state operations - Optimise the supply chain - Implement sales growth initiativesCorporate Costs - Continue to right sizeGeneral - “Fair” Anti Dumping resolutionF
or p
erso
nal u
se o
nly
16 21 FEBRUARY 2013CAPRAL FULL YEAR RESULTS
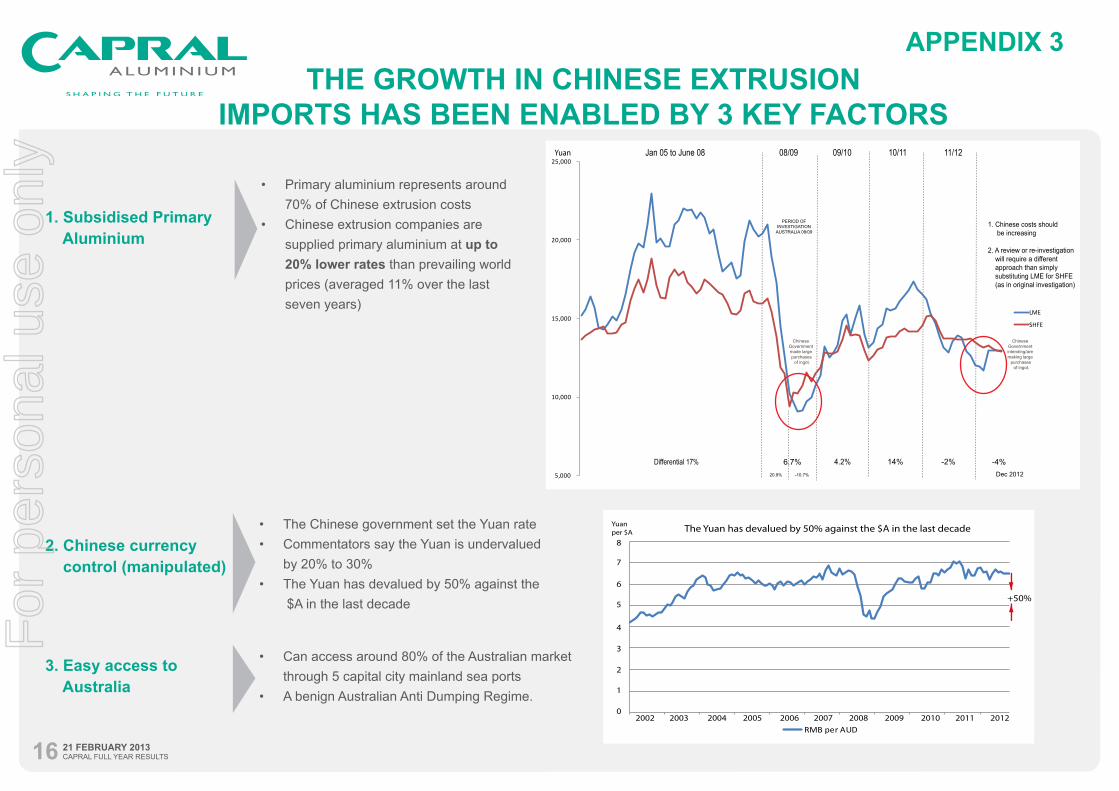
THE GROWTH IN CHINESE EXTRUSION IMPORTS HAS BEEN ENABLED BY 3 KEY FACTORS
APPENDIX 3
5,000
10,000
15,000
20,000
25,000
LME
SHFE
Yuan Jan 05 to June 08 08/09 11/1210/1109/10
6.7% 4.2% 14% -2%Differential 17%-10.7%20.9%
Chinese Government made large purchases of ingot.
PERIOD OFINVESTIGATION
AUSTRALIA 08/09
Dec 2012
1. Chinese costs should be increasing
2. A review or re-investigation will require a different approach than simply substituting LME for SHFE (as in original investigation)
Chinese Government intending/are making large
purchases of ingot.
-4%
RMB per AUD2002
0
5
4
3
2
1
8
7
6
2003 2007200620052004 201020092008 20122011
Yuanper $A The Yuan has devalued by 50% against the $A in the last decade
+50%
• Primary aluminium represents around 70% of Chinese extrusion costs
• Chinese extrusion companies are supplied primary aluminium at up to 20% lower rates than prevailing world prices (averaged 11% over the last seven years)
1. Subsidised Primary Aluminium
2. Chinese currency control (manipulated)
3. Easy access to Australia
• The Chinese government set the Yuan rate • Commentators say the Yuan is undervalued
by 20% to 30%• The Yuan has devalued by 50% against the
$A in the last decade
• Can access around 80% of the Australian market through 5 capital city mainland sea ports
• A benign Australian Anti Dumping Regime.
For
per
sona
l use
onl
y

17 21 FEBRUARY 2013CAPRAL FULL YEAR RESULTS
EXTRUSION PLANTS
Location Presses Bremer (QLD) 2 x 7” 2 x Vertical Paint 2 x 8”
1 x Anodising
Campbellfield (VIC) 1 x 9/12” Canning Vale (WA) 1 x 7” 2 x Horizontal PaintAngaston (SA) 1 x 8” 1 x Vertical PaintPenrith (NSW) 1 x 8” -
1 x 8” ** -
Operating Presses
Finishing
8
1 x Horizontal Paint
34
79
Capacity (Ktpa)*
8
68
66
2008
2008
%
TONNES P.A.
2009 2010
2009 2010
2011
2011
90%
59.1
69%
79%77%
52.450.645.4
65%
2012
‘000
42.2
2012
0
20
0
80
60
40
100
20
80
60
40
EXTRUSION PLANT UTILISATION RATES
CAPRAL HAS A NATIONAL FOOTPRINT OF WORLD CLASS EXTRUSION PLANTS
EXTRUSION PRODUCTION
Operational capabilityCapral operates in all states and employs around 790 people
*Based on 3 shifts 5 days per week**Mothballed
There are also 5 major Distribution Centres and 13 Aluminium Trade Centres/ Regional Warehouses.
DISTRIBUTION
APPENDIX 4F
or p
erso
nal u
se o
nly
18 21 FEBRUARY 2013CAPRAL FULL YEAR RESULTS
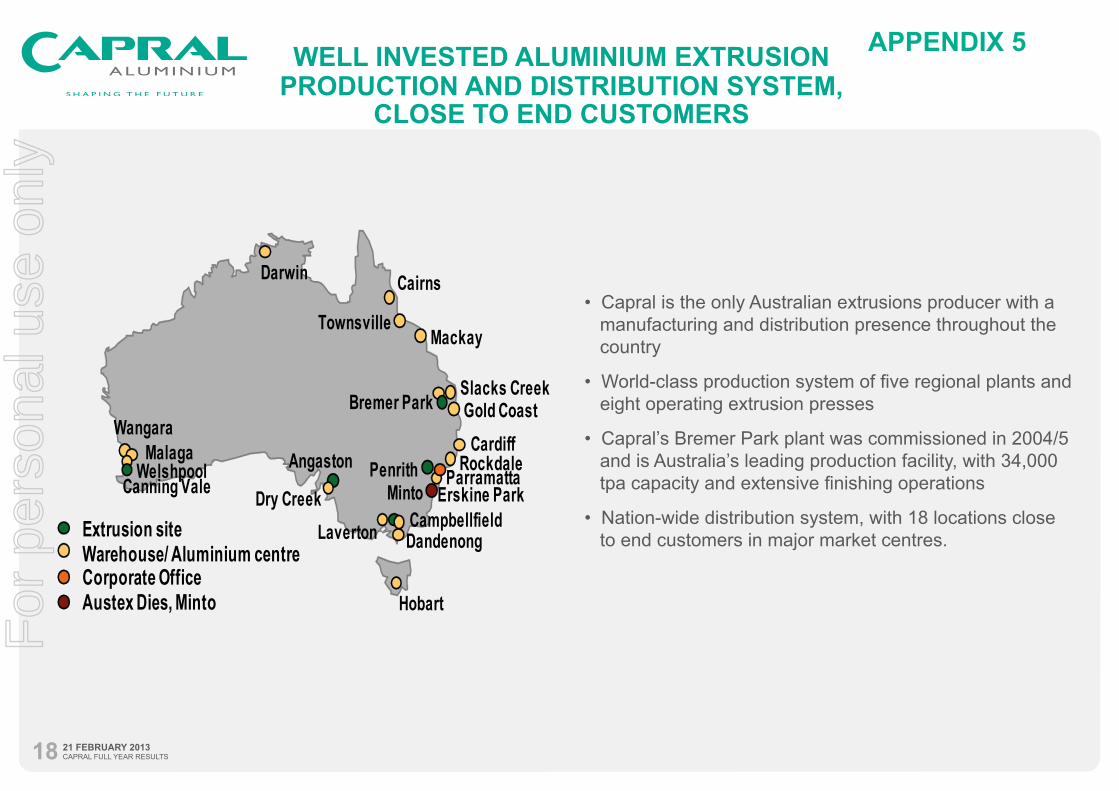
Extrusion siteWarehouse/ Aluminium centreCorporate OfficeAustex Dies, Minto
MalagaWangara
WelshpoolCanning Vale
Angaston
Dry CreekLaverton Campbellfield
Dandenong
Hobart
MintoPenrith
Erskine ParkParramatta
RockdaleCardiff
Bremer Park Gold CoastSlacks Creek
Mackay
Cairns
Townsville
Darwin
APPENDIX 5WELL INVESTED ALUMINIUM EXTRUSION PRODUCTION AND DISTRIBUTION SYSTEM,
CLOSE TO END CUSTOMERS
•CapralistheonlyAustralianextrusionsproducerwitha manufacturing and distribution presence throughout the country
•World-classproductionsystemoffiveregionalplantsand eight operating extrusion presses
•Capral’s Bremer Park plant was commissioned in 2004/5 and is Australia’s leading production facility, with 34,000 tpacapacityandextensivefinishingoperations
•Nation-wide distribution system, with 18 locations close to end customers in major market centres.
For
per
sona
l use
onl
y