for the lca of electric vehicles - elcar-project.eu
TRANSCRIPT
Guidelines for the LCA
of electric vehicles


Guidelines for the LCA of electric vehicles
Authors: Andrea Del Duce (Empa), Patricia Egede (TUBS), Gerlind Öhlschläger (TUBS), Tina Dettmer (TUBS), Hans-Jörg Althaus (Empa), Thomas Bütler (Empa), Eva Szczechowicz (RWTH)
Date: 2013/01/31
Deliverable: D2.1 Guidebook for LCA studies in the context of e-mobility
Project acronym: eLCArProject full title: "E-Mobility Life Cycle Assessment Recommendations"Project Number: 285571Project duration: 13 months, 01.02.2012 – 28.02.2013Project coordinator: Sebastian Winter (RWTH)Scientifi c coordinator: Hans-Jörg Althaus (Empa)
Call (part) identifi er: FP7-2011-GC-ELECTROCHEMICAL-STORAGETheme: [GC.ENV.2011.3.1.3-2], [Operational guidance for Life Cycle Assessment studies of the European Green Cars Initiative]Funding scheme: Coordination and support action
Key words: eLCAr, European Green Cars Initiative, LCA, Life Cycle Assessment, e-mobility, Ecological Assessment, Supporting Action, Guidelines, electric vehicles, EV, training materials, dissemination materials
The research leading to these results has received funding from the European Union Seventh Framework Programme
(FP7/2007-2013).

Contents
List of figures III List of tables III List of provisions IV Abbreviation V
1 Introduction 1 1.1 Overview 1 1.2 ILCD framework and compliance statement 2 1.3 Acknowledgment 3
2 Key definitions 4
3 Brief introduction to LCA (ILCD) 8 3.1 Goal definition 9 3.2 Scope definition 9 3.3 Inventory analysis 10 3.4 Impact assessment 11 3.5 Interpretation 12 3.6 Iterative approach 13
4 Technological context 14 4.1 Introduction 14 4.2 BEVs and serial PHEVs 15 4.2.1 The interdependency matrix 16 4.2.2 Common parameter platform (CPP): Transport parameters,
vehicle types and modules 19
5 Goal definition 24 5.1 Intended application 24 5.2 Method, assumption and impact limitations 24 5.3 Reasons for carrying out the study and decision-context 25 5.4 Target audience 28 5.5 Comparisons to be disclosed to the public 28 5.6 Commissioner of the study and other influential factors 28 5.7 Component vs. vehicle system analysis and definition
of foreground and background system 28 5.8 Goal definition example 31
6 Scope definition 33 6.1 Introduction 33 6.1.1 Consistency and reproducibility 33 6.2 Function, Functional Unit and reference flow 34 6.2.1 Functional Units for e-mobility applications 34
Guidelines for the LCA of electric vehicles I
6.3 Life Cycle Inventory modelling framework 39 6.3.1 General Life Cycle Model 39 6.3.2 Multifunctionality 40 6.3.3 Comparative studies 43 6.4 System boundaries 44 6.4.1 Derivation of system boundaries for e-mobility applications
and cut-off criteria 45 6.5 Preparing the basis for the impact assessment 47 6.6 Technological, Geographical and Time-related scope
and data representativeness. 51 6.7 Comparison between systems 53 6.7.1 Functional unit, considered alternatives and assumptions 53 6.7.2 Methodological and data consistency 54 6.7.3 Scenarios in support of comparisons 55 6.8 Identifying critical review needs 56 6.9 Planning reporting 57 6.10 Scope definition example 59
7 Life cycle inventory analysis 61 7.1 Identifying processes within the system boundary and data collection 62 7.1.1 The Production Phase 62 7.1.2 Use Phase 73 7.1.3 End-of-Life Phase 106 7.2 Filling data gaps and future technologies 113 7.2.1 Filling data gaps of established technologies 113 7.2.2 Modelling future technologies 115 7.3 Solving multifunctionality 116 7.4 Modelling the entire system 119 7.5 Calculating LCI results 120
8 Life Cycle Impact Assessment (ILCD 2010) 121
9 Life Cycle Interpretation 124
10 Reporting 132 10.1 Introduction and overview (10.1 in ILCD 2010) 132 10.2 Reporting principles (10.2 in ILCD 2010) 133 10.3 Three levels of reporting requirements and reporting elements 134 11 Critical Review (ILCD 2010) 141
12 References 143
13 Annex 145
Guidelines for the LCA of electric vehiclesII

List of figures
Figure 1: Framework of LCA 8Figure 2: Iterative approach in LCA. 13Figure 3: Main building block of BEVs and serial PHEVs. 15Figure 4: Multifunctional process 40Figure 5: Various methods for solving multifunctionality: (a) subdivision
(including virtual subdivision), (b) system expansion and substitution, (c) allocation. Based on ILCD 2010 41
Figure 6: System boundaries for the LCA of an electric vehicle. 45Figure 7: LCIA framework within the ILCD (ILCD 2010). 48Figure 8: Main process in vehicle production. 62Figure 9: Assembly of vehicle out of its components. 63Figure 10: Processes within component production 64Figure 11: Main elements in the use phase of a BEV. 73Figure 12: Drivetrain consumption contribution. 77Figure 13: Example of consumption calculation. 95Figure 14: Comparison of the EU-27 electricity mix with Germany’s specific electricity mix
(Source: ELCD database, data set from 2002) 96Figure 15: Main processes of the end-of-life phase 106Figure 16: Example of options of a traction battery recycling 109Figure 17: Example of a decision tree for EoL options of an electric motor
with a permanent magnet 111Figure 18: System expansion and substitution using the example of scrap metal. 118
List of tables
Table 1: Interdependency Matrix 16Table 2: Use of the Interdependency Matrix 18Table 3: General vehicle parameters. 20Table 4: Weight decomposition of the glider. 21Table 5: Weight distribution of the electric drivetrain. 23Table 6: Influence of various factors on vehicle energy sub-consumptions.
Values in ‘total’ refer to the variation of total consumption due to a variation of the influencing factor within a reasonable range for a best case and worst case vehicle 75
Table 7: Duration, distance and average speed of various drive cycles and their parts. The basic consumptions relative to the basic consumption in the NEDC are to be understood as approximate values valid for the same vehicle. 76
Table 8: Different categories for charging installations (Source: G4V, www.g4v.eu) 100Table 9: Interdependency Matrix. Numbers explained in the legend. 145
Guidelines for the LCA of electric vehicles III

List of provisions
5 Goal definition 306 Scope definition -6.1.1 Consistency and reproducibility 346.2.1 Functional units for e-mobility applications 386.3 Life Cycle Inventory modelling framework (summary of Provisions 6.5.4
of the general ILCD Handbook) 436.4.1 Derivation of system boundaries for e-mobility applications and cut-off criteria 466.5 Preparing the basis for the impact assessment 496.6 Technological, Geographical and Time-related scope
and data representativeness. 526.7 Comparisons between systems 556.8 Identifying critical review needs 566.9 Planning and reporting 587 Life Cycle Inventory Analysis -7.1.1.1 Process identification in the production phase 657.1.1.3 Planning data collection 687.1.1.4 Data collection 697.1.2.1.1 Consumption calculation methods 927.1.2.1.2 and 7.1.2.1.3 Recommendations on electricity mixes and distribution network 1027.1.2.1 Processes within the system boundary and data collection: the use phase 1057.1.3.1 Identifying processes within the system boundary of the end-of-life phase 1077.1.3.4 Overview: LCI recommendations for EoL of batteries 1097.1.3.5 Overview: LCI recommendations for EoL of electric motors 1117.1.3.6 Overview: LCI recommendations for EoL of electronics 1127.1.3.7 Overview: LCI recommendations for EoL of tyres and wheels 1127.1.3.8 Overview: LCI recommendations for EoL of residual car body 1137.2 Filling data gaps and future technologies 1167.3 Solving multifunctionality 1187.4 Modelling the entire system 1197.5 Calculating LCI results 1208 Life Cycle Impact Assessment (ILCD 2010) 1229 Life Cycle Interpretation -9.2 Identification of significant issues 1259.3.2 Completeness Check 1259.3.3 Sensitivity Check (of accuracy and precision) 1289.3.4 Consistency Check 1299.4 Conclusions, limitations and recommendations 13010 Reporting -10.2 Reporting principles 13310.3 Three levels of reporting requirements and reporting elements 13611 Critical Review 142
Guidelines for the LCA of electric vehiclesIV

Abbreviations
Guidelines for the LCA of electric vehicles V
AC Alternating CurrentBEV Battery Electric VehicleBMS Battery Management SystemCADC Common Artemis Driving CycleCO2 Carbon DioxideCPP Common Parameter PlatformDC Direct CurrentEGCI European Green Cars InitiativeeLCAr E-Mobility Life Cycle Assessment RecommendationsELCD European Reference Life Cycle DatabaseEmpa Eidgenössische Materialprüfungs- und ForschungsanstaltEoL End-of-LifeEU European UnionEV Electric VehicleICE Internal Combustion EngineICEV Internal Combustion Engine Vehicleifu Institut für Umweltinformatik Hamburg GmbH (ifu hamburg)ILCD International Reference Life Cycle Data SystemISO International Organization for StandardizationLCA Life Cycle AssessmentLCI Life Cycle Inventory AnalysisLCIA Life Cycle Impact AssessmentNEDC New European Driving CyclePHEV Plug-in Hybrid Electric VehicleRE Renewable EnergyREEV Range-Extended Electric VehicleRES Renewable Energy SourcesRWTH Rheinisch-Westfälische Technische Hochschule Aachen (RWTH Aachen University)SBSS Steering, Braking and Suspension SystemTUBS Technische Universität BraunschweigUCTE Union for the Coordination of the Transmission of ElectricityV2G Vehicle-to-GridWLTC Worldwide Harmonized Light Duty Test Cycleyr. year


Guidelines for the LCA of electric vehicles 1
1 Introduction
1.1 Overview
This document provides guidelines for the Life Cycle Assessment (LCA) of electric vehicles and builds on the framework established by the International Reference Life Cycle Data Sys-tem (ILCD). It was developed within the E-Mobility Life Cycle Assessment Recommendations ( eLCAr) project with two main aims: First, to support LCA practitioners in the European Green Cars Initiative (EGCI) who need to assess the potential environmental benefits of the technolo-gies developed through this program. Second, to create a common framework concerning methodological choices and assumptions for LCAs of electric vehicles that will ultimately en-hance the comparability of studies performed within the EGCI and, therefore, maximize the information on the potential benefits that may be obtained through the various projects of this initiative.
To achieve this, the general guidance provided by the ILCD Handbook was adapted to the spe-cific case of electric vehicles with a particular focus on battery electric vehicles (BEVs), where ‘vehicle’, in this case, means ‘passenger car’. A major task was to develop tailored recommenda-tions for goal definition, scope definition and life cycle inventory (LCI) analysis. Here, particular attention has been dedicated to the guidelines for defining the most convenient system for a given problem, to suitable functional units, and to the key processes that should be included in the LCA of electric vehicles and their components. With respect to LCI analysis, the recommen-dations have been split according to the production, use, and end-of-life phases, since each of these phases is characterized by particular challenges. Moreover, guidelines for key issues concerning the modelling of LCI data and for comparison of different technologies have been given, including for the challenges of comparing established and future technologies. This is a key topic for the EGCI as some projects propose new technological alternatives that might substitute current products, but are not currently produced through an industrial process. Fi-nally, in order to define the technological context of the guidelines, an introductory chapter on BEV technology was compiled that describes the main modules of an electric vehicle and highlights the potential interactions between different parts of the vehicle.
As described above, these guidelines have been developed as a support for LCA practitioners in the field of electric vehicles. Direct interaction with potential users of this document has been sought throughout its preparation. During the first consultation workshop, the needs of the stakeholders were collected and discussed. The first draft of the guidelines was pre-sented in a second workshop where stakeholders could comment and leave feedback on the proposed version. The complete version of the guidelines was then discussed in a third, final workshop in which a last round of feedback was collected.
Overall, the final aim was to create a relatively compact document that would not require an in-depth knowledge of the general ILCD Handbook. Nevertheless, some references to self-contained parts of the ILCD Handbook that could not be made more specific for the case of electric vehicles, but needed to be mentioned, have been used. The reader should therefore

Guidelines for the LCA of electric vehicles2
have access to a copy of the original handbook which is available on the website of the Life Cycle Thinking and Assessment platform:
http://lct.jrc.ec.europa.eu/assessment/publications
Learning materials and more project information are available on the eLCAr website:
http://www.elcar-project.eu/
Additional to the eLCAr guideline and the specific learning materials, the eLCAr website con-tains two deliverables presenting the results of sensitivity analysis of parameters variations for specific use cases influencing the LCA results. The results allow a first classification of the influ-ence parameters regarding their importance. The deliverables are “D3.1 – Analysis of exem-plary LCA use cases”1 and “D3.2 - Methodological and legal implications of revised guidelines”2.
The guidelines prepared in the eLCAr project are developed with the clear aim of supporting practitioners from the EGCI. Their use for any other study is always on the user’s discretion.
1.2 ILCD framework and compliance statement
The ISO 14040 and 14044 standards provide an indispensable framework for Life Cycle Assess-ment. However, it leaves the individual practitioner with a range of choices, which can affect the legitimacy of the findings presented in an LCA. While flexibility is essential in responding to the large variety of questions addressed, further guidance is needed to support consistency and quality assurance. The International Reference Life Cycle Data System has therefore been developed to provide guidance toward consistent and quality assured Life Cycle Assessment data and studies. The ILCD Handbook itself serves as a parent document for developing sector and product-group specific guidance documents like these eLCAr guidelines. This document has been developed with the intention of being in line with (i.e. not contradicting) ISO 14040 and 14044:2006. This is to ensure that ILCD and eLCAr compliant studies will also conform to ISO 14040 and 14044:2006 (but not vice versa, as these documents are more specific). If conformity to ISO 14040 and 14044:2006 is sought for an LCI or LCA, it is nevertheless recom-mended to have compliance confirmed as part of a critical review. To ease identification, the provisions in this document marked [ISO!] are stricter than ISO 14040 and 14044:2006. Where additional provisions are made that are not explicitly addressed in ISO 14040 and 14044:2006, the provision is marked [ISO+]. These marks serve for orientation only, since for some provi-sions it is a matter of interpretation whether they are a stricter or an additional requirement, or whether they are already implicitly covered in the ISO standards. Also, some provisions com-bine one aspect that is in addition with another aspect that is stricter.
The aim of the eLCAr guidelines is to provide a framework with which a practitioner can realise an LCA that is compliant with the ILCD framework. This means the provisions and explanations
1 ELCAr Website: http://www.elcar-project.eu/uploads/media/D3.1_Analysis_of_exemplary_use_cases_update.pdf2 ELCAr Website: http://www.elcar-project.eu/uploads/media/D3.2_Guideline_Implications.pdf
Guidelines for the LCA of electric vehicles 3
given are in line with those of the ILCD Handbook with respect to five aspects: data quality, method, nomenclature, review and documentation.
�� Data qualityData quality refers to completeness; representativeness (technological, geographical and tem-poral); and the precision, uncertainty, methodological appropriateness and consistency of the data.�� Method
Method refers to the appropriateness of LCI modelling and other methodologies; and to the consistency of their use.
�� NomenclatureNomenclature refers to the correctness and consistency of nomenclature (appropriate naming of flows and processes, consistent use of reference ILCD elementary flows, use of units, etc.); and to terminology (use of technical terms).
�� ReviewReview refers to the appropriateness and correctness of the review type, review methods, and documentation. This includes ensuring that the methods used to carry out the LCA are con-sistent with this guidance document and are scientifically and technically valid. The data used must be appropriate and reasonable in relation to the goal of the study, and interpretations must reflect identified limitations and the goal of the study. The study report must also be transparent and consistent.
�� DocumentationDocumentation refers to several topics: documentation extent (appropriate coverage of what is being reported); form of documentation (selection of applicable forms of reporting and doc-umentation); documentation format (selection and correct use of the data set format or report template, and review documentation requirements).
If all applicable provisions are implemented, an LCA conducted using this guide will be ILCD compliant.
1.3 Acknowledgment
This work was funded by the European Commission through the Seventh Framework Pro-gramme (FP7). We thank the other colleagues of the eLCAr project, Sebastian Winter (RWTH), Mieke Klein (ifu), Marten Stock (ifu), Martin Ramacher (ifu) and Martina Prox (ifu), for valuable support.

Guidelines for the LCA of electric vehicles4
2 Key definitions
Allocation 'Partitioning the input or output flows of a process or a product system between the product system under study and one or more other product systems.' (ISO 14044, 2006)
Battery electric vehicles (BEV)
Vehicle in which motion is caused by an electric motor and the en-ergy used for moving the vehicle is stored in a battery
Body/Chassis Parts responsible for the structure of the vehicle; framework on which all the other modules are mounted.
City cars Small vehicles typically meant for 2-4 people with little luggage space and mainly designed for urban use.
Cockpit Internal parts of the vehicle comprising seats, belts, interiors, steer-ing wheel, etc.
Compact cars Vehicles for 4 to 5 people with moderate luggage space.
Comparative life cycle assessment
'Comparison of LCA results for different products, systems or services that usually perform the same or similar function. This includes “com-parative assertions” according to ISO 14’044 as well as simple compari-sons without an explicit claim regarding superiority or equivalence of one product versus another.' (ILCD, 2010)
CPP Common Parameter Platform. A framework of technical vehicle pa-rameters that practitioners may use for defining their systems. The CPP is part of these guidelines.
Drivetrain (of BEV)
5 main building blocks: transmission, electric motor, power elec-tronics, battery and charger. The tyres and wheels are not considered to be part of the drivetrain here as these are common to all vehicle technologies (e.g. electric, ICE). The drivetrain, then, brings together only those components which are key to the specific technology.
Elementary flow 'Material or energy entering the system being studied that has been drawn from the environment without previous human transforma-tion, or material or energy leaving the system being studied that is released into the environment without subsequent human transfor-mation.' (ISO 14044, 2006)
Energy density of battery
Within these guidelines, this parameter will be considered as ener-gy per kg of battery (kWh/kg), including packaging and the battery management system.

Guidelines for the LCA of electric vehicles 5
Foreground/ Background sys-tems
Foreground system: The main object of the analysis. E.g. in the LCA of an electric vehicle, all processes directly involved in the produc-tion, use, and end-of-life of the vehicle, such as the manufacturing of its components.Background system: All the processes required to realize the proc-esses used in the foreground. E.g. in the LCA of an electric vehicle, the production of raw materials used in the production of the vehi-cle or the generation of the electricity used during operation of the vehicle. These processes would typically belong to the background system.For example, in the LCA of an electric vehicle with a newly designed lightweight chassis, the specific production process of the light-weight chassis would belong to the foreground system while the generation of the electricity used by the lightweight chassis factory or laboratory (typically obtained from some external supplier and not specifically produced within the factory) would be considered a background process.
Functional unit 'Quantified performance of a product system for use as a reference unit.' (ISO 14044, 2006)
Glider The part of a vehicle that is mostly independent of the drivetrain technology. A glider includes, for example, the body or chassis, wheels and tyres, cockpit, non-propulsion electrical system, and the steering, brakes and suspension system.
Hybrid vehicles / Hybrids
Vehicles in which an electric motor supplies at least part of the pro-pulsion while at least part of the energy to propel the vehicle and/or to drive the electric motor is supplied by an internal combustion engine.
Impact category 'Class representing environmental issues of concern to which life cycle inventory analysis results may be assigned.' (ISO 14044, 2006)
International Ref-erence Life Cycle Data System (ILCD)
The ISO 14040 and 14044 standards provide an indispensable frame-work for Life Cycle Assessment (LCA). This framework, however, leaves the individual practitioner with a range of choices, which can strongly affect the final results in an assessment. While flexibility is essential in responding to the large variety of questions addressed, further guidance is needed to support consistency and quality assur-ance. The International Reference Life Cycle Data System has there-fore been developed to provide guidance for consistent and quality assured Life Cycle Assessment data and studies. The ILCD consists primarily of the ILCD Handbook and the ILCD Data Network. The development of the ILCD was initiated by the European Com-mission and has been carried out through a broad international consultation process with experts, stakeholders, and the public.
Guidelines for the LCA of electric vehicles6
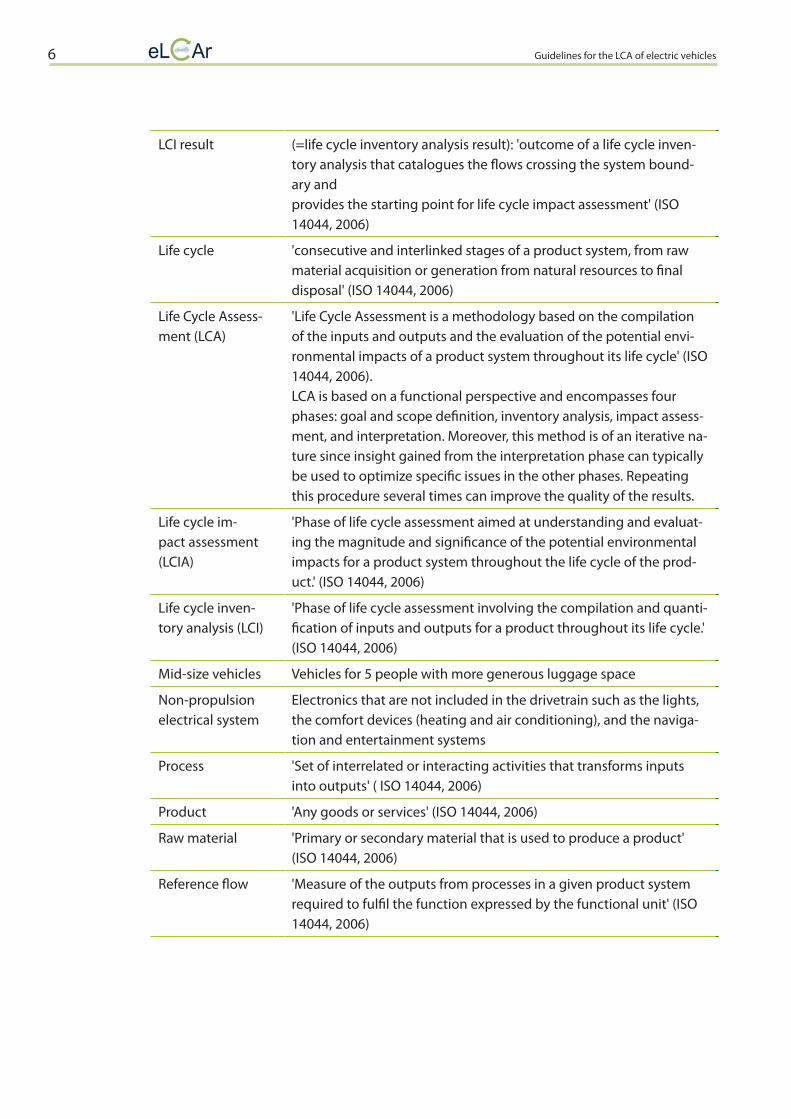
LCI result (=life cycle inventory analysis result): 'outcome of a life cycle inven-tory analysis that catalogues the flows crossing the system bound-ary andprovides the starting point for life cycle impact assessment' (ISO 14044, 2006)
Life cycle 'consecutive and interlinked stages of a product system, from raw material acquisition or generation from natural resources to final disposal' (ISO 14044, 2006)
Life Cycle Assess-ment (LCA)
'Life Cycle Assessment is a methodology based on the compilation of the inputs and outputs and the evaluation of the potential envi-ronmental impacts of a product system throughout its life cycle' (ISO 14044, 2006). LCA is based on a functional perspective and encompasses four phases: goal and scope definition, inventory analysis, impact assess-ment, and interpretation. Moreover, this method is of an iterative na-ture since insight gained from the interpretation phase can typically be used to optimize specific issues in the other phases. Repeating this procedure several times can improve the quality of the results.
Life cycle im-pact assessment (LCIA)
'Phase of life cycle assessment aimed at understanding and evaluat-ing the magnitude and significance of the potential environmental impacts for a product system throughout the life cycle of the prod-uct.' (ISO 14044, 2006)
Life cycle inven-tory analysis (LCI)
'Phase of life cycle assessment involving the compilation and quanti-fication of inputs and outputs for a product throughout its life cycle.' (ISO 14044, 2006)
Mid-size vehicles Vehicles for 5 people with more generous luggage space
Non-propulsion electrical system
Electronics that are not included in the drivetrain such as the lights, the comfort devices (heating and air conditioning), and the naviga-tion and entertainment systems
Process 'Set of interrelated or interacting activities that transforms inputs into outputs' ( ISO 14044, 2006)
Product 'Any goods or services' (ISO 14044, 2006)
Raw material 'Primary or secondary material that is used to produce a product' (ISO 14044, 2006)
Reference flow 'Measure of the outputs from processes in a given product system required to fulfil the function expressed by the functional unit' (ISO 14044, 2006)

Guidelines for the LCA of electric vehicles 7
Renewable en-ergy
Any energy resource that is virtually inexhaustible, naturally regener-ated over a short time scale and derived directly from the sun (such as thermal, photochemical, and photoelectric), indirectly from the sun (such as wind, natural hydropower (i.e. not from pumped storage), and photosynthetic energy stored in renewable biomass), or from other natural movements and mechanisms of the environment (such as geothermal and tidal energy). Renewable energy does not include energy resources derived from fossil fuels, waste products from fossil sources, or waste products from inorganic sources.
Serial Plug-in hybrid electric vehicles (serial PHEV)
BEVs with an on board range extender - i.e. a device to recharge the propulsion battery by converting a liquid or gaseous fuel into elec-tricity. In this document only serial PHEVs based on internal combus-tion engines will be considered.Attention: This definition is narrower than general definitions for PEHVs which include all hybrid vehicles with a battery that can be charged from an external electricity supply.
Substitution Solving multifunctionality of processes and products by expanding the system boundaries and substituting all not required functions with alternatives, i.e. with process(es) or product(s) that supersede the not required functions. Effectively, the life cycle inventory(ies) of the superseded process(es) or product(s) is subtracted from that of the analysed system, i.e. the system is 'credited'. Substitution is a spe-cial (subtractive) case of applying the system expansion principle.
System 'Any good, service, event, basket-of-products, average consumption of a citizen, or similar object that is analysed in the context of the LCA study.Note that ISO 14044, 2006 generally refers to "product system", while broader systems than single products can be analysed in an LCA study; hence here the term "system" is used. In many but not all cas-es the term will hence refer to products, depending on the specific study object.Moreover, as LCI studies can be restricted to a single unit process as part of a system, in this document the study object is also identified in a general way as "process / system".' (ILCD, 2010)
System boundary Set of criteria defining which processes are parts of the system ana-lysed in the LCA.
System expan-sion
Expanding the system boundary by adding specific processes or products and the related life cycle inventories to the analysed sys-tem. Used to make systems with only partly equivalent functionali-ties comparable within LCA. (based on ILCD, 2010)
Unit process 'Smallest element considered in the life cycle inventory analysis for which input and output data are quantified' (ISO 14044, 2006)

Guidelines for the LCA of electric vehicles8
3 Brief introduction to LCA (ILCD)
Life Cycle Assessment is a structured, comprehensive and internationally standardised meth-od. It quantifi es all relevant emissions and resources consumed and the related environmental and health impacts and resource depletion issues that are associated with any goods or ser-vices (“products”).
Life Cycle Assessment takes into account a product’s full life cycle: from the extraction of re-sources, through production, use, and recycling, up to the disposal of remaining waste. Criti-cally, LCA studies thereby help to avoid resolving one environmental problem while creating others: This unwanted “shifting of burdens” is where you reduce the environmental impact at one point in the life cycle, only to increase it at another point. Therefore, LCA helps to avoid, for example, causing waste-related issues while improving production technologies, increasing land use or acid rain while reducing greenhouse gases, or increasing emissions in one country while reducing them in another.
Life Cycle Assessment is therefore a vital and powerful decision support tool, complementing other methods, which are equally necessary to help eff ectively and effi ciently make consump-tion and production more sustainable.
The ISO 14040 and 14044 standards provide the indispensable framework for Life Cycle As-sessment, as summarised in the following fi gure. Its individual steps and iterative approach are briefl y introduced in the following paragraphs.
Figure 1: Framework of LCA
Direct applications:
� Product development and improvement
� Stratecic planning � Public policy making � Marketing � Other
Goal defi nition
Scope defi nition
Inventoryanalysis
Impact assessment
Interpretation
LIFE CYCLE ASSESSMENT FRAMEWORK

Guidelines for the LCA of electric vehicles 9
This framework, however, leaves the individual practitioner with a range of choices, which can affect the legitimacy of the results of an LCA study. While flexibility is essential in responding to the large variety of questions addressed, further guidance is needed to support consistency and quality assurance.
Since LCA addresses the entire life cycle of a product, it is necessary to consider a very large number of processes, from the production of specific sub-components in the product of inter-est, to the disposal of waste flows obtained from the extraction of the raw materials required somewhere in the life cycle. For this reason, a key distinction in the realization of an LCA is the one between foreground and background systems. The foreground system focuses on the ob-ject of interest and covers questions such as which materials (and how much of these) are re-quired for its production, or which fabrication machinery is required. The background system addresses the description of all the services and products that are needed for the realization of the foreground system including, for example, the production of the materials that are then used in the manufacturing of the product of interest. This distinction is very important since, as will be described in more detail in this document, foreground and background systems are treated differently during the development of the LCA.
3.1 Goal definition
Goal definition is the first phase of any life cycle assessment, independent of whether the LCI and LCA are limited to the development of a single unit process data set to be used in a complete LCA, or if a complete LCA of a comparative assertion is to be published. During goal definition, among other considerations, the decision-context(s), intended application(s) of the study, and the targeted audience(s) are identified. Goal definition is decisive for all other phases of the LCA:
�� Goal definition guides all aspects of scope definition, which in turn sets the framework for the LCI and LCIA work.
�� Quality control is applied in view of the requirements derived from the goal of the work. �� If the work goes beyond an LCI, the final results of the LCA are evaluated and interpreted.
This, also, is to be done in close relationship to the goal of the work.
A clear, initial goal definition is therefore essential for a correct later interpretation of the re-sults. This includes ensuring, as far as possible, that the deliverables of the LCI/LCA cannot unintentionally and erroneously be used or interpreted beyond the initial goal and scope for which it was carried out.
3.2 Scope definition
During the scope definition phase, the object of the LCI/LCA (i.e. the exact product(s) or other system(s) to be analysed) is identified and defined in detail. This shall be done in line with the goal definition. Next, and the main part of scope definition, is to determine the requirements for methodology, quality, reporting, and review in accordance with the goal of the study, i.e.

Guidelines for the LCA of electric vehicles10
based on the reasons for the study, the decision-context, the intended applications, and the addressees of the results.
When deriving the scope of an LCI/LCA from the goal, the following scope items shall be clear-ly described and/or defined:
�� The type(s) of deliverable(s) of the LCI/LCA, in line with the intend application(s) �� The system or process to be studied and its function(s), functional unit, and reference
flow(s)�� LCI modelling framework and handling of multifunctional processes and products�� System boundaries, completeness requirements, and related cut-off rules �� LCIA impact categories to be covered and selection of specific LCIA methods to be ap-
plied, as well as - if included - normalisation data and weighting set �� Other LCI data quality requirements regarding technological, geographical and temporal
representativeness and appropriateness �� Types, quality and sources of required data and information, and here especially, the re-
quired precision and maximum permitted uncertainties�� Special requirements for comparisons between systems �� Identifying critical review needs �� Planning the reporting of results
3.3 Inventory analysis
During the life cycle inventory phase, the actual data collection and modelling of the system (e.g. product) is to be done. While the specific data to be collected and its modelling is strongly influenced by the goal and scope of the study, the aim is generally to collect information that will allow the depiction of the average behaviour of the system of interest, including normal operation, abnormal operation, start and stop procedures, etc., and not only the constant and nominal functioning. The findings of an LCI analysis then become the input for the subsequent LCIA phase and also provide feedback to the scope phase as initial scope settings often need adjustments. Typically, the LCI phase requires the greatest efforts and resources in an LCA: for data collection, acquisition, and modelling.
The first steps of the LCI further clarify details and concretize the requirements derived dur-ing the scope phase, e.g. specific data sources to be used and planning data collection. The requirements themselves, however, are always to be understood to be a scope issue.
The inventory phase involves the collection of the required data for:
�� Flows to and from processes: �� Elementary flows (such as resources and emissions, but also other interactions with
the ecosphere such as land use), �� Product flows (i.e. goods and services both as products of a process and as inputs and
consumables) that link the analysed process with other processes, and �� Waste flows (both wastewater, and solid and liquid wastes) that need to be linked to
waste management processes so a complete modelling of related efforts and envi-ronmental impacts is ensured.

Guidelines for the LCA of electric vehicles 11
�� Other information identified in the scope definition as relevant to the analysed system. This includes statistical data (e.g. market mix data), process and product characteristics (e.g. functions and functional units), and all other data and information, except for that which is directly related to impact assessment.
The specific type of life cycle inventory work depends on the study’s deliverable; not all of the following steps are always required. In its entirety, life cycle inventory work means:
�� Identifying the processes that are required for the system, �� Planning the collection of raw data and information, and of data sets from secondary
sources, �� Collecting unit process inventory data (typically) for the foreground system related to
these processes. An important aspect is the interim quality control and how to deal with missing inventory data
�� Obtaining complementary background data in the form of unit process or LCI result data sets from data providers
�� Developing proxy LCI data for processes in the background system for which average or specific data is not available and cannot be developed, typically due to restrictions in data access or budget
�� Modelling the system by connecting and scaling the data sets correctly, so that the sys-tem is providing its functional unit.
�� This modelling includes solving multifunctionality of processes in the system.�� Calculating LCI results, i.e. summing up all inputs and outputs of all processes within the
system boundaries. Only flows crossing the system boundaries remain in the inventory. In a fully modelled system, these are only the reference flow (final product) and the elemen-tary flows (exchanges to and from nature).
These steps are taken using an iterative procedure, as explained in chapter 3.6 and illustrated in Figure 1.
3.4 Impact assessment
Life cycle impact assessment (LCIA) is the phase in an LCA where the inputs and outputs of el-ementary flows that have been collected and reported in the inventory are translated into im-pact indicator results usually related to human health, the natural environment, and resource depletion.
It is important to note that LCA and impact assessment analyse the potential environmental im-pacts caused by interactions that cross the border between technosphere and ecosphere, and act on the natural environment and humans. The results in an LCIA should be seen as environ-mentally relevant indicators of potential impact, rather than predictions of actual environmen-tal effects. LCA and LCIA are equally distinct from risk based, substance specific instruments.
An LCIA is composed of mandatory and optional steps. It is based on classification and char-acterisation of the individual elementary flows, which are usually done by LCIA experts who provide complete sets of LCIA methods for use by LCA practitioners (see separate guidance
Guidelines for the LCA of electric vehicles12
document ‘Framework and requirements for Life Cycle Impact Assessment models and indica-tors’ available from the ILCD website http://lct.jrc.ec.europa.eu/assessment/publications). The results in an LCIA are calculated by multiplying the individual inventory data from the LCI with the characterisation factors.
In a subsequent, optional step, the LCIA results can be multiplied using normalisation factors that represent the overall inventory of a reference system (e.g. a whole country or an aver-age citizen), thus obtaining dimensionless, normalised, LCIA results. In a second optional step, these normalised results can be weighted according to the different relevancies that different impacts may have, thus obtaining normalised and weighted results that can be summed up in a single value, overall-impact indicator. Note that weighting always involves value choices and therefore cannot possibly be objective.
3.5 Interpretation
In life cycle interpretation, the results found during a life cycle assessment are appraised in order to answer questions posed in the goal definition. The interpretation relates to the in-tended applications of the LCI/LCA and is used to develop recommendations. The life cycle in-terpretation is the phase of the LCA where the results found in the other phases are considered collectively and analysed in the light of the achieved accuracy, completeness and precision of the applied data and assumptions that have been made throughout the LCI/LCA. As was noted, in parallel to performing the LCI, this serves to improve the LCI model.
If aimed for (e.g. in case of a comparative study or a weak-point analysis), the final outcome of the interpretation should be conclusions or recommendations that respect the intentions and restrictions of the goal and scope definition of the LCI/LCA. This especially relates to the appropriateness of the functional unit and the system boundaries, as well as to the achieved overall data quality, in relation to the goal. The interpretation should present the results of the LCA in an understandable way and help the user of the LCI/LCA appraise the robustness of the conclusions and understand any potential limitations of the LCI/LCA.
The interpretation proceeds through three stages:
�� First, the significant issues (i.e. the key processes, parameters, assumptions and elemen-tary flows) are identified.
�� Then these issues are evaluated with regard to their sensitivity or influence on the overall results determined during the LCA. This includes an evaluation of the completeness and consistency with which the significant issues have been handled during the LCI/LCA.
�� Finally, the results of the evaluation are used to formulate conclusions and recommenda-tions based on the LCA.
In cases where the study involves comparisons of two or more systems, additional considera-tions are to be included in the interpretation.

Guidelines for the LCA of electric vehicles 13
3.6 Iterative approach
An LCI or LCA is almost always an iterative process: once the goal of the work is defi ned, the initial scope settings are derived that defi ne the requirements for the subsequent work. How-ever, as more information becomes available during the life cycle inventory phase of data col-lection and during the subsequent impact assessment and interpretation, the initial scope settings will typically need to be refi ned and sometimes also revised (see Figure 1). Figure 2 gives a more detailed overview of the iterations.
In order to achieve the required precision with the minimum necessary eff ort, it is recom-mended to collect data and select external data sources in an iterative manner. Especially for fully new technologies and complex product systems on which little previous experience ex-ists, the fi rst iteration may use generic or average data for the background and also many parts of the foreground systems. This can be combined with expert judgement to identify the key processes and elementary fl ows of the product system. The main eff ort of data collection and acquisition can thereby be focused on the relevant parts of the system.
Figure 2: Iterative approach in LCA.
Overall data quality(accuracy, precision, completeness)
Time and e� ort
LCILCIA
Goal and Scope
Evaluation
LCILCIA
Goal and Scope
Evaluation
LCILCIA
Goal and Scope
Evaluation
1st Iteration
full product system speci� c data as
available easily available
secondary data
2nd Iteration revision of scope de� nition? better data for key processes
(background and foreground) more speci� c data for
foreground processes
3rd Iteration better data for key processes and
� ows (background and foreground)

Guidelines for the LCA of electric vehicles14
4 Technological context
4.1 Introduction
The aim of this document is to provide guidelines for the LCA of electric vehicles, where ‘ve-hicle’ is to be interpreted as ‘passenger car ‘. Further, the term electric vehicle is commonly as-sociated with a broad spectrum of technologies in which an electric motor (e-motor) plays a dominant role in the propulsion system of the car. Examples of technologies associated with the concept of electric vehicles are:
�� Battery electric vehicles (BEV), in which motion is caused by an electric motor and the energy used for moving the vehicle is stored in a battery.
�� Vehicles in which an electric motor supplies at least part of the propulsion while at least part of the energy to propel the vehicle and/or to drive the electric motor is supplied by an internal combustion engine (ICE). Various configurations of hybrids exist in which the interplay between battery, electric motor and ICE varies.
�� Fuel cell vehicles, in which an electric motor is responsible for motion, as in BEVs, but the electricity used is obtained from an on board fuel cell system and a battery.
The guidelines presented here have been developed specifically for the LCA of BEVs and ad-dress all the main elements required for studies involving this technology. However, many of the recommen dations on how to address key aspects of the LCA of electric vehicles and, par-ticularly, the LCI of production and end-of-life (EoL), also hold for the majority of devices within the other technologies mentioned above. Hence, while the full LCA is really covered in detail only for BEVs, practitioners who are addressing other technologies, for which guidelines on their LCA have not been developed yet, may find some useful guidance concerning overlap-ping topics. Due to the conceptual similarities between BEVs and elec tric vehicles with range extenders, selected indications are also given for the latter technology, even though it is cur-rently not one of the most adopted solutions. We will refer to these vehicles as serial plug-in hybrid electric vehicles (PHEV), but it should be mentioned in this context that the expression ‘range-extended electric vehicle’ (REEV) is sometimes also used in other places. No support is given, however, for analysing the use phase of any of the hybrids. The vast spectrum of avail-able configurations, and the topic of tailpipe emissions, places the analysis of consumption by these classes of vehicles and the deriving of their impacts out of the scope of these guidelines. Practitioners interested in fuel cell vehicles are referred to the guidelines for LCA of fuel cells and hydrogen technologies developed within the FC-Hy Guide Project (FCHY, 20011a, 20011b) for those topics not covered by the guide lines presented here.
Below, the technological context of the vehicles covered by the guidelines is described. These subchapters are particularly meant for LCA practitioners who are involved in projects addressing specific vehicle components and who need more information on other compo-nents and on the overall vehicle system. Moreover, for practitioners focusing on a specific component, a key issue is to be able to identify whether one can limit the analysis to the single component or whether it is necessary to include other components or even consider the entire vehicle. Guidance on this topic will be given through the concept of the interde-pendency matrix.
Guidelines for the LCA of electric vehicles 15
4.2 BEVs and serial PHEVs
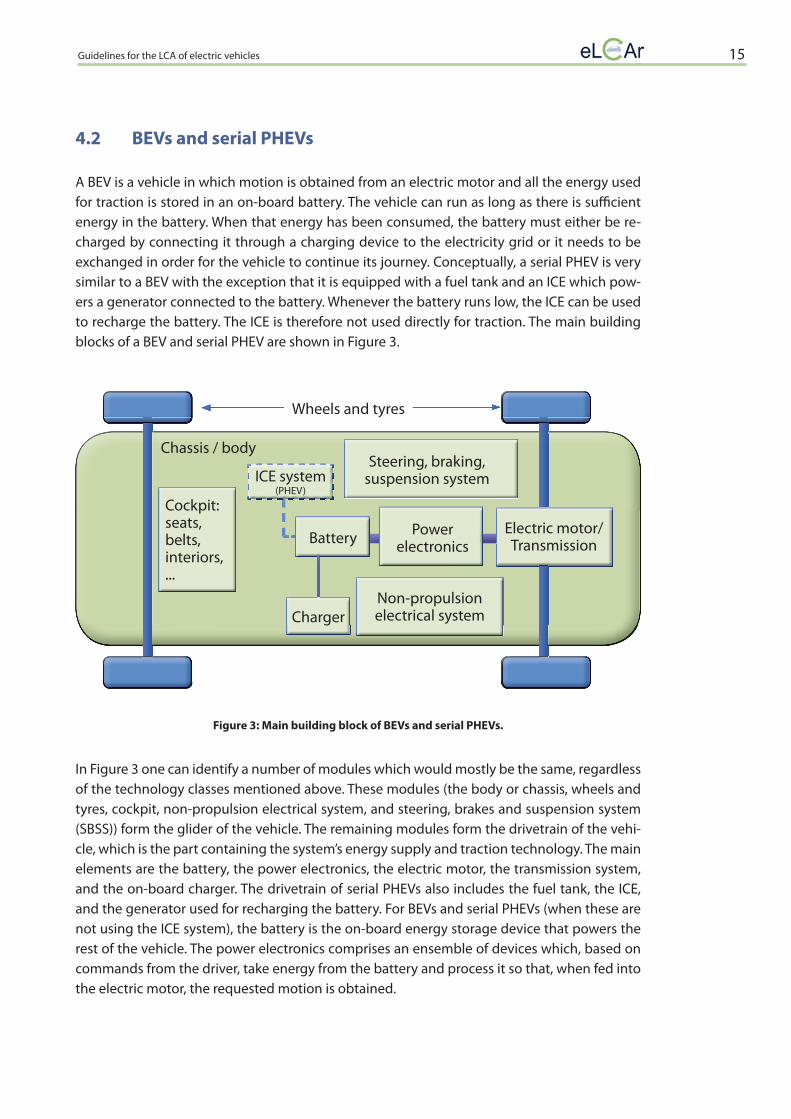
A BEV is a vehicle in which motion is obtained from an electric motor and all the energy used for traction is stored in an on-board battery. The vehicle can run as long as there is suffi cient energy in the battery. When that energy has been consumed, the battery must either be re-charged by connecting it through a charging device to the electricity grid or it needs to be exchanged in order for the vehicle to continue its journey. Conceptually, a serial PHEV is very similar to a BEV with the exception that it is equipped with a fuel tank and an ICE which pow-ers a generator connected to the battery. Whenever the battery runs low, the ICE can be used to recharge the battery. The ICE is therefore not used directly for traction. The main building blocks of a BEV and serial PHEV are shown in Figure 3.
Figure 3: Main building block of BEVs and serial PHEVs.
In Figure 3 one can identify a number of modules which would mostly be the same, regardless of the technology classes mentioned above. These modules (the body or chassis, wheels and tyres, cockpit, non-propulsion electrical system, and steering, brakes and suspension system (SBSS)) form the glider of the vehicle. The remaining modules form the drivetrain of the vehi-cle, which is the part containing the system’s energy supply and traction technology. The main elements are the battery, the power electronics, the electric motor, the transmission system, and the on-board charger. The drivetrain of serial PHEVs also includes the fuel tank, the ICE, and the generator used for recharging the battery. For BEVs and serial PHEVs (when these are not using the ICE system), the battery is the on-board energy storage device that powers the rest of the vehicle. The power electronics comprises an ensemble of devices which, based on commands from the driver, take energy from the battery and process it so that, when fed into the electric motor, the requested motion is obtained.
Steering, braking, suspension system
Power electronicsBattery
Charger
Chassis / body
Non-propulsionelectrical system
ICE system(PHEV)
Electric motor/Transmission
Cockpit:seats, belts,interiors,...
Wheels and tyres

Guidelines for the LCA of electric vehicles16
The modules shown in Figure 3 form a vehicle system. Changes in one of the modules can lead to substantial design and performance changes in other parts of the vehicle. As will be described in more detail below, when an LCA focuses on a module or component so that it might lead to such changes, the analysis cannot be limited to the single component, but must take into account other components or even the rest of the vehicle and its use-phase energy consumption, which may be influenced. To help understand when this might be the case, an interdependency matrix has been developed. Once a practitioner has identified the system he needs to model, he can use the information reported in chapter 4.2.2 ‘Common parameter plat-form (CPP): Transport parameters, vehicle types and modules’ as a guide for defining its main parameters. This should ultimately allow him to select appropriate LCI data sets from available databases or guide him in the collection of data for the realization of his own data sets.
4.2.1 The interdependency matrix
In this subchapter, the interdependency matrix is introduced as a tool to support the analysis of relevant part-system interactions (see 4.2). The matrix (see Table 1) includes information about how a component may influence other components (see corresponding column) as well as how it can be influenced itself (see corresponding row). A table cell containing a ‘1’ in-dicates a direct influence whereas ‘0’ means that there is no direct influence of the component the column represents on the component the respective row represents. Indirect effects, e.g. through an increased energy demand caused by added weight of components, are addressed separately (see 4.2.1.1). The matrix is given in detail in the annex attached to this document
Table 1: Interdependency Matrix
Components VehiCle
Char
ger
Tracti
on-B
atte
ry
Powe
r Elec
tronic
s
E-m
otor
Trans
miss
ion
SBSS
Body
(Fra
me)
Aero
dyna
mics
Insu
lation
Non-
p. El.
Syste
m
Vehic
le W
eight
Over
all En
ergy
Dem
and
(in us
e pha
se)
is/ar
e infl
uenc
ed by
…
influence(s)…
Vehi
Cle Vehicle Weight 1 1 1 1 1 1 1 0 1 1 1
Energy Demand (in use phase, NOT via weight)
1 1 1 1 1 1 0 1 1 1 1
Com
pone
nts
Charger 1 0 0 0 0 0 0 0 0 0 0
Traction-Battery 0 1 1 0 0 0 0 0 0 0 1
Power Electronics 0 1 1 0 0 0 0 0 0 0 1
E-motor 0 0 0 0 0 0 0 0 0 0 1
Transmission 0 0 0 1 0 0 0 0 0 0 1
SBSS 0 0 0 0 0 0 0 0 0 1 1
Body (Frame) 0 1 0 0 0 0 0 0 0 1 0
Aerodynamics 0 0 0 0 0 0 0 0 0 0 0
Insulation 0 0 0 0 0 0 0 0 0 0 0Non-p. El. System 0 0 0 0 0 0 0 0 1 0 0

Guidelines for the LCA of electric vehicles 17
(chapter 13) and is also available as an Excel spread sheet that can be downloaded from the eLCAr website. It provides written information about the interdependencies by moving the cursor to a table cell containing a 1. The given information for the interdependencies are based on the assumptions, that
�� Acceleration,�� Max. velocity,�� Driving distance,�� Load (additional),�� Comfort and�� Construction and type of drivetrain
remain constant for the analysed vehicle. However, the matrix is only meant to supply the LCA practitioner with a first indication of the general interrelationships. The practitioners them-selves must then check if an indicated interrelationship is relevant to their specific case and how it can be further defined. Therefore, currently on-going research in this field should be taken into account.
4.2.1.1 Overall impact on/of vehicle weight and overall energy demand
As all components have weight (except aerodynamics which is not a component in the narrow-est sense, but an important feature of the vehicle), they all more or less have an influence on the overall vehicle weight (see vehicle weight row). The overall vehicle weight, in turn, determines to a high degree the overall energy demand during the vehicle’s use phase (see the last cell in that row). Additionally, most of the components also influence the energy demand of the vehicle during use phase due to properties other than just their weight (see energy demand row). The overall energy demand, in turn, influences the dimensioning of several of the compo-nents (see overall energy demand column). Therefore, to avoid over complication, the indirect effects of increase or decrease of component weights and overall energy demand during the use phase are mentioned not in the component-component cell, but in the two extra rows on top and two extra columns on the right for vehicle weight and energy demand (in light grey).
4.2.1.2 Component-component interrelations
The general interdependencies of the technical components of a BEV (except the influences of their individual weights and energy demands) are described in the lower left part of the interdependency matrix. Most of those interrelationships appear in the context of the motor– battery– power electronics relationship and the subsequent dimensioning of the transmis-sion, and the steering, brakes, and suspension system. Interrelationships are written out in the following general style:
�� Example A (possible influence of the power electronics on the traction battery): The design of the power electronics can influence the life expectancy of the battery.
�� Example B (possible influence of the electric motor on the transmission): The speed of the e-motor may have an influence on the requirements of the transmission.
A full list of the table’s cell texts can be found in the annex to this document. Through these ex-amples, it becomes clear that the purpose of the matrix is to sensitise the practitioner to those interrelationships, but it cannot substitute for their own detailed analysis. Possible influences

Guidelines for the LCA of electric vehicles18
on driving behaviour (e.g. restriction of acceleration) are not included in the matrix, but shall also be taken into consideration if relevant to the goal and scope of the study.
4.2.1.3 How to use the interdependency matrix
An example of using the interdependency matrix is described for an LCA of the environmental impact of a modification to the traction battery (Table 2). In the corresponding column of the matrix (highlighted in yellow), the practitioner can see that the traction battery may have a direct influence on the overall vehicle weight, on energy demand during the use phase, on the charger, on the power electronics, and on the body (frame). Moving the cursor to the corresponding ‘mouse holes’ [in the downloadable spread sheet], the following texts become visible:
�� The weight of the traction battery may strongly influence the overall vehicle weight�� The charge-discharge efficiency of the battery moderately influences overall energy demand.
Stand-by losses (e.g. of high temperature batteries or Li-ion batteries using many small cells) can strongly increase energy demand in the use phase.
�� The charger must fit the traction battery.�� The voltage and the power of the traction battery may have an influence on the necessary size
and performance of the power electronics.�� The volume and form of the battery may influence the volume and form of the body (frame).
Table 2: Use of the Interdependency Matrix
The practitioner should then check if these possible interrelationships apply. In case the voltage of the modified Li-ion battery requires changes in the power electronics, the power electronics should be included in the system boundaries. The same holds for the other mentioned possible interdependencies. Additionally, the effects of a changed vehicle weight should be examined if
Components VehiCle
Char
ger
Tracti
on Ba
ttery
Powe
r Elec
tronic
s
E-m
otor
Trans
miss
ion
SBSS
Body
(Fra
me)
Aero
dyna
mics
Insu
lation
Non-
p. El.
Syste
m
Vehic
le W
eight
Over
all En
ergy
Dem
and
(in us
e pha
se)
influence(s)…
Vehi
Cle Vehicle Weight
is/ar
e infl
uenc
ed by
…
1 1 1 1 1 1 1 0 1 1 1
Energy Demand (in use phase, NOT via weight)
1 1 1 1 1 1 0 1 1 1 1
Com
pone
nts
Charger 1 0 0 0 0 0 0 0 0 0 0Traction Battery 0 1 1 0 0 0 0 0 0 0 1Power Electronics 0 1 1 0 0 0 0 0 0 0 1E-motor 0 0 0 0 0 0 0 0 0 0 1Transmission 0 0 0 1 0 0 0 0 0 0 1SBSS 0 0 0 0 0 0 0 0 0 1 1Body (Frame) 0 1 0 0 0 0 0 0 0 1 0Aerodynamics 0 0 0 0 0 0 0 0 0 0 0Insulation 0 0 0 0 0 0 0 0 0 0 0Non-p. El. System 0 0 0 0 0 0 0 0 1 0 0

Guidelines for the LCA of electric vehicles 19
the weight of the modified battery is significantly lower or higher than its predecessor. Looking at the vehicle weight column (highlighted in orange), the practitioner sees that:
�� The overall vehicle weight may strongly influence the overall energy demand during use phase.�� The vehicle weight influences the dimensions of the SBSS.�� The vehicle weight may have an influence on the necessary strength of the body (frame).
These relationships should then also be scrutinised and in case there is actually an influence due to the weight difference on the overall energy demand during the use phase, that column (highlighted in red) should be taken into account. Given there is a sufficiently high weight difference, and all those possible interrelationships apply, this would mean that the follow-ing components should be included in the system boundaries in addition to the Li-ion bat-tery: charger, power electronics, motor, transmission, SBSS, body (frame). For case studies with huge differences compared to the preceding product system, even more iterative loops in the interdependency matrix may be necessary. Furthermore it would be necessary to include the use-phase energy consumption or the difference between the systems compared.
4.2.2 Common parameter platform (CPP): Transport parameters, vehicle types and modules
In this subchapter, more technical aspects of electric vehicles are addressed. The idea is to help practitioners in dimensioning the vehicle system most appropriate to their needs in order to be able to effectively plan the LCA. A description of common parameters and factors neces-sary in the definition of a vehicle study for LCA is given below. Specific values are listed when appropriate. The values presented here, mostly taken from the literature and current technical specifications of vehicle manufacturers, are meant as indicative values. Since technology is changing fast, the practitioner shall verify and document that the given values are in accord-ance with the goal and scope of his study. Practitioners are free to use other values as long as they are shown to fit the goal and scope of the study and are well referenced.
4.2.2.1 Transport and general vehicle parameters
Passenger cars can be classified into different vehicle types. Here, we will focus on 3 classes: the micro or city car, the compact car and the mid-size3 vehicle. City cars are small vehicles typically meant for 2-4 people with little luggage space and are mainly designed for urban use. Compact cars can accommodate 4 to 5 people and have moderate luggage space, while mid-size vehicles are typically designed for 5 people plus more generous luggage space.
In an LCA of a vehicle, several general vehicle parameters are required to realize the study and for planning the LCI. Key parameters are:
�� Life expectancy of the vehicle (Application: quantification of the total burden and identi-fication of maintenance needs)
�� Total weight (Application: dimensioning of vehicle modules for the realization of the LCI and the use-phase consumption calculation). With respect to the weight of the vehicle, it is important to highlight that, following Directive 2007/46/EC, this is typically defined as the mass of the vehicle including standard equipment, the driver (75 kg), fuel (90 % filled),
3 Output of 1st eLCAr workshop (eLCAr 2012)

Guidelines for the LCA of electric vehicles20
other liquid containing systems filled to 100 %. The same definition should be applied when using these guidelines.
�� Vehicle drag coefficient, cross section and rolling resistance (Application: consumption calculations for the use phase).
A recent review of vehicle LCAs identified 150 000 km, 200 000 km, and 250 000 km as the most utilized values for vehicle life expectancy (Hawkins, 2012) while typical calendar lifespans of 10 to 13 years are often reported. The choice of life expectancy has a great influence on the total burdens caused by the life cycle of electric vehicles, especially if they are charged with electricity from environmentally sound sources, and should therefore be defined with great care. Considering currently commercially available BEVs, Table 3 shows typical values for the above mentioned parameters. The weights are based on the values presented in Grünig (2011) and include the battery.4
Micro/City Compact Mid-size
Life expectancy 150000-200000km 150000-250000km 150000-250000km
Typical weights 800-1200kg 1200-1700kg 1700-2100kg
Drag coefficient, cw2 0.31-0.35 0.25-0.31 0.25-0.31
Cross section, A 2-2.3m2 2-2.3 m2 2-2.3 m2
Rolling resistance, cr 0.01-0.015 0.01-0.015 0.01-0.015
Table 3: General vehicle parameters.
Again, it is important to note that a wide variety of vehicles exist, which means that deviations from the values given for the various classes may occur. These values (and the ones presented below) are meant as a guide for the practitioner in the definition of their systems.
These values are from a review conducted in 2012 of vehicle LCAs. Due to the fast develop-ment of electric vehicles and the current premature state of the technology, the values are likely to change quickly.
4.2.2.2 Vehicle modules
4.2.2.2.1 Glider
As mentioned above, the glider brings together all the modules which are not directly related to traction technology. Body/Chassis denominates the parts responsible for the structure of the vehicle. It can be seen as the framework (typically mainly of metallic materials even though innovative fibres are being more and more exploited as well) on which all the other modules are mounted. The non-propulsion electrical system comprises all the electronics that are not included in the drivetrain, such as lights, comfort devices (heating and air conditioning), or navigation and entertainment systems.
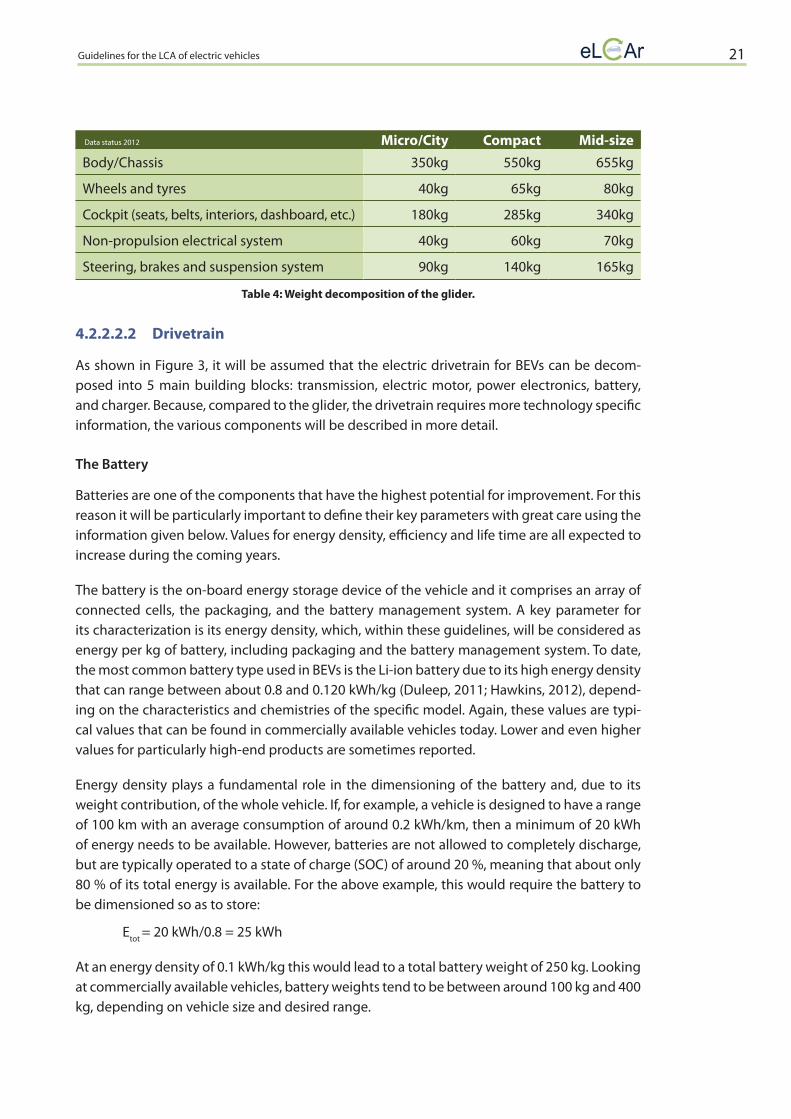
From the studies presented in Schweimer (2000) and Althaus (2010), the following weight dis-tribution of the glider has been derived:
4 For a list of drag coefficients see http://en.wikipedia.org/wiki/Drag_coefficient and http://en.wikipedia.org/wiki/Automobile_drag_coefficient
Data status 2012
Guidelines for the LCA of electric vehicles 21
Micro/City Compact Mid-sizeBody/Chassis 350kg 550kg 655kg
Wheels and tyres 40kg 65kg 80kg
Cockpit (seats, belts, interiors, dashboard, etc.) 180kg 285kg 340kg
Non-propulsion electrical system 40kg 60kg 70kg
Steering, brakes and suspension system 90kg 140kg 165kg
Table 4: Weight decomposition of the glider.
4.2.2.2.2 Drivetrain
As shown in Figure 3, it will be assumed that the electric drivetrain for BEVs can be decom-posed into 5 main building blocks: transmission, electric motor, power electronics, battery, and charger. Because, compared to the glider, the drivetrain requires more technology specific information, the various components will be described in more detail.
The Battery
Batteries are one of the components that have the highest potential for improvement. For this reason it will be particularly important to define their key parameters with great care using the information given below. Values for energy density, efficiency and life time are all expected to increase during the coming years.
The battery is the on-board energy storage device of the vehicle and it comprises an array of connected cells, the packaging, and the battery management system. A key parameter for its characterization is its energy density, which, within these guidelines, will be considered as energy per kg of battery, including packaging and the battery management system. To date, the most common battery type used in BEVs is the Li-ion battery due to its high energy density that can range between about 0.8 and 0.120 kWh/kg (Duleep, 2011; Hawkins, 2012), depend-ing on the characteristics and chemistries of the specific model. Again, these values are typi-cal values that can be found in commercially available vehicles today. Lower and even higher values for particularly high-end products are sometimes reported.
Energy density plays a fundamental role in the dimensioning of the battery and, due to its weight contribution, of the whole vehicle. If, for example, a vehicle is designed to have a range of 100 km with an average consumption of around 0.2 kWh/km, then a minimum of 20 kWh of energy needs to be available. However, batteries are not allowed to completely discharge, but are typically operated to a state of charge (SOC) of around 20 %, meaning that about only 80 % of its total energy is available. For the above example, this would require the battery to be dimensioned so as to store:
Etot = 20 kWh/0.8 = 25 kWh
At an energy density of 0.1 kWh/kg this would lead to a total battery weight of 250 kg. Looking at commercially available vehicles, battery weights tend to be between around 100 kg and 400 kg, depending on vehicle size and desired range.
Data status 2012
Guidelines for the LCA of electric vehicles22
Other key parameters are the efficiency of charge and discharge (for optimized consumption calculations) and life expectancy (for determining maintenance contributions). The charge and discharge efficiencies depend on the internal resistance of the battery during charging and discharging. In Hawkins (2012), an overall average efficiency (i.e. output energy as a func-tion of the input energy) of 90 % is reported even though lower and higher values can also be found in the literature (see, for example, Campanari (2009) for an approach involving specific charging and discharging resistance that leads to an overall average efficiency of 92 %). In this context, and as will be described in more detail in 7.1.2.1.1 ‘Consumption calculation methods’, it should be mentioned that, more than average or nominal efficiency, it is dynamic efficiency as a function of the specific working point that should be analysed in batteries, as well as in power electronics and electric motors, when it comes to consumption analysis. Nevertheless, average and nominal values represent a good starting point for estimates.
Life expectancy is a key parameter in the assessment of a battery, even though not much historical data is available yet for current technologies. Battery life, by definition, ends when less than 80 % of the initial capacity remains. Important aspects are the calendar lifetime as well as the lifespan in terms of charging cycles. For lithium-ion batteries, lifespans in excess of 5000 deep cycles have been described in the literature (Duleep, 2011; Majeau-Bettez, 2011). In terms of calendar years, however, much more uncertainty is currently present. While lifetimes below the calendar lifetime of vehicles are typically assumed, a clear aim is to reach parity of lifetime between battery and vehicle in the near future (Duleep, 2011).
The power electronics
The power electronics comprises a number of electronic devices which are required for energy management between the battery and the electric motor. A key component is the controller, which takes energy from the battery in the form of direct current and processes it so as to return the alternating current required for inducing the motion desired by the driver in the electric motor. To date, high conversion efficiencies are reported in the context of power controllers. In Campanari (2009), nominal efficiencies of around 97 % are estimated, based on the product specifications of several manufacturers. While efficiencies are already quite high, it is still ex-pected that optimizations will occur with respect to device size and weight (Duleep, 2011).
Another important set of devices within the class of power electronics is the regenerative braking system. This system controls the recuperation of energy during deceleration using the electric motor as a generator powered by the inertia of the car. The recuperated energy is then fed back into the battery. Typically, not all the energy returned during deceleration is loaded into the battery in order to protect it from currents that are too high. The fraction of recovered energy therefore depends on the recuperation algorithm as well as the efficiency of the elec-tronics. To the best of our knowledge, no review of devices using current technology exists at the moment in the literature.
Finally, an on-board charging device is also part of the electronics on the vehicle. Reported ef-ficiencies vary substantially among different manufacturers, from around 80 % to well above 90 %. Also, it appears that the state of charge of the battery can influence the efficiency of the charging procedure.

Guidelines for the LCA of electric vehicles 23
The electric motor
The electric motor converts the electrical energy coming from the power electronics into me-chanical energy (and, as described above, mechanical energy into electrical energy during re-generative braking). Various types of electric motors exist even though the permanent magnet, brushless DC motor seems to be particularly popular in currently available vehicles (Duleep, 2011). In Campanari (2009) a nominal efficiency of 92 % is reported, based on various induction motor manufacturers, while values around 95 % are reported by some producers. Increases in efficiency and reduction of motor weight can be expected during the coming years.
Transmission
The transmission is the link between the electric motor and the drive wheels. In contrast to ICE drivetrains, electric drivetrains can exist in gearless configurations, which reduces the com-plexity and weight of the system. In this context, too, little information can be found in the literature on the efficiencies of the transmission systems in current BEVs. The only information available, to the best of our knowledge, is in Campanari (2009), where a 2 % loss is described.
Serial PHEVs
As described above, serial PHEVs are BEVs equipped with an ICE that can recharge the bat-tery through a generator. The ICE works as a range extender in case the battery charge runs low. Since the battery is one of the heaviest and most expensive components of the vehicle, and since average daily vehicle trips run well below 100 km, a common strategy used in se-rial PHEVs is to use a battery that will only provide a limited range in all-electric mode, usually enough for typical daily utilization, and to use the range extender for longer journeys.
A typical example of an all-electric range for such vehicles is 50 km. Using the same numbers as in the above battery example, this would lead to half the battery weight (125 kg) as opposed to a BEV with a 100 km range. Of course, the ICE, the fuel tank and the electric motor used as a generator must then be added. These, however, represent much more mature technologies than lithium-ion traction batteries. Also, since the ICE is only used to drive the generator, it can be made to operate at fixed loads at above average efficiency, as opposed to an ICE used for traction where loads change depending on the specific torque required.
Based on Schweimer (2000), Althaus (2010) and Habermacher (2011), the following weight distribution for the drivetrain has been derived:
Micro Compact Mid-SizeE-Motor weight 20kg 50kg 80kg
Power electronics weight (without charger) 30kg 30kg 35kg
Transmission system weight 20kg 20kg 25kg
Charger weight 7kg 7kg 7kg
ICE (ICE system and generator for serial PHEVs) 60kg 80kg 100kg
Table 5: Weight distribution of the electric drivetrain.
Data status 2012

Guidelines for the LCA of electric vehicles24
5 Goal definition
Goal definition is the first phase of a life cycle assessment. The aim is to describe and state the key objectives of the analysis and, ultimately, to clarify the question that is at the heart of the study. Since it lays the foundations for the rest of the work, its precise definition is of funda-mental importance for avoiding erroneous methodological steps and misinterpretation of the results.
In goal definition, the following six aspects shall be addressed and documented (ILCD, 2010):
�� Intended application(s) of the deliverables and results�� Limitations due to method, assumptions, and impact coverage5
�� Reasons for carrying out the study and the decision-context�� Target audience for the deliverables and results�� Comparative studies to be disclosed to the public�� Commissioning agent of the study and other influential factors.3
5.1 Intended application
The goal definition shall first state the intended application(s) of the LCA results in a precise and unambiguous way (e.g. Comparative assertion of the overall life-cycle environmental impacts associated with driving 1 km in an electric vehicle with 120 km range having (a) a lithium-ion battery Type A with 100 Wh/kg and (b) a lithium-ion battery Type B with 120 Wh/kg energy density).
Overall, by stating the intended application, the practitioner describes the main objective of the study and the specific research6 question being addressed.
5.2 Method, assumption and impact limitations
If the study is subject to specific limitations due to methods, assumptions and impacts evalua-tion that might restrict the usability of the results, then these shall be clearly stated within the goal definition and later be prominently reported (ILCD, 2010).
A typical example of an impact-coverage related limitation is the case of carbon footprint cal-culations where exclusively greenhouse gas emissions are considered (ILCD, 2010). Since other impacts, like resource and energy consumption and specific damages to human health and the ecosystem, are not analysed in such studies, their results and conclusions will neglect key
5 See scope definition in ISO framework.6 Academic, industrial, institutional, etc.: research intended as investigation for solving and/or
identifying particular issues.

Guidelines for the LCA of electric vehicles 25
environmental aspects. Hence, limitations (be they on methodology, assumptions, or evalu-ated impacts) must be taken into account during interpretation and need, therefore, to be exactly stated in the goal definition.
More examples of the various influences of limitations can be found in section 5.2.2 of the general ILCD Handbook.
5.3 Reasons for carrying out the study and decision-context
Goal definition shall also explain the reasons for initiating the study, name the drivers and motivations, and identify the decision-context. Stating the reasons, drivers and motivations is important as these indicate the desired level of quality and set a basis to judge, among other things, data quality or special review needs. Clearly, an LCA made by an engineer in an eco-design company or made for him to get an initial understanding of the main impacts associ-ated with a specific device will have different quality needs compared to one made within a governmental institution where the results will determine the development of public policy.
Strictly linked to the reasons, drivers, and motivations is the concept of the decision-context, which defines whether or not the results of the study will be used to support a decision about the analysed system. If the study does not involve decision support, then it will typically be of a more descriptive nature. If it aims to support a decision making process, then a key problem is to take into account all the relevant consequences that the decision may cause. For example, the production of Product X might lead to less production of Product Y. From that, the demand for material Z might increase, while the demand for material W might decrease. In this case it is necessary to know how the increased demand for material Z will be met and what happens to the W that is not needed anymore. Will existing markets and their infrastructure cover the needs or will it be necessary to install new production facilities for material Z? Will production of W decrease or will the product be used for other goods? And if production decreases, which processes will be affected? Hence, not only is it important to consider whether a study involves decision support or not, it is also important to define the extent of the consequences the deci-sion may have.
Since modelling the Life Cycle Inventory requires taking these differences into account, the general ILCD Handbook defines three different situations (A, B and C), which are addressed with different methodological and quality needs (ILCD, 2010): While studies that fall within situations A and B involve decision support, studies within situation C are of a descriptive char-acter. Because a stakeholder consultation7 indicated that LCA in the context of electric vehicles would mostly aim at comparisons for some sort of decision support, situation C will not be addressed in this handbook (eLCAr, 2012).
Focusing on studies which imply decision support, it is important to stress that the above re-fers to changes in the background system that are caused via market mechanisms, i.e. in reac-tion to changed supply and demand resulting from decision implementation since this may, in
7 First eLCAr workshop.

Guidelines for the LCA of electric vehicles26
turn, lead to substantial structural changes in, for example, the raw material or energy supply chain. Clearly, different scenarios with respect to changes in the supply chain will correspond to different environmental impacts.
In this context, situation A, micro-level decision support, is meant for cases in which the conse-quences of the decisions (based on the results of the analysis) will have small-scale influences on the systems connected to the life cycle of the products of interest. An example could be an LCA of two existing brands of vehicles of similar type and technology with the aim of inform-ing purchases. While such a study will influence the decision of some citizens with respect to which vehicle to buy, the materials, resources and infrastructure connected to the two options will be so similar that a shift in the production volume of one with respect to the other is not likely to produce a substantial change in, for example, the amount of steel or energy used by the automotive market. Hence, in these cases, it is expected that the overall systems connected to the products of interests through market-mechanisms will be able to absorb the changes (i.e. the consequences of the decision) without major influences on the infrastructure.
Situation B, meso/macro-level decision support, addresses cases in which the decisions taken as a result of the analysis can have large-scale, structural effects on the systems linked to the product of interest. For example, a substitution of 10 % of all passenger cars in Europe by BEVs in the next 15 years would lead to an additional demand for about 6 000 tons of lithium per year. This would correspond to about 20 % of global production. Consequently, such a sce-nario (if it could be considered reasonable in the first place) would certainly require additional lithium and lithium battery production capacity. An LCA aimed at analysing such a strategic topic would thus fall under situation B.
Due to the different influences (and, therefore, environmental impacts) these two situations can have, a different focus will have to be used in the realization of the LCIs and, in general, in some parts of the LCAs. For this reason it is important to identify the decision-context that is best suited for the specific problem.
For identifying whether a study falls within situation A or B, the ILCD framework indicates, as a general rule, that the consequences of a decision shall be assumed to be large if the annual additional demand or supply triggered by the analysed decision is bigger than the average percentage of annual replacement of the supply capacity of the required function or system in the given market. Further, the general ILCD Handbook specifies that if the average percent-age is above 5 %, 5 % should be used instead. This value is for orientation only and, for a given case, can be changed to be smaller or bigger upon argumentation that the change in demand or supply is directly triggering changes in demand, and not only via a marginal accumulative effect in contribution to the general market demand signal (ILCD, 2010).
In identifying the key changes and affected processes of the background, a key issue is that not only might demand on the supply chain of the analysed production system play a domi-nant role, but also additional supply (e.g. as co-product from a process of the analysed system) can have large scale consequences (ILCD, 2010). The recommendations given above and in chapter 7.1.1.2 also apply to cases of multifunctionality and provision of additional goods or services to the market: if the annually provided amount is larger than the average replacement

Guidelines for the LCA of electric vehicles 27
rate of the installed capacity of the superseded good or service, this falls under situation B and requires different modelling.
As an example, the installed production capacity of globally traded material X, which might be required in consequence of the decision to produce product Y, could be, e.g. 10 Mio tonnes8. If the plants for producing material X have a lifespan of 25 years, this leads to an average annual replacement rate of 4 % (on average, 1/25th of the capacity will have to be replaced annually). Overall, an additional annual demand for more than 0.04·10·106 tonnes, or 400 000 tonnes, of material X shall be assumed to have the large scale consequence of triggering installation of additional capacity beyond the replacement of old plants.
In the context of the LCA of electric vehicles, identifying whether a study falls within situation A or B poses various challenges. On the one hand, electric vehicles to date are responsible for a very small share of the automotive market as opposed to internal combustion engine vehicles. Even though more and more car manufacturers are entering the market with new models, and the number of electric vehicles is increasing, it is reasonable to expect that their share will stay small compared to conventional vehicles for the near future and their market share will not cause substantial changes in overall material and resource flows. Hence, LCAs of electric vehicles that focus on the short and possibly mid-term would typically fit situation A. On the other hand, there is a strong possibility that electric vehicles will reach mass produc-tion in the mid to long-term. In that case, structural changes might be expected, for example, with respect to electricity generation and distribution or the production of some key sub-stances like lithium or rare earths like neodymium. LCAs in the context of electric vehicles that seek to understand these structural implications would then fall under situation B. Moreover, some of today’s research projects aim to reach the technological breakthroughs that might lead to mass distribution of electric vehicles. A perspective that considers the consequences of wide-spread use of electric vehicles in the context of specific research breakthroughs should therefore not be neglected.
Overall, it seems reasonable to assume that a major part of today’s research and development projects in industry or in research institutions that deal with vehicle systems have a stronger focus on the near to mid-term use of electric vehicles and will therefore fall within situation A. However, whenever a study focuses on electric vehicle penetration levels that may lead to large changes in the supply chain of some products or services needed for their production, then situation B should be chosen. Since the scope of changes that may occur in supply chains within situation B studies is very large and strongly goal and scope dependent, it is not pos-sible to give precise information on this topic. This handbook will therefore focus mainly on situation A, but also give guidance on some key aspects of situation B.
More information on the distinction between situation A and B can be found in section 5.3 of the general ILCD Handbook.
8 Taken from the general ILCD Handbook

Guidelines for the LCA of electric vehicles28
5.4 Target audience
Goal definition shall identify the target audience of the study, i.e. to whom the results of the study are intended to be communicated (ILCD, 2010). Apart from influencing some formal aspects, particularly in the report part of the LCA (a report describing an LCA for a technical audience will use different language than one directed to governmental decision makers), the identification of the target audience is key to choosing the appropriate critical review needs for the study.
Therefore, since various target audiences (e.g. technical vs. non-technical, internal vs. external) typically imply different requirements for, among other things, reporting or critical review due to the specific audiences’ needs, the target audiences must be initially stated in the goal definition.
5.5 Comparisons to be disclosed to the public
Goal definition shall furthermore explicitly state whether the LCA includes a comparative asser-tion intended for disclosure to the public (ILCD, 2010). This aspect is important since, due to the influence this assertion may have on, for example, companies, institutions or consumers, there are a number of mandatory requirements for the execution, documentation, review and report-ing of such LCAs. Also, special emphasis has to be placed on the functional equivalence of the systems to be compared and consequently on the definition of the functional unit (see 6.2).
To avoid by-passing these requirements by showing results for different products without ex-plicitly making an assertion as to superiority or equality, comparative, but not assertive, LCAs shall meet these requirements, as far as is applicable. (For exceptions and further restrictions, see chapter 5.2.5 of the general ILCD Handbook).
5.6 Commissioner of the study and other influential factors
Finally, the goal definition shall identify who commissioned the LCA and the financing or other organisations that have any relevant influence on the study, including the LCA experts that perform it (ILCD, 2010). This aspect is key for transparency about the reasons for carrying out the study and for highlighting potential conflicts of interest.
5.7 Component vs. vehicle system analysis and definition of foreground and background system
The aim of this handbook is to give guidance for the LCA of electric vehicles and of their com-ponents. When the focus of an LCA lies on a specific component of electric vehicles, then the practitioner needs to carefully evaluate, starting from the goal definition in order to optimize the planning of the study, whether his analysis can be limited to the life cycle of the specific com-ponent of interest or whether the perspective has to be moved to analysing the impacts of the component working in conjunction with other components or within a complete vehicle.

Guidelines for the LCA of electric vehicles 29
Consider, for example, the above described intended application of two types of lithium-ion battery. The starting point of the analysis lies with the two batteries, which are characterised by different energy densities. If battery type B has a higher energy density than A, then a ve-hicle using battery B will need a lower quantity of battery to achieve the same driving range as a vehicle with battery A. Since the vehicle needs a lower quantity of battery, its total weight will be lower and, through that, the energy consumption of the vehicle will be reduced. On the other hand, if the vehicle is run with the same quantity of batteries, then using battery B will allow it to achieve a longer driving range and reduce the frequency of charging. Since the different characteristics of the two batteries lead to such different scenarios for the vehicle infrastructure and use, which, in turn, will lead to different environmental impacts, it is neces-sary to define exactly how the batteries are exploited within the vehicle system in order for the comparison to be meaningful. Analysing the two isolated batteries, without taking into ac-count their influence on the vehicle system, would lead to incomplete results and potentially wrong conclusions.
Whenever a component leads to such ‘part-system’ interactions that can influence the per-formance of other components or of the entire vehicle, then the perspective of the LCA shall be set on the life cycle of the component together with the influenced components or on the vehicle and not on the component alone. The interdependency matrix shown in chapter 3 identifies situations in which such part-system interactions may take place. Further, the in-formation given in chapter 4.2.2 should help practitioners focus on a specific component and realize that other parts of the vehicle with which they are not familiar need to be included in the LCA to set up the model for their analysis.
After defining what the system will be, one should also exactly define what the foreground and background systems will be. The foreground system will always focus on the specific object of analysis (e.g., in the example above, the battery) and describe what services, sub-processes, materials, etc., are required in its production and how much of them, use and end-of-life treat-ment. In cases of relevant part-system interactions, the foreground system will also include the component or system at the next higher level. If, e.g. the battery is the focus of the study and the influence of battery weight on the dimensioning of the braking system has been identified as a part-system interaction, the vehicle (which is the system one level above the battery) will come into the foreground system. This does not necessarily require the analysis of all the spe-cific production processes of the rest of the vehicle with the same level of detail used for the battery. Mainly, how the rest of the vehicle is influenced will become part of the foreground, which means that the vehicle has to be specifically analysed for what services, sub processes, materials, etc., are required in the vehicles production, use and end-of-life treatment and how much of them . Typically, the background describes how these materials and services that are required for the life cycle of the product are produced, used and disposed. Overall, three dif-ferent situations can be distinguished:
�� The focus of the analysis is on a specific component that does not interact with the rest of the vehicle: the LCA addresses only the life cycle of the component. The background comprises the production, use, and end-of-life of the services and products (e.g produc-tion of steel, shredding process needed for the disposal) required for the production, use, and end-of-life of the component.

Guidelines for the LCA of electric vehicles30
�� The focus of the analysis is on a specific component which interacts with other compo-nents or the entire vehicle: the LCA is realized by placing the component and the system one level above the component in the foreground, while the background includes all the products and services required to realize the foreground.
�� The focus of the analysis is on the entire vehicle: the LCA is realized by placing the com-plete vehicle in the foreground.
9
Provisions 5: Goal definition7
I. SHALL: Unambiguously identify the intended application of the LCA deliverable.
II. SHALL: Unambiguously identify and state initially set limitations on the LCA. These can be caused by the following:��Impact coverage limitations such as in carbon footprint calculations��Methodological limitations of LCAs in general or of the specific methodologi-
cal approaches applied� Assumption limitations: Specific or uncommon assumptions and scenarios
for the analysed systems [ISO+].
III. SHALL: Unambiguously identify the internal or external reason(s) for carrying out the study and the specific decisions to be supported by its outcome. Also identify how far the decisions influence up and down-chain processes.
IV. SHALL: Identify the decision-context of the LCA:Situation A: Micro-level decision supportSituation B: Meso/macro-level decision support.
V. SHALL: Unambiguously identify the audience(s) to whom the results of the study are to be communicated.
VI. SHALL: Classify the targeted audience(s) as being internal, restricted external (e.g. specific business-to-business customers), or public. Shall also differentiate be-tween technical and non-technical audiences. [ISO+]
VII. SHALL: Unambiguously state whether the study involves comparisons or compar-ative assertions, and whether these are foreseen as being disclosed to the public. [ISO+]
VIII. SHALL: Identify the commissioner of the study and all other influential actors such as co-financiers, LCA experts involved, etc.
IX. SHALL: When the foreground system focuses on a specific component of electric vehicles and this component causes part-system interactions that influence the performance of other components or of the entire vehicle, then the LCA shall ad-dress the life cycle of that component and of the affected system. Identification of part-system interactions should be in the definition of the intended application.
9 From ILCD, 2010, except for point IX.

Guidelines for the LCA of electric vehicles 31
5.8 Goal definition example10
A company which produces Lithium-ion batteries with 100Wh/kg energy density is in-terested in a new type of battery technology with 120Wh/kg energy density. The re-search and development unit of the company wants to investigate whether this new technology could lead to a product which may substitute the one currently sold. In the analysis, technological as well as environmental aspects shall be taken into account, since sustainability is a key trait of the company. After having identified a viable pro-duction process, it is decided to make a first assessment on the environmental impacts which this new technology may bring in order to consider whether or not to continue investing in it and, possibly, build the required production system. The research and development unit entrusts an internal LCA practitioner from the sustainability assess-ment group with the conduction of the analysis. As a preliminary study, the practitioner decides to limit the analysis to the carbon footprint. Moreover, recognizing the “part-system” interactions between batteries and vehicle and considering that the main cus-tomer of the battery company is a manufacturer of a specific vehicle type, the practi-tioner decides to perform the LCA analysing the overall carbon footprint of the two bat-teries functioning in the vehicle of their main customer (further addressed as Customer X Vehicle) with a driving range of 120km. The results shall be presented to the research and development unit of the company.
A goal definition for this scenario could be the following:
Intended application: Comparative assertion of the GHG emissions associated with driving 1km in an electric vehicle of Customer X having (a) a lithium-Ion battery Type A with 100 Wh/kg or (b) a lithium-Ion battery Type B with 120Wh/kg battery energy density and a total driving range of 120km.
Limitations: Since the focus of the study is on the battery, data on vehicle production is rather coarse except for those components and phases where a significant differ-ence between a vehicle with battery A and a vehicle with battery B is expected. Thus, the total carbon footprint of the vehicles exhibits significant uncertainties while the difference caused by the different batteries is modelled quite accurately. The analysis focuses only on the carbon footprint as it is intended as preliminary study. Thus, poten-tial trade-offs in other environmental aspects such as damage to health or to non-fossil resources cannot be identified. Data for battery B are based on lab scale production and neither learning nor scaling effects are considered to extrapolate to a future large scale production.
10 The example and the numbers therein have been invented for purely didactical purposes.

Guidelines for the LCA of electric vehicles32
Reasons for carrying out the study and decision context: If the preliminary results show that an improvement larger than X% in terms of carbon footprint may be ob-tained with the type B battery, then further resources will be invested in order to make a detailed LCA, covering damages to human health, to the ecosystem and resource consumption. If the preliminary study shows that none or only minor improvements will be achieved, then the possibility of switching to the alternative technology will be abandoned. The analysis will be performed assuming that the decision deriving from the results will have a negligible impact on the supply chains involved in the life cycle of the products, falling therefore within a Situation A type of study.
Target audience: The results are intended for an internal and technical audience.
Comparative assertion: The study will perform a comparative assertion, but the re-sults will not be disclosed to the public.
Commissioner of the study: The study has been commissioned by the research and development unit of the company and will be performed by Mr. …. of the internal sustainability assessment group.
Guidelines for the LCA of electric vehicles 33
6 Scope definition
6.1 Introduction
During the scope definition phase the object of the LCA is defined and described in detail. This shall be done in line with the goal definition, meaning that the scope should be sufficiently well defined to ensure that the breadth, depth and detail of the study are compatible and suf-ficient to address the stated goal. This includes deriving the requirements on methodology, quality, reporting, and review in accordance with, and based on, the reasons for the study, the decision-context, the intended applications, and the audience.
When deriving the scope of an LCA from the goal, the following scope items shall be clearly described, justified and/or defined (ILCD, 2010):
�� The ultimate system or process that is studied and its function(s), functional unit, and reference flow(s)
�� LCI modelling framework and handling of multifunctional processes and products �� System boundaries, completeness of requirements, and related cut-off rules �� Impact categories to be covered and selection of specific LCIA methods to be applied as
well as - if included - normalisation data and weighting set �� Other LCI data quality requirements regarding technological, geographical and time-re-
lated representativeness and appropriateness�� Types, quality and sources of required data and information and, here especially, the re-
quired precision and maximum permitted uncertainties �� Special requirements for comparisons between systems �� Identifying critical review needs �� Planning reporting of the results
Apart from clearly identifying all relevant aspects of the object of study, defining several of the above mentioned topics also helps the practitioner plan the development of the study since particular needs, for example, for the required data may appear during scope definition. The following subchapters address the main challenges of the scope definition.
6.1.1 Consistency and reproducibility
The general ILCD Handbook introduces basic requirements on consistency (provisions 6.2.1) and reproducibility (provisions: 6.2.2). These provisions aim at securing the internal consistency of LCAs in terms of modelling, methods and data (including assumptions), and at ensuring that the documentation allows another practitioner to (sufficiently) reproduce the results of LCAs.
These provisions are very valuable. They point out the importance of the issues to the practi-tioner and they guarantee that a commissioner or reviewer of an LCA can enforce consistency and reproducibility. These overarching provisions must therefore be taken into account by the practitioner. Due to their general aspect, which cannot be made to address the case of electric vehicles more specifically, that text is not repeated in this handbook.
Guidelines for the LCA of electric vehicles34
Provision 6.1.1: Consistency and reproducibility
I. SHALL: Follow Provisions: 6.2.1 'Consistency of methods, assumption and data' and Provisions: 6.2.2 'Reproducibility' of the general ILCD Handbook.
6.2 Function, Functional Unit and reference flow
After having introduced the object of the study in the goal definition, it is then necessary to define as precisely as possible its key characteristics and give more detail about the exact quantitative aspects that will guide the analysis. This is important not only in order to correctly develop the study in terms of methodological and data source choices, but also with respect to comparing the results within the analysis itself (if more options or technologies are evalu-ated) or with other studies. A central element for comparing and interpreting the results are functions, functional units and reference flows.
Functional units name and quantify the aspects of the functions of a product. Starting with the function of a product or service, the functional unit answers the questions what, how much, how well, and for how long the object of the study performs the function. Unambiguous an-swers to these questions are crucial for interpretation and potential comparison of products. If products do not fulfil exactly the same functions in all relevant terms, the comparison would be of two objects that are not properly exchangeable. Hence, if some of the relevant aspects of the products to be compared are not identical, the systems have to be expanded to the point where equivalent functionality is achieved.
Closely linked to the concept of functional unit is the reference flow. The reference flow is the flow to which all inputs and outputs quantitatively relate. It is the flow which is realised by the functional unit and, in some cases, the two will have the same definition.
While more information and definitions on general functional units and reference flows can be found in the general ILCD Handbook (chapter 6.4 and Provisions 6.4), the next subchapter analyses the specific case of electric vehicles.
6.2.1 Functional Units for e-mobility applications
All components of (electric) vehicles influence the vehicle’s use-phase energy demand due to their weight and, in many cases, their efficiency. This implies that the weight of every compo-nent and the energy efficiency of many components are decisive factors for the functionality of the components that need to be included in the functional unit. If components with different weights or efficiencies are to be compared by LCA, the different options cannot be assessed as isolated components, but must be considered in the context of the vehicle’s life cycle. In other words, and going back to the terminology of the previous paragraph, the various options must be compared within an equivalent functionality. Hence, consistent with the goal definition, in an LCA of an electric vehicle, or of a number of key components of an electric vehicle, the func-

Guidelines for the LCA of electric vehicles 35
tional unit and reference flow, too, must take into consideration the perspective of the entire vehicle in order to achieve equivalent functionality.
Achieving functional equivalence in a comparison between BEVs and ICEVs or hybrids can be extremely difficult. In these cases it is of utmost importance that the functional unit is com-pletely in line with the goal definition. For example, the goal and the functional unit in a study comparing environmental impacts of driving a BEV to those of driving a petrol fuelled ICE vehicle for daily commuting (40 km per day) in an urban environment (max speed 60 km/h) is not the same as the goal and the functional unit in a study comparing the same vehicles in average use.
Let’s assume that the vehicles to be compared are well defined and similar in terms of size, comfort and relevant driving performance. The BEV however has a limited range (120 km per charge) and a lower top speed (130 km/h) than the ICEV. These limitations are not considered relevant if the comparison focusses on urban commuting but they (outside Germany mainly the limited range) have to be considered for average use, e.g. by adding the use of a rental car to the BEV system for those journeys that can’t be done with the BEV due to limited range.
Another difference between the BEV and the ICEV is that the ICEV produces enough waste heat to heat the passenger cabin in winter while the BEV, due to the much higher efficiency of the drivetrain, needs dedicated energy from the battery for heating purposes in cold climates. Thus it has to be specified in the functional unit in which climate the vehicles are used.
Another influence of the driving context on the functional unit comes from variations of driv-etrain efficiency with variation of drive cycles. Drivetrain efficiency is much lower for ICEVs if the engine load is low. BEVs efficiencies also vary with load but much less than ICEVs. A consequence of this fact is that a change in the drive cycle leads to different variations in en-ergy consumption for propulsion for BEVs than for ICEVs. In other words, if a BEV is 60% more energy efficient than an ICEV in drive cycle A, it will not be 60% more efficient in drive cycle B. Consequently the result of a comparison is only valid for the drive cycle under consideration and extrapolations to other drive cycles are not trivial.
The following box illustrates this in a simplified example.
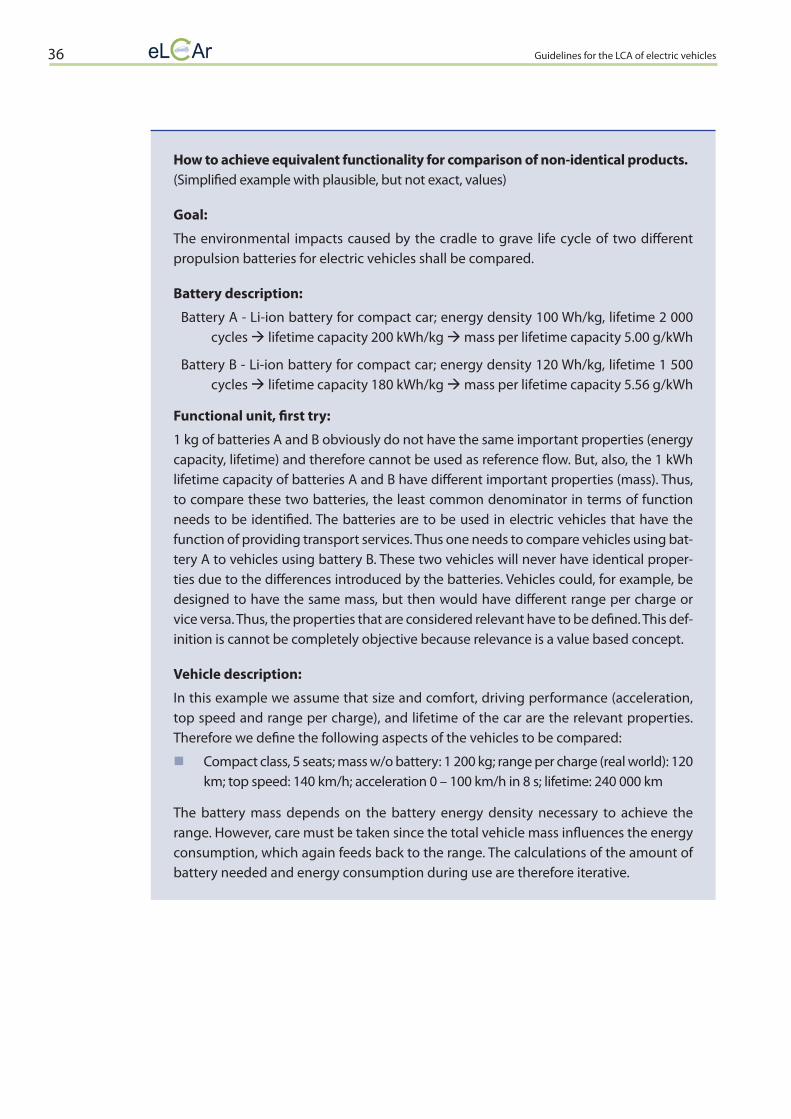
Guidelines for the LCA of electric vehicles36
How to achieve equivalent functionality for comparison of non-identical products. (Simplified example with plausible, but not exact, values)
Goal:
The environmental impacts caused by the cradle to grave life cycle of two different propulsion batteries for electric vehicles shall be compared.
Battery description:
Battery A - Li-ion battery for compact car; energy density 100 Wh/kg, lifetime 2 000 cycles lifetime capacity 200 kWh/kg mass per lifetime capacity 5.00 g/kWh
Battery B - Li-ion battery for compact car; energy density 120 Wh/kg, lifetime 1 500 cycles lifetime capacity 180 kWh/kg mass per lifetime capacity 5.56 g/kWh
Functional unit, first try:
1 kg of batteries A and B obviously do not have the same important properties (energy capacity, lifetime) and therefore cannot be used as reference flow. But, also, the 1 kWh lifetime capacity of batteries A and B have different important properties (mass). Thus, to compare these two batteries, the least common denominator in terms of function needs to be identified. The batteries are to be used in electric vehicles that have the function of providing transport services. Thus one needs to compare vehicles using bat-tery A to vehicles using battery B. These two vehicles will never have identical proper-ties due to the differences introduced by the batteries. Vehicles could, for example, be designed to have the same mass, but then would have different range per charge or vice versa. Thus, the properties that are considered relevant have to be defined. This def-inition is cannot be completely objective because relevance is a value based concept.
Vehicle description:
In this example we assume that size and comfort, driving performance (acceleration, top speed and range per charge), and lifetime of the car are the relevant properties. Therefore we define the following aspects of the vehicles to be compared:
�� Compact class, 5 seats; mass w/o battery: 1 200 kg; range per charge (real world): 120 km; top speed: 140 km/h; acceleration 0 – 100 km/h in 8 s; lifetime: 240 000 km
The battery mass depends on the battery energy density necessary to achieve the range. However, care must be taken since the total vehicle mass influences the energy consumption, which again feeds back to the range. The calculations of the amount of battery needed and energy consumption during use are therefore iterative.

Guidelines for the LCA of electric vehicles 37
�� Vehicle with battery A: Battery mass to achieve 120 km real world range: 350 kg; real world energy de-mand (at plug): 22.7 kWh/km; life time distance with 1 battery: 240 000 km
�� Vehicle with battery B: Battery mass to achieve 120 km real world range: 280 kg; real world energy de-mand (at plug): 22.0 kWh/km; life time distance with 1 battery: 180 000 km. This vehicle needs 1.33 batteries to achieve the desired lifetime.
Functional unit, vehicle perspective:
‘240 000 km driving in a battery electric, five seat, compact car of 1 200 kg (without battery mass), fuelled with average European electricity generated between 2012 and 2022, with battery A or B and a range of 120 km per charge in real world driving’ would be a useable functional unit. For both vehicles one would need to consider the differ-ent levels of electricity consumption. This difference is the reason why the electricity source needs to be specified.
Note: other properties which can be relevant to the functionality of a car, such as trunk size, number of doors, automobile layout (front / rear / 4 wheel drive), etc., could also be specified. Since the goal of the LCA in this example is to assess the difference be-tween two batteries, the trunk size might be a property to be considered, e.g. if one battery is larger than the other and reduces available luggage space.
Reference flow, vehicle perspective:
Several reference flows could be defined in this example, e.g. 1 km driving, 240 000 km driving, 10 years driving, 1 year driving. It is, however, not possible to use the battery or one of its properties as a reference flow even though the goal of the study is to com-pare two batteries. Depending on the goal of the study, some reference flows might be more, and others less, appropriate. However, the choice of the reference flow is not a critical issue since, as long as the functional unit is well defined, reference flows can easily be converted.
Similar examples could be made for electric motors or power electronics with different ef-ficiencies, tyres with different rolling resistances, or any components with different weights.
For those components that have no influence on vehicle performance, the practitioner can decide to limit the analysis to the isolated component no matter if the study is comparative or not. However, there will always be an influence from the component on the vehicle perfor-mance if studies consider all three phases of the component’s life cycle (production, use and EoL). In this case, modelling the use phase requires a quantification of the component’s con-tribution to the exchanges caused by the use of a vehicle. This is usually not straightforward, not even in the most trivial cases. For example, including the use phase in the LCA of a car seat requires defining how the seat contributes to the energy consumption of the car. This can be done by evaluating the additional energy consumption per additional weight of the car. But
Guidelines for the LCA of electric vehicles38
this requires the definition of a car and a drive cycle in which the seat will be used since prop-erties of the car (e.g. the drivetrain efficiency) and properties of the drive cycle (e.g. accelera-tion) influence this result. A sensible definition of the use phase of the car seat can be done by analysing the difference when compared to a reference system.
The analysis can always be limited to an isolated component if the use phase is excluded from the life cycle and no comparison is desired. In these cases, however, it is required that the functional unit defines all properties affecting the whole life cycle of the component and/or the system it is used in. Since it is outside the scope of this handbook to give guidance for all components in a vehicle, the practitioner shall also use the general functional unit and refer-ence flow definition given in chapter 6.4 of the general ILCD Handbook if his analysis is limited to an isolated device.
Provisions 6.2.1: Functional Units for e-mobility applications
I. SHALL: For an LCA addressing the environmental impacts of an entire vehicle or comparing components that influence the vehicles performance, the functional unit and the reference flow must be related to the transport service provided by the vehicle and take into consideration (depending on the specific component under analysis) the following parameters:�� Key parameters of the vehicle and or its components, e.g. life expectancy
of the vehicle, life expectancy of the component, functionality of the vehi-cle (e.g. vehicle class, number of seats, maximum cargo, range per charge, comfort elements)
�� Key links between component and vehicle performance (e.g. weight with energy consumption) and how these will quantitatively influence the serv-ice provided by the vehicle
�� The location and time horizon corresponding to the object of study.
II. SHALL: Report exactly how the parameters for the definition of the functional unit and reference flow have been chosen (e.g. life expectancies, vehicle masses, component masses). The practitioner may use the values given in the CPP or use own values, more specific to the goal of the study. Values and their sources shall be documented and justified appropriately in all cases.
III. SHALL: In LCAs excluding the use phase and not aimed at comparison, the refer-ence flow for components that influence the performance of the vehicle can be related to the component if the component’s properties influencing the vehicle’s performance are quantitatively defined in the functional unit. In this case, provi-sions given in chapter 6.4 of the general ILCD Handbook apply.
IV. SHALL: For components that, due to a lack of influence on the performance of the vehicle, may be analysed separately, the provisions given in chapter 6.4 of the general ILCD Handbook hold.
Guidelines for the LCA of electric vehicles 39
6.3 Life Cycle Inventory modelling framework
The Life Cycle Inventory modelling framework defines two key aspects of the analysis: first, how supply chain processes involved in the production, use, and end-of-life of the product or service under study are depicted; second, the method adopted for solving multifunctionality problems. These aspects are situations in which a process returns several products, making it ambiguous to define how much of its inputs and outputs flow into a specific product within the ensemble. In the following sub-chapters, the basic principles for modelling the Life Cycle Inventory are summarized since clearing the above mentioned aspects is key to planning the implementation of the study. More guidance will also be given in chapter 7.
6.3.1 General Life Cycle Model
As stated previously, this handbook focuses on Situation A and Situation B from the ILCD frame-work, the two cases in which the results of the LCA are aimed at supporting a decision (ILCD 2010). While both cases address the consequences of the decision at the base of the analysis, the extent and nature of the consequences are so different that the life cycle under study, and particularly in regard to the involved supply chains, should be modelled differently.
In Situation A, the decisions that might be derived from the results of the LCA will not influ-ence the infrastructure corresponding to the supply chains supporting the life cycle. Coming back to a previous example, the results of an LCA comparing two brands of electric vehicles and published in a local car magazine may influence a buyer, but ultimately this will not cause a shift in the amount of steel absorbed by the automotive industry for the production of ve-hicles or in the generation of electricity. Overall, in an LCA addressing such a situation, the life cycle can be modelled depicting an average supply chain (if the life cycle requires common resources from a general market such as, for example, steel, without particular characteristics that would require it to depend on more specific products) or a specific supply chain (if, due to particular requirements, products are needed that can be obtained only from specific manu-facturers), without worrying about potential changes deriving from demand-supply mecha-nisms of the market. In short, the life cycle can be modelled as is (be it in reference to today or forecast for a particular time period) or, in other words, as if it was static (ILCD 2010).
In Situation B, the nature and extent of the decisions are such that major transformations in the supply chains involved in the life cycle under study may be caused. An example could be an LCA aimed at identifying the impacts of a substitution of 30 % of medium sized passenger cars in a specific European country with electric vehicles. Clearly, such a large increase in electric vehicle use would have major influences on the generation of electricity required to sustain the vehicles in the use phase, possibly requiring the installation of new electricity plants. Other implications may derive from the end-of-life of these vehicles. Batteries for electric vehicles, for example, typically require large quantities of copper that can be recovered through recycling processes. In such a scenario, these large quantities of recycled (or secondary) copper would now be available to the market. Could that lead to changes in the overall supply chain of cop-per in the production system? These transformations must not only be taken into account, they represent a key part of the analysis. Hence, the life cycle should be modelled depicting

Guidelines for the LCA of electric vehicles40
the supply chains as they are theoretically expected to be in consequence of the analysed de-cision (ILCD 2010). As will be explained in more detail in chapter 7, within the ILCD framework this requires identifi cation of the expected mix of the long-term marginal technologies, mean-ing the mix of technologies that will ultimately result out of the large changes caused by the increased demand or supply.
6.3.2 Multifunctionality
In the analysis of the life cycle of a product, situations may occur in which a specifi c step or process under study will provide several products or services. Such a process is called a multi-functional process. Multifunctionality can occur in production, where a production step may return several products, as well as during end-of-life where a waste treatment service is pro-vided in conjunction with energy generation or a recycled product. Multifunctional processes pose a challenge in the analysis as often only one particular product out of the ensemble is part of the life cycle investigated. The question therefore arises as to how the total inputs and outputs of the process can be associated to the various products. A schematic of such a situa-tion is shown in Figure 4, in which, for example, one might be interested only in the resources, emissions, and waste fl ows of Product A, but only knows the values for the combined produc-tion of A and B. In order to isolate the specifi c exchanges for the product of interest, the multi-functionality must be solved.
Figure 4: Multifunctional process
A typical example can be taken from the production of a vehicle door. A certain amount of steel will be required for its production. However, during manufacturing, part of this steel will, for example due to cutting, not fl ow into the door, but become production scrap. This scrap is a valuable input for the production of recycled steel and is, therefore, a co-product of the production process of the door. Hence, the inputs and outputs that enter the door production process have to be shared between the door and the production scrap.
?
?
Raw materialsEnergy carriers Auxiliaries
Product A
Product B
Emissions
Waste

Guidelines for the LCA of electric vehicles 41
Product A
X%
Y%
X%
Y%
The following hierarchy is defined in ISO 14044 (ISO 14044:2006) and the general ILCD Hand-book (ILCD 2010) to solve multifunctionality cases (Figure 5):
�� The first option is subdivision (including virtual subdivision), (a)�� The second option is system expansion (including substitution), (b)�� The third one is allocation, (c).
(a)
(b)
(c)
Figure 5: Various methods for solving multifunctionality: (a) subdivision (including virtual subdivision), (b) system expansion and substitution, (c) allocation. Based on ILCD 2010
X%
Y%

Guidelines for the LCA of electric vehicles42
In subdivision, the multifunctional process is further analysed with the aim of finding separate sub-processes for products A and B so as to be able to quantify exactly how the inputs and out-puts distribute over A and B. In some cases, an ensemble of sub-processes cannot be found, but it is nevertheless possible to derive a quantitative distribution of the inputs and outputs based on technological knowledge about the production process. In this case, the solution is obtained through virtual subdivision. Subdivision is the preferred option since it is based on technical rela-tionships within the system and, ultimately, leads to a better understanding of the system.
If subdivision is not possible, the second option is system expansion and substitution (b). Here, multifunctionality is solved by creating a new process that approximates one that only returns product A by subtracting or substituting from the combined production of A and B an alterna-tive production of B. Often, other processes need to be added to the system in order to bring product B, which comes out of the multifunctional product, to a state in which the subtraction can take place.
A key factor is what will be the substitute for the not required co-product, and the various ILCD situations are treated differently in this context. In general, for Situation A, in which the study is compatible with a static supply chain, the not required co-function can be substituted with the average market consumption mix of functionally equivalent alternative processes, eliminating from this mix the to-be-substituted product. On the other hand, for Situation B, in those mul-tifunctional processes for which the consequences are very large, the not required co-product must be substituted by the long-term mix expected to follow the taken decision (ILCD 2010).
In this context, it is also important to note that the treatment of waste and end-of-life materials usually leads to multifunctionality situations. While conceptually, system expansion and sub-stitution are applied according to the same principles in these cases, some specific guidance is provided within the ILCD framework. In general11, the avoided primary production of the reused part, recycled good or recovered energy shall be substituted with the simplification of substituting the average primary route market consumption mix of the market to which the secondary good is fed.
It is important to notice that, since this method uses the subtraction of LCI data, negative exchanges and results can occur. This means there can be a net benefit of producing the an-alysed system as the overall impact is more than compensated by the avoided impact the co-products have elsewhere. This is the correct interpretation within the assumptions of the study, even though it can be challenging to communicate (ILCD 2010). It therefore requires particular attention during the reporting of the results.
The last option is allocation, which solves the multifunctionality by splitting up the amounts of the inputs and outputs between the various co-products according to some allocation cri-terion based on their properties. Typical allocation criteria can be: element content, energy content, mass, market price, etc. Say, for example, that mass is used as the allocation criterion. Having two products A and B with mass X and Y, product A would receive X/(X+Y), while prod-uct B would receive Y/(X+Y) parts of the multifunctional process inputs and outputs.
11 In the general ILCD Handbook, special cases are also discussed (see Provisions: 6.5.4)
Guidelines for the LCA of electric vehicles 43
If possible, allocation should be performed in accordance with the underlying causal physical – and, implicitly also covered, chemical and biological – relationships between the different products. This means, for example, that the energy demand for a distillation process needed to separate two products should be allocated to the products according to their influence on the thermal capacity, the boiling temperature, and the evaporation enthalpy of the mixture.
6.3.3 Comparative studies
Scenarios of reasonably best and reasonably worst cases are to be defined for comparative studies and (optionally) for other assumption scenarios within the reasonably best and worst cases. Results for the scenarios have to be reported and taken into consideration when reach-ing conclusions.
Provisions 6.3: Life Cycle Inventory modelling framework (summary of Provisions 6.5.4 of the general ILCD Handbook)
I. SHALL: For Situation A, model the life cycle depicting the existing (or forecast) supply chains.
II. SHALL: For Situation B, model the life cycle depicting the supply chains as they are expected to develop in response to the decision taken.
III. SHALL: Use subdivision as the first choice for solving multifunctionality prob-lems.
IV. SHALL: Use system expansion and substitution if subdivision is not possible.
V. SHALL: When using system expansion and substitution in Situation A, in the gen-eral case, substitution of the not required co-function, as far as possible, with the average market consumption mix of the processes or systems it supersedes, excluding the to be substituted function from the mix. If the to be substituted function has a small share in the overall environmental impact of the market mix, and the results are therefore not relevantly changed, the market mix can be used instead. If this is not possible, alternative processes or systems providing the not required co-function in a wider sense should be used for substitution. For the case of waste and end-of-life treatment, the avoided primary production of the reused part, recycled good or recovered energy shall be substituted.
Guidelines for the LCA of electric vehicles44
As a simplification, it shall be assumed that the avoided primary production corresponds to the average primary market consumption mix of the market to which the secondary good is provided. In Situation B, the same recommenda-tions apply except for processes subject to large changes, for which the practi-tioner shall substitute the not required co-function with the long-term marginal technology mix of the processes or systems it supersedes. The above is a sum-mary of the main concepts involved. The practitioner shall verify with Provisions 6.5.4 of the general ILCD Handbook (particularly, but not only, 'Provisions 6.5.4 – I.a.iv) Cases of multifunctionality – general' and 'Provisions 6.5.4 – I.a.v) Cases of multifunctionality – waste and end-of-life treatment') that the specific case of interest does not fall within one of the special cases described therein.
VI. SHALL: Use allocation if neither subdivision nor system expansion can be ap-plied. Provisions 7.9.3 of the general ILCD Handbook shall be used in this case.
VII. SHALL: For comparative studies of Situations A and B, the main model for each of the compared alternatives shall each be complemented with assumption scenarios of reasonably best and reasonably worst cases. Optionally, further as-sumption scenarios can be defined. Uncertainty calculations shall be performed, unless they have already been used to derive the reasonably best and worst case scenarios. These scenarios later serve as sensitivity checks. The interested parties shall be involved in achieving the best attainable consensus on the definition of the reasonably best and reasonably worst case assumption scenarios (and un-certainty calculations). In Situation A, these can, in principle, vary all data, meth-ods, provisions, and assumptions except for the shall provisions and assump-tions/conventions. It is also recommended that such assumption scenarios and uncertainty calculations be performed for non-comparative LCIs and LCAs. In Situation B, the scenarios and uncertainty calculations can, in principle, vary all data, methods, provisions, and assumptions including the shall provisions and assumptions/conventions of the ILCD Handbook, but not those of ISO 14040 and 14044.
6.4 System boundaries
The system boundaries define which parts of the life cycle and which processes belong to the analysed system, i.e. are required for providing its function as defined by its functional unit. They separate the analysed system from the rest of the technosphere. At the same time, the system boundaries also define the boundary between the analysed system and the eco-sphere, i.e. define across which boundary the exchange of elementary flows with nature takes place (ILCD 2010). Overall, a precise definition of the system boundaries is important to ensure that all processes are actually included in the modelled system and that all relevant potential impacts on the environment are appropriately covered.

Guidelines for the LCA of electric vehicles 45
However, while detailed identifi cation of all the processes within the system boundary can only occur in the LCI phase, the defi nition of the system boundaries must occur in the scope defi nition phase as this clarifi es which key activities will be part of the study and helps when planning the implementation of the study. For this reason, specifi c guidance on which pro-cesses to include in the LCAs of electric vehicles or of their components will be given in chap-ter 7, whereas the defi nition of system boundaries will be treated in the following paragraphs.
6.4.1 Derivation of system boundaries for e-mobility applications and cut-off criteria
System boundaries are defi ned in order to identify the activities which will be included in the analysis, assuming the object of interest functions in normal to abnormal conditions, but not covering the impacts from accidents or similar events (ILCD 2010). When deriving system boundaries for the LCAs of electric vehicles or of their components, two aspects should be taken into account:
�� As already mentioned in 6.2, in most cases, only an analysis addressing an ensemble of components, or even the whole vehicle, and the consequences of possible part-system interactions will return meaningful results, even if the specifi c focus of the analysis is on one specifi c component for electric vehicles.
�� Due to the relevance of impacts from the use phase of a vehicle (and consequently of every component in the vehicle) and considering the large share of valuable materials contained in a vehicle that can be recovered in the end-of-life phase (an aspect in continuous evolu-tion, also from a regulatory point of view; see, for example, Directive 2000/53/EC of the Eu-ropean Parliament on the end-of-life of vehicles) only a complete cradle-to-grave approach, comprising the production, use and end-of-life phases, can really capture all the relevant environmental aspects related to electric vehicles and possible interdependencies.
Hence, the main activities that should be part of the LCA of an electric vehicle are shown in Figure 6 (more specifi c information for each life cycle phase is given in chapter 7).
Figure 6: System boundaries for the LCA of an electric vehicle.
e-CarRaw materialproduction
Production/assembly Infrastructure and auxiliaries
Transport services
Componentsproduction andvehicle assembly
EoL
Recyclingprocess
Secondary good
Disposal treatment
Transport services
InfrastructureEnergy generation
Energy generation
Charging infrastructure
Roadinfrastructure
Energy generation
USE
Guidelines for the LCA of electric vehicles46
It should be noted that the system boundary in Figure 6 is indicated indirectly. As described above, the system boundary describes which processes belong to the analysed system and they therefore separate the analysed system from the rest of the technosphere. At the same time, the system boundary is where the exchange of elementary flows with nature occurs (ILCD 2010). For simplicity, in Figure 6 the key activities within the system boundary for the LCA of an electric vehicle are shown. The exact system boundary can be derived following the supply chain and applying the cause and effect relation to each single activity, until the level of elementary flow exchange is reached. This means that the system boundary implied in Figure 6 includes, for example, the mining of the resources required for the production of raw materi-als as well as the infrastructure required for the mining, or the resources required for building the production and assembly facilities.
Of course, different processes within the life cycle of a vehicle or of a component will have dif-ferent relevance in terms of the overall impact. Processes that are irrelevant to the total impact can be completely cut-off in order to be able to invest more time and resources in the model-ling of elements that have high relevance. However, an estimate of the impacts potentially neglected by these cut-offs has to be done in order to ensure they really are insignificant. This implies that a process can only be cut-off after it has been considered and found negligible. This paradox can be resolved through the iterative nature of LCA and by reaching an estimate of 100 % impact coverage using worst-case data set approximations (which can be compiled with less effort compared to a high quality data set) for those data sets which are expected to be not relevant in the overall system. During the first iteration, the study would mainly com-prise high quality data for the (expected) relevant processes and approximations for the minor ones. Based on this first analysis, and by analysing the percentage contributed by all processes, some of the supposed minor ones might turn out to be more important than expected and require being included with a proper, complete, and high quality data set. By repeating these iterations, a reasonable estimate of the 100 % impact can be obtained by using high quality data for relevant and low quality approximation data for not relevant processes, the latter of which may be cut-off. This allows a rough quantification of the % contribution of the cut-off processes. The above mentioned procedure has to be repeated, until the % of impact from the cut-off processes is small enough with respect to the goal of the study.
Provisions 6.4.1: Derivation of system boundaries for e-mobility applications and cut-off criteria
I. SHALL: In general, even if the focus of the study is on a specific component, the LCA shall be extended to other components (possibly the entire vehicle) that are affected by part-system interactions using a cradle to grave perspective. If a different approach is used (analysis of isolated component and/or elimination of specific life cycle phases) due to particular goal and scope requirements, then the reasons for this must be explained, justified, and documented.
II. SHALL: Focus on normal or abnormal behaviour but not include accidents or similar events (ILCD 2010).

Guidelines for the LCA of electric vehicles 47
III. SHALL: Include within the system boundaries all the relevant activities required for the accurate description of the life cycle under analysis. This shall include, among other things:�� Extraction, refining, and production of raw materials including the required
infrastructure�� Energy generation and the respective infrastructure�� The component and/or vehicle manufacturing and assembly facilities
(manufacturing equipment, buildings, etc.,)�� The component and/or vehicle recycling and disposal, including the re-
quired infrastructure (recycling and/or disposal equipment, buildings, etc.,)
�� The transport services required throughout the life cycle�� The road and charging infrastructure required for the use phase of the vehicles
IV. SHALL: Quantify and document the cut-off criteria chosen for the goal of the study. The chosen cut-off criteria shall be considered with respect to all environ-mental impacts included in the study as well as energy and mass.
6.5 Preparing the basis for the impact assessment
During the Life Cycle Impact Assessment phase, the LCI result is used to calculate an ensemble of indicators that establish a base for the interpretation of the environmental impacts associ-ated with the object of the study. To date, a number of established LCIA methods for various environmental impacts are available in the literature or directly in LCA software, and are com-monly used in LCA studies. The choice of what is covered by the LCIA shall be made during scope definition in order to ensure that relevant and matching data is then collected in the LCI phase. Hence, the key aspects required for addressing this topic during scope definition are given here, while further information is given in a dedicated chapter 8.
Overall, the first step in LCIA is to classify LCI results into impact categories and to evaluate (characterize) the impacts of the LCI results through models of environmental mechanisms within these impact categories. The results of the characterizations are indicators associated with specific environmental aspects. The following impact categories shall be checked by de-fault for relevance to the study (ILCD 2010): Climate change, (Stratospheric) Ozone depletion, Human toxicity, Respiratory inorganics, Ionizing radiation, (Ground-level) Photochemical ozone formation, Acidification (land and water), Eutrophication (land and water), Ecotoxicity, Land use, Resource depletion (metals, minerals, fossil, nuclear and renewable energy sources, water).
The impact categories can then be further processed into the three areas of protection (ILCD 2010):
�� Human Health�� Natural environment�� Natural resources

Guidelines for the LCA of electric vehicles48
Typically, impact categories are also called midpoints, while the three areas of protection are referred to as endpoints. The exact types and numbers of impact categories taken into ac-count in a study can vary, depending on its goal and scope. Figure 7 shows a summary of the LCIA framework within the ILCD (ILCD 2010).
Figure 7: LCIA framework within the ILCD (ILCD 2010).
Two other aspects of LCIA are normalisation and weighting, which are optional steps sometimes used to support interpretation. In normalisation, the indicator results for the diff erent midpoint level impact categories or endpoint level damages are expressed relative to a common refer-ence by dividing the indicator results by the respective reference value. As reference values, the impact or damage results of the total annual territorial elementary fl ows in a country, region, continent, or globally (or per citizen, i.e. per capita) are typically used (ILCD 2010). The choice of the reference system for normalization can signifi cantly infl uence the LCIA results and is often not straight forward. Since diff erent impact categories might be dominated by emissions from diff erent regions, a choice needs to be made and has to be justifi ed carefully. For example the production of platinum releases large amounts of SO2 and is restricted to mainly two sites glob-ally (Russia and South Africa). If an LCIA result in the impact category ‘acidifi cation’ is dominated by the emissions from platinum production, it would probably not be sensible to use a normali-zation factor for, e.g. Switzerland, where the SO2 from the platinum production will not have any impact and acidifying emissions in general are rather low. It thus has to be borne in mind that this choice is intrinsically always arbitrary. In weighting, the (typically normalised) indicator results for the diff erent impact categories or damages are each multiplied by a specifi c weight-ing factor that is intended to refl ect the relative relevance of the diff erent impact categories / category endpoints among each other. It is to be emphasised that weighting factors are intrin-sically always normative/subjective and refl ect value assumptions (ILCD 2010).
It is outside the scope of these guidelines to detail how the various impact categories and areas of protection can be calculated or how to implement normalisation and weighting. For more information on the background of LCIA, the reader is referred to the ISO technical report
Human Health
Hum
an to
xici
ty
Acid
ifi ca
tion
Radi
atio
n
Eutr
ophi
catio
n
Carc
inog
ens
Ecot
oxic
ity
(fres
hwat
er, m
arin
e, te
rres
tria
l)
Resp
irato
ry in
orga
nics
Sum
mer
sm
og
Clim
ate
chan
ge
Land
-use
Ozo
ne la
yer
Reso
urce
dep
letio
n
Natural environment
NOx, Cd, CO2, CH4, dioxins, hard coal, silver from ore, land use, ...and other emissions and resource fl ows
Natural resources Area of Protection
Inventory
Midpoints
EndpointsResource scarcityDamage to ecosystem diversity
Damage to human health
Envi
ronm
enta
l mec
hani
sm
(inpa
ct p
athw
ay)
Guidelines for the LCA of electric vehicles 49
on LCIA (ISO 14047:2003), the general ILCD Handbook (chapters 6.7 and 8), to two specific ILCD documents:
�� 'Framework and requirements for Life Cycle Impact Assessment (LCIA) models indicators'�� 'Recommendations for Life Cycle Impact Assessment in the European context'
and other LCIA specific references that can be found on the website of the ILCD platform: http://lct.jrc.ec.europa.eu/assessment/publications.
Particularly in Chapter 6.7 of the general ILCD Handbook, general guidance can be found on how to address, among other things, inclusion of non-standard impacts and non-standard elementary flows, spatial and other differentiation or modification of impact factors, and deal-ing with missing flows, etc. Here, the topic is mainly how to choose LCIA methods.
In the context of electric vehicles (and of conventional ones, as well, since comparisons be-tween the two technologies are often the object of LCAs), the large variety of different pro-cesses involved makes it difficult to suggest a sub-ensemble from the impact categories listed above. Worse, since road transport significantly contributes to environmental noise, which is a major environmental concern at least in developed regions, this impact category should also be added to the list. Also, all three protection areas should be covered in the analysis12 in order to avoid the unintended shifting of burdens.
Overall, LCIA methods should be chosen whose models are scientifically and technically valid and which are internationally accepted. As far as possible, LCIA methods which cover all im-pact categories consistently should be preferred to a set of methods that do not follow the same principles. If, due to the particular goal and scope of the study, only a selection of impact categories is chosen, then this must be documented appropriately, as also discussed in chap-ter 5.2 ‘Method, assumption and impact limitations’.
Below, the provisions concerning the preparation of the basis for the impact assessment are presented. First, a general reference to the corresponding provisions of the general ILCD Hand-book is made. Some of these are repeated here and, occasionally, modified. When this is the case, this is indicated and the version presented here shall be assumed as valid.
Provisions 6.5: Preparing the basis for the impact assessment
I. SHALL: Refer to provisions 6.7 ‘Preparing the basis for the impact assessment’ in the general ILCD Handbook.
12 During the first eLCAr workshop, general agreement was expressed that all relevant issues should be included in the analysis, where relevancy was defined as those indicators that show large differences between the compared technologies. The use of single-score indicators was also discussed. While some participants described such indicators as useful, it was remarked that ISO 14044 forbids these methods in comparative assertions intended to be disclosed to the public and that the use of single score methods alone was not an option for any LCA.

Guidelines for the LCA of electric vehicles50
II. SHALL (Modified compared to provisions 6.7 of the general ILCD): Analyse by default the following impact categories and provide characterization factors on midpoint level. It is recommended that these are also used to derive category endpoint factors that are coherent with the midpoint level and that cover all rel-evant damages to the three following areas of protection (ILCD 2010):
Impact categories (midpoint level) [ISO!]:�� Climate change�� (Stratospheric) Ozone depletion�� Human toxicity�� Respiratory inorganics�� Ionizing radiation�� (Ground-level) Photochemical ozone formation�� Acidification (land and water)�� Eutrophication (land and water)�� Ecotoxicity�� Land use�� Resource depletion (metal ores without uranium, uranium ore, other min-
erals, fossil fuels (including peat) energy from water, energy from biomass, energy from other renewable source, water,…)
Category endpoints (ILCD 2010) [ISO!]:�� Damage to human health�� Damage to ecosystem�� Depletion of natural resources
III. SHOULD: If possible, noise impacts should also be analysed, especially if vehicles with different sound emission profiles are compared. Noise impacts can be evalu-ated on midpoint level and the contribution to the human health endpoint can be assessed.
IV. SHALL: If only a sub-set of impact categories is analysed (e.g. Carbon footprint studies), due to the particular goal and scope of the study, then this must be doc-umented, considered during interpretation, and reported accordingly. This ll al-ready be mentioned in the 'Method, assumption and impact limitations' section.
V. SHALL: Distinguish between renewable and non-renewable resources in the anal-ysis of energy resource depletion.
VI. SHALL: Avoid the use of single score methods for comparative studies that are to be disclosed to the public. Avoid the exclusive use of single score methods for all studies.
Guidelines for the LCA of electric vehicles 51
6.6 Technological, Geographical and Time-related scope and data representativeness
During scope definition, technological, geographical and time-related constraints must be identified and declared. This will help the practitioner to plan data collection and to identify the correct data sources.
A key concept in this context is the one of data representativeness. The results of an LCA will only comply with the goal and scope of the study if the environmental impacts have been derived through data that also complies with the goal and scope of the study. This aspect is taken into account through the representativeness of the data, meaning how well the col-lected inventory data represents the true object under study (ILCD 2010). In order to be able to identify the most representative data for the study (meaning for the overall system as well as the sub-processes within), it is necessary to define what its main technological, geographical and time-related characteristics are.
Technological, geographical and time-related scope delimitations are 3 slightly different, but very intertwined, concepts. In terms of LCI data modelling, technological representativeness describes how well the collected data for a process actually represents its true technological or technical characteristics. In the context of transport studies, a typical example could be the comparison of different engine technologies. Say a study is interested in comparing the environmental impacts of two current, best-in-class passenger cars, the first a BEV, the second an ICEV with a petrol engine. The technology level for these vehicles would be state of the art and the data describing it in an LCA would need to reflect those technologies. Evaluating the impacts deriving from the emissions in the use phase of the ICEV using data for a EURO 3 engine, for example, would mean using data that is not representative of today’s state of the art engine technology.
This holds not only for the overall system, but also for the sub-processes used to build the system. E.g. using technical quality silicon instead of chip-grade silicon for the processors to analyse the production of an electronic component is likely to lead to unreliable results.
For geographical representativeness, the focus is on the influences that local characteristics can have on the LCI. The choice of the electricity mixes is just one example that is particularly relevant in the context of electric vehicles. If a study in the decision context A is set in France, then the impacts deriving from electricity production in the use phase will depend on the specific electricity generation technologies used in France and on the imported electricity. An average European electricity mix would not be representative in that case. The same holds for data describing the production of the materials used for the production of the vehicle or component imported from other countries. Typically, the same item produced in different countries may lead to different environmental impacts due to different technologies used. All this must be considered during the LCI phase.
Similar aspects are related to time representativeness. The inventory of a process or system that is to represent a certain time context (for a present or near future situation, e.g. 2025, or for a baseline past scenario, e.g. 1990) is to be based on data that appropriately represents that

Guidelines for the LCA of electric vehicles52
declared time. Clearly, the strong link between technological and time representativeness is particularly evident here, since technologies which may be state of the art today, may be ob-solete tomorrow.
In this context, a key element is also representativeness with respect to the validity of the study. If a study with a clear focus on validity compares two current technologies based on a limited time period (e.g. comparison of two products already on the market), the most recent data describing the two technologies would be the most representative choice. If, instead, a study aimed at addressing scenarios which may have a long duration (e.g. strategic decisions which may lead to the building of infrastructure with a lifetime of 30 years), considerations for how technological developments over the period might influence the data must be made.
Overall, the practitioner can plan data collection effectively only if constraints due to technolog-ical, geographical, and time-related representativeness are defined during scope definition.
Of course, during the LCI phase it may turn out that some desired level of data representa-tiveness may not be reached due to lack of data and some less representative data has to be used. This is only acceptable if the results, interpretation, and conclusions of the study are not significantly affected and appropriate documentation is submitted. If there is a relevant influ-ence on the results due to a possible inappropriate choice of data, then this has to be clearly documented and taken into account in the interpretation and reporting phase.
Below, key provisions on representativeness are given that are essential for planning the de-velopment of the study. More information on this topic will be given in chapter 7.1.1.3 ‘Plan-ning data collection’.
Provisions 6.6: Technological, Geographical and Time-related scope and data representativeness
I. SHALL: Clearly define the required technological representativeness of the data concerning the main object of the study (e.g. current technology, future tech-nology). Starting from the identified representativeness for the overall system, the specific representativeness for each sub-process of the system shall be then identified during the LCI phase.
II. SHALL: Clearly identify the required geographical representativeness for the data concerning the main object of the study (e.g. specific nation, Europe). Starting from the identified representativeness for the overall system, the specific repre-sentativeness for each sub-process of the system shall be then identified during the LCI phase (e.g. main object produced in a specific European nation, but some raw materials imported from other countries).
III. SHALL: Clearly identify the required time-related representativeness for the data concerning the main object of the study (e.g. past, current, near future). Further, the temporal validity of the data shall also be consistent with the goal and scope of the study.

Guidelines for the LCA of electric vehicles 53
IV. SHALL: If, during the LCI phase, it occurs that some aspects of representativeness cannot be satisfied then this shall be documented. Particularly, if the lack of rep-resentativeness relevantly affects the computed environmental impacts then this shall be addressed in the interpretation, conclusions and recommendations of the study. The practitioner shall not allow that the use of less representative data disfavours any competitors’ products in particular (ILCD 2010).
6.7 Comparison between systems
Throughout this chapter, a number of specific recommendations on various topics have been given in the context of comparative LCA studies and, in particular, comparative studies intend-ed to be disclosed to the public. Due to the impacts that the findings from such studies can have on stakeholders (building of new infrastructure, influence on markets, etc.) the key as-pects of comparisons of systems are here summarized again. ISO distinguishes between com-parative assertions’ and comparisons (ISO 14044:2006). The first implies a precise assertion of the superiority or equivalence of one system with respect to the other. The latter only presents the results for the two systems without making a specific assertion. Since the assertion may often be directly derived from the results, even if it is not clearly stated, the recommendations presented here shall be considered valid for both types of studies.
6.7.1 Functional unit, considered alternatives and assumptions
Overall, in defining the details of a study addressing the comparison of two alternatives, the issue of consistency is at the core of a meaningful and (as much as possible) fair end result. This must first be taken into account when considering what to compare. Consistency here means the equivalence of the functional unit of compared alternatives and the non-misleading selec-tion of the compared alternatives (ILCD 2010).
As two examples, in the context of equivalence of functionality, the comparison of a small city car designed for short urban trips with a large family car suitable for long distances is problem-atic since these two objects are clearly designed for two different functions and are (or, at least should be!) used in different situations. In terms of consistency of alternatives, when compar-ing a BEV with an ICEV, after making sure that for each technology a similar vehicle type is chosen, the same technological level should be used for the two alternatives. It would not be consistent to compare a prototype, emission optimized Euro 6 ICEV with a BEV equipped with a lead acid battery and an electric motor and power electronics that have low efficiencies.
Of course, particularly in the comparison of various products within the same technology, there are studies in which the goal and scope are intended to address exactly these points (for example, differences caused by a change in the level of technology or the quality of materi-als) and this shall then be clearly documented and taken into account in the interpretation phase.

Guidelines for the LCA of electric vehicles54
In any case, in the inclusion or exclusion of compared alternatives, it should be ensured that the comparative assertion (or the simple comparison) is not misleading by leaving out existing or even widely used alternative products that have clear superior environmental qualities than the compared alternatives (ILCD 2010).
Similarly, the choice of scenarios and assumptions shall be done such that none of the alter-natives is thereby favoured with respect to the others. In the choice of scenarios, this requires incorporating the application context as part of the functional unit, as it may cause products with the same general functional unit to perform differently: e.g. a use phase comparison of a hybrid vehicle with its internal combustion engine and propulsion battery plus electric motor to a conventional vehicle with only an internal combustion engine will yield different results if only urban, short distance operation, or only long-distance highway operation, is taken into account. In the definition of scenarios, the influence of particular operation patterns must be considered carefully. Hence, first, the general technical specification of such products needs to be transformed into a functional unit that considers the average or specific operational conditions of the product. Please note, however, that for comparative assertions that will be published, the choice of a specific application context may fulfil the criteria for a misleading goal definition, e.g. by using very unusual application contexts. Studies that look into atypical or otherwise specific scenarios shall highlight this fact visibly in the interpretation, including when drawing conclusions and giving recommendations, as well as in the executive summary (ILCD 2010).
The same applies to the assumptions made in the development of the scenarios. Even though this holds for all assumptions in the study, a key topic is the one of durability. Cars and their components have life times which can typically be expressed in km or in years. When in the life cycle of a system the various components have different lifetimes, a substitution or main-tenance strategy must be defined. In the definition of the various lifetimes and of the substitu-tion or maintenance strategies, the alternative object of comparison must be treated equally.
6.7.2 Methodological and data consistency
Consistency is also required in the methods and data used for the two alternatives (ILCD 2010). In the choice of, among other things, system boundaries, data representativeness, data qual-ity, cut-off criteria, LCI modelling, and LCIA methods, the same principles need to be adopted for the various alternatives so that no misleading bias is produced.
In the context of LCIA methods, it has to be remembered that the ISO and ILCD framework define special requirements for the choice and coverage of impact categories for comparative studies intended to be disclosed to the public. This is in order to avoid drawing conclusions on the environmental superiority or equivalence of one alternative with respect to the other with-out having analysed all relevant environmental impacts. Comparisons based on only selected indicators or impact categories (e.g. carbon footprint studies) should be avoided. Studies that choose to limit the analysis to selected impact categories shall highlight in the interpretation, conclusions and recommendations that the comparison is not suitable to identify environ-mentally preferable alternatives.

Guidelines for the LCA of electric vehicles 55
6.7.3 Scenarios in support of comparisons
Assessments of reasonably best case, most likely case, and reasonably worst case scenarios (plus optionally other scenarios) shall be performed for comparison of systems; data and method assumptions should be varied to investigate the robustness of the results (ILCD 2010). Such scenarios support the later interpretation of results. For comparative, micro-level deci-sion support studies (i.e. Situation A), examples for such method and data assumptions are inventory data values, parameters, relevant flow properties, relevant system properties and aspects of the functional unit, and also method assumptions including approaches such as the mix of substituted process used in system expansion, allocation criteria, and the like; the shall provisions shall still be met however.
Uncertainty calculations shall be used to support the comparison of systems, especially to identify whether differences can be considered significant or too small to justify the superi-ority of one system over the other (ILCD 2010). For comparative meso/macro-level decision support studies (i.e. Situation B), a more extensive use of scenarios is necessary to ensure that the decision support is robust. In contrast to Situation A, in Situation B, and here exclusively for assumption scenarios, the shall provisions of this document can be changed.
The choice of which parameters are used in the definition of the best, most likely, or reason-ably worst case scenarios, of course, depends on the precise object of the study and on its goal and scope. In the context of passenger cars, examples of parameters which could be suitable are vehicle consumption, vehicle life expectancy, battery life expectancy, efficiencies of the components used in the system, recycling rates, etc. For some studies the availability of materials could be an issue that requires scenario analysis. Again, it is up to the practitioner to understand which parameters are crucial for the results of the study and should be verified through best, expected, and worst case analysis.
In the development of the scenarios, a close collaboration with interested parties should be pursued in order to achieve the best possible consensus.
Since most of the recommendations on comparisons concern general aspects of LCA, the reader is referred to the provisions of the general ILCD Handbook.
Provision 6.7: Comparison between systems
I. SHALL: Apply all provisions reported in box “6.10 'Comparison between systems' from the general ILCD Handbook.
Guidelines for the LCA of electric vehicles56
6.8 Identifying critical review needs
A critical review is an independent analysis of the LCA which can help identify errors, prob-lems, inconsistencies, etc., concerning all aspects of the study. A critical review is mandatory for comparative studies intended to be disclosed to the public, but is also beneficial for in-house applications since, overall, critical reviews can enhance the quality, credibility, and value of the study (ILCD 2010).
Various types of review requirements exist that depend on the goal, scope, and decision con-text of the study. It is useful, already during scope definition, to decide whether a critical re-view will be done, and, if so, which form of review, and performed by whom. This early decision will allow the data collection, documentation and reporting of the LCI/LCA to be tailored to meet the requirements of the review, typically lowering the overall effort. Hence, the key as-pects required for addressing this topic during scope definition are given here while further information is given in a dedicated chapter.
Specific guidance on the appropriate review schemes in the ILCD framework is given in the document ‘’Review schemes for LCA’’. The minimum requirements on reviewer qualification are, given in the separate document ‘’Reviewer qualification’’. Both documents can be found in the ‘publication’ section of the ILCD framework internet site: http://lct.jrc.ec.europa.eu/assess-ment/publications.
Provisions 6.8: Identifying critical review needs
I. SHALL: Identify in the scope definition whether a critical review shall be per-formed and if so (ILCD 2010) [ISO!]:
a) Review type: Decide along the provisions of the separate document “Re-view schemes for Life Cycle Assessment (LCA)” which type of review is to be performed as minimum.
Note that an accompanying review can be beneficial. For Situation B, it can moreover help to organise the best attainable consensus among interested parties, which is required for certain scope decisions (see provisions of chapter 6.5.4).
b) Reviewer(s): It is recommended to decide at this point who is/are the reviewer(s). The minimum requirements on reviewer qualification are given in the separate documents 'Reviewer qualification'.

Guidelines for the LCA of electric vehicles 57
6.9 Planning reporting
The report is a vital element of any LCA. Without clear and effective documentation for experts and communication to decision makers, LCAs can result in erroneous and misleading use and will not contribute to improving environmental performance. Reporting shall be objective and transparent, there shall be a clear indication of what has and has not been included in the study, and which conclusions and recommendations the outcome of a comparative study supports.
Various types of reporting solutions exist and how to address the report should be decid-ed during scope definition in order to ensure that the required documentation is collected throughout the project. Hence, the key aspects required for addressing this topic during scope definition are given here, while further information is given in a dedicated chapter.
The form and levels of reporting depend primarily on three factors (ILCD 2010):
�� the type of deliverable(s) of the study, �� the purpose and intended applications of the study and report, and �� the intended target audience (especially technical or non-technical, and internal, third-
party, and/or the public).
Next to the general purpose reports that will be sketched in this chapter, the various applica-tions of LCA may have their own, specific forms of reporting (e.g. Environmental Product Dec-larations (EPDs) or the reporting of indirect effects in Environmental Management reports con-cerning sites or companies, etc.). These will not be addressed in this document as they are out of its scope. Please refer to the respective application to identify the specific reporting needs.
Forms of reporting
Three principally different forms of reporting are relevant, and are often also used in combina-tion (ILCD 2010):
�� a classical detailed project report, i.e. an often comprehensive text document, typi-cally with graphics and tables, that provides all relevant details, e.g. on the analysed system(s) or developed LCIA methods, and the project in which the work was done. It is directed at LCA experts, but should contain an executive summary for non-technical audiences. The full report provides detailed documentation about the system (or LCIA methods), its modelling, the assumptions and – especially in the case of compara-tive assertions – the interpretation, including conclusions and recommendations, if any. Confidential information can be documented in a separate, complementary re-port that is not published, but made available only to reviewers under confidentiality agreements. If the detailed report is used for third party information, it shall contain a reference (preferably a hyperlink) specifying where any related review reports can be easily accessed.
�� a more condensed, formalised, and electronically exchangeable report in the form of a data set. A data set is suitable for documenting individual unit processes or systems (as a process data set), but not for documenting the outcome of comparisons. It is also suitable for LCIA methods (LCIA method data set). This form is also directed toward

Guidelines for the LCA of electric vehicles58
LCA experts, mainly as data input for use in other LCA studies. As an electronic data set, it allows other users to import the inventory and other technical details without manual transfer of values into their LCA software, thus limiting errors and enabling direct use of the inventory data (or impact factors) for modelling and analysing their own systems.
�� a very condensed Executive Summary report of, e.g. 1 to 2 pages, that condenses the detailed project report to its essence in non-technical language. Note that this report is the one that should also be used in the detailed project report. If it is used as a separate report for third-party information, it shall contain a reference (preferably a hyperlink) specifying where the detailed report and all related review reports can be easily accessed.
Whenever the final output of the study is a data set, or when data sets are developed and should remain available for subsequent use, the most useful way of reporting is to combine a well-doc-umented process data set or LCIA method data set (being a condensed version of the detailed report), the detailed report, and any review reports as an electronic attachment to that data set.
Levels of reporting
Three levels of reporting should be distinguished (ILCD 2010): �� reports or data sets for internal use, �� reports or data sets for external use (i.e. to be made available to a limited, well defined list
of recipients with at least one organisation that has not participated in the LCI/LCA), and �� comparative assertion reports that are to be made available to the (non-technical) public.
More details on the different levels of reporting and the specific requirements for each of them are presented in the ‘Reporting’ chapter.
Provisions 6.9: Planning reporting (based on Provisions 6.12 of the general ILCD Handbook)
I. SHALL: Identify in the scope phase (and based on the goal, scope and intended audience of the study) which form of reporting shall be used: [ISO!]a. Detailed reportb. Data setc. Data set plus detailed reportd. Non-technical executive summary
II. SHALL: Identify in the scope phase (and based on the goal, scope and intended audience of the study) which level of reporting shall be used:a. Internalb. External (but limited, well defined recipients)c. Third-party report, publicly accessibled. Report on comparisons, publicly accessible.

Guidelines for the LCA of electric vehicles 59
6.10 Scope definition example13
The practitioner in charge of realising the study described in 5.8 ‘Goal definition example’ must now define the scope of the study. As decided in the goal definition, the comparison between the two battery types will be made on the basis of the vehicle produced by the key customer of the company (Customer X). This vehicle weighs (without battery) 1 200 kg and is designed to have a range of 120 km and a life expectancy of about 240 000 km. While the life expectancy for battery type A is known to be 240 000, the one for battery type B is estimated to be around 180 000 km. Further, since these systems would be used in the near future, the time scope is set for the years 2012-2022. Taking all these factors into account, the practitioner defines the following functional unit and reference flow:
Functional unit: 240 000 km driving in compact car of 1 200 kg without battery mass, fuelled with average European electricity generated between 2012 and 2022, using bat-tery A or B such that either allows a range of 120 km per charge in real world driving.
Reference flow: Driving 1 km in an electric compact car of 1 200 kg (without battery mass), a life expectancy of 240 000 km, operation in Europe between 2012 and 2020, and battery A (B) such that it allows a driving range of 120 km per charge in real world driving.
The practitioner then addresses the issues of the Life Cycle Modelling framework:
Supply chains: Having realised that the comparison falls within Situation A, the prac-titioner prepares for data collection, which will require depicting existing or forecast supply chains involved in the production of the systems.
Multifunctionality: Remembering the ISO hierarchy for solving multifunctionality, the practitioner recognizes the need to also collect data regarding the treatment of co-products in multifunctional systems. This is in case multifunctionality cannot be solved through subdivision and needs to be addressed with system expansion and substitu-tion. In case that system expansion should also not be possible, he prepares to define an allocation strategy and to collect the required data, should it be needed.
Scenarios: Based on his knowledge of the battery technologies under study, the prac-titioner identifies two key parameters that can fluctuate in the new type of battery (B): effective energy density and lifespan. For each, a parameter fluctuation of, respectively, ±10 % and ±20 % can be expected. The exact values will depend on the optimization of the production process. The practitioner defines the positive shifts as favourable (since, in the case of energy density, a lower amount of battery would be needed while, for battery lifespan, a more reliable system would be produced. The practitioner therefore
13 The numbers presented in the examples have been invented for didactical purposes.

Guidelines for the LCA of electric vehicles60
decides to analyse worst case scenarios with -10% energy density and -20% life expect-ancy and best case scenarios with +10 % and +20 %, including all possible combinations: (-10 %, -20 %); (-10 %, 0 %); (0, -20 %); (0 %, 0 %); (+10 %, 0 %); (0%, +20 %); (+10 %, +20 %). The practitioner decides to include the scenarios with 20 % lower energy density for the new battery even though this would mean that the development goal of a significantly improved energy density in battery B over battery A would not have been achieved. In-clusion, however, is justifiable since battery B should also be economically preferable to battery A and might be used even if the increase in energy density is not achieved.
The subsequent steps concern system boundary definition, LCIA methods and repre-sentativeness:
System boundary: The practitioner opts for a full cradle-to-grave approach without fixed cut-off criteria relative to the overall battery mass. He decides to include every-thing he, as an expert on batteries, is aware of.
LCIA methods: As already defined in the goal phase, the practitioner limits the analy-sis to the Carbon Footprint due to the strong scoping nature of the study. He is aware that a comparison on this basis must not be published, is not suitable for identifying environmentally preferable alternatives, and that the scope needs to be expanded if the carbon footprint shows favourable results for battery B.
Technological, Geographical and Time-related scope and data representative-ness: The study addresses current technologies of high quality (both for the vehicle as well as the batteries) that are supposed to be suitable for the market between 2012 and 2022. The vehicle is assembled in Europe and designed for that market although various components are manufactured in other countries and are then shipped in.
After having verified that all special recommendations for the comparison of systems have been respected, the practitioner finally identifies the review and reporting needs:
Critical Review needs: The study is intended for a technical and internal audience (the research and development unit of the company). As such, there is no need for a critical review of the study. However, to verify the correctness of the study, the practitioner decides he will submit the study to an independent external review.
Reporting: The form of an internal detailed report and the unit process data sets are chosen in order to give as much information as possible for subsequent decisions by the company and to prepare for a potential subsequent LCA that is not limited to car-bon footprint.
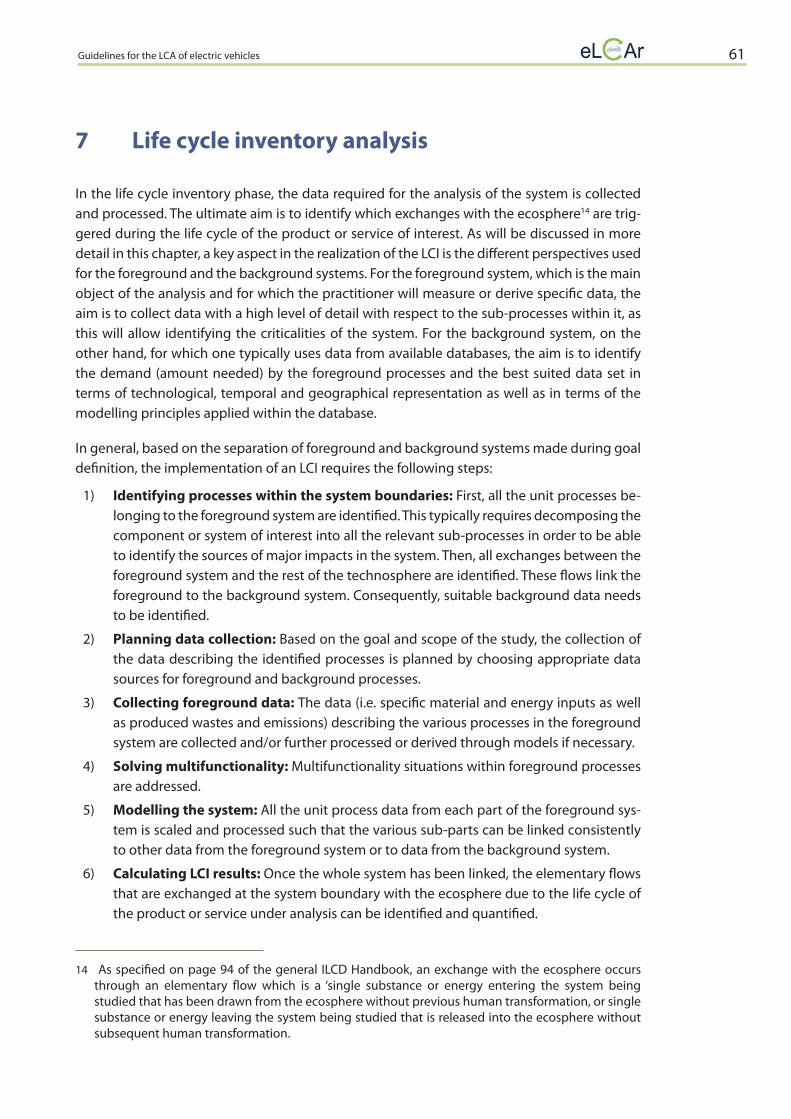
Guidelines for the LCA of electric vehicles 61
7 Life cycle inventory analysis
In the life cycle inventory phase, the data required for the analysis of the system is collected and processed. The ultimate aim is to identify which exchanges with the ecosphere14 are trig-gered during the life cycle of the product or service of interest. As will be discussed in more detail in this chapter, a key aspect in the realization of the LCI is the different perspectives used for the foreground and the background systems. For the foreground system, which is the main object of the analysis and for which the practitioner will measure or derive specific data, the aim is to collect data with a high level of detail with respect to the sub-processes within it, as this will allow identifying the criticalities of the system. For the background system, on the other hand, for which one typically uses data from available databases, the aim is to identify the demand (amount needed) by the foreground processes and the best suited data set in terms of technological, temporal and geographical representation as well as in terms of the modelling principles applied within the database.
In general, based on the separation of foreground and background systems made during goal definition, the implementation of an LCI requires the following steps:
1) Identifying processes within the system boundaries: First, all the unit processes be-longing to the foreground system are identified. This typically requires decomposing the component or system of interest into all the relevant sub-processes in order to be able to identify the sources of major impacts in the system. Then, all exchanges between the foreground system and the rest of the technosphere are identified. These flows link the foreground to the background system. Consequently, suitable background data needs to be identified.
2) Planning data collection: Based on the goal and scope of the study, the collection of the data describing the identified processes is planned by choosing appropriate data sources for foreground and background processes.
3) Collecting foreground data: The data (i.e. specific material and energy inputs as well as produced wastes and emissions) describing the various processes in the foreground system are collected and/or further processed or derived through models if necessary.
4) Solving multifunctionality: Multifunctionality situations within foreground processes are addressed.
5) Modelling the system: All the unit process data from each part of the foreground sys-tem is scaled and processed such that the various sub-parts can be linked consistently to other data from the foreground system or to data from the background system.
6) Calculating LCI results: Once the whole system has been linked, the elementary flows that are exchanged at the system boundary with the ecosphere due to the life cycle of the product or service under analysis can be identified and quantified.
14 As specified on page 94 of the general ILCD Handbook, an exchange with the ecosphere occurs through an elementary flow which is a ‘single substance or energy entering the system being studied that has been drawn from the ecosphere without previous human transformation, or single substance or energy leaving the system being studied that is released into the ecosphere without subsequent human transformation.
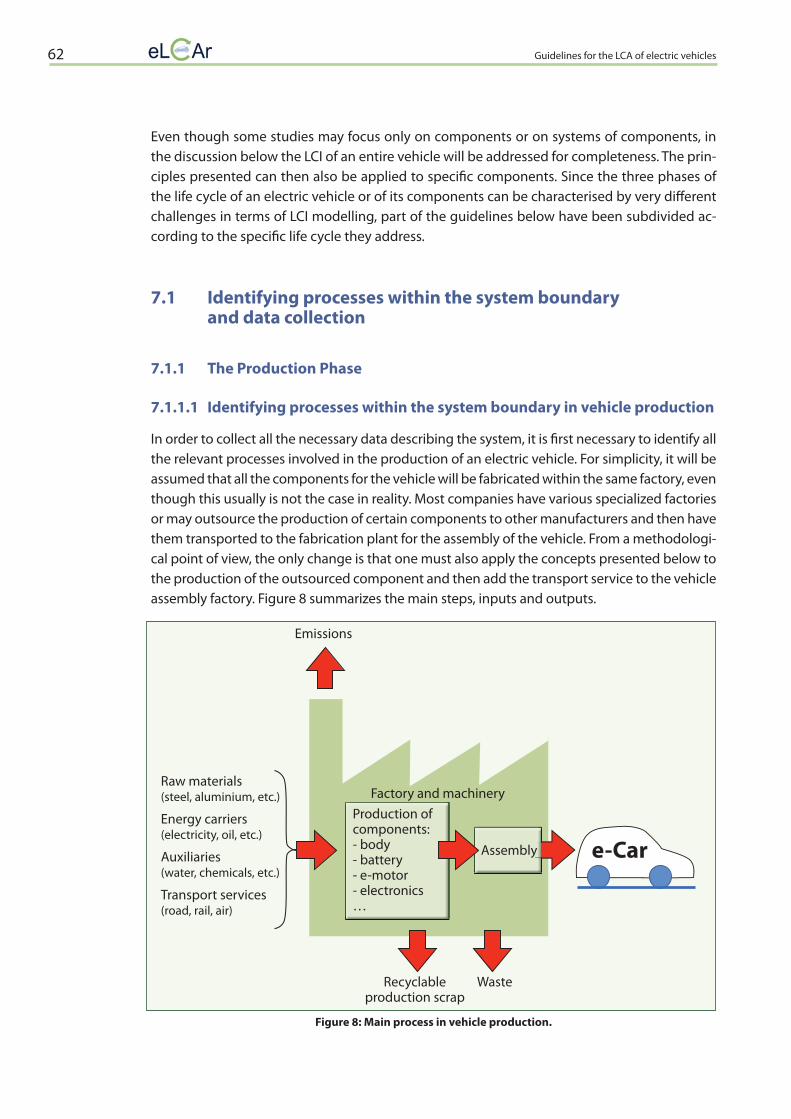
Guidelines for the LCA of electric vehicles62
Even though some studies may focus only on components or on systems of components, in the discussion below the LCI of an entire vehicle will be addressed for completeness. The prin-ciples presented can then also be applied to specifi c components. Since the three phases of the life cycle of an electric vehicle or of its components can be characterised by very diff erent challenges in terms of LCI modelling, part of the guidelines below have been subdivided ac-cording to the specifi c life cycle they address.
7.1 Identifying processes within the system boundary and data collection
7.1.1 The Production Phase
7.1.1.1 Identifying processes within the system boundary in vehicle production
In order to collect all the necessary data describing the system, it is fi rst necessary to identify all the relevant processes involved in the production of an electric vehicle. For simplicity, it will be assumed that all the components for the vehicle will be fabricated within the same factory, even though this usually is not the case in reality. Most companies have various specialized factories or may outsource the production of certain components to other manufacturers and then have them transported to the fabrication plant for the assembly of the vehicle. From a methodologi-cal point of view, the only change is that one must also apply the concepts presented below to the production of the outsourced component and then add the transport service to the vehicle assembly factory. Figure 8 summarizes the main steps, inputs and outputs.
Figure 8: Main process in vehicle production.
Raw materials(steel, aluminium, etc.)
Energy carriers(electricity, oil, etc.)
Auxiliaries(water, chemicals, etc.)
Transport services(road, rail, air)
Emissions
Factory and machinery
Recyclableproduction scrap
Waste
Production ofcomponents:- body- battery- e-motor- electronics…
Assembly e-Car
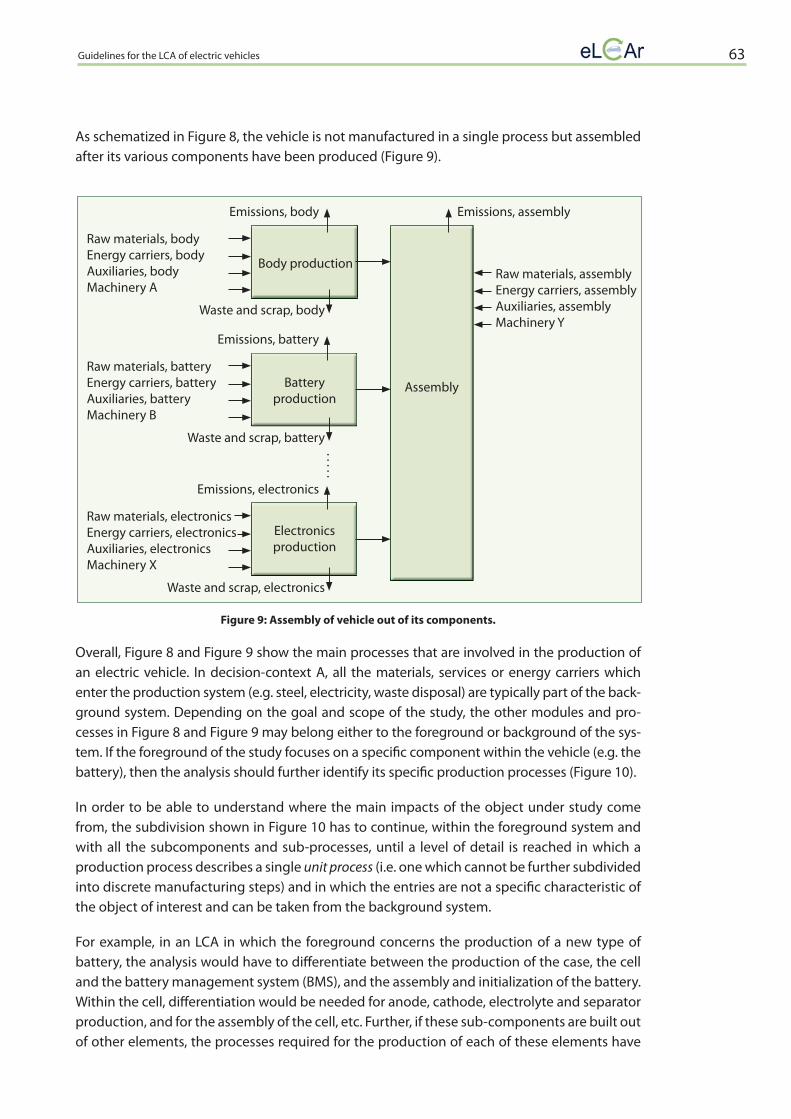
Guidelines for the LCA of electric vehicles 63
As schematized in Figure 8, the vehicle is not manufactured in a single process but assembled after its various components have been produced (Figure 9).
Figure 9: Assembly of vehicle out of its components.
Overall, Figure 8 and Figure 9 show the main processes that are involved in the production of an electric vehicle. In decision-context A, all the materials, services or energy carriers which enter the production system (e.g. steel, electricity, waste disposal) are typically part of the back-ground system. Depending on the goal and scope of the study, the other modules and pro-cesses in Figure 8 and Figure 9 may belong either to the foreground or background of the sys-tem. If the foreground of the study focuses on a specifi c component within the vehicle (e.g. the battery), then the analysis should further identify its specifi c production processes (Figure 10).
In order to be able to understand where the main impacts of the object under study come from, the subdivision shown in Figure 10 has to continue, within the foreground system and with all the subcomponents and sub-processes, until a level of detail is reached in which a production process describes a single unit process (i.e. one which cannot be further subdivided into discrete manufacturing steps) and in which the entries are not a specifi c characteristic of the object of interest and can be taken from the background system.
For example, in an LCA in which the foreground concerns the production of a new type of battery, the analysis would have to diff erentiate between the production of the case, the cell and the battery management system (BMS), and the assembly and initialization of the battery. Within the cell, diff erentiation would be needed for anode, cathode, electrolyte and separator production, and for the assembly of the cell, etc. Further, if these sub-components are built out of other elements, the processes required for the production of each of these elements have
Raw materials, bodyEnergy carriers, body Auxiliaries, bodyMachinery A
Raw materials, batteryEnergy carriers, battery Auxiliaries, batteryMachinery B
Raw materials, electronicsEnergy carriers, electronics Auxiliaries, electronicsMachinery X
Emissions, body
Emissions, battery
Emissions, electronics
Body production
Battery production
Electronics production
Waste and scrap, body
Waste and scrap, battery
Waste and scrap, electronics
Assembly
Emissions, assembly
Raw materials, assembly Energy carriers, assembly Auxiliaries, assembly Machinery Y
.....
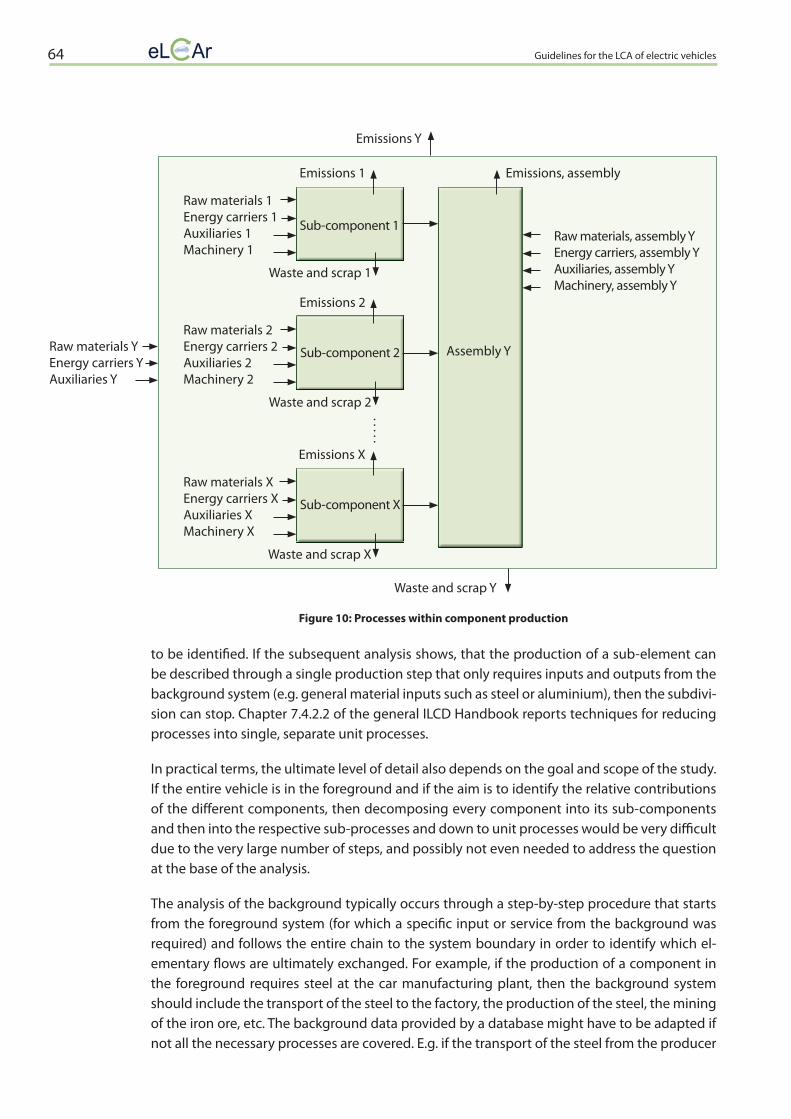
Guidelines for the LCA of electric vehicles64
Emissions Y
Waste and scrap Y
Emissions 1
Emissions 2
Emissions X
Sub-component 1
Sub-component 2
Sub-component X
Waste and scrap 1
Waste and scrap 2
Waste and scrap X
Assembly Y
Emissions, assembly
Raw materials YEnergy carriers Y Auxiliaries Y
.....
Raw materials, assembly YEnergy carriers, assembly YAuxiliaries, assembly YMachinery, assembly Y
to be identifi ed. If the subsequent analysis shows, that the production of a sub-element can be described through a single production step that only requires inputs and outputs from the background system (e.g. general material inputs such as steel or aluminium), then the subdivi-sion can stop. Chapter 7.4.2.2 of the general ILCD Handbook reports techniques for reducing processes into single, separate unit processes.
In practical terms, the ultimate level of detail also depends on the goal and scope of the study. If the entire vehicle is in the foreground and if the aim is to identify the relative contributions of the diff erent components, then decomposing every component into its sub-components and then into the respective sub-processes and down to unit processes would be very diffi cult due to the very large number of steps, and possibly not even needed to address the question at the base of the analysis.
The analysis of the background typically occurs through a step-by-step procedure that starts from the foreground system (for which a specifi c input or service from the background was required) and follows the entire chain to the system boundary in order to identify which el-ementary fl ows are ultimately exchanged. For example, if the production of a component in the foreground requires steel at the car manufacturing plant, then the background system should include the transport of the steel to the factory, the production of the steel, the mining of the iron ore, etc. The background data provided by a database might have to be adapted if not all the necessary processes are covered. E.g. if the transport of the steel from the producer
Figure 10: Processes within component production
Raw materials 1Energy carriers 1 Auxiliaries 1Machinery 1
Raw materials 2Energy carriers 2Auxiliaries 2Machinery 2
Raw materials XEnergy carriers X Auxiliaries XMachinery X

Guidelines for the LCA of electric vehicles 65
to the car manufacturer is not included in the background data for steel, this transport has to be added separately. Or if the car manufacturer needs a steel sheet, background data for a steel billet might need to be combined with background data for sheet rolling. This needs to be done for all the products and services required by the foreground. As described above, a lower level of detail is typically used for the background where the main aim is to identify all the relevant processes in the chain (for example, as mentioned above, the production of steel or the mining of the iron ore) rather than all the sub-processes within these. LCA software and LCI databases can substantially reduce the effort in this context.
Provisions 7.1.1.1: Process identification in the production phase
I. SHALL: If the entire vehicle is part of the analysis, identify all the main processes involved in its production. Particularly, the presence and the correctness of the representation of the following processes should be verified:�� Battery production�� Electric motor production�� Power electronics production�� Non propulsion electrical system�� Vehicle body production�� Steering, braking and suspension system production�� Wheels and tyres production�� Transmission system production�� Cockpit related equipment production (seats, belts, interiors, etc.)�� For serial PHEVs: internal combustion engine (ICE) system production�� Vehicle assembly
Variations from the above list may occur and shall then be documented.
II. SHALL: For components or systems (including the vehicle) belonging to the fore-ground system, identify compatibly with the goal and scope of the study for all sub-components and sub-processes reducing these down to a stage in which each production step can be described as a single operation involving only ex-changes with the background system and nature. These typically include:�� Raw material acquisition�� Energy carrier acquisition�� Production infrastructure�� Acquisition of auxiliaries�� Use of transport services�� Waste and scrap flows�� Emissions
III. SHALL: Identify all the processes in the background that are necessary to real-ize the production of the foreground system. This should be done by applying a stepwise analysis for each input and output passing the border between the foreground and background and following their supply to end-of-life chain in order to ultimately identify what elementary flows are exchanged.
Guidelines for the LCA of electric vehicles66
IV. SHOULD: Document the analysed system with a schematic diagram of the found processes.
7.1.1.2 Background changes in Situation B
The above listed recommendations directly hold for a situation A study where, for example, the LCA is for a new production technology for a given system, assumes that no large-scale changes are being caused. In studies, in which big changes in the supply chain may be ex-pected in consequence of the analysed decision, it is also necessary to identify how the back-ground may change in response to the decision. In other words, within the ILCD framework this requires identification of the long-term marginal mix of the processes affected by large changes, i.e. the long-term mix of technologies that are more likely to be installed (or decom-missioned) as a result of the increased (decreased) demand. In an unconstrained and fully informed market, the technologies that will be installed as a result of increased demand will be, in general, those processes that most cost effectively provide the required function (ILCD, 2010). However, since unconstrained and fully informed markets are an ideal and theoretical case, other aspects need to be considered. In addition, as mentioned in chapter 5.3, in identify-ing the key changes and affected processes of the background, one should analyse not only the demand triggered by the production system, but also the influence of possible additional supply (e.g. as co-product from a process in the analysed system).
Due to the vast scope of changes which may occur in the supply chain of a situation B study and its strong goal and scope dependence, it is not possible to give extensive information on situation B scenarios related to electric vehicles in this document. The reader is referred to chapter 7.2.4 of the general ILCD Handbook for a topic-independent methodology.
Here, it is only possible to limit the discussion to identifying an ensemble of processes that are likely to play an important role in situation B studies of electric vehicles.
First, electric vehicles currently have a growing market share within the overall market for pas-senger cars, which is almost entirely dominated by ICE vehicles. Hence, for some materials that these two technologies have in common, for example steel, a growth of EVs must not neces-sarily lead to a request for increased capacity for these materials as long as the growth of one technology is accompanied by the decline of the other. In other words, if the passenger vehicle market overall is stable, but, in the long term, electric vehicles replace part of the ICEVs, then for the materials these have in common, the market trends could be maintained. It is therefore important to understand how the growth of one technology may affect the other in the defini-tion of the scenarios for the materials shared between the two.
Then, there are a number of materials and services which are of specific importance for electric vehicles. Of course, the first one is the electricity used for recharging the batteries. This topic will be addressed in more detail in the subchapter on the use phase (chapter 7.1.2.1).
In terms of production, examples of materials that could play a key role in scenarios of higher market penetration by electric vehicles are aluminium, copper, lithium, neodymium and met-als typically present in electronics equipment like gold, platinum, silver, etc.

Guidelines for the LCA of electric vehicles 67
Aluminium is used for lightweight design, which is very important for BEVs as less weight means less consumption and, consequently, less battery for the same final range. Hence, the amount of aluminium in vehicles is likely to grow in the future. Copper is generally used in large quantities as electrode material in batteries and is also present in electric motors as well as in electronic devices. How the production of lithium may change in response to a mass production of EVs is also a relevant issue for situation B studies since lithium-ion batteries are currently the most successful, and for the next decades probably the most promising, technol-ogy for energy storage in BEVs. Also the production of neodymium which is used in the perma-nent magnets of many electric motors might be significantly affected by a BEV breakthrough. Finally, other metals like gold, tin or silver, just to name some examples, are contained in most electronic devices of which electric vehicles contain a higher proportion compared to conven-tional vehicles. Demand for platinum group metals, on the other hand, might be reduced if BEVs replace ICEVs that have catalytic converters.
A situation B study addressing the mass penetration of BEVs, would need to analyse what changes in the mining and production processes of the above listed materials would be caused by their increased or decreased demand.
The previous list is not exhaustive and is only meant as a first guidance.
7.1.1.3 Planning data collection
After identifying the processes within the system of interest, it is necessary to select appropri-ate data sources. Since the focus of the study is mainly on the foreground system, the data de-scribing it should come from the developer, producer or operator of the respective processes and should be the outcome of measurements or specific simulations. The term ‘measurement’ is here intended in the wider sense of direct acquisition from the producer or operator of the process of interest. For example, with respect to electricity consumption, electricity bills from the production site can be important data sources. This type of data is typically referred to as primary data. Instead, for the background system, due to the averaging effect across suppliers, homogeneous average data sets depicting the average market situation can be assumed to appropriately represent the respective processes (ILCD, 2010). Data of this type can often be acquired from national and international LCI databases, consultants, and research groups; it is commonly referred to as secondary data.
Hence, in the battery example mentioned in the previous section, data for the material types and quantities, the energy inputs, and wastes and emissions outputs related to the produc-tion process of the battery should derive from measurements at the specific production plant involved, while data for the generation of the electricity may be taken from average data sets provided, for example, by LCI data providers.
Moreover, in terms of what data is collected, it is also important to underline again the differ-ences in the background system between situations A and B. As previously described, in situa-tion A the supply chain belonging to the background system is ‘as is’. Average technology data, as a market consumption mix, should be used (ILCD, 2010). In situation B, the processes facing large changes in consequence of decisions made in light of the analysis should be modelled according to the long-term expected technology mix (ILCD, 2010).

Guidelines for the LCA of electric vehicles68
Secondary data may also be used for some parts of the foreground system, if the quality of the secondary data is better than that of the available primary data.
Provisions 7.1.1.3: Planning data collection
I. SHALL: Identify newly required, study-specific unit processes for which primary data has to be obtained from the respective developers, producers or operators (typically, the complete foreground system).
II. SHALL: Identify for which parts of the analysed system secondary LCI data sets are more appropriate (typically, the background system).
III. SHALL: �� Foreground system (ILCD, 2010):
Technology-specific primary data shall be used for the foreground system and for the specifications of the products and wastes that connect the foreground system with the background system. Secondary data from the actual suppli-ers or downstream actors should be preferred to other (third-party) second-ary data if they are consistent with the scope defined in the study and are at least of comparable quality. Technology-specific, generic, or average data from third-parties should be used in those parts of the foreground system where, for the given case, this is of higher quality (i.e. more accurate, precise, complete) than the available technology-specific primary or secondary data from suppliers or downstream actors (ILCD, 2010).�� Background system (ILCD, 2010):
Situation A: Average technology data, as market consumption mix, should be used.Situation B: Models of the expected long-term technology mix for processes expected to realize big changes in consequence of eventual decisions should be used.
IV. SHALL: Secondary data sets shall be selected according to their technological, geographical and temporal representativeness with respect to the process they are meant to represent.
V. SHALL: Use secondary data sets which, if coming from multiple sources, are con-sistent with each other and with the modelling principles of the overall LCA (e.g. for the system boundaries or the addressing of multifunctionality).
VI. SHALL: Use secondary data for the foreground system, if this is of better quality than the available primary data.
VII. SHALL: If no secondary data is available for the background system, or for only part of it, then primary data shall be collected for it or for the part. Alternatively, secondary proxy data might be used. In this case, proxies shall be selected to rather overestimate environmental impacts. If these impacts are relevant to the overall result of the study, the proxie data shall be replaced with primary data.
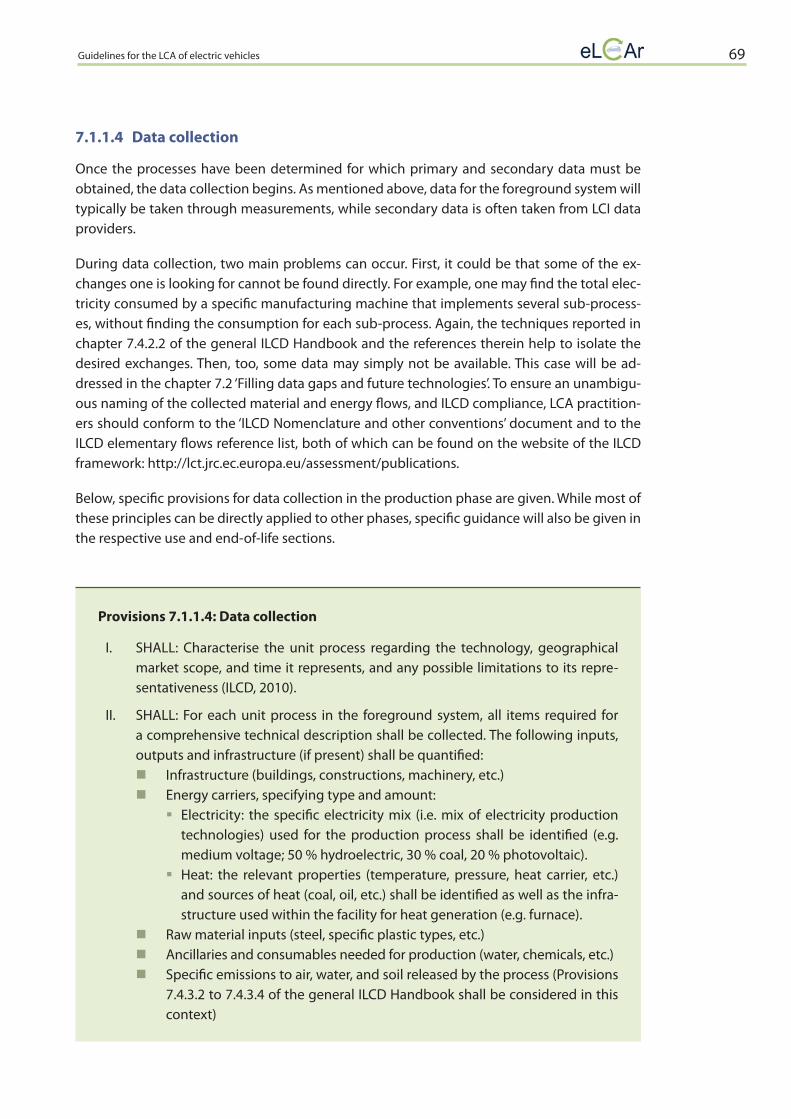
Guidelines for the LCA of electric vehicles 69
7.1.1.4 Data collection
Once the processes have been determined for which primary and secondary data must be obtained, the data collection begins. As mentioned above, data for the foreground system will typically be taken through measurements, while secondary data is often taken from LCI data providers.
During data collection, two main problems can occur. First, it could be that some of the ex-changes one is looking for cannot be found directly. For example, one may find the total elec-tricity consumed by a specific manufacturing machine that implements several sub-process-es, without finding the consumption for each sub-process. Again, the techniques reported in chapter 7.4.2.2 of the general ILCD Handbook and the references therein help to isolate the desired exchanges. Then, too, some data may simply not be available. This case will be ad-dressed in the chapter 7.2 ‘Filling data gaps and future technologies’. To ensure an unambigu-ous naming of the collected material and energy flows, and ILCD compliance, LCA practition-ers should conform to the ‘ILCD Nomenclature and other conventions’ document and to the ILCD elementary flows reference list, both of which can be found on the website of the ILCD framework: http://lct.jrc.ec.europa.eu/assessment/publications.
Below, specific provisions for data collection in the production phase are given. While most of these principles can be directly applied to other phases, specific guidance will also be given in the respective use and end-of-life sections.
Provisions 7.1.1.4: Data collection
I. SHALL: Characterise the unit process regarding the technology, geographical market scope, and time it represents, and any possible limitations to its repre-sentativeness (ILCD, 2010).
II. SHALL: For each unit process in the foreground system, all items required for a comprehensive technical description shall be collected. The following inputs, outputs and infrastructure (if present) shall be quantified:�� Infrastructure (buildings, constructions, machinery, etc.)�� Energy carriers, specifying type and amount:��Electricity: the specific electricity mix (i.e. mix of electricity production
technologies) used for the production process shall be identified (e.g. medium voltage; 50 % hydroelectric, 30 % coal, 20 % photovoltaic).
��Heat: the relevant properties (temperature, pressure, heat carrier, etc.) and sources of heat (coal, oil, etc.) shall be identified as well as the infra-structure used within the facility for heat generation (e.g. furnace).
�� Raw material inputs (steel, specific plastic types, etc.)�� Ancillaries and consumables needed for production (water, chemicals, etc.)�� Specific emissions to air, water, and soil released by the process (Provisions
7.4.3.2 to 7.4.3.4 of the general ILCD Handbook shall be considered in this context)
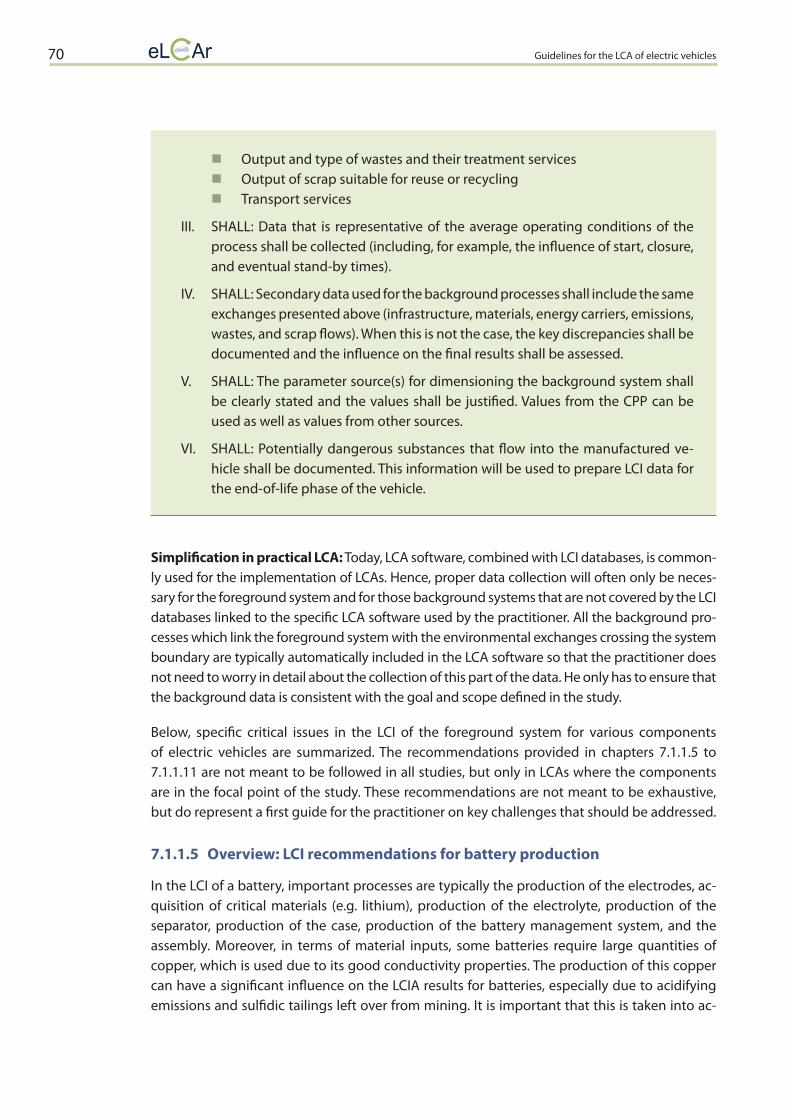
Guidelines for the LCA of electric vehicles70
�� Output and type of wastes and their treatment services�� Output of scrap suitable for reuse or recycling�� Transport services
III. SHALL: Data that is representative of the average operating conditions of the process shall be collected (including, for example, the influence of start, closure, and eventual stand-by times).
IV. SHALL: Secondary data used for the background processes shall include the same exchanges presented above (infrastructure, materials, energy carriers, emissions, wastes, and scrap flows). When this is not the case, the key discrepancies shall be documented and the influence on the final results shall be assessed.
V. SHALL: The parameter source(s) for dimensioning the background system shall be clearly stated and the values shall be justified. Values from the CPP can be used as well as values from other sources.
VI. SHALL: Potentially dangerous substances that flow into the manufactured ve-hicle shall be documented. This information will be used to prepare LCI data for the end-of-life phase of the vehicle.
Simplification in practical LCA: Today, LCA software, combined with LCI databases, is common-ly used for the implementation of LCAs. Hence, proper data collection will often only be neces-sary for the foreground system and for those background systems that are not covered by the LCI databases linked to the specific LCA software used by the practitioner. All the background pro-cesses which link the foreground system with the environmental exchanges crossing the system boundary are typically automatically included in the LCA software so that the practitioner does not need to worry in detail about the collection of this part of the data. He only has to ensure that the background data is consistent with the goal and scope defined in the study.
Below, specific critical issues in the LCI of the foreground system for various components of electric vehicles are summarized. The recommendations provided in chapters 7.1.1.5 to 7.1.1.11 are not meant to be followed in all studies, but only in LCAs where the components are in the focal point of the study. These recommendations are not meant to be exhaustive, but do represent a first guide for the practitioner on key challenges that should be addressed.
7.1.1.5 Overview: LCI recommendations for battery production
In the LCI of a battery, important processes are typically the production of the electrodes, ac-quisition of critical materials (e.g. lithium), production of the electrolyte, production of the separator, production of the case, production of the battery management system, and the assembly. Moreover, in terms of material inputs, some batteries require large quantities of copper, which is used due to its good conductivity properties. The production of this copper can have a significant influence on the LCIA results for batteries, especially due to acidifying emissions and sulfidic tailings left over from mining. It is important that this is taken into ac-

Guidelines for the LCA of electric vehicles 71
count in the LCI data used for the modelling of raw material extraction. Even though lithium production is not a major contributor to environmental burdens in today’s Li-ion batteries, production processes may change in the future if the demand for lithium should increase due to growth in the production of battery electric vehicles and, therefore, of lithium-ion batteries. Modern batteries are equipped with electronic battery management systems; the same rec-ommendations given for the high power electronics hold for this sub-component.
7.1.1.6 Overview: LCI recommendations for body production
In the LCI for body production, it is important to take into account all the specific material manufacturing processes and machinery required for creating the body and doors, the coat-ing processes, production of the insulation system, and the painting processes. In terms of material inputs, today’s vehicle bodies typically require a large share of various types of iron and steel. However, there is growing interest in lightweight materials due to the potential for energy saving in the use phase, and a shift towards higher shares of aluminium, plastics and carbon fibres can be observed. All these materials can have very different extraction, produc-tion, and processing technologies, which have to be taken into account in detail in order to analyse whether the introduction of a specific lightweight material effectively reduces the im-pact of the vehicle over its entire life cycle. This is especially important if electric vehicles are operated with environmentally friendly generated electricity since in this case the energy sav-ings in the use phase due to the reduced vehicle weight will not result in substantial mitigation of environmental burdens. If the effect of lightening by the use of different materials is to be analysed, the inventory should therefore cover in detail the specific materials used, including their extraction, production, and processing energy consumption.
7.1.1.7 Overview: LCI recommendations for electric motor production
There are various types of motors that may require different types of inputs. It is therefore necessary to identify exactly what type of motor is being depicted in the analysis. In terms of material inputs, electric motors are largely made out of metals. A good share of the metal in-put might be copper, for which the same recommendations given for the battery hold. Some types of motors might make use of permanent magnets that use rare earths (e.g. neodymium). These require particular mining processes that should be taken into account in the analysis. The inventory should therefore cover in detail the specific materials used as well as their ex-traction, production, and processing energy consumption. Due to the scarcity of some of the elements used, the inventory should also account for resource consumption.
7.1.1.8 Overview: LCI recommendations for SBSS, transmission and ICE for serial PHEVs production
This paragraph brings together components that are subject to various forms of stress and typically require resistant materials for reliable performance. Similar to body production, the specific materials and their manufacturing play an important role in their LCI. A large quantity of metals as well as plastics and carbon fibres are likely to be part of the system. Therefore, the inventory should cover in detail the specific materials used as well as their extraction, pro-duction, and processing energy consumption. In the production of braking systems another

Guidelines for the LCA of electric vehicles72
important issue is the substances used in the brake shoes, disks, and disk pads, which can be released into the environment as non-exhaust emissions when the friction of the braking pro-cess detaches them from their support. The presence of these substances should therefore be documented as this will be essential for evaluating the environmental impacts that will occur during the use phase of the vehicle and its brakes.
7.1.1.9 Overview: LCI recommendations for tyres and wheels
Overall, very similar recommendations as in the previous paragraph hold, since the materials used in the wheels need to have a high resistance to stress and the ones of the tyres can lead to environmental impacts during the use phase of the vehicle due to abrasion. The inventory should differentiate between the various materials used in the components and the efforts required to process them as well as verify what substances in the tyres may be problematic in terms of non-exhaust emissions.
7.1.1.10 Overview: LCI recommendations for the production of modules within the cockpit
The cockpit comprises a large number of different components: interiors, seats, linings, the dashboard, front and back windscreens, as well as windows, etc. It is out of the scope of this handbook to provide guidance for each element. In general, plastics, synthetic materials, and foams will play a dominant role in the LCI of the cockpit and should be analysed in detail, including their production and processing. For all electronic components, the recommenda-tions given below shall be used.
7.1.1.11 Overview: LCI recommendations for power electronics and non-propulsion electrical system production
Various electronics modules are present in an electric vehicle. First, one should differentiate between the power electronics, responsible for the energy processing in the electric drive-train, and the non-propulsion electrical system. Further, the power electronics can typically be subdivided into other components: AC/DC inverter, DC/DC converter, power distribution unit, battery charger, and cables (other nomenclatures and configurations can be found). The LCI should distinguish between these different components as they can lead to different impacts. In general, electronic devices require a number of potentially critical materials such as, among others, copper, gold, silver, tin, and platinum, which are used to varying degrees in the elec-tronic devices (resistors, transistors, etc), printed circuit boards, and cables. These metals can have substantial impacts, both because of the mining processes and in terms of resource con-sumption. Consequently, the LCI should include the specific electronic components, printed circuit boards, and cables used in the various devices of the power electronics and take into account (typically through the background data sets) the extraction and processing of the metals mentioned above. Further, the production of electronics can use resource intensive machinery such as clean rooms, which also should be included in the LCI.
The non-propulsion electrical system brings together all the electronic and electrical elements that address functions not related to the electric drivetrain. Modules which typically belong in

Guidelines for the LCA of electric vehicles 73
this class of devices are lighting systems, heating and air conditioning units, control electron-ics, cables, entertainment devices, and navigation systems. In establishing the LCI, the same recommendations given for the power electronic devices hold with the addition of also inven-torying, with the same detail, the non-electronic parts that can be present, for example, in the heating, air conditioning and lighting systems.
7.1.2 Use Phase
7.1.2.1 Processes within the system boundary and data collection: the use phase
In the use phase, the processes involved in the operation of the electric vehicle or of its compo-nents have to be taken into account. Since the operation of each of the components depends on the operation of the entire vehicle, and since it is outside of the scope of this document to detail the operation of each component in the vehicle, the discussion will be developed for the operation of a complete vehicle. Figure 11 summarizes the main elements which play an important role.
Figure 11: Main elements in the use phase of a BEV.
As shown in Figure 11, one element in vehicle operation is the road infrastructure. The vehicle uses the road and its production, maintenance and dismantling should be part of the analysis. At the same time, vehicle maintenance is another crucial element in the use phase. This is of fundamental importance for electric vehicles in which the battery, a key component of the vehicle, may have to be exchanged during the vehicle’s lifetime. The production and end-of-life treatment of the materials and components which are exchanged due to maintenance are part of the inventory. They can be modelled together with the production and EoL of the car, or they can be modelled separately as part of the use phase, depending on the goal and scope of the study. Also, non-exhaust emissions such as particles generated by abrasion from the braking system, tyres and road can have an impact on the environment and shall be included in the use phase. Finally, the energy required due to use of the vehicle can have a strong impact on the results since, based on the energy consumption, a certain amount of electricity needs to be generated. Of course, the technologies with which the energy is converted, can lead to substantially diff erent environmental impacts. Also, to deliver electricity, electricity networks
Electricity generation
Electricity networks
Consumption/electricity at plug
Road infrastructure
Non-exhaust emissions
Maintenance
Vehicle infrastructure
Driving
Guidelines for the LCA of electric vehicles74
are required. These extend from the high voltage parts typically leaving the power plants and managing the transmission of the electricity, to the distribution part where, ultimately, the electric car is connected for recharging. In this context, the various charging alternatives should also be taken into account. This can be an on-board charger or dedicated charging stations that provide, for example, high speed charging. Overall, to take all these factors into account, it is first necessary to estimate the vehicle’s energy consumption.
7.1.2.1.1 Consumption calculation methods
7.1.2.1.1.1 Introduction
The energy consumption of a vehicle can be determined in two ways: by a measurement on a real vehicle or on fleets of vehicles, or through calculation. Overall, the energy consumption of an electric vehicle can be thought of as a combination of several sub-consumptions:�� Basic consumption (driving from A to B, without the consumption of any device which is
not directly needed for propulsion)�� Additional consumption due to heating and air conditioning of the passenger compartment�� Additional consumption due to auxiliaries (Light, Radio, Navigation etc.)�� Additional consumption due to internal battery losses in standstill�� Additional consumption due to battery charging losses
Each of these sub-consumptions can exhibit a – in some cases large - variability due to tech-nological factors and/or due to user behaviour. Table 6 indicates the order of magnitude of the influences. Basic consumption is strongly influenced by the type of vehicle (mainly its weight, shape and tyres) and by driving patterns (mainly acceleration and speed driven). Cli-matic conditions can have a limited influence on basic consumption since temperature can affect the efficiency of the power train. A large influence due to climatic conditions on basic consumption could only be observed if the user opens the windows when driving and thus increases drag.
But climatic conditions are key to the additional energy consumption for heating and cooling. The energy needed depends, on the one hand, on the system installed (efficiency, power), and, on the other, it depends on use. A/C might always be on (as is often the case in conventional vehicles) – even in the wintertime - or it might only be switched on if it is really hot or sunny. Some drivers might switch the heating on when the passenger cabin is below 20 °C while oth-ers might only use the heater if it is much cooler. Consumption for heating and air condition-ing per km also depends on average speed, since consumption relates both to the power of the devices and the length of time they are used.
Energy consumption by auxiliaries also depends on the devices (efficiency, power), how long they are used, and at which average speed.
The additional consumption due to internal battery losses during standstill depends on the battery type and design and on the use of the vehicle. While most lithium-ion batteries com-monly used in modern BEVs show quite low losses during standstill, high temperature batter-ies and Li-ion batteries consisting of very many small cells can lose half their energy content within a week when the vehicle is parked and not connected to the power grid.

Guidelines for the LCA of electric vehicles 75
The additional consumption due to charging losses mainly depends on the efficiency of the charger, which can vary over a rather wide range. Another influence that can be observed is the state of charge (SOC) at which battery recharging is begun. If a battery is almost depleted, the relative charging losses are lower than if the battery is still almost fully charged. This is due to energy losses from balancing, which is done towards the end of charging. Assuming that most electric cars are normally charged every night, the average state of charge of the battery before it is charged depends on the daily distance driven.
Influencing factor basi
c
heat
ing/
AC
auxi
liarie
s
stan
dstil
l
char
ging
tota
l
Vehicle design (mass, drag, tyres) +++ 0 0 0 0 +++
Vehicle design (component efficiency) + ++ ++ ++ ++ ++
Drive cycle (speed, driving behaviour, situation) ++ + + 0 0 ++
Climatic conditions and user behaviour (comfort) + +++ + 0 + ++
Frequency of use13 0 0 0 +/++ 0 +/++
Daily distance 0 0 0 0 + +
Influence on total consumption +++ ++ + + ++
Table 6: Influence of various factors on vehicle energy sub-consumptions. Values in ‘total’ refer to the vari-ation of total consumption due to a variation of the influencing factor within a reasonable range for a best case and worst case vehicle15
The following subchapters discuss the sub-consumptions of BEVs in more detail and present ways to estimate them and overall consumption. Practitioners who want to use a more de-tailed model or specific simulation tools are free to do so. Of course, in both cases, appropriate documentation is required. Practitioners who have access to measurement facilities or fleet measurements should use the guidelines for documenting and reporting their results.
7.1.2.1.1.2 Basic consumption
Basic energy consumption is the energy used by the vehicle’s drivetrain to travel from point A to point B. Overall, it consists of the energy needed for the mechanical motion of the vehicle (moving its mass and shape along a specific trajectory), the energy loss in the drivetrain of the vehicle (how much electrical energy is lost in the conversion to mechanical energy, due to the efficiency of the technology in the car), and the energy recuperated by inverting the energy flow when decelerating (how much kinetic energy is converted to electricity and saved in the battery).
To compute the mechanical energy required to sustain the motion of a given vehicle, one first needs to define along which trajectory, and with what driving profile, the car is driven.
15 Depending on battery type and design: high for high temp. batteries or Li-ion batteries with very many small cells, low for other Li-ion batteries.

Guidelines for the LCA of electric vehicles76
Because this leads to an infinite spectrum of situations, these computations are typically made on the basis of driving cycles. An often used driving cycle in relation to consumption measurements is the New European Driving Cycle (NEDC), which is also the one used in some measurement standards (e.g. ECE R101, Annex 7). This driving cycle is commonly used to communicate vehicle energy consumption under standard test conditions. But there seems to be evidence that the NEDC underestimates the real-world average consumption (Mock, 2012). Alternative driving cycles have therefore been developed that aim to depict more precisely real-world consumption. Examples of such driving cycles are the Common Artemis Driving Cycle (CADC) and the Worldwide Harmonized Light Duty Test Cycle (WLTC), which is the result of a UNECE working group. These driving cycles use a more dynamic driv-ing pattern based on measurements in everyday vehicle operation in European countries (CADC) and in countries from all over the world (WLTC). CADC and WLTC consist of driving situations depicting urban, rural and motorway conditions while NEDC only has urban and extra urban elements. The separate parts of all drive cycles can be assembled in different shares to estimate the consumption in a very specific driving situation. The following table gives some key data on the three operating cycles and their parts. The CADC exists in two versions: the CADC (130), which reaches a maximum speed of 130 km/h, and the CADC (150), which reaches 150 km/h maximum. Since the maximum speed of many of today’s electric vehicles is limited to 130 km/h (or even lower), the use of the CADC (150) cycle is often not a reasonable choice for BEVs.
Drive Cycle / parttime [s] distance [m]
average speed [km/h]
basic consump-tion [%]
NED
C
Urban 780 4058 18.7
Rural 400 6948 62.5
Total 1180 11006 33.6 100
CAD
C
Urban 920 4472 17.5
Rural 980 16441 60.4
Highway (130) 735 23793 116.5
Highway (150) 735 24575 120.4
Total (130) 3136 50833 58.4 135
Total (150) 3136 51642 59.3 140
WLT
C
Urban 590 3095 18.9
Rural 433 4755 39.5
Highway slow 455 7158 56.6
Highway fast 322 8254 92.3
Total 1800 23262 46.5 112
Table 7: Duration, distance and average speed of various drive cycles and their parts. The basic consump-tions relative to the basic consumption in the NEDC are to be understood as approximate values valid for the same vehicle.
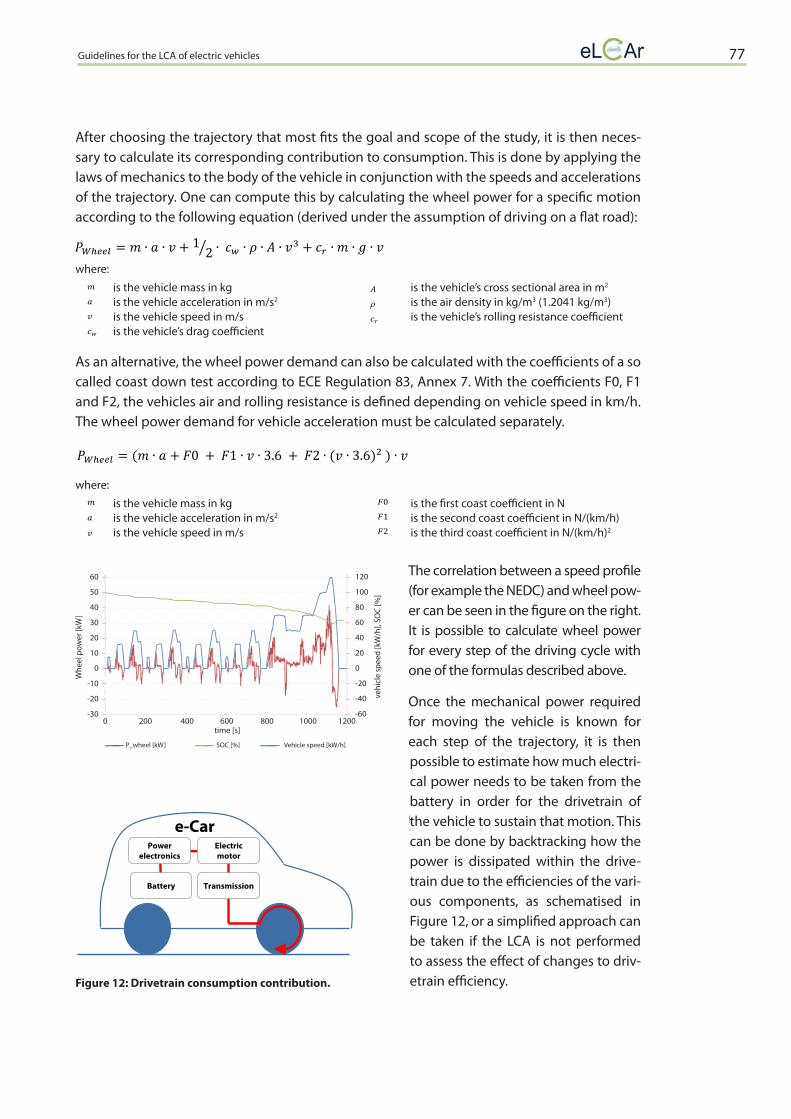
Guidelines for the LCA of electric vehicles 77
Electric motor
TransmissionBattery
Power electronics
e-Car
After choosing the trajectory that most fits the goal and scope of the study, it is then neces-sary to calculate its corresponding contribution to consumption. This is done by applying the laws of mechanics to the body of the vehicle in conjunction with the speeds and accelerations of the trajectory. One can compute this by calculating the wheel power for a specific motion according to the following equation (derived under the assumption of driving on a flat road):
where:
is the vehicle mass in kg is the vehicle’s cross sectional area in m2
is the vehicle acceleration in m/s2 is the air density in kg/m3 (1.2041 kg/m3) is the vehicle speed in m/s is the vehicle’s rolling resistance coefficient is the vehicle’s drag coefficient
As an alternative, the wheel power demand can also be calculated with the coefficients of a so called coast down test according to ECE Regulation 83, Annex 7. With the coefficients F0, F1 and F2, the vehicles air and rolling resistance is defined depending on vehicle speed in km/h. The wheel power demand for vehicle acceleration must be calculated separately.
where:
is the vehicle mass in kg is the first coast coefficient in N is the vehicle acceleration in m/s2 is the second coast coefficient in N/(km/h) is the vehicle speed in m/s is the third coast coefficient in N/(km/h)2
The correlation between a speed profile (for example the NEDC) and wheel pow-er can be seen in the figure on the right. It is possible to calculate wheel power for every step of the driving cycle with one of the formulas described above.
Once the mechanical power required for moving the vehicle is known for each step of the trajectory, it is then possible to estimate how much electri-cal power needs to be taken from the battery in order for the drivetrain of the vehicle to sustain that motion. This can be done by backtracking how the power is dissipated within the drive-train due to the efficiencies of the vari-ous components, as schematised in Figure 12, or a simplified approach can be taken if the LCA is not performed to assess the effect of changes to driv-etrain efficiency.Figure 12: Drivetrain consumption contribution.
60
50
40
30
20
10
0
-10
-20
-30
120
100
80
60
40
20
0
-20
-40
-60
Whe
el p
ower
[kW
]
vehi
cle
spee
d [k
W/h
], SO
C [%
]
P_wheel [kW] Vehicle speed [kW/h]SOC [%]
time [s]0 200 400 600 800 1000 1200
1/2
31.01.2013
75
Rural 980 16441 60.4
Highway (130) 735 23793 116.5
Highway (150) 735 24575 120.4
Total (130) 3136 50833 58.4 135
Total (150) 3136 51642 59.3 140
WLT
C
Urban 590 3095 18.9
Rural 433 4755 39.5
Highway slow 455 7158 56.6
Highway fast 322 8254 92.3
Total 1800 23262 46.5 112 Table 7: Duration, distance and average speed of various drive cycles and their parts. The basic consump-tions relative to the basic consumption in the NEDC are to be understood as approximate values valid for the same vehicle.
After choosing the trajectory that most fits the goal and scope of the study, it is then necessary to cal-culate its corresponding contribution to consumption. This is done by applying the laws of mechanics to the body of the vehicle in conjunction with the speeds and accelerations of the trajectory. One can compute this by calculating the wheel power for a specific motion according to the following equation (derived under the assumption of driving on a flat road):
⁄
where:
is the vehicle mass in kg
is the vehicle acceleration in m/s2
is the vehicle speed in m/s
is the vehicle's drag coefficient
is the vehicle's cross sectional area in m2
is the air density in kg/m3 (1.2041 kg/m3)
is the vehicle's rolling resistance coefficient
As an alternative, the wheel power demand can also be calculated with the coefficients of a so called coast down test according to ECE Regulation 83, Annex 7. With the coefficients F0, F1 and F2, the vehi-cles air and rolling resistance is defined depending on vehicle speed in km/h. The wheel power de-mand for vehicle acceleration must be calculated separately.
where:
is the vehicle mass in kg
is the vehicle acceleration in m/s2
is the vehicle speed in m/s
is the first coast coefficient in N
is the second coast coefficient in N/(km/h)
is the third coast coefficient in N/(km/h)2
31.01.2013
75
Rural 980 16441 60.4
Highway (130) 735 23793 116.5
Highway (150) 735 24575 120.4
Total (130) 3136 50833 58.4 135
Total (150) 3136 51642 59.3 140 W
LTC
Urban 590 3095 18.9
Rural 433 4755 39.5
Highway slow 455 7158 56.6
Highway fast 322 8254 92.3
Total 1800 23262 46.5 112 Table 7: Duration, distance and average speed of various drive cycles and their parts. The basic consump-tions relative to the basic consumption in the NEDC are to be understood as approximate values valid for the same vehicle.
After choosing the trajectory that most fits the goal and scope of the study, it is then necessary to cal-culate its corresponding contribution to consumption. This is done by applying the laws of mechanics to the body of the vehicle in conjunction with the speeds and accelerations of the trajectory. One can compute this by calculating the wheel power for a specific motion according to the following equation (derived under the assumption of driving on a flat road):
⁄
where:
is the vehicle mass in kg
is the vehicle acceleration in m/s2
is the vehicle speed in m/s
is the vehicle's drag coefficient
is the vehicle's cross sectional area in m2
is the air density in kg/m3 (1.2041 kg/m3)
is the vehicle's rolling resistance coefficient
As an alternative, the wheel power demand can also be calculated with the coefficients of a so called coast down test according to ECE Regulation 83, Annex 7. With the coefficients F0, F1 and F2, the vehi-cles air and rolling resistance is defined depending on vehicle speed in km/h. The wheel power de-mand for vehicle acceleration must be calculated separately.
where:
is the vehicle mass in kg
is the vehicle acceleration in m/s2
is the vehicle speed in m/s
is the first coast coefficient in N
is the second coast coefficient in N/(km/h)
is the third coast coefficient in N/(km/h)2
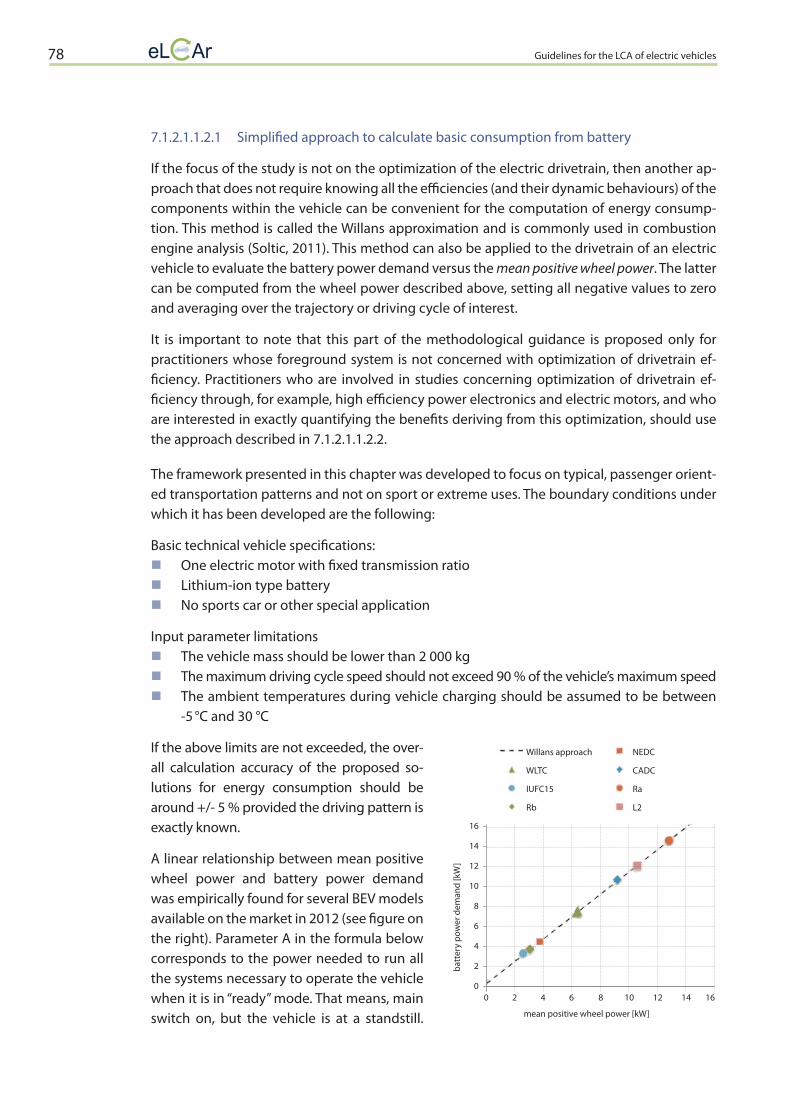
Guidelines for the LCA of electric vehicles78
7.1.2.1.1.2.1 Simplified approach to calculate basic consumption from battery
If the focus of the study is not on the optimization of the electric drivetrain, then another ap-proach that does not require knowing all the efficiencies (and their dynamic behaviours) of the components within the vehicle can be convenient for the computation of energy consump-tion. This method is called the Willans approximation and is commonly used in combustion engine analysis (Soltic, 2011). This method can also be applied to the drivetrain of an electric vehicle to evaluate the battery power demand versus the mean positive wheel power. The latter can be computed from the wheel power described above, setting all negative values to zero and averaging over the trajectory or driving cycle of interest.
It is important to note that this part of the methodological guidance is proposed only for practitioners whose foreground system is not concerned with optimization of drivetrain ef-ficiency. Practitioners who are involved in studies concerning optimization of drivetrain ef-ficiency through, for example, high efficiency power electronics and electric motors, and who are interested in exactly quantifying the benefits deriving from this optimization, should use the approach described in 7.1.2.1.1.2.2.
The framework presented in this chapter was developed to focus on typical, passenger orient-ed transportation patterns and not on sport or extreme uses. The boundary conditions under which it has been developed are the following:
Basic technical vehicle specifications:�� One electric motor with fixed transmission ratio�� Lithium-ion type battery�� No sports car or other special application
Input parameter limitations�� The vehicle mass should be lower than 2 000 kg�� The maximum driving cycle speed should not exceed 90 % of the vehicle’s maximum speed�� The ambient temperatures during vehicle charging should be assumed to be between
-5 °C and 30 °C
If the above limits are not exceeded, the over-all calculation accuracy of the proposed so-lutions for energy consumption should be around +/- 5 % provided the driving pattern is exactly known.
A linear relationship between mean positive wheel power and battery power demand was empirically found for several BEV models available on the market in 2012 (see figure on the right). Parameter A in the formula below corresponds to the power needed to run all the systems necessary to operate the vehicle when it is in “ready” mode. That means, main switch on, but the vehicle is at a standstill.
16
14
12
10
8
6
4
2
0
mean positive wheel power [kW]
batt
ery
pow
er d
eman
d [k
W]
0 2 4 6 8 10 12 14 16
Willans approach
WLTC
IUFC15
Rb
NEDC
CADC
Ra
L2

Guidelines for the LCA of electric vehicles 79
This power demand is caused by several components like control units, power electronics, instrument cluster, and other systems in standby mode.
Parameter B in combination with parameter A describes the overall drive train effi ciencies versus wheel power demand. Basically, the effi ciencies of electric motors are normally repre-sented in effi ciency maps which are graphs with the engine torque on one axis and the engine speed on the other. But as a more simplifi ed approach, it is possible to reduce the map to one line, which represents mean drive train effi ciency.
where:
with:
A 1.118 (from measurement at Empa (Bütler, 2013))B 0.436 (from measurement at Empa (Bütler, 2013))TC duration of driving cycle in s
To get the consumption in Wh/km, has to be transformed to W and then divided by the mean cycle speed.
where:
is the electrical consumption of the specifi c cycle in Wh/km (without recuperative braking).
is the mean cycle speed of the specifi c cycle in km/h.
Up to now, charging the battery by recuperation of kinetic energy is not considered in the proposed approach. However, in electric vehicles, the electric motor can act as a generator when no energy fl ows from the battery and the inertia of the vehicle in motion continues to spin the motor. This leads to a braking eff ect on the vehicle as well as to the ‹recuperation› of energy, which is fed back to the battery. The determination of the maximum energy that can be recuperated is very complex, since diff erent systems aff ect the recuperative behaviour. The following steps describe a procedure, based on actual vehicle measurements, for estimating the recuperated energy.
First, the maximum recoverable energy for every operating point of the cycle has to be de-termined. This energy is calculated by inverting the Willans approach defi ned in the previous section to evaluate the wheel power through the cycle speed (including positive and negative wheel power, necessary for the fi rst calculation steps). In this way, the effi ciencies of the drive system are taken into account, also for recuperation. Since recuperation is highly dependent
31.01.2013
77
Input parameter limitations - The vehicle mass should be lower than 2 000 kg - The maximum driving cycle speed should not exceed 90 % of the vehicle's maximum speed - The ambient temperatures during vehicle charging should be assumed to be between -5 °C
and 30 °C
If the above limits are not exceeded, the overall calculation accuracy of the proposed solutions for en-ergy consumption should be around +/- 5 % provided the driving pattern is exactly known.
A linear relationship between mean positive wheel power and bat-tery power demand was empirically found for several BEV models available on the market in 2012 (see figure on the right). Parameter A in the formula below corresponds to the power needed to run all the systems necessary to operate the vehicle when it is in “ready” mode. That means, main switch on, but the vehicle is at a standstill. This power demand is caused by several components like control units, power electronics, instrument cluster, and other systems in standby mode.
Parameter B in combination with parameter A describes the overall drive train efficiencies versus wheel power demand. Basically, the ef-ficiencies of electric motors are normally represented in efficiency maps which are graphs with the en-gine torque on one axis and the engine speed on the other. But as a more simplified approach, it is possible to reduce the map to one line, which represents mean drive train efficiency.
where:
is the electrical power demand of the specific cycle in kW (only energy flow out of battery, no recuperation considered)
is the mean positive wheel power demand for the specific cycle in kW
with:
∑
A 1.118 (from measurement at Empa (Bütler, 2013))
B 0.436 (from measurement at Empa (Bütler, 2013))
TC duration of driving cycle in s
To get the consumption in Wh/km, has to be transformed to W and then divided by the mean cycle speed.
31.01.2013
78
where:
is the electrical consumption of the specific cycle in Wh/km (without recuperative braking).
is the mean cycle speed of the specific cycle in km/h.
Up to now, charging the battery by recuperation of kinetic energy is not considered in the proposed approach. However, in electric vehicles, the electric motor can act as a generator when no energy flows from the battery and the inertia of the vehicle in motion continues to spin the motor. This leads to a braking effect on the vehicle as well as to the 'recuperation' of energy, which is fed back to the battery. The determination of the maximum energy that can be recuperated is very complex, since different systems affect the recuperative behaviour. The following steps describe a procedure, based on actual vehicle measurements, for estimating the recuperated energy.
First, the maximum recoverable energy for every operating point of the cycle has to be determined. This energy is calculated by inverting the Willans approach defined in the previous section to evaluate the wheel power through the cycle speed (including positive and negative wheel power, necessary for the first calculation steps). In this way, the efficiencies of the drive system are taken into account, also for recuperation. Since recuperation is highly dependent on the operating point, these calculations, in order to achieve an acceptable accuracy, are performed for each time interval, and not just with mean values, as has been done before. The calculated values have a negative sign since the energy flow is reversed (wheel to battery).
where:
is the wheel power for the specific operating point in kW
Another value that has to be calculated is the maximum vehicle specific recuperation power. The anal-ysis of vehicle measurements shows that recuperation is limited by the vehicle's control software; the reasons for this behaviour have already been mentioned above. Based on the existing measurement data, an engine's speed-dependent power limit was characterized as follows:
where:
is the speed dependent recuperation pow-er limit in kW
The adjacent figure shows the maximum theoretically pos-sible recuperation (red marks) and limited recuperation versus vehicle speed (blue line, proportional to motor speed) for the WLTC driving cycle. The values for the maximum theoretically possible recupera-tion that fall below the blue line represent points that would not be possible to achieve due to the lim-itations of the recuperation system.
is the electrical power demand of the specifi c cycle in kW (only energy fl ow out of battery, no recuperation considered)is the mean positive wheel power demand for the specifi c cycle in kW

Guidelines for the LCA of electric vehicles80
on the operating point, these calculations, in order to achieve an acceptable accuracy, are performed for each time interval, and not just with mean values, as has been done before. The calculated values have a negative sign since the energy fl ow is reversed (wheel to battery).
where:
is the wheel power for the specifi c operating point in kW
Another value that has to be calculated is the maximum vehicle specifi c recuperation power. The analysis of vehicle measurements shows that recuperation is limited by the vehicle’s control software; the reasons for this behaviour have already been mentioned above. Based on the exist-ing measurement data, an engine’s speed-dependent power limit was characterized as follows:
where: is the speed dependent recuperation power limit in kW
The adjacent fi gure shows the maxi-mum theoretically possible recupera-tion (red marks) and limited recu-peration versus vehicle speed (blue line, proportional to motor speed) for the WLTC driving cycle. The values for the maximum theoretically possible recuperation that fall below the blue line represent points that would not be possible to achieve due to the lim-itations of the recuperation system.
In addition, a value can be inserted in order to take into account advanced energy recovery of current and future vehicles. Advanced energy recovery can be achieved with a brake pedal that is connected to the recuperation strategy or a special shift lever position where the driver can choose a forced recuperation. For current technologies, a suitable value for this factor is around 1.2.
With these values, P(t)el.recu.max and P(t)el.recu.lmit, the maximum and the limit are determined. These two calculated values are now compared to each other for each operating point in order to determine the eff ective recuperation power. If the maximum value is higher than the limit, it is reduced to the limit value.
0
-5
-10
-15
-20
-25
-30
-35
-40
-45
-50
Recu
pera
tion
pow
er [k
W]
0 20 40 60 80 100 120 140
vehicle speed [kW/h]
P_el_recuperation_max P_el_recuperation_limit
31.01.2013
78
where:
is the electrical consumption of the specific cycle in Wh/km (without recuperative braking).
is the mean cycle speed of the specific cycle in km/h.
Up to now, charging the battery by recuperation of kinetic energy is not considered in the proposed approach. However, in electric vehicles, the electric motor can act as a generator when no energy flows from the battery and the inertia of the vehicle in motion continues to spin the motor. This leads to a braking effect on the vehicle as well as to the 'recuperation' of energy, which is fed back to the battery. The determination of the maximum energy that can be recuperated is very complex, since different systems affect the recuperative behaviour. The following steps describe a procedure, based on actual vehicle measurements, for estimating the recuperated energy.
First, the maximum recoverable energy for every operating point of the cycle has to be determined. This energy is calculated by inverting the Willans approach defined in the previous section to evaluate the wheel power through the cycle speed (including positive and negative wheel power, necessary for the first calculation steps). In this way, the efficiencies of the drive system are taken into account, also for recuperation. Since recuperation is highly dependent on the operating point, these calculations, in order to achieve an acceptable accuracy, are performed for each time interval, and not just with mean values, as has been done before. The calculated values have a negative sign since the energy flow is reversed (wheel to battery).
where:
is the wheel power for the specific operating point in kW
Another value that has to be calculated is the maximum vehicle specific recuperation power. The anal-ysis of vehicle measurements shows that recuperation is limited by the vehicle's control software; the reasons for this behaviour have already been mentioned above. Based on the existing measurement data, an engine's speed-dependent power limit was characterized as follows:
where:
is the speed dependent recuperation pow-er limit in kW
The adjacent figure shows the maximum theoretically pos-sible recuperation (red marks) and limited recuperation versus vehicle speed (blue line, proportional to motor speed) for the WLTC driving cycle. The values for the maximum theoretically possible recupera-tion that fall below the blue line represent points that would not be possible to achieve due to the lim-itations of the recuperation system.
31.01.2013
79
In addition, a value can be inserted in order to take into account advanced energy recovery of current and future vehicles. Advanced energy recovery can be achieved with a brake pedal that is connected to the recuperation strategy or a special shift lever position where the driver can choose a forced recu-peration. For current technologies, a suitable value for this factor is around 1.2.
With these values, P(t)el.recu.max and P(t)el.recu.lmit, the maximum and the limit are determined. These two calculated values are now compared to each other for each operating point in order to determine the effective recuperation power. If the maximum value is higher than the limit, it is reduced to the limit value.
{ } Conceptually, this corresponds, in the figure above, to assigning all the red marks that fall below the blue line to the corresponding point on the blue line.
In the steps before, the values for P(t)el.recu have been calculated by using the positive and negative wheel power. But the electric motor can only regain energy when the wheel power is negative (during deceleration). Therefore, to compute the average recuperated electrical energy, the values calculated for an operating point with a positive wheel power must be set at zero.
After this step, for each phase of the cycle, the mean effective recuperation power can be determined (as in section 7.1.2.1.2.1).
∑
To get the consumption in Wh/km, has to be transformed from kW to W and then divided by the mean cycle speed.
The power that has to be provided to the drivetrain from the battery can be calculated with the follow-ing formula.
where:
is the total electrical consumption of the drive train for the specific cycle in Wh/km

Guidelines for the LCA of electric vehicles 81
Conceptually, this corresponds, in the fi gure above, to assigning all the red marks that fall be-low the blue line to the corresponding point on the blue line.
In the steps before, the values for P(t)el.recu have been calculated by using the positive and nega-tive wheel power. But the electric motor can only regain energy when the wheel power is neg-ative (during deceleration). Therefore, to compute the average recuperated electrical energy, the values calculated for an operating point with a positive wheel power must be set at zero.
After this step, for each phase of the cycle, the mean eff ective recuperation power can be de-termined (as in section 7.1.2.1.2.1).
To get the consumption in Wh/km, has to be transformed from kW to W and then divided by the mean cycle speed.
The power that has to be provided to the drivetrain from the battery can be calculated with the following formula.
where:
is the total electrical consumption of the drive train for the specifi c cycle in Wh/km
Where numerical values have been presented in this chapter, they were based on current tech-nology applied in mass market vehicles. In order to take into account vehicles that may diff er from the average, adjustments to the above calculated results can be made by introducing a variation factor.
An average peak effi ciency of 90 % is found for the drive train system considered above (from approximately 95 % for the electric motor and approximately 95 % for the power electronics). If the effi ciency values of the vehicle, which is examined in the LCA, diff er from these values, they can be used to calculate a variation factor for the drivetrain.
where:
is the variation factor for the drive train consumption
is the average peak effi ciency for the drive train defi ned in the guidelines (90 %)
is the effi ciency of the electric motor from the examined vehicle
is the effi ciency of the power electronics from the examined vehicle
31.01.2013
79
In addition, a value can be inserted in order to take into account advanced energy recovery of current and future vehicles. Advanced energy recovery can be achieved with a brake pedal that is connected to the recuperation strategy or a special shift lever position where the driver can choose a forced recu-peration. For current technologies, a suitable value for this factor is around 1.2.
With these values, P(t)el.recu.max and P(t)el.recu.lmit, the maximum and the limit are determined. These two calculated values are now compared to each other for each operating point in order to determine the effective recuperation power. If the maximum value is higher than the limit, it is reduced to the limit value.
{ } Conceptually, this corresponds, in the figure above, to assigning all the red marks that fall below the blue line to the corresponding point on the blue line.
In the steps before, the values for P(t)el.recu have been calculated by using the positive and negative wheel power. But the electric motor can only regain energy when the wheel power is negative (during deceleration). Therefore, to compute the average recuperated electrical energy, the values calculated for an operating point with a positive wheel power must be set at zero.
After this step, for each phase of the cycle, the mean effective recuperation power can be determined (as in section 7.1.2.1.2.1).
∑
To get the consumption in Wh/km, has to be transformed from kW to W and then divided by the mean cycle speed.
The power that has to be provided to the drivetrain from the battery can be calculated with the follow-ing formula.
where:
is the total electrical consumption of the drive train for the specific cycle in Wh/km
31.01.2013
80
Where numerical values have been presented in this chapter, they were based on current technology applied in mass market vehicles. In order to take into account vehicles that may differ from the aver-age, adjustments to the above calculated results can be made by introducing a variation factor.
An average peak efficiency of 90 % is found for the drive train system considered above (from approx-imately 95 % for the electric motor and approximately 95 % for the power electronics). If the efficiency values of the vehicle, which is examined in the LCA, differ from these values, they can be used to calcu-late a variation factor for the drivetrain.
where:
is the variation factor for the drive train consumption
is the average peak efficiency for the drive train defined in the guidelines (90 %)
is the efficiency of the electric motor from the examined vehicle
is the efficiency of the power electronics from the examined vehicle
The calculated variation factors can then be applied to the calculation of total consumption.
where:
is the total electrical consumption of the drive train in the specific cycle in Wh/km con-sidering the variation factor
7.1.2.1.1.2.2 Calculation of basic consumption via drivetrain efficiencies
If an LCA focusses on optimisation of components in the drivetrain, the simplified approach described above cannot be used. In these cases, a more detailed model of the powertrain needs to be estab-lished. The framework proposed here takes into account functional component efficiencies at the component's operational load, but it does not reflect the energy demand to overcome the inertia of rotating elements. Thus, a detailed dynamic powertrain model needs to be used if this influence is im-portant for a study (e.g. if the effects of different tyres are to be assessed). A current standard drive train for an electric vehicle is composed of a high voltage traction battery (B), which provides the elec-trical power; the power electronics (PE), which processes the electrical power and feeds it into the elec-tric motor (EM); an electric motor, which converts the electrical energy into mechanical energy; and a single transmission (T) stage with a built in differential that transfers the power to the wheels. Each one of these components has its own dynamic behaviour, meaning that its efficiency changes according to its current operating point. Hence, the power taken from the battery at a specific time instant, i de-pends on the wheel power and the efficiencies of the four modules mentioned above at the given time, i:
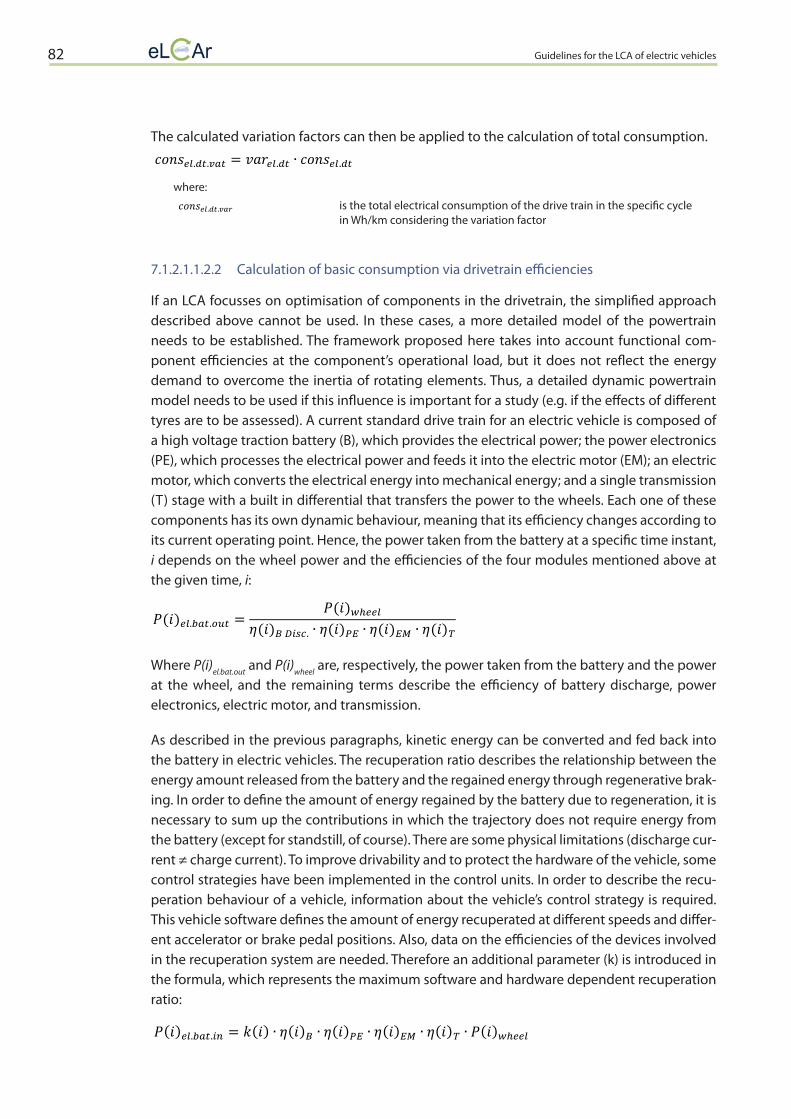
Guidelines for the LCA of electric vehicles82
The calculated variation factors can then be applied to the calculation of total consumption.
where:
is the total electrical consumption of the drive train in the specific cycle in Wh/km considering the variation factor
7.1.2.1.1.2.2 Calculation of basic consumption via drivetrain efficiencies
If an LCA focusses on optimisation of components in the drivetrain, the simplified approach described above cannot be used. In these cases, a more detailed model of the powertrain needs to be established. The framework proposed here takes into account functional com-ponent efficiencies at the component’s operational load, but it does not reflect the energy demand to overcome the inertia of rotating elements. Thus, a detailed dynamic powertrain model needs to be used if this influence is important for a study (e.g. if the effects of different tyres are to be assessed). A current standard drive train for an electric vehicle is composed of a high voltage traction battery (B), which provides the electrical power; the power electronics (PE), which processes the electrical power and feeds it into the electric motor (EM); an electric motor, which converts the electrical energy into mechanical energy; and a single transmission (T) stage with a built in differential that transfers the power to the wheels. Each one of these components has its own dynamic behaviour, meaning that its efficiency changes according to its current operating point. Hence, the power taken from the battery at a specific time instant, i depends on the wheel power and the efficiencies of the four modules mentioned above at the given time, i:
Where P(i)el.bat.out and P(i)wheel are, respectively, the power taken from the battery and the power at the wheel, and the remaining terms describe the efficiency of battery discharge, power electronics, electric motor, and transmission.
As described in the previous paragraphs, kinetic energy can be converted and fed back into the battery in electric vehicles. The recuperation ratio describes the relationship between the energy amount released from the battery and the regained energy through regenerative brak-ing. In order to define the amount of energy regained by the battery due to regeneration, it is necessary to sum up the contributions in which the trajectory does not require energy from the battery (except for standstill, of course). There are some physical limitations (discharge cur-rent ≠ charge current). To improve drivability and to protect the hardware of the vehicle, some control strategies have been implemented in the control units. In order to describe the recu-peration behaviour of a vehicle, information about the vehicle’s control strategy is required. This vehicle software defines the amount of energy recuperated at different speeds and differ-ent accelerator or brake pedal positions. Also, data on the efficiencies of the devices involved in the recuperation system are needed. Therefore an additional parameter (k) is introduced in the formula, which represents the maximum software and hardware dependent recuperation ratio:
31.01.2013
80
Where numerical values have been presented in this chapter, they were based on current technology applied in mass market vehicles. In order to take into account vehicles that may differ from the aver-age, adjustments to the above calculated results can be made by introducing a variation factor.
An average peak efficiency of 90 % is found for the drive train system considered above (from approx-imately 95 % for the electric motor and approximately 95 % for the power electronics). If the efficiency values of the vehicle, which is examined in the LCA, differ from these values, they can be used to calcu-late a variation factor for the drivetrain.
where:
is the variation factor for the drive train consumption
is the average peak efficiency for the drive train defined in the guidelines (90 %)
is the efficiency of the electric motor from the examined vehicle
is the efficiency of the power electronics from the examined vehicle
The calculated variation factors can then be applied to the calculation of total consumption.
where:
is the total electrical consumption of the drive train in the specific cycle in Wh/km con-sidering the variation factor
7.1.2.1.1.2.2 Calculation of basic consumption via drivetrain efficiencies
If an LCA focusses on optimisation of components in the drivetrain, the simplified approach described above cannot be used. In these cases, a more detailed model of the powertrain needs to be estab-lished. The framework proposed here takes into account functional component efficiencies at the component's operational load, but it does not reflect the energy demand to overcome the inertia of rotating elements. Thus, a detailed dynamic powertrain model needs to be used if this influence is im-portant for a study (e.g. if the effects of different tyres are to be assessed). A current standard drive train for an electric vehicle is composed of a high voltage traction battery (B), which provides the elec-trical power; the power electronics (PE), which processes the electrical power and feeds it into the elec-tric motor (EM); an electric motor, which converts the electrical energy into mechanical energy; and a single transmission (T) stage with a built in differential that transfers the power to the wheels. Each one of these components has its own dynamic behaviour, meaning that its efficiency changes according to its current operating point. Hence, the power taken from the battery at a specific time instant, i de-pends on the wheel power and the efficiencies of the four modules mentioned above at the given time, i:
31.01.2013
81
Where P(i)el.bat.out and P(i)wheel are, respectively, the power taken from the battery and the power at the wheel, and the remaining terms describe the efficiency of battery discharge, power electronics, electric motor, and transmission.
As described in the previous paragraphs, kinetic energy can be converted and fed back into the battery in electric vehicles. The recuperation ratio describes the relationship between the energy amount re-leased from the battery and the regained energy through regenerative braking. In order to define the amount of energy regained by the battery due to regeneration, it is necessary to sum up the contribu-tions in which the trajectory does not require energy from the battery (except for standstill, of course). There are some physical limitations (discharge current ≠ charge current). To improve drivability and to protect the hardware of the vehicle, some control strategies have been implemented in the control units. In order to describe the recuperation behaviour of a vehicle, information about the vehicle's con-trol strategy is required. This vehicle software defines the amount of energy recuperated at different speeds and different accelerator or brake pedal positions. Also, data on the efficiencies of the devices involved in the recuperation system are needed. Therefore an additional parameter (k) is introduced in the formula, which represents the maximum software and hardware dependent recuperation ratio:
In the two formulas above, it is important to note that the efficiencies are not constants, but functions of the specific working point, meaning that, for this computation, the efficiency characteristics of the different devices need to be known.
In a battery, efficiency mainly depends on internal resistance. It defines the energy losses during charg-ing or discharging. Moreover, efficiency can also be dependent on battery temperature. It is further to be noted that the efficiencies of discharging and charging can be different.
The inverter and the motor both have variable efficiencies over torque and speed. Both components in combination can have an efficiency of 90 to 95 % at their best point. But at a low load and at a low or very high speed range, their combined efficiency is rather small and can drop below 50 %. Considering the specific operating-points through efficiency maps is therefore very important for a detailed analy-sis.
The mechanical transmission, including differential, currently with usually only one gear ratio, is, how-ever, rather simple to characterize. Energy transmission through the gears is almost lossless over the entire speed range. The efficiencies of these mechanical power transmissions can be considered around 98 %.
The recuperation ratio depends on the battery, the size of the electric motor (rated power) and the software settings of the control modules. Depending on the operating point, actual recuperation ratios can lie between 5 % and 30 %. But for a detailed simulation, information from the manufacturer is needed.
Calculations can be found in the literature in which, instead of a dynamic model, fixed efficiencies (typ-ically the nominal ones given by the manufacturer) are used in the formula above. Often this is due to

Guidelines for the LCA of electric vehicles 83
In the two formulas above, it is important to note that the efficiencies are not constants, but functions of the specific working point, meaning that, for this computation, the efficiency characteristics of the different devices need to be known.
In a battery, efficiency mainly depends on internal resistance. It defines the energy losses dur-ing charging or discharging. Moreover, efficiency can also be dependent on battery tempera-ture. It is further to be noted that the efficiencies of discharging and charging can be different.
The inverter and the motor both have variable efficiencies over torque and speed. Both com-ponents in combination can have an efficiency of 90 to 95 % at their best point. But at a low load and at a low or very high speed range, their combined efficiency is rather small and can drop below 50 %. Considering the specific operating-points through efficiency maps is there-fore very important for a detailed analysis.
The mechanical transmission, including differential, currently with usually only one gear ratio, is, however, rather simple to characterize. Energy transmission through the gears is almost lossless over the entire speed range. The efficiencies of these mechanical power transmissions can be considered around 98 %.
The recuperation ratio depends on the battery, the size of the electric motor (rated power) and the software settings of the control modules. Depending on the operating point, actual recuperation ratios can lie between 5 % and 30 %. But for a detailed simulation, information from the manufacturer is needed.
Calculations can be found in the literature in which, instead of a dynamic model, fixed efficien-cies (typically the nominal ones given by the manufacturer) are used in the formula above. Often this is due to the lack of data concerning the dynamic behaviour of the various com-ponents. In this case, it is important to bear in mind the approximation that comes with this simplification and the need to document and report it appropriately.
When the goal and scope of the study require detailed modelling of the vehicle’s drive train, the moment of inertia of the rotating components during acceleration and deceleration can-not be neglected. This may, depending on the amount of inertia, have a significant impact on the required acceleration energy. Not only must the vehicle be accelerated to its translational velocity, the rotating masses within the vehicle (electric motor, transmission, tyres) must be brought to their corresponding rotational speeds.
Overall, the detailed modelling of a vehicle drivetrain for calculating the required electrical power from a given wheel power requires many parameters and considerable technical infor-mation about the components within the drivetrain. To date, various software tools exist to facilitate these calculations.
Once the power coming out of the battery for each step of the trajectory is known, the energy consumption can be computed by integrating power over the time, TC, during which the mo-tion has taken place:
31.01.2013
82
the lack of data concerning the dynamic behaviour of the various components. In this case, it is im-portant to bear in mind the approximation that comes with this simplification and the need to docu-ment and report it appropriately.
When the goal and scope of the study require detailed modelling of the vehicle’s drive train, the mo-ment of inertia of the rotating components during acceleration and deceleration cannot be neglected. This may, depending on the amount of inertia, have a significant impact on the required acceleration energy. Not only must the vehicle be accelerated to its translational velocity, the rotating masses with-in the vehicle (electric motor, transmission, tires) must be brought to their corresponding rotational speeds.
Overall, the detailed modelling of a vehicle drivetrain for calculating the required electrical power from a given wheel power requires many parameters and considerable technical information about the components within the drivetrain. To date, various software tools exist to facilitate these calculations.
Once the power coming out of the battery for each step of the trajectory is known, the energy con-sumption can be computed by integrating power over the time, TC, during which the motion has taken place:
∫
7.1.2.1.1.3 Heating and air conditioning
The use patterns of heating and air conditioning devices vary from user to user. Basically, the ambient temperature for human comfort lies around 20-23 °C (ArGV3, 2011), but, of course, there are also per-sonal preferences. At the start of a car journey, one typically brings the temperature in the cabin to the comfort range by using heating and air conditioning. The energy needed to reach this temperature depends on the ambient conditions of the vehicle, e.g. temperature, direct and diffuse radiation, vehi-cle insulation, etc., (Khayyam, 2011).
In a vehicle with an internal combustion engine, the air in the vehicle cabin is heated with the engine coolant, which normally has a temperature of over 80 °C. The heat in the coolant is caused by the rela-tively low efficiency of the ICE in which a big part of the fuel energy is dissipated as heat. A BEV has relatively high drivetrain efficiency so heat losses are small and with the low temperature level of the coolant it is not possible to heat up the interior adequately. A special heater is needed. In current vehi-cles there are two main technologies. One option is a PTC heater (Positive Temperature Coefficient heating element), comparable with a normal immersion heater. The power demand of such a heater is up to 5 kW. The second option is a heat pump. It can be operated as an air conditioning and a heating device. When operated as a heating device the power demand is around 3 kW (depending on the out-side temperature) in order to achieve an acceptable heating of the interior.
Air conditioning in current BEVs uses the same system found in normal ICE vehicles. Compared to heating, the power demand of air conditioning is relatively low. Current systems require around 1 kW (standard ICE air conditioning system driven by an electric motor).
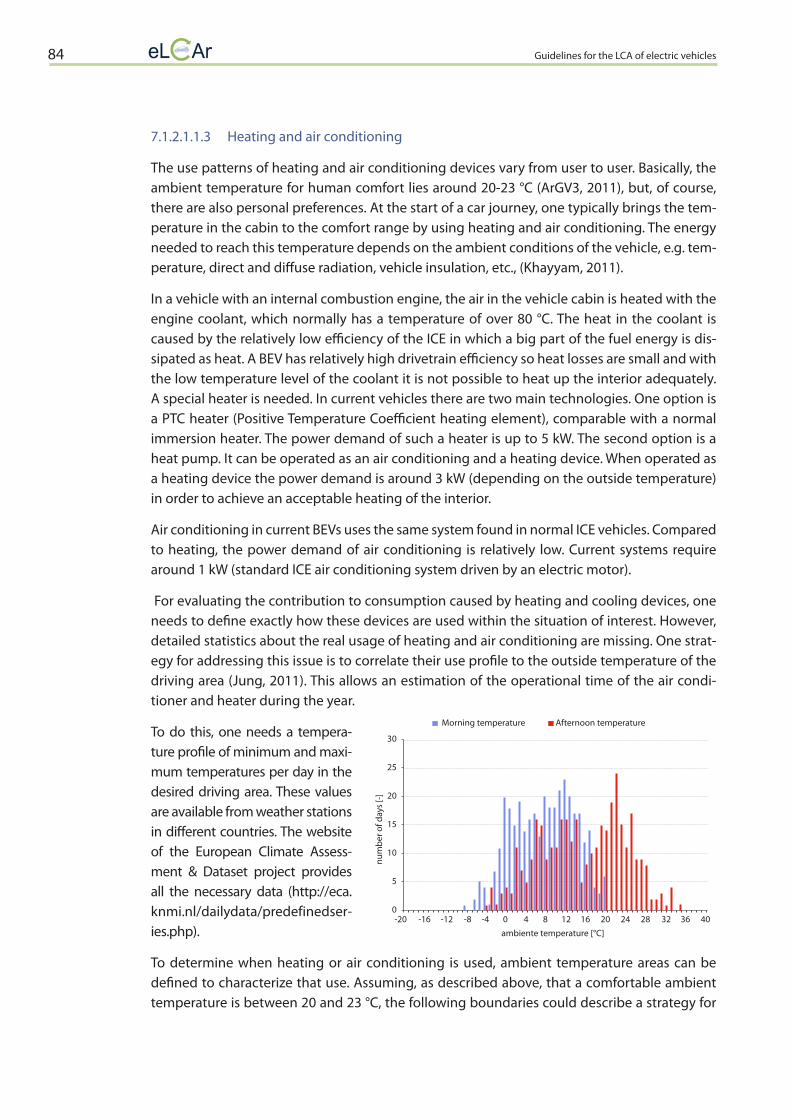
Guidelines for the LCA of electric vehicles84
7.1.2.1.1.3 Heating and air conditioning
The use patterns of heating and air conditioning devices vary from user to user. Basically, the ambient temperature for human comfort lies around 20-23 °C (ArGV3, 2011), but, of course, there are also personal preferences. At the start of a car journey, one typically brings the tem-perature in the cabin to the comfort range by using heating and air conditioning. The energy needed to reach this temperature depends on the ambient conditions of the vehicle, e.g. tem-perature, direct and diffuse radiation, vehicle insulation, etc., (Khayyam, 2011).
In a vehicle with an internal combustion engine, the air in the vehicle cabin is heated with the engine coolant, which normally has a temperature of over 80 °C. The heat in the coolant is caused by the relatively low efficiency of the ICE in which a big part of the fuel energy is dis-sipated as heat. A BEV has relatively high drivetrain efficiency so heat losses are small and with the low temperature level of the coolant it is not possible to heat up the interior adequately. A special heater is needed. In current vehicles there are two main technologies. One option is a PTC heater (Positive Temperature Coefficient heating element), comparable with a normal immersion heater. The power demand of such a heater is up to 5 kW. The second option is a heat pump. It can be operated as an air conditioning and a heating device. When operated as a heating device the power demand is around 3 kW (depending on the outside temperature) in order to achieve an acceptable heating of the interior.
Air conditioning in current BEVs uses the same system found in normal ICE vehicles. Compared to heating, the power demand of air conditioning is relatively low. Current systems require around 1 kW (standard ICE air conditioning system driven by an electric motor).
For evaluating the contribution to consumption caused by heating and cooling devices, one needs to define exactly how these devices are used within the situation of interest. However, detailed statistics about the real usage of heating and air conditioning are missing. One strat-egy for addressing this issue is to correlate their use profile to the outside temperature of the driving area (Jung, 2011). This allows an estimation of the operational time of the air condi-tioner and heater during the year.
To do this, one needs a tempera-ture profile of minimum and maxi-mum temperatures per day in the desired driving area. These values are available from weather stations in different countries. The website of the European Climate Assess-ment & Dataset project provides all the necessary data (http://eca.knmi.nl/dailydata/predefinedser-ies.php).
To determine when heating or air conditioning is used, ambient temperature areas can be defined to characterize that use. Assuming, as described above, that a comfortable ambient temperature is between 20 and 23 °C, the following boundaries could describe a strategy for
Morning temperature Afternoon temperature
ambiente temperature [°C]
num
ber o
f day
s [-]
30
25
20
15
10
5
0-20 -16 -12 -8 -4 0 4 8 12 16 20 24 28 32 36 40

Guidelines for the LCA of electric vehicles 85
maintaining this temperature interval inside the vehicle using the heating and air condition-ing devices:
Heating set to maximum: ambient temperature < 10 °CHeating set to medium: 10 °C ≤ ambient temperature < 15 °CAir conditioning set to medium: 20 °C < ambient temperature ≤ 25 °CAir conditioning set to maximum: ambient temperature > 25 °C
In the area between 15 °C and 20 °C it is assumed that neither the heating nor the air condi-tioning is active. It has to be borne in mind that the temperature in the vehicle is usually above the ambient temperature due to solar gains and internal gains from passengers. The medium setting means that the system is running at half its maximum power.
For the morning trips, the minimum temperature curve can be used to determine the activa-tion time, for the afternoon trips the maximum temperature curve can be used. The total op-eration time can then be weighted between morning and afternoon trips (for example 1/3 in the morning, 2/3 in the afternoon). The fraction can be based on driving data from the chosen region. If one is interested in the average contribution to consumption, including the influ-ence of the various seasons, one can use the temperature curves to evaluate the total days of operation of the corresponding use of the heating and cooling devices:
Heating maximum
Heating medium
A/C medium
A/C maximum
No heating No A/C
Morning 221 139 0 0 0
Afternoon 122 49 141 0 48
Total operation days (weighted) 155 79 94 0 32

Guidelines for the LCA of electric vehicles86
In addition to the comfort related operation of heating and air conditioning, there is also a safety aspect that makes users activate the air conditioner; some climatic parameters (low out-side temperature and high humidity) might lead to a fogged windscreen. This happens when the surface temperature of the glass is equal to or below the dew point temperature, which is determined by the cabin temperature and humidity (Park, 2006). Simultaneous use of the heating and air-conditioning devices is then typical to de-fog the windscreen and prevent the formation of further condensation. This leads to an increase in consumption. Due to the com-plex interaction of outside and inner temperature and humidity, the precise modelling of the fogging phenomenon for evaluating use of heating and air-conditioning devices lies outside the scope of these guidelines.
Here, the mean activation time of the air conditioning for the defog function will be estimated by identifying the number of days in which the climatic conditions lead to an increased risk of condensation. For outside temperatures between 0 and 10 °C and humidity >80 %, a dew point between 0 and 8 °C results if the cabin temperature is around 20 °C. This corresponds to a high risk of windscreen fogging. Hence, the following conditions represent suitable ranges for driving situations that may require the use of air conditioning for defogging:
Temperature range: 0°C to 10 °C Relative humidity: over 80 %
For morning and afternoon temperatures, the number of days has to be determined by look-ing, as discussed above, at data from weather stations in which both criteria apply. Afterwards, the morning and afternoon days are weighted as has been done for the normal activation times. This results in an increase in the operational time of the air conditioner at medium pow-er.
These values, then, provide the basis for the energy demand calculation for heating and air conditioning. With the average driving speed profile and the annual driving distance, the an-nual vehicle operating hours can be calculated.
where:
is the total annual vehicle operation time in hours
is the annual vehicle mileage in km
The individual annual energy demand for air conditioning or heating is then calculated ac-cording to the formula below where device power is needed as an input parameter. These values have to be varied according to the used technology (Standard PTC Heater, Standard A/C or future heating/cooling system).
where: is the annual energy consumption of the device (heating or A/C) in Wh/year
is the total time of device operation in days
is the total annual vehicle operation time in hours
is the power demand of heating or air conditioning in W
31.01.2013
84
temperature curves to evaluate the total days of operation of the corresponding use of the heating and cooling devices:
In addition to the comfort related operation of heating and air conditioning, there is also a safety as-pect that makes users activate the air conditioner; some climatic parameters (low outside temperature and high humidity) might lead to a fogged windscreen. This happens when the surface temperature of the glass is equal to or below the dew point temperature, which is determined by the cabin tempera-ture and humidity (Park, 2006). Simultaneous use of the heating and air-conditioning devices is then typical to de-fog the windscreen and prevent the formation of further condensation. This leads to an increase in consumption. Due to the complex interaction of outside and inner temperature and humid-ity, the precise modelling of the fogging phenomenon for evaluating use of heating and air-conditioning devices lies outside the scope of these guidelines.
Here, the mean activation time of the air conditioning for the defog function will be estimated by iden-tifying the number of days in which the climatic conditions lead to an increased risk of condensation. For outside temperatures between 0 and 10 °C and humidity >80 %, a dew point between 0 and 8 °C results if the cabin temperature is around 20 °C. This corresponds to a high risk of windscreen fogging. Hence, the following conditions represent suitable ranges for driving situations that may require the use of air conditioning for defogging:
Temperature range: 0°C to 10 °C
Relative humidity: over 80 %
For morning and afternoon temperatures, the number of days has to be determined by looking, as dis-cussed above, at data from weather stations in which both criteria apply. Afterwards, the morning and afternoon days are weighted as has been done for the normal activation times. This results in an in-crease in the operational time of the air conditioner at medium power.
These values, then, provide the basis for the energy demand calculation for heating and air condition-ing. With the average driving speed profile and the annual driving distance, the annual vehicle operat-ing hours can be calculated.
where:
is the total annual vehicle operation time in hours
is the annual vehicle mileage in km
The individual annual energy demand for air conditioning or heating is then calculated according to the formula below where device power is needed as an input parameter. These values have to be var-
Heating Heating A/C A/C No heatingmaximum medium medium maximum No A/C
Morning 221 139 0 0 0Afternoon 122 49 141 0 48Total operation days (weighted) 155 79 94 0 32 31.01.2013
84
temperature curves to evaluate the total days of operation of the corresponding use of the heating and cooling devices:
In addition to the comfort related operation of heating and air conditioning, there is also a safety as-pect that makes users activate the air conditioner; some climatic parameters (low outside temperature and high humidity) might lead to a fogged windscreen. This happens when the surface temperature of the glass is equal to or below the dew point temperature, which is determined by the cabin tempera-ture and humidity (Park, 2006). Simultaneous use of the heating and air-conditioning devices is then typical to de-fog the windscreen and prevent the formation of further condensation. This leads to an increase in consumption. Due to the complex interaction of outside and inner temperature and humid-ity, the precise modelling of the fogging phenomenon for evaluating use of heating and air-conditioning devices lies outside the scope of these guidelines.
Here, the mean activation time of the air conditioning for the defog function will be estimated by iden-tifying the number of days in which the climatic conditions lead to an increased risk of condensation. For outside temperatures between 0 and 10 °C and humidity >80 %, a dew point between 0 and 8 °C results if the cabin temperature is around 20 °C. This corresponds to a high risk of windscreen fogging. Hence, the following conditions represent suitable ranges for driving situations that may require the use of air conditioning for defogging:
Temperature range: 0°C to 10 °C
Relative humidity: over 80 %
For morning and afternoon temperatures, the number of days has to be determined by looking, as dis-cussed above, at data from weather stations in which both criteria apply. Afterwards, the morning and afternoon days are weighted as has been done for the normal activation times. This results in an in-crease in the operational time of the air conditioner at medium power.
These values, then, provide the basis for the energy demand calculation for heating and air condition-ing. With the average driving speed profile and the annual driving distance, the annual vehicle operat-ing hours can be calculated.
where:
is the total annual vehicle operation time in hours
is the annual vehicle mileage in km
The individual annual energy demand for air conditioning or heating is then calculated according to the formula below where device power is needed as an input parameter. These values have to be var-
Heating Heating A/C A/C No heatingmaximum medium medium maximum No A/C
Morning 221 139 0 0 0Afternoon 122 49 141 0 48Total operation days (weighted) 155 79 94 0 32
31.01.2013
85
ied according to the used technology (Standard PTC Heater, Standard A/C or future heating/cooling system).
where:
is the annual energy consumption of the device (heating or A/C) in Wh/year
is the total time of device operation in days
is the total annual vehicle operation time in hours
is the power demand of heating or air conditioning in W
Of course, without explicitly repeating the formulas, the above contributions have also to be evaluated separately for “medium” and “maximum” use of the specific device and then added together for its to-tal consumption.
And with the annual distance driven, the mean energy consumption over the year can be estimated.
where:
is the mean energy consumption of the device (heating or A/C) in Wh/km
is the mean energy consumption due to comfort devices
Pre-cooling or pre-heating
A special case of comfort device use is pre-cooling or pre-heating the vehicle while plugged into the charging device. In this case, the vehicle’s heating or air-conditioning system is not powered by the high voltage battery, but directly from the main grid. The maximum heating or cooling capacity is de-pendent on the maximum output of the power supply. At a quick charging station, all functions can be used at their maximum device power, but at a normal household plug, the maximum power is limited (220V, 10 to 16A). The systems can be programmed so the vehicle is conditioned to the desired degree by the desired departure time. Then the air conditioning system just needs to maintain the operational interior temperature once unplugged. If one arrives at the car later than the pre-set time, it is possible that the interior has to be cooled down or heated up again.
The range of the vehicle is preserved by this type of pre-conditioning. However, one must not forget that this type of heating or cooling also consumes energy that must be considered in the overall con-sumption analysis.

Guidelines for the LCA of electric vehicles 87
Of course, without explicitly repeating the formulas, the above contributions have also to be evaluated separately for “medium” and “maximum” use of the specific device and then added together for its total consumption.
And with the annual distance driven, the mean energy consumption over the year can be estimated.
where:
is the mean energy consumption of the device (heating or A/C) in Wh/km
is the mean energy consumption due to comfort devices
Pre-cooling or pre-heating
A special case of comfort device use is pre-cooling or pre-heating the vehicle while plugged into the charging device. In this case, the vehicle’s heating or air-conditioning system is not powered by the high voltage battery, but directly from the main grid. The maximum heating or cooling capacity is dependent on the maximum output of the power supply. At a quick charging station, all functions can be used at their maximum device power, but at a normal household plug, the maximum power is limited (220V, 10 to 16A). The systems can be pro-grammed so the vehicle is conditioned to the desired degree by the desired departure time. Then the air conditioning system just needs to maintain the operational interior temperature once unplugged. If one arrives at the car later than the pre-set time, it is possible that the inte-rior has to be cooled down or heated up again.
The range of the vehicle is preserved by this type of pre-conditioning. However, one must not forget that this type of heating or cooling also consumes energy that must be considered in the overall consumption analysis.
7.1.2.1.1.4 Auxiliaries
There are additional auxiliary consumers that have to be considered for determining energy consumption. The standby and mean electrical power demand of each device (e.g. lighting, navigation, etc.) define its energy consumption. Again, exact data on the consumption of aux-iliaries is lacking. This contribution can be estimated from the power demand and a use strat-egy for the devices.
Some typical parameters are presented below (Geringer, 2012). Their use is defined in terms of mean ratios:
31.01.2013
85
ied according to the used technology (Standard PTC Heater, Standard A/C or future heating/cooling system).
where:
is the annual energy consumption of the device (heating or A/C) in Wh/year
is the total time of device operation in days
is the total annual vehicle operation time in hours
is the power demand of heating or air conditioning in W
Of course, without explicitly repeating the formulas, the above contributions have also to be evaluated separately for “medium” and “maximum” use of the specific device and then added together for its to-tal consumption.
And with the annual distance driven, the mean energy consumption over the year can be estimated.
where:
is the mean energy consumption of the device (heating or A/C) in Wh/km
is the mean energy consumption due to comfort devices
Pre-cooling or pre-heating
A special case of comfort device use is pre-cooling or pre-heating the vehicle while plugged into the charging device. In this case, the vehicle’s heating or air-conditioning system is not powered by the high voltage battery, but directly from the main grid. The maximum heating or cooling capacity is de-pendent on the maximum output of the power supply. At a quick charging station, all functions can be used at their maximum device power, but at a normal household plug, the maximum power is limited (220V, 10 to 16A). The systems can be programmed so the vehicle is conditioned to the desired degree by the desired departure time. Then the air conditioning system just needs to maintain the operational interior temperature once unplugged. If one arrives at the car later than the pre-set time, it is possible that the interior has to be cooled down or heated up again.
The range of the vehicle is preserved by this type of pre-conditioning. However, one must not forget that this type of heating or cooling also consumes energy that must be considered in the overall con-sumption analysis.

Guidelines for the LCA of electric vehicles88
Auxiliaries
Auxiliaries
Lighting– Mean electrical power: 140 W (conventional), 50 W (LED)– Mean use ratio: 75 %
Radio/Navigation– Mean electrical power: 20 W– Mean use ratio: 75 %
Seat heating (per seat)– Mean electrical power: 30 W (max. 70W) – Mean use ratio: 5 %
These systems are all connected to the vehicle’s 12V grid and the grid is powered by the high voltage battery through a DC/DC converter. To calculate the power consumption for the aux-iliaries, the effi ciency of the DC/DC converter needs to be included. Its effi ciency basically de-pends on the power demand of the 12V grid, but for a simple approach, the average effi ciency can be assumed to be around 90 %.
To calculate the resulting additional consumption of auxiliaries, the following formula can then be used:
where:
is the mean energy consumption of all auxiliaries in Wh/km
is the mean annual speed according to the driving profi le in km/h
is the average effi ciency of the DC/DC converter (90 %)
is the mean power demand of the auxiliary device in W
is the user defi ned use ratio for the device
Since the auxiliary power demand is relatively low, their cumulative consumption usually has little eff ect on total consumption.
Since the auxiliary power demand is relatively low, their cumulated consumption has mostly a little eff ect on the total consumption.
7.1.2.1.1.5 Battery losses in standstill
The additional consumption due to internal battery losses during periods of standstill de-pends on the battery type and design, and on the use pattern of the vehicle. Sodium nickel chloride batteries, which operate at around 300 °C constantly need about 60-80 W to maintain that temperature. A battery of 18 kWh capacity would thus be discharged after roughly 10 days of standstill. Lithium-ion-batteries operate at ambient temperatures and can have very low internal losses if they consist of not too many cells and have a good balancing strategy.
31.01.2013
86
7.1.2.1.1.4 Auxiliaries
There are additional auxiliary consumers that have to be considered for determining energy consump-tion. The standby and mean electrical power demand of each device (e.g. lighting, navigation, etc.,) de-fine its energy consumption. Again, exact data on the consumption of auxiliaries is lacking. This contri-bution can be estimated from the power demand and a use strategy for the devices.
Some typical parameters are presented below (Geringer, 2012). Their use is defined in terms of mean ratios:
Lighting - Mean electrical power: 140 W (conventional), 50 W (LED) - Mean use ratio: 75 %
Radio/Navigation - Mean electrical power: 20 W - Mean use ratio: 75 %
Seat heating (per seat) - Mean electrical power: 30 W (max. 70W) - Mean use ratio: 5 %
These systems are all connected to the vehicle’s 12V grid and the grid is powered by the high voltage battery through a DC/DC converter. To calculate the power consumption for the auxiliaries, the effi-ciency of the DC/DC converter needs to be included. Its efficiency basically depends on the power de-mand of the 12V grid, but for a simple approach, the average efficiency can be assumed to be around 90 %.
To calculate the resulting additional consumption of auxiliaries, the following formula can then be used:
∑
where:
is the mean energy consumption of all auxiliaries in Wh/km
is the mean annual speed according to the driving profile in km/h
is the average efficiency of the DC/DC converter (90 %)
is the mean power demand of the auxiliary device in W
is the user defined use ratio for the device
Since the auxiliary power demand is relatively low, their cumulative consumption usually has little ef-fect on total consumption.

Guidelines for the LCA of electric vehicles 89
In special cases, however, a Li-ion battery can lose up to 50% of its energy content in the fi rst week of non-use. This can be the case for vehicles which have batteries consisting of several thousand small cells (e.g. the 18650 type16). Since standstill losses have to be related to the dis-tance driven by the vehicle, it has to be known (or assumed) how long vehicles remain unused and how far they are driven in a given period of time (e.g. a month or a year).
In the case of high temperature batteries, the loss can be calculated by simply multiplying the power demand for maintaining the temperature by the period of time and dividing the result by the distance driven in this period.
where:
is the mean energy consumption due to heat losses from the battery in Wh/km
is the mean power demand for maintaining battery temperature in W
is the time period under investigation in hours (e.g. 1 year = 8760 h)
is the distance driven in the time period under investigation in km (e.g. 10000 km)
For a BEV with a Zebra Battery that is used 10 000 km/yr, one fi nds battery losses of 53 Wh/km.
For Lithium-ion batteries, the loss in standstill highly depends on the design of the batteries. Therefore, it is not possible to provide a reasonable estimate in these guidelines. However, a description of how to use information, which might be easily available for existing vehicles, for estimations can be given. If the per day state of charge percentage loss in the battery at un-plugged standstill is known, one can calculate the loss per hour, assuming a linear relationship (which will most probably underestimate the real loss). Together with battery capacity, one can then calculate the energy loss per hour. This result is multiplied with the number of hours the vehicle is parked unplugged during a certain period (e.g. a year) and then divided by the distance driven in this period.
where:
is the mean energy consumption due to battery standstill losses in Wh/km
is the total battery capacity in Wh
is the mean loss of state of charge per hour (e.g. if the loss is x% per hour, x/100 has to be used.)
is the number of hours that the BEV is parked unplugged during the period under investigation
is the distance driven in the time period under investigation in km (e.g. 10 000 km)
Assuming that a BEV is left parked unplugged for 8 hours per day and twice per year for one continuous week, one gets values of less than 1 Wh/km for a 20 kWh battery with 2% loss per day or of more than 50 Wh/km for a 56 kWh battery with 50% loss in the fi rst week.
16 18650 cells are cylindrical Li-ion cells of around 3.7V and 2-4 Ah that are typically used in laptop computers.
31.01.2013
87
Since the auxiliary power demand is relatively low, their cumulated consumption has mostly a little ef-fect on the total consumption.
7.1.2.1.1.5 Battery losses in standstill
The additional consumption due to internal battery losses during periods of standstill depends on the battery type and design, and on the use pattern of the vehicle. Sodium nickel chloride batteries, which operate at around 300 °C constantly need about 60-80 W to maintain that temperature. A battery of 18 kWh capacity would thus be discharged after roughly 10 days of standstill. Lithium-ion-batteries operate at ambient temperatures and can have very low internal losses if they consist of not too many cells and have a good balancing strategy. In special cases, however, a Li-ion battery can lose up to 50% of its energy content in the first week of non-use. This can be the case for vehicles which have batter-ies consisting of several thousand small cells (e.g. the 18650 type14). Since standstill losses have to be related to the distance driven by the vehicle, it has to be known (or assumed) how long vehicles re-main unused and how far they are driven in a given period of time (e.g. a month or a year).
In the case of high temperature batteries, the loss can be calculated by simply multiplying the power demand for maintaining the temperature by the period of time and dividing the result by the distance driven in this period.
where:
is the mean energy consumption due to heat losses from the battery in Wh/km
is the mean power demand for maintaining battery temperature in W
is the time period under investigation in hours (e.g. 1 year = 8760 h)
is the distance driven in the time period under investigation in km (e.g. 10000 km)
For a BEV with a Zebra Battery that is used 10 000 km/yr, one finds battery losses of 53 Wh/km.
For Lithium-ion batteries, the loss in standstill highly depends on the design of the batteries. Therefore, it is not possible to provide a reasonable estimate in these guidelines. However, a description of how to use information, which might be easily available for existing vehicles, for estimations can be given. If the per day state of charge percentage loss in the battery at unplugged standstill is known, one can calculate the loss per hour, assuming a linear relationship (which will most probably underestimate the real loss). Together with battery capacity, one can then calculate the energy loss per hour. This result is multiplied with the number of hours the vehicle is parked unplugged during a certain period (e.g. a year) and then divided by the distance driven in this period.
where:
is the mean energy consumption due to battery standstill losses in Wh/km
is the total battery capacity in Wh
14 18650 cells are cylindrical Li-ion cells of around 3.7V and 2-4 Ah that are typically used in laptop computers.
31.01.2013
88
is the mean loss of state of charge per hour (e.g. if the loss is x% per hour, x/100 has to be used.)
is the number of hours that the BEV is parked unplugged during the period under in-vestigation
is the distance driven in the time period under investigation in km (e.g. 10 000 km)
Assuming that a BEV is left parked unplugged for 8 hours per day and twice per year for one continu-ous week, one gets values of less than 1 Wh/km for a 20 kWh battery with 2% loss per day or of more than 50 Wh/km for a 56 kWh battery with 50% loss in the first week.
7.1.2.1.1.6 Battery charging
Up to now, the discussion has been focused on the energy which is taken from the battery of the vehi-cle, which is composed of the contributions from motion, comfort devices, auxiliaries, and internal bat-tery losses during standstill:
However, in the total “plug-to-wheel” consumption, it is also important to include the energy losses caused by the devices used to charge the battery. Overall, this contribution depends on the efficiency of the charging system, including the battery. A general formula for obtaining the energy taken from the grid as a function of the total energy taken from the battery is:
where:
consel.plug.total is the total energy taken from the battery, comprising basic motion, recuperation, heating, cooling, auxiliaries, and standstill losses in the battery
(i)B is the internal efficiency of the battery during charging
(i)CHG is the efficiency of the charging device.
Various parameters can have a large influence on the overall efficiency of the charging process, which is why in the above formula the efficiencies are not given as constants, but as general functions. First, there are different types of charging devices, ranging from on-board devices that can be connected to the power point at home to high voltage systems for faster charging. Moreover, batteries used in BEVs are assembled out of many small cells. This leads to complex charging strategies, which depend on cell and battery size, voltage level, battery temperatures, and other parameters. Furthermore, even within a given charger type (e.g. low voltage charger for home applications), a large spread of efficiencies is found among different products due to the various technology levels used, which can reach from be-low 80% to above 90%.
Since literature and data on the average influence of the charger is currently missing, a simplified cal-culation approach for battery charging efficiency of a standard device that might be used at home is proposed. This approach is based on the analysis of available measurements. The data analysis showed that, when charging, the initial state of battery charge can have a big influence on the overall charging efficiency. This effect is caused by the battery charging strategy. After every charging, all the small bat-tery cells need to be balanced, meaning that the cells must all be brought to the same voltage level.

Guidelines for the LCA of electric vehicles90
7.1.2.1.1.6 Battery charging
Up to now, the discussion has been focused on the energy which is taken from the battery of the vehicle, which is composed of the contributions from motion, comfort devices, auxiliaries, and internal battery losses during standstill:
However, in the total “plug-to-wheel” consumption, it is also important to include the energy losses caused by the devices used to charge the battery. Overall, this contribution depends on the efficiency of the charging system, including the battery. A general formula for obtaining the energy taken from the grid as a function of the total energy taken from the battery is:
where:consel.plug.total is the total energy taken from the battery, comprising basic motion, recuperation, heating, cooling, auxiliaries, and standstill in losses the battery
η(i)B is the internal efficiency of the battery during charging
η(i)CHG is the efficiency of the charging device.
Various parameters can have a large influence on the overall efficiency of the charging pro-cess, which is why in the above formula the efficiencies are not given as constants, but as general functions. First, there are different types of charging devices, ranging from on-board devices that can be connected to the power point at home to high voltage systems for faster charging. Moreover, batteries used in BEVs are assembled out of many small cells. This leads to complex charging strategies, which depend on cell and battery size, voltage level, battery temperatures, and other parameters. Furthermore, even within a given charger type (e.g. low voltage charger for home applications), a large spread of efficiencies is found among different products due to the various technology levels used, which can reach from below 80% to above 90%.
Since literature and data on the average influence of the charger is currently missing, a simpli-fied calculation approach for battery charging efficiency of a standard device that might be used at home is proposed. This approach is based on the analysis of available measurements. The data analysis showed that, when charging, the initial state of battery charge can have a big influence on the overall charging efficiency. This effect is caused by the battery charging strategy. After every charging, all the small battery cells need to be balanced, meaning that the cells must all be brought to the same voltage level. This process is relatively energy inten-sive and leads to a smaller charging efficiency if the initial state of battery charge is high, as it might be, for example, after driving just a short distance. A lower state of charge yields higher overall charging efficiency. Also the outside temperature during charging has an influence on the charging efficiency, but assuming the vehicle is charged in a garage most of the time, this circumstance can be neglected.
Based on the data analysis, the following equation has been derived to characterize energy storage efficiency, depending on the consumed energy from the battery per discharge and
31.01.2013
88
is the mean loss of state of charge per hour (e.g. if the loss is x% per hour, x/100 has to be used.)
is the number of hours that the BEV is parked unplugged during the period under in-vestigation
is the distance driven in the time period under investigation in km (e.g. 10 000 km)
Assuming that a BEV is left parked unplugged for 8 hours per day and twice per year for one continu-ous week, one gets values of less than 1 Wh/km for a 20 kWh battery with 2% loss per day or of more than 50 Wh/km for a 56 kWh battery with 50% loss in the first week.
7.1.2.1.1.6 Battery charging
Up to now, the discussion has been focused on the energy which is taken from the battery of the vehi-cle, which is composed of the contributions from motion, comfort devices, auxiliaries, and internal bat-tery losses during standstill:
However, in the total “plug-to-wheel” consumption, it is also important to include the energy losses caused by the devices used to charge the battery. Overall, this contribution depends on the efficiency of the charging system, including the battery. A general formula for obtaining the energy taken from the grid as a function of the total energy taken from the battery is:
where:
consel.plug.total is the total energy taken from the battery, comprising basic motion, recuperation, heating, cooling, auxiliaries, and standstill losses in the battery
(i)B is the internal efficiency of the battery during charging
(i)CHG is the efficiency of the charging device.
Various parameters can have a large influence on the overall efficiency of the charging process, which is why in the above formula the efficiencies are not given as constants, but as general functions. First, there are different types of charging devices, ranging from on-board devices that can be connected to the power point at home to high voltage systems for faster charging. Moreover, batteries used in BEVs are assembled out of many small cells. This leads to complex charging strategies, which depend on cell and battery size, voltage level, battery temperatures, and other parameters. Furthermore, even within a given charger type (e.g. low voltage charger for home applications), a large spread of efficiencies is found among different products due to the various technology levels used, which can reach from be-low 80% to above 90%.
Since literature and data on the average influence of the charger is currently missing, a simplified cal-culation approach for battery charging efficiency of a standard device that might be used at home is proposed. This approach is based on the analysis of available measurements. The data analysis showed that, when charging, the initial state of battery charge can have a big influence on the overall charging efficiency. This effect is caused by the battery charging strategy. After every charging, all the small bat-tery cells need to be balanced, meaning that the cells must all be brought to the same voltage level.

Guidelines for the LCA of electric vehicles 91
distance travelled (Bütler, 2013). These parameters combine the battery and the charger ef-fi ciency in one parameter set.
where:
is the total plug energy demand for one discharge cycle in kWh
is the total battery energy demand for one discharge cycle in kWh
with:
where:
is the sum of all mean energy consumptions between two battery charging procedures in Wh/km
is the distance between two battery charging procedures in km
With the resulting values it is possible to calculate an additional consumption caused by bat-tery charging.
where:
is the additional consumption caused by the battery charging process in Wh/km.
Based on this calculation method for the consumption of the energy storage system, an aver-age peak effi ciency of 81 % is found (combined from approximately 90 % for the battery and approximately 92 % for the charger). If the effi ciency values of the vehicle or charger, which is examined in the LCA, diff er from these values (e.g. when using fast charging), they can be used to calculate a variation factor for the drivetrain.
where:
is the variation factor for the consumption of the energy storage system
is the average peak effi ciency of the energy storage system defi ned in the guidelines (81 %)
is the effi ciency of the battery of the examined vehicle is the effi ciency of the battery of the examined vehicle
is the effi ciency of the charger of the examined vehicle
The calculated variation factors can then be applied to the calculation of consumption attrib-utable to battery charging.
where:
is the additional consumption attributable to the battery charging process in Wh/km with applied variation factor.
31.01.2013
89
This process is relatively energy intensive and leads to a smaller charging efficiency if the initial state of battery charge is high, as it might be, for example, after driving just a short distance. A lower state of charge yields higher overall charging efficiency. Also the outside temperature during charging has an influence on the charging efficiency, but assuming the vehicle is charged in a garage most of the time, this circumstance can be neglected.
Based on the data analysis, the following equation has been derived to characterize energy storage ef-ficiency, depending on the consumed energy from the battery per discharge and distance travelled (Bütler, 2013). These parameters combine the battery and the charger efficiency in one parameter set.
where:
is the total plug energy demand for one discharge cycle in kWh
is the total battery energy demand for one discharge cycle in kWh
with:
∑
where:
∑ is the sum of all mean energy consumptions between two battery charging procedures in Wh/km
is the distance between two battery charging procedures in km
With the resulting values it is possible to calculate an additional consumption caused by battery charg-ing.
where:
is the additional consumption caused by the battery charging process in Wh/km.
Based on this calculation method for the consumption of the energy storage system, an average peak efficiency of 81 % is found (combined from approximately 90 % for the battery and approximately 92 % for the charger). If the efficiency values of the vehicle or charger, which is examined in the LCA, differ from these values (e.g. when using fast charging), they can be used to calculate a variation factor for the drivetrain.
where:
is the variation factor for the consumption of the energy storage system
31.01.2013
90
is the average peak efficiency of the energy storage system defined in the guidelines (81 %)
is the efficiency of the battery of the examined vehicle
is the efficiency of the charger of the examined vehicle
The calculated variation factors can then be applied to the calculation of consumption attributable to battery charging.
where:
is the additional consumption attributable to the battery charging process in Wh/km with applied variation factor.
7.1.2.1.1.7 Total energy consumption
The total plug-to-wheel energy consumption for the defined driving situation is composed of the basic drivetrain consumption, the consumption for heating and air conditioning, the consumption of auxilia-ries, standstill losses, and the additional consumption of the battery charging process:
where:
is the mean annual consumption in Wh/km for a given driving cycle/trajectory and the specific meteorological conditions, comfort and auxiliaries use pattern, and charging characteristics.
7.1.2.1.1.8 Range estimation
The first four terms of the formula described above can also be used to estimate the mean driving range of the vehicle, because this represents the energy consumed from the battery.
where:
is the estimated range, in km, according to the annual consumption
is the usable battery capacity in Wh
Provisions 7.1.2.1.1: Consumption calculation methods
I. SHALL: The various consumption contributions shall be detailed in the calculation: -Basic consumption (motion) -Heating and air conditioning systems -Auxiliaries

Guidelines for the LCA of electric vehicles92
7.1.2.1.1.7 Total energy consumption
The total plug-to-wheel energy consumption for the defined driving situation is composed of the basic drivetrain consumption, the consumption for heating and air conditioning, the consumption of auxiliaries, standstill losses, and the additional consumption of the battery charging process:
where:
7.1.2.1.1.8 Range estimation
The first four terms of the formula described above can also be used to estimate the mean driving range of the vehicle, because this represents the energy consumed from the battery.
where:
is the estimated range, in km, according to the annual consumption
is the usable battery capacity in Wh
Provisions 7.1.2.1.1: Consumption calculation methods
I. SHALL: The various consumption contributions shall be detailed in the calcula-tion:�� Basic consumption (motion)�� Heating and air conditioning systems�� Auxiliaries�� Standstill losses�� Charging device
II. SHALL: The driving cycle/ trajectory used for the consumption calculation shall be documented. Particularly, it shall be detailed whether the aim was to identify an average real-world consumption or the consumption of specific driving situ-ations, in accordance with the goal and scope of the study.
III. SHALL: It shall be clearly stated how the electricity consumption from the bat-tery is derived from the mechanical energy demanded by propulsion of the ve-hicle.
IV. SHALL: It shall be clearly stated how the electricity consumption from the bat-tery is derived from the energy demand for heating and air conditioning, includ-ing information on the power requirements of the various devices.
is the mean annual consumption in Wh/km for a given driving cycle/trajectory and the specific meteorological conditions, comfort and auxiliaries use pattern, and charging characteristics.
31.01.2013
90
is the average peak efficiency of the energy storage system defined in the guidelines (81 %)
is the efficiency of the battery of the examined vehicle
is the efficiency of the charger of the examined vehicle
The calculated variation factors can then be applied to the calculation of consumption attributable to battery charging.
where:
is the additional consumption attributable to the battery charging process in Wh/km with applied variation factor.
7.1.2.1.1.7 Total energy consumption
The total plug-to-wheel energy consumption for the defined driving situation is composed of the basic drivetrain consumption, the consumption for heating and air conditioning, the consumption of auxilia-ries, standstill losses, and the additional consumption of the battery charging process:
where:
is the mean annual consumption in Wh/km for a given driving cycle/trajectory and the specific meteorological conditions, comfort and auxiliaries use pattern, and charging characteristics.
7.1.2.1.1.8 Range estimation
The first four terms of the formula described above can also be used to estimate the mean driving range of the vehicle, because this represents the energy consumed from the battery.
where:
is the estimated range, in km, according to the annual consumption
is the usable battery capacity in Wh
Provisions 7.1.2.1.1: Consumption calculation methods
I. SHALL: The various consumption contributions shall be detailed in the calculation: -Basic consumption (motion) -Heating and air conditioning systems -Auxiliaries
Guidelines for the LCA of electric vehicles 93
V. SHALL: It shall be clearly stated how the electricity consumption from the bat-tery is derived from the energy demand for the auxiliaries, including the power requirements of the various devices.
VI. It shall be clearly stated how battery losses occurring when the vehicle is parked, but not plugged in, are derived.
VII. SHALL: It shall be clearly stated how charging losses are derived.
VIII. MAY: The methodological steps given in paragraph 7.1.2.1.1.2 and 7.1.2.1.1.6 for numerical estimation may be used, if this is compatible with the goal and scope of the study. Studies whose foreground system involves the optimization of the vehicle's energy consumption (e.g. high efficiency electric drivetrains) should use tailored models in which the specific contributions from the key devices can be detailed (e.g. as in 7.1.2.1.1.2.2).
7.1.2.1.1.9 Example for energy consumption calculation
The following points show the values of an example calculation for the LCA of a vehicle driven in Switzerland. With a focus on estimating the impacts of typical use, the driving profile for a real-world energy consumption is chosen and the temperature profile is generated according to the annual minimum and maximum temperatures of the area. For the calculation, the procedures described in the previous points are used. To keep this overview simple, not all calculation steps are shown. 3.1 Input parameterVehicle: City car, 1 300 kgAnnual Mileage: 10 000 kmBattery capacity: 20 kWhMean discharge distance: 50 km Driving Pattern: 40 % urban WLTC sub cycle 30 % rural WLTC sub cycle 10 % motorway - slow WLTC sub cycle 20 % motorway - fast WLTC sub cycleAmbient temperatures: 0 °C, min. monthly average, lowest day temperature (Zürich 2011) 25 °C, max. monthly average, highest day temperature (Zürich 2011)Auxiliary use: Radio/Navigation, 100 % Lighting, 80 %Standstill hours, unplugged 3 144 h/yrState of charge loss per hour 0.014 %

Guidelines for the LCA of electric vehicles94
3.2 Basic consumption
3.2.1 Electrical consumption (EC) in the different sub cycles�� Mean EC urban = 106.6 Wh/km�� Mean EC rural = 115.2 Wh/km�� Mean EC motorway - slow = 120.8 Wh/km�� Mean EC motorway - fast = 177.0 Wh/km
3.2.2 Weighted electrical drive train consumption�� Mean EC basic = 0.4 x 106.6 + 0.3 x 115.2 + 0.1 x 120.8 + 0.2 x 177.0�� Mean EC basic = 124.7 Wh/km
3.3 Heating and air conditioning
3.3.1 Activation days according to the sample temperature profile. The used temperature profile is shown in the diagram below.�� Heating - maximum = 155 days�� Heating - medium = 79 days�� Air conditioning - medium = 94 days�� Air conditioning - maximum = 0 days
3.3.2 Mean annual energy consumption�� Heating - maximum = 49.4 Wh/km�� Heating - medium = 12.6 Wh/km�� Air conditioning - medium = 3.0 Wh/km�� Air conditioning - maximum = 0.0 Wh/km�� Mean EC for heating and air conditioning = 65.0 Wh/km
3.4 Auxiliaries3.4.1 Mean power demand of auxiliaries
�� Radio/Navigation: 50 W�� Lighting: 130 W
3.4.2 Mean annual energy consumption�� Mean EC due to auxiliaries = 3.5 Wh/km
3.5 Battery losses�� Standstill losses per year: 20 000 Wh*0.014%*3 144 h = 8 733 Wh/yr�� Standstill losses per km: 8 733 Wh/yr / 10 000 km/yr = 0.873 Wh/km
Jan
Feb
Mar
ch
Apr
il
May
June July
Aug
Sep
Oct
Nov Dec
30
25
20
15
10
5
0
ambi
ent t
empe
ratu
re [°
C]
Mean Temperature
MinimumTemperature
MaximumTemperature
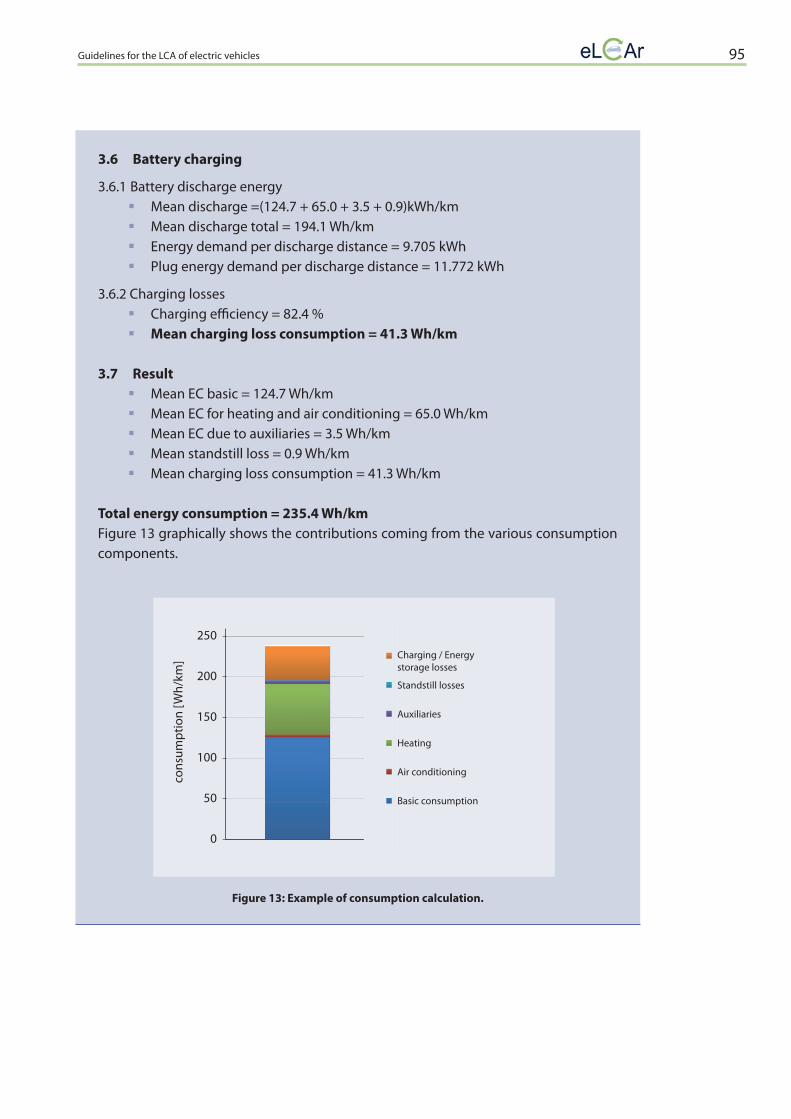
Guidelines for the LCA of electric vehicles 95
3.6 Battery charging
3.6.1 Battery discharge energy�� Mean discharge =(124.7 + 65.0 + 3.5 + 0.9)kWh/km�� Mean discharge total = 194.1 Wh/km�� Energy demand per discharge distance = 9.705 kWh�� Plug energy demand per discharge distance = 11.772 kWh
3.6.2 Charging losses�� Charging effi ciency = 82.4 %�� Mean charging loss consumption = 41.3 Wh/km
3.7 Result�� Mean EC basic = 124.7 Wh/km�� Mean EC for heating and air conditioning = 65.0 Wh/km�� Mean EC due to auxiliaries = 3.5 Wh/km�� Mean standstill loss = 0.9 Wh/km�� Mean charging loss consumption = 41.3 Wh/km
Total energy consumption = 235.4 Wh/kmFigure 13 graphically shows the contributions coming from the various consumption components.
Figure 13: Example of consumption calculation.
Charging / Energystorage losses
Standstill losses
Auxiliaries
Heating
Air conditioning
Basic consumption
cons
umpt
ion
[Wh/
km]
250
200
150
100
50
0

Guidelines for the LCA of electric vehicles96
7.1.2.1.2 Recommendations on electricity sources
A number of studies (see, for example, (Hawkins, 2012)) confirm that the overall results in the LCA of an electric vehicle strongly depend on the specific electricity source or mix, i.e. the types and shares of technologies used for the production of the electricity with which the battery of the vehicle is charged. Depending on the impact indicator and on the electricity mix, the contribution coming from the electricity used for charging can be anything from negligible to dominant in the entire life cycle. For example, a mix largely based on coal power plants will typi-cally lead to very different impacts when compared to one based on photovoltaic electricity.
Finally, various changes in how electricity is produced can be expected for the future. Firs, due to the current efforts to fight climate change through the reduction of CO2 emissions and to move to more sustainable production systems, a substantial increase in the share of renew-able energy sources (RES) is likely to occur. Further, if electric vehicles reach mass penetration, it needs to be understood whether the current electricity capacity is sufficient to guarantee supply despite the added demand. All these variables show how correct modelling of the elec-tricity used for charging the battery, and one consistent with the goal and scope of the study, is of key importance for obtaining meaningful results.
Overall, in defining the electricity source or mix of sources for the study, the guidelines given in relation to ”Technological, geographical and time-related representativeness” and “Planning data collection” also hold. Generally speaking, the most appropriate electricity generation is therefore the one that best describes the electricity production technologies used for charg-ing the battery in the geographical area and time frame defined by the goal and scope of the study. When identifying these electricity sources, the practitioner is required to take into account a number of factors. First, geographical dependence is very strong; just as an exam-ple, the average electricity used today in Germany is produced through a larger share of coal power plants as opposed to the average electricity used in Europe (Figure 14). 17
17 Detailed data set for electricity mix in Europe: http://lca.jrc.ec.europa.eu/lcainfohub/datasetList.vm?top Category=Energy+carriers+and+technologies&subCategory=Electricity
28,8%
26,4%23,4%
1,2%
9,5%0,8%0,1%
0,6% 4,9%2,8%1,6%
31,7%
0,2%1,1%11,1%
0,3%0,7%
0,8%6%
17%
0,3%1%
18,3%
11,3%
NuclearBrown coalHard coalBlast furnace gasPeatNatural gasHeavy fuel oilSolid biomassGaseous biomassWasteHydroWindGeothermalOthers
Figure 14: Comparison of the EU-27 electricity mix with Germany’s specific electricity mix (Source: ELCD database15, data set from 2002)

Guidelines for the LCA of electric vehicles 97
Moreover, even within a country, local communities may decide to rely on particular technol-ogies for their electricity supply. A study analysing the use of electric vehicles in such a com-munity should identify and use the specific mix in that area and consider regional differences in technologies. For example, a coal power plant in one country may lead to different impacts compared to one in another country due to regional differences in the heating values and levels of sulphur for the coal. Hence, in modelling the electricity mix, one should use data as far as possible consistent with the local reality one is analysing.
Another factor which can play an important role is time since the composition of the mix may change during the day or through the seasons. If a study focuses on the average impacts in a specific country, without any constraints on where and when the vehicle is charged, then the country’s average mix could suffice. However, new supply schemes are being proposed by electricity providers. In the context of electric vehicles, an important idea is the concept of smart charging, which aims to reduce the problems that may be caused to the electricity grid by the simultaneous connection of a large number of electric vehicles. The idea is to let the BEVs communicate with the local utilities so batteries are recharged only (or preferably) when electricity is abundant (and cheapest) and the impact on the grid is smallest. Often this would correspond to charging during the night, a time when the electricity mix can be different com-pared to the one available during daytime periods of very high demand. Here, again, if the aim of the study is to investigate the impacts of electric vehicles in the context of a smart charging strategy, meaning ultimately that the vehicle would mainly be charged at specific times, the corresponding electricity mix should be identified.
Within the ILCD framework, the choice of electricity mix will also depend on the decision con-text and, specifically, on whether within situation B, a mass penetration of electric vehicles is contemplated that might require new electricity production capacity to be installed.
For situation A, assuming that penetration of electric vehicles is such that the electricity demand can be satisfied by the available production facilities, the choice should fall on the electricity mix best describing the actual charging situation of the analysed system. This may mean using, for example, an average national consumption mix of electricity18 if the goal and scope are focused on a national average assessment; or a time-specific, local mix involving only selected technologies if it is known that in the specific analysis the batteries are charged only at a specific time and with a particular technology due to special constraints or the use of smart charging strategies. Further, to enhance comparability among studies within the EU, the electricity mix found in the EU-27 electricity mix data (see, for example, Figure 14)19 should be included in the analysis.
In situation B studies involving a mass penetration of electric vehicles that causes large chang-es in the electricity production infrastructure, the same recommendations on goal and scope related technological, geographical and time representativeness hold with the addition of long-
18 In chapter 7.7 of the ILCD, the relationship of the production mix, the consumption mix, and the supply mix is explained.
19 A possible resource is the ELCD database: http://lca.jrc.ec.europa.eu/lcainfohub/datasetList.vm?topCategory =Energy+carriers+and+technologies&subCategory=Electricity

Guidelines for the LCA of electric vehicles98
term marginal electricity use. This corresponds to understanding which new production plants will be installed (and old plants decommissioned) to satisfy long-term changes in demand. Identifying the long-term mix is not straightforward since choices on such key infrastructure components are governed by technological, economic and political factors. As an example, hy-dropower in Germany is not scalable anymore due to technological and economic restrictions20 so increased demand for electricity there cannot be covered by using this technology.
A five-step procedure to assist in the identification of the marginal technology is present-ed in Weidema (1999) and Ekvall (2004) and an example of a European Electricity Scenario is given. A short extract from this procedure is presented below to answer two main questions (Weidema, 1999):
1. ‘What is the situation in which the studied change in demand occurs?’ (Step a-c)2. ‘Given this situation, what specific technology is affected by the change?’ (Step d-e)
Step a: Time horizon: First a distinction between the short-term and long-term effects of the change has to be made. Short-term effects influence the intensity of utilization of existing pro-duction capacities, whereas long-term effects influence the development of installed capacity while intensity of utilization remains constant. Most changes in the demand will have effects on both aspects (Mattsson, 2001) and, for usability, some simplification could be made such as ignoring dynamic effects. In the example from Weidema (1999), only long-term marginal technologies are considered.
Step b: Specific processes or market: This step answers whether specific processes or overall markets are affected. In the example, electricity in Europe is delivered through markets, lead-ing to steps c and d.
Step c: Trend in market volume: If markets are affected, the trend within the market has to be identified. The trend in the EU shows that the electricity market is increasing. Therefore, marginal technology is the preferred technology that is unconstrained and has the lowest, long-term production costs.
Step d: Constraints on capacity increase for the involved technologies: If production capacity is restricted, a higher demand will not lead to production capacities above this limit. Constrain-ing factors could be: natural constraints such as available amount of water in a specific region; political constraints such as ban of specific technologies, e.g. nuclear power in Germany; and market constraints for co-products, e.g. co-generated heat.
Step e: Preferences based on potential production costs: Marginal technology is the technology in which production capacity can be adjusted along with the production costs for the technol-ogy. In decreasing markets, long-term technology is the one that is phased out, having the high-est short-term cost. In increasing markets, long-term technology is the one that will be most likely installed, having the lowest long-term costs. The resulting marginal technology can be a
20 The future development of power plant expansion regarding each technology in each country depends on a number of different criteria such as technical feasibility, availability of resources, acceptance of the technology, and costs that are highly country specific.

Guidelines for the LCA of electric vehicles 99
mix of different technologies. In the example, the marginal technology in Europe is a composite of fossil and wind power, until the expansion limit of wind energy is reached (Weidema, 1999)).
Another, more complex approach for the identification of the environmental consequences of marginal electricity supply is given in Lund (2010).
In using the methodologies mentioned above, it is important to remember that, within situa-tion B studies, the focus is set on the long-term technology mix. The reported methods can be also used for the identification of other marginal technologies.
Once the appropriate electricity mix has been identified, the selection of data sets describing the various technologies involved can be made. These data sets can be obtained from LCI data providers and should include all the infrastructure required for the specific electricity produc-tion technologies.
7.1.2.1.3 Distribution Networks and other charging infrastructure
The chapters 7.1.2.1.2 to 7.1.2.1.4 provide guidance on how high the energy demand from the electricity network is and on how the generation technology of the electricity can be assessed. But between the power plant and the plug of the vehicle there is an electricity network that demands infrastructure and causes energy losses that need to be accounted for in LCA studies.
A transmission network is used to transport the electricity over longer distances from the pro-duction sites to the area where it will be distributed to the consumers. Typically, transmission occurs at very high voltage levels over long distances, while subsequently lower voltage levels are used the more the electricity advances down the distribution part of the network. Overall, all the components used to realize the transmission and distribution network (electricity lines, transformers, switches, etc., differentiating between the specific voltage level in the network where these are used) should be part of the inventory. Data on electricity transmission and distribution infrastructure is typically also available from LCI data providers. It should further be considered that all these components have losses which accumulate along the line. Hence, losses from production site to plug have to be accounted for when quantifying how much electricity is ultimately taken from the plants.
The vehicle is charged through an on-board charging device or through an external charging station. The various solutions differ with respect to the energy they can transfer to the battery in a certain amount of time, i.e. they are characterized by different power levels. Also, some charging devices are bidirectional, meaning that energy can be loaded into the battery or that energy can be taken from the battery and be fed back to the grid. Generally speaking, the higher the power, the higher the technical complexity of the charging station. Hence, in addition to the on-board charger, which is often taken into account in the inventory during the production phase of the vehicle, it is also necessary to include other charging stations that may be used by the vehicle. These could be, for example, a particular external charging device used in the garage at home or dedicated, high-speed charging stations in structures similar to the petrol stations used by ICE vehicles. Since, as mentioned above, these solutions are char-acterized by a different infrastructure and technological complexity, these differences should
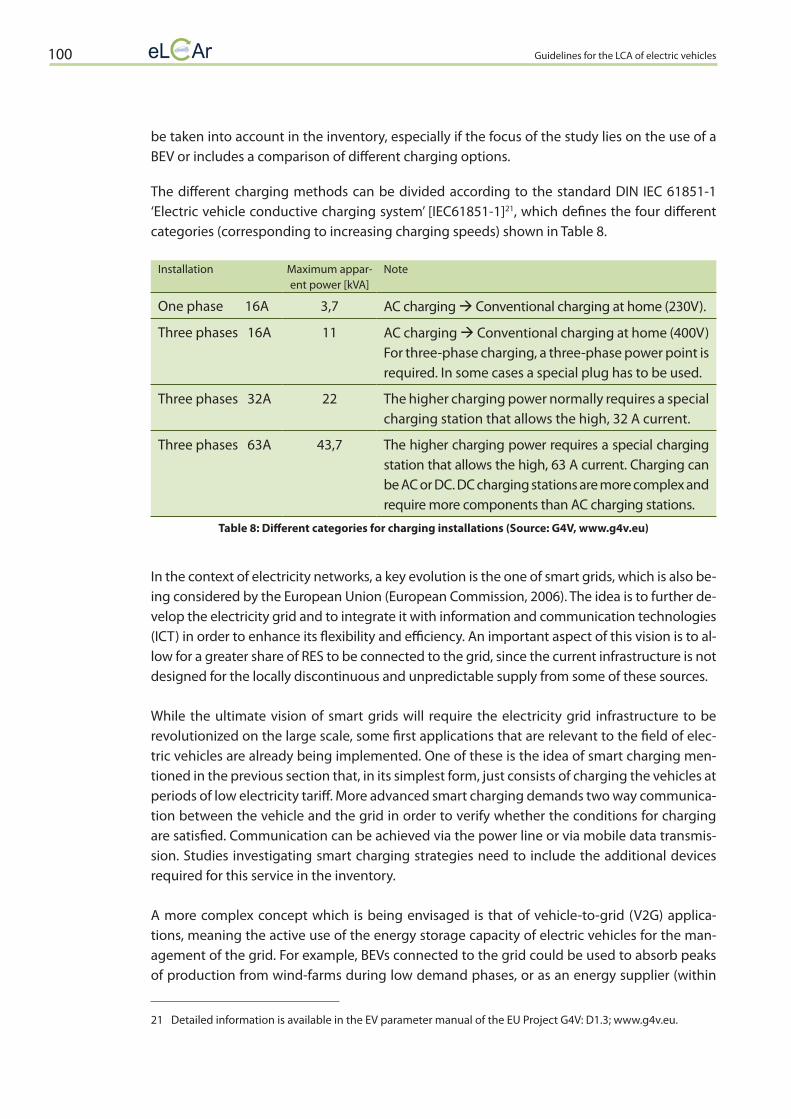
Guidelines for the LCA of electric vehicles100
be taken into account in the inventory, especially if the focus of the study lies on the use of a BEV or includes a comparison of different charging options.
The different charging methods can be divided according to the standard DIN IEC 61851-1 ‘Electric vehicle conductive charging system’ [IEC61851-1]21, which defines the four different categories (corresponding to increasing charging speeds) shown in Table 8.
Installation Maximum appar-ent power [kVA]
Note
One phase 16A 3,7 AC charging Conventional charging at home (230V).
Three phases 16A 11 AC charging Conventional charging at home (400V) For three-phase charging, a three-phase power point is required. In some cases a special plug has to be used.
Three phases 32A 22 The higher charging power normally requires a special charging station that allows the high, 32 A current.
Three phases 63A 43,7 The higher charging power requires a special charging station that allows the high, 63 A current. Charging can be AC or DC. DC charging stations are more complex and require more components than AC charging stations.
Table 8: Different categories for charging installations (Source: G4V, www.g4v.eu)
In the context of electricity networks, a key evolution is the one of smart grids, which is also be-ing considered by the European Union (European Commission, 2006). The idea is to further de-velop the electricity grid and to integrate it with information and communication technologies (ICT) in order to enhance its flexibility and efficiency. An important aspect of this vision is to al-low for a greater share of RES to be connected to the grid, since the current infrastructure is not designed for the locally discontinuous and unpredictable supply from some of these sources.
While the ultimate vision of smart grids will require the electricity grid infrastructure to be revolutionized on the large scale, some first applications that are relevant to the field of elec-tric vehicles are already being implemented. One of these is the idea of smart charging men-tioned in the previous section that, in its simplest form, just consists of charging the vehicles at periods of low electricity tariff. More advanced smart charging demands two way communica-tion between the vehicle and the grid in order to verify whether the conditions for charging are satisfied. Communication can be achieved via the power line or via mobile data transmis-sion. Studies investigating smart charging strategies need to include the additional devices required for this service in the inventory.
A more complex concept which is being envisaged is that of vehicle-to-grid (V2G) applica-tions, meaning the active use of the energy storage capacity of electric vehicles for the man-agement of the grid. For example, BEVs connected to the grid could be used to absorb peaks of production from wind-farms during low demand phases, or as an energy supplier (within
21 Detailed information is available in the EV parameter manual of the EU Project G4V: D1.3; www.g4v.eu.
Guidelines for the LCA of electric vehicles 101
certain defined conditions) during moments of peak demand from the grid. Here, too, LCAs addressing V2G or other smart grid applications need to include in the inventory the addition-al devices required for implementing these schemes, such as bidirectional charging points, ICT channels, and metering systems on the vehicle that quantify the exchanged energy, as well as other hardware that might be required in the network. In this context, it is obviously also important to consider the effect of V2G on the battery lifetime.
As with electricity mixes, the inventory of the network infrastructure can strongly depend on the decision context of the study and particularly on whether a mass penetration of electric vehicles is considered within situation B.
In situation A, and assuming the penetration of vehicles is such that no big changes in the network are required for their management, the inventory should include the infrastructure that is typically required for operation of the network (e.g. transmission lines, transformers, etc.). All the charging devices used by the vehicle should be part of the inventory, differentiat-ing between the different types. If the study addresses particular services like smart charging or V2G within a smart grid concept, then all the devices required for implementing those ser-vices should be taken into account.
Conceptually, exactly the same recommendations hold also for situation B and the perspec-tive of a mass distribution of electric vehicles, except, of course, for the scale on which these apply. In addition to the points listed for situation A, one needs also to include the changes in the network that might derive from its interaction with a large number of electric vehicles. In this case, additional hardware may be required for the network to cope on a large scale with the varying loads brought by the connected vehicles and by the additional demand caused by high power charging stations.
Please take note, that the determination of the electricity source or mix for the use phase has the highest influence on the final LCA result of EV. This is the result of an extensive analysis of the most important LCA influence parameters that has been conducted within the eLCAr project. The extensive results are presented in deliverable D3.2 - Methodological and legal implications of revised guidelines.22 Therefore, the provided eLCAr guidance for the determi-nation of the electricity source or mix should be followed by the practitioners. In special cases, e.g. LCA of EV in combination with smart grid applications providing V2G services having also a high impact on the used electricity source or mix and therefore on the final LCA results, more complex approaches such as Lund (2010) or appropriate electricity generation models have to be used to factor the variation of the EV load curve in. However, a detailed guidance for the modeling of the electricity generation requires a detailed knowledge within the field of elec-trical power engineering that is not the scope of the eLCAr guidelines and cannot be provided briefly. For further information, please use the references given and respective literature.
22 The deliverable is available on the eLCAr-website: http://www.elcar-project.eu/uploads/media/D3.2_Guideline_Implications.pdf

Guidelines for the LCA of electric vehicles102
Provisions 7.1.2.1.2 and 7.1.3.1.3: Recommendations on electricity mixes and dis-tribution networks
For situation A:I. SHALL: Use an electricity generation technology or consumption mix for as-
sessing battery charging in the use phase which is consistent (geographically, technologically and temporally) with the goal and scope of the study. Examples: when available, use �� The national average consumption mix for a study on the use of an electric
vehicle in a specific country, with no special constraints on charging loca-tion and time.
�� The average consumption mix available at night in city or region X for a study focusing on a vehicle only being charged during night time hours.
�� Electricity produced by a small scale photovoltaic system for a study address-ing the use of an electric vehicle charged by home photovoltaic panels.
If this data is not available, use the most representative alternative available, and document accordingly.
II. SHOULD: For enhancing the comparability of studies within the European Union (and if appropriate within the goal and scope of the study), also include the Euro-pean mix (EU-27) for the battery charging process (consumption mix, < 1kV/230 V).
III. SHALL: Include the infrastructure required to produce the desired electricity mix as well as the transmission and distribution network needed for delivering it to the user or charging stations.
IV. SHALL: Quantify and take into account the electricity losses occurring between the production sites and the plug of the charging system.
V. SHALL: Include, next to the typically available on-board charger, additional charging infrastructure (e.g. high power charging stations) if this is used within the analysed scenario.
VI. SHALL: When considering particular services or schemes, like smart charging, ve-hicle-to-grid, or smart grid applications, all additional devices required for their implementation shall be inventoried.
For situation BVII. SHALL: Use the same provisions given for situation A with the following excep-
tions for when a mass penetration of electric vehicles may cause large changes in the electricity production infrastructure and in the transmission and distribu-tion network: �� Use the specific long-term marginal electricity generation technology or
mix (country, technology and time specific) for the charging process (see five-step procedure described in 7.1.2.1.2 for how to find this technology or mix).
�� Include in the inventory the changes that may occur in the network due to the high penetration of electric vehicles.
XVII. SHOULD: If it is different (and if appropriate within the goal and scope of the study), the long-term marginal technology electricity mix from EU-27 should also be included for the vehicle charging process.
Guidelines for the LCA of electric vehicles 103
The following examples support the decision finding process for the electricity mix.
Situation A: Case A1)
Scope of the study: A small number of EVs are to be produced and integrated into the German market (< 10 000 vehicles within the next 2 years). The charging process will not be coordinated. The vehicles will be charging at home, at 240 V.
Determination of the electricity mix: The average German consumer electricity mix for 2012-2022 (or similar) at the low voltage level (<1kV), including the necessary grid infrastructure, should be chosen because the impact on the system is negligible For comparison, the average UCTE consumer electricity mix is also considered within a scenario.
Case A2)
Scope of the study: A small number of EVs are to be produced and integrated into the German market (< 10 000 vehicles within the next 2 years). The concept for the EV integration is to combine the purchase of the EV with the purchase of a photovoltaic installation for the vehicle owner's home (only applying for homeowners). The vehicles will be charged at home at 240 V. The photovoltaic installations are to provide 80 % of the energy for EV charging; 20 % of the energy will be provided by the electricity grid.
Determination of the electricity mix: For 20 % of the energy, the average German consumer electricity mix at the low voltage level (<1kV) for 2012-2020, including the necessary grid infrastructure, should be chosen. For comparison, the average UCTE consumer electricity mix is also considered within a scenario. The photovoltaic system will directly provide 80 % of the charging energy. As for other electricity sources, the photovoltaic systems need to be inventoried accordingly.
Situation B: Case B) (based on Weidema, 1999)
Scope of the study: A considerable number of EVs are to be produced and integrated into the German market by 2030 (20 % of the vehicle population). The charging proc-ess is not coordinated. The vehicles are mainly charging at 240 V.
Determination of the electricity mix: The marginal German consumer electricity mix in 2030 at the low voltage level (<1kV), including the necessary grid infrastructure, should be chosen because, being a situation B study with mass penetration of electric vehicles, large changes to the electricity mix can be expected. For comparison, the marginal UCTE consumer electricity mix is also considered within a scenario. For the determination of the marginal technology, the 5-step procedure could be used.
Step a: Time horizon: Due to the large number of vehicles and the uncoordinated charg-ing processes, a considerable increase in the absolute installed electricity generation capacities is expected by 2030. A long-term perspective is chosen.
Guidelines for the LCA of electric vehicles104
Step b: Specific processes or market: The electricity in this scenario is provided by the German electricity market. Step c: Trend in market volume: The electricity market is increasing in national markets as well in the EU market; therefore, the marginal technology is the most preferred tech-nology that is unconstrained and has the lowest, long-term production costs. Step d: Constraints on capacity increase for the involved technologies: The involved technologies for large scale electricity production are nuclear, hydro, coal, oil, natural gas, bio mass, waste, photovoltaics, and wind power. In Germany, nuclear power plants will not be built (political constraints) and the capacity for hydro power is limited (natu-ral constraints).Overall, fossil fuels (gas, coal, lignite) are not generally constrained, but the investments are very uncertain for the electricity producers due to the high sub-sidies for renewable energy sources, which lead to reduced electricity prices on the market. Nevertheless, gas power plants are being installed due to their relatively low price. Bio mass and waste as energy sources could expand, but are limited by the avail-ability of land or waste. Wind power is still expanding and new areas (off-shore wind parks) are being explored. Photovoltaic installations are also expanding at a constant rate. However, the potential for photovoltaic installations is restricted due to available installation areas. Thus, the unconstrained marginal technologies in 2030 are probably gas and wind power plants. Photovoltaic installations could also be a marginal tech-nology in 2030, depending on the decline in cost.Step e: Preferences based on potential production costs: To determine the marginal technology, the electricity production costs for possible technologies have to be ana-lysed, e.g. using available data that takes the uncertainties into account. In Weidema (1999) different technology production costs in the EU are presented. Depending on the cost for off-shore wind power plants, the marginal technology would be gas power plants. The determination of this cost is highly speculative and cannot be predicted due to the high impact of political constraints and electricity market trends. (The de-tailed analysis is presented in Weidema (1999).)
Based on this approach, the marginal technology could be assessed with different sce-narios using gas power plants, wind energy, possibly a small share of photovoltaic sys-tems and/or a scenario using a mix of these technologies.
7.1.2.1.4 Maintenance
During the use phase of a vehicle, materials or components might be damaged and require replacement or maintenance. The materials or components exchanged due to maintenance should be part of the LCA and an estimate of materials and components needed for the main-tenance process should be made. Particularly, this shall not be neglected in the context of the battery, which, as a component, can have a substantial influence on the final result of the study. The expected lifetime of the battery (both, in terms of calendar years and km) shall be

Guidelines for the LCA of electric vehicles 105
compared with the one of the vehicle to see whether more than one battery is required over the lifetime of the vehicle.
7.1.2.1.5 Road infrastructure
Road infrastructure requires building, maintenance and disposal, which, in turn, require re-sources like vehicles, machinery, and materials like gravel and minerals. These resources should be estimated and included in the analysis.
7.1.2.1.6 Non-exhaust emissions
During the use of a vehicle, various forms of non-exhaust emissions typically occur that can have impacts on human health and the ecosystem. These are related to particles released from the brake system (due to friction between the brake shoes, discs and discs pads), and the tyres and asphalt (due to friction between the tyres and the road). Emissions typically contain vari-ous heavy metals and the impacts depend on the specific materials used; this, too, should be included in the LCA.
Below, the provisions summarizing the overall aspects of the use phase are given.
Provisions 7.1.2.1: Processes within the system boundary and data collection: the use phase
I. SHALL: Identify all the main processes involved in the use phase of a vehicle. These include, among other things:�� The energy consumption due to vehicle use�� The electricity network for delivering the electricity with which the battery
is charged�� The specific electricity mix (and the corresponding infrastructure) used for
the charging of the battery�� The road infrastructure�� Non-exhaust emissions�� The maintenance of the vehicle (e.g. substitution of the battery in case its
life expectancy is shorter than the vehicle's).
7.1.2.2 Planning data collection
The same recommendations given in chapter 7.1.1.3. also hold for the use phase.
7.1.2.3 Data collection
The same recommendations given in chapter 7.1.1.4. also hold for the use phase.
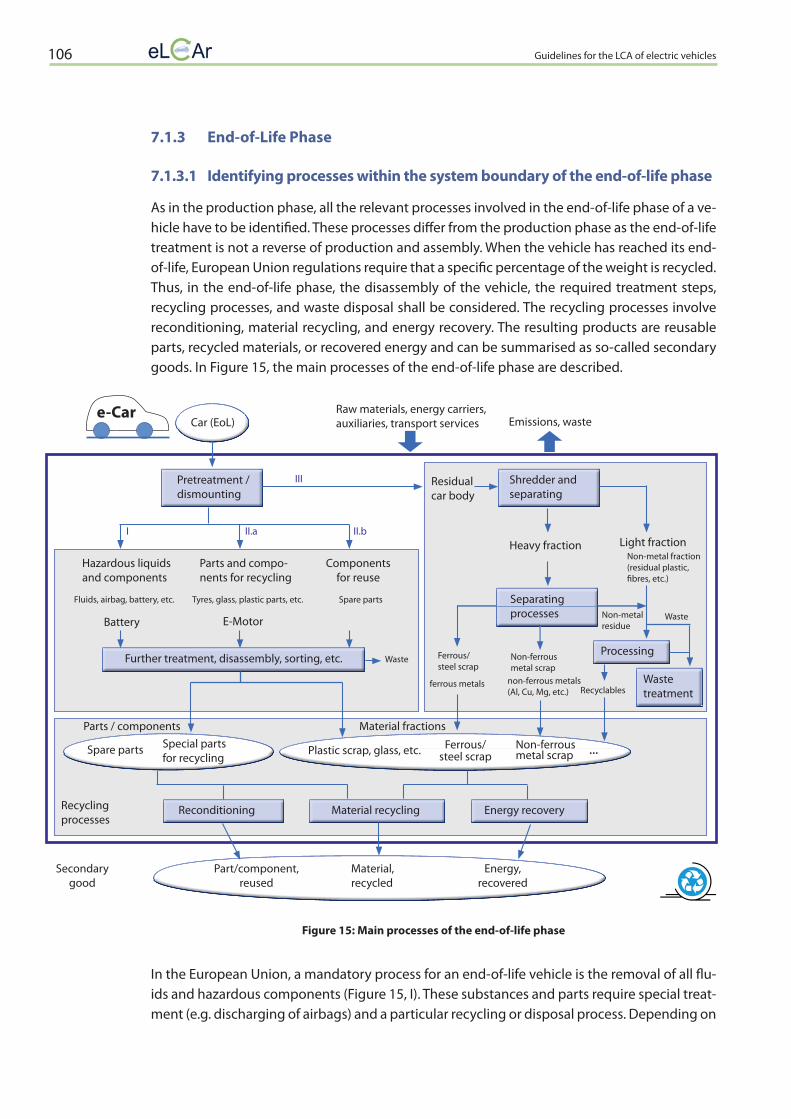
Guidelines for the LCA of electric vehicles106
7.1.3 End-of-Life Phase
7.1.3.1 Identifying processes within the system boundary of the end-of-life phase
As in the production phase, all the relevant processes involved in the end-of-life phase of a ve-hicle have to be identifi ed. These processes diff er from the production phase as the end-of-life treatment is not a reverse of production and assembly. When the vehicle has reached its end-of-life, European Union regulations require that a specifi c percentage of the weight is recycled. Thus, in the end-of-life phase, the disassembly of the vehicle, the required treatment steps, recycling processes, and waste disposal shall be considered. The recycling processes involve reconditioning, material recycling, and energy recovery. The resulting products are reusable parts, recycled materials, or recovered energy and can be summarised as so-called secondary goods. In Figure 15, the main processes of the end-of-life phase are described.
Figure 15: Main processes of the end-of-life phase
In the European Union, a mandatory process for an end-of-life vehicle is the removal of all fl u-ids and hazardous components (Figure 15, I). These substances and parts require special treat-ment (e.g. discharging of airbags) and a particular recycling or disposal process. Depending on
Fluids, airbag, battery, etc.
Battery
Hazardous liquids and components
Tyres, glass, plastic parts, etc.
E-Motor
Parts / components
Secondary good
Recycling processes
Material fractions
Parts and compo-nents for recycling
Residual car body
Raw materials, energy carriers, auxiliaries, transport services
Spare parts
Components for reuse
Emissions, waste
Heavy fraction
Non-ferrous metal scrap
Ferrous/steel scrap
non-ferrous metals(Al, Cu, Mg, etc.)
ferrous metals
Light fractionNon-metal fraction(residual plastic, fi bres, etc.)
Waste
Recyclables
Waste
Non-metalresidue
e-CarCar (EoL)
Pretreatment / dismounting
Shredder and separating
Processing
Waste treatment
Energy recoveryMaterial recyclingReconditioning
Further treatment, disassembly, sorting, etc.
Spare parts Special parts for recycling
Plastic scrap, glass, etc. Ferrous/steel scrap
Non-ferrous metal scrap
Part/component, reused
Material,recycled
Energy,recovered
III
II.bII.aI
Separatingprocesses
...

Guidelines for the LCA of electric vehicles 107
further regional requirements and demands, additional parts or components for reuse or re-cycling are dismounted (Figure 15, II.a and II.b). Some components could serve as spare parts, others need selective collection for easier recycling (e.g. tyres, plastic parts). Product specific recycling processes exist or are in development for some components or parts (e.g. batteries, electric motors) in order to recapture scarce or valuable materials. The residual car body (Fig-ure 15, III), which includes all components that do not require special treatment (e.g. wheels, SBSS), is shredded. The shredded material is separated using additional sorting processes in order to extract different material fractions, particularly the ferrous and non-ferrous metal frac-tions. Only non-recyclable remains are treated as waste. Subsequently, each material fraction, as well as special parts or components, are recycled in order to create secondary goods.
Component specific recycling processes and the shredding process are described further in chapters 7.1.3.4 to 7.1.3.8. In case the recycling processes are not all completed at the same facility, transportation has to be included as well. On-site transport must always be included.
The provisions for solving multifunctionality are presented in chapters 6.3.2 and 7.3.
Provisions 7.1.3.1: Identifying processes within the system boundary of the end-of-life phase
I. SHALL: Identify all the main processes involved in the end-of-life phase of a vehi-cle. Assign all components to the different treatment and recycling steps. Particu-larly, a first analysis shall verify how the following processes are connected in the end-of-life phase:�� Disassembly of vehicle�� Recycling of battery �� Recycling of electric motor �� Recycling of power electronics�� Recycling of wheels and tyres�� Shredding of residual car body�� Raw material demand�� Energy carrier demand�� Auxiliaries demand�� Use of transport services�� Waste flows�� Emissions
Variations from the above list shall be documented.
II. SHALL: For components belonging to the foreground system, identify all sub-components and sub-processes that require specific recycling.�� Battery: Recycling of the case material, battery management system, bat-
tery cells, critical materials (e.g. lithium).
Guidelines for the LCA of electric vehicles108
�� Electric motor: Depending on type of motor (permanent magnet, induc-tion, etc.), recycling of metals, recycling or reuse of magnets, recycling of scarce materials (e.g. rare earth metals).
�� Electronics: e.g. power electronics, non-propulsion electrical systems: re-cycling of cables, electronics, valuable materials.
�� Wheels and tyres: Recycling of the wheels, recycling of the tyres.�� Shredding of residual car body: Shredding, separation, and treatment of
the heavy and light fractions, respectively recovered material fractions and their intended material recycling processes.
III. SHOULD: Document the analysed system with a schematic diagram of the found processes.
7.1.3.2 Planning data collection
The same recommendations given in chapter 7.1.1.3. also hold for the end-of-life phase.
7.1.3.3 Data collection
The same recommendations given in chapter 7.1.1.4 also hold for the end-of-life phase.
7.1.3.4 Overview: LCI recommendations for EoL of batteries
Traction batteries need special treatment at their end-of-life. They have to be handled with care due to the ease of ignition. Furthermore, they cannot be recycled in one piece efficiently in existing recycling processes appropriate for smaller Li-ion batteries from devices like cell phones or laptops.
Final discharge and disassembly
The first step is the discharge of the dismounted battery. Subsequently, the battery is disassem-bled to its individual components as shown in Figure 16. Generally, cordless electric screwdriv-ers or screwdrivers using compressed air are used for this task. For safety reasons, an air extrac-tion of the disassembly process might be necessary due to possibly broken cells. The resulting components, other than the battery cells, go to established recycling processes. The case, frame and cables of the battery and its modules can go directly to the corresponding material recov-ery processes. The battery management system enters the electronics recycling path.
Cell recycling
For the further treatment of the closed battery cells different recycling paths are possible and can be distinguished as pyrometallurgical and hydrometallurgical processes. They differ in their needs for further disassembly of the cells, for energy and input materials, as well as in their re-covery rates of the diverse materials contained in the anode, the cathode, and the separator. An adaptation of these technologies to the specific needs of battery recycling is currently in a state of development and the first recycling plants are employing them on a small scale. Currently,

Guidelines for the LCA of electric vehicles 109
a fi rst recycling plant is enabling metal recovery (Ni, Co, Cu) from used Li-ion, Li-polymer and NiMH batteries by a pyrometallurgical process. Additionally, a fi rst pilot plant for the recycling of lithium from Li-ion batteries was established in 2011. It uses a hydrometallurgical process to recover Li as well as Ni, Mn, and Co from cathode coatings. Other processes are in development to recover LiMn-oxide, which can be reused in batteries. So far, these processes are lab or pilot scale projects due to the present low availability of EoL car batteries.
Figure 16: Example of options of a traction battery recycling
Provisions 7.1.3.4: Overview: LCI recommendations for EoL of batteries
I. SHALL: If recovery of the discharged energy is included in the LCA, all related as-sumptions should be clearly stated.
II. SHALL: Document assumptions regarding transport distances for the diff erent components. Real distances should be given in case of battery cells since a ubiq-uitous network of recycling facilities is still missing in Europe and only single recycling plants are operating (see above).
Traction battery, dismantled
Final discharge, disassembly, sorting
Case, frame, cables Battery cells Battery Management System (BMS)
Material recyclingPyrometallurgical
processHydrometallurgical
process Electronics recycling
Material, recycled(e.g. steel, plastic, aluminium, etc. )
Material, recycled (e.g. compounds of
Co, Ni and Cu)
Material, recycled (e.g. compounds of
Li, Co, Ni, Mn)
Material, recycled(e.g. copper, nickel,
gold, silver, etc.)

Guidelines for the LCA of electric vehicles110
III. SHALL: Clearly document the chosen recycling process for every single compo-nent and its specific recovery rates for the recovered materials or other second-ary goods. Also specify the achievable quality of the secondary goods.
IV. SHALL: Give a detailed description of further disassembly steps beyond cell level, if applicable, and include the related energy and material flows in the modelling of end-of-life processes.
V. SHALL: Crediting for recovery of valuable materials and other secondary goods has a strong influence on overall results. Therefore, make sure the assumed amounts of materials contained in the single components coincide with the re-lated assumptions for the production phase. This applies notably to case and frame materials (e.g. steel, aluminium) due to the large mass of these compo-nents, and to cell materials (e.g. Cu, Ni, Co) due to the high environmental im-pact of their supply chains.
VI. SHALL When you apply system expansion, make sure you choose an appropriate data set for the substituted primary product, giving special regard to product quality. If the original material quality (of the primary material used during pro-duction phase) is realised through the recycling process, use the same LCI data set as for modelling the production phase.
VII. SHALL: Give special attention to the consistent application of allocation factors in production data sets used for primary production and calculation of credits in the end-of-life phase. This is particularly important in case of a paragenesis of metals (e.g. Co, Ni). Allocation procedures and, consequently, factors may differ extremely among databases.
7.1.3.5 Overview: LCI recommendations for EoL of electric motors
Different types of electric motors can be used in electric vehicles. Electric motors with per-manent magnets are of particular interest because they achieve higher power density than non-permanent motors. However, they contain rare earth metals (dysprosium, neodymium, etc.) that have special recycling needs. Therefore, they play an important role in the LCI. As an example, the different recycling options (reuse, material recycling) for an electric motor with permanent magnets are described in Figure 17. Typically the decisions depend on the condi-tion of the magnet.
As mentioned in chapters 6.3.2 and 7.3, when using system expansion and substitution differ-ent aspects have to be considered when defining the amount and type of market mix that can be substituted. E.g. in case of reuse (Figure 17, Case 1) the expected lifetime and quality of the remanufactured electric motor has to be considered as it can be shorter than the first life cycle. Another case is the recycling of the magnetic material (Figure 17, Case 2a) in order to be used in a new magnet. In this case the magnet is removed from the engine, pulverized and can be mixed and/or reformed into a new magnet. Depending on the quality of the new magnet, a

Guidelines for the LCA of electric vehicles 111
value correction might be necessary. The diff erent elements in permanent magnets (Figure 17, Case 2b) can also be separated and used in new applications.
The same can also be applied to the other components.
Figure 17: Example of a decision tree for EoL options of an electric motor with a permanent magnet
Provisions 7.1.3.5: Overview: LCI recommendations for EoL of electric motors
I. SHALL: If the electric motor is not shredded along with the residual car body, the remanufacturing or recycling processes of the electric motor must be included.
II. SHALL: Make sure the assumed amounts of materials contained in the single components coincide with the related assumptions for the production phase. This applies notably to case and frame materials (e.g. steel, aluminium) due to the large mass of these components and to some magnetic materials (e.g. Dy, Nd) due to the high environmental impact of their supply chains.
7.1.3.6 Overview: LCI recommendations for EoL of electronics
Electronics like circuit boards are used, e.g. in the battery management system, the non-propulsion electrical system, and in the power electronics. These components can contain valuable materials with high environmental impacts from their primary production like gold,
E-Motor, dismantled
Case 1 Case 2
Disassembly, sorting, etc.Case 2
Other partsMagnetE-Motor
Case 2a Case 2b
Reconditioning Pre-treatment, powdering,
post-treatment
Special treatment and special
material recycling
Material recycling
E-Motor, reused
Rare earth metals,
recycled
Other metals,
recycled
Other secondary
goods
Magnet material, recycled

Guidelines for the LCA of electric vehicles112
copper, and silver. Whether some of these components are removed and shredded in a spe-cial shredder or treated entirely differently should be checked. If this is the case, the recycling should be modelled separately.
Provisions 7.1.3.6: Overview: LCI recommendations for EoL of electronics
I. SHALL: If electronic components are removed from the vehicle before the re-sidual car body is shredded, their recycling must be modelled separately.
II. SHALL: Make sure the assumed amounts of materials contained in the single components coincide with the related assumptions for the production phase. This applies notably to the metals (e.g. gold, copper, silver).
7.1.3.7 Overview: LCI recommendations for EoL of tyres and wheels
The tyres are easy to remove and consist of one large piece of rubber. Therefore, it must be ver-ified if the tyres are removed before the residual car body is shredded. In general the wheels are shredded along with the car body.
Provision 7.1.3.7: Overview: LCI recommendations for EoL of tyres and wheels
I. SHALL: If the tyres are removed from the vehicle before the residual car body is shredded, their recycling must be modelled separately.
7.1.3.8 Overview: LCI recommendations for EoL of residual car body
After removing hazardous substances as well as valuable or single-material components, the remaining residual car body is shredded. The shredder basically mills the objects with ham-mers until they have a defined size. Then, a separation process divides the crushed material into the light fraction and the heavy fraction. The heavy fraction consists of ferrous and non-ferrous metals as well as other heavy materials. Due to the ferromagnetic properties of iron and steel, the ferrous metals can be separated from the non-ferrous metals and other materi-als with a magnetic separator. In further processes the non-ferrous metals (e.g. aluminium, magnesium, copper) can be divided into the respective material fractions. Subsequently, the material fractions are then recycled according to their particular recycling needs. The light fraction mainly consists of plastics and fibres of small size as well as dust particles of different materials. In order to increase the recycling rate from used vehicles, the existing processes are being improved or new processes are in development to enable the recycling of the materials in the light fraction. The remaining part of the fraction is discarded. ICEs from serial PHEVs can be dismounted from the body and sent to a recycling facility to recover the materials.

Guidelines for the LCA of electric vehicles 113
Provisions 7.1.3.8: Overview: LCI recommendations for EoL of residual car body
I. SHALL: All processes of the shredding and separation steps necessary to obtain the secondary goods must be considered and included in the modelling.
II. SHOULD: Particularly for lightweight materials, e.g. carbon-fibre reinforced polymers, special attention must be paid to the recycling process and the cor-responding recycling rates. Lightweight materials can often not be recovered efficiently using a conventional shredding process.
7.2 Filling data gaps and future technologies
As mentioned above, it can happen that some data is not available. In the following, two main situations are differentiated: data gaps concerning established production processes and data gaps concerning future technologies or technologies in development.
7.2.1 Filling data gaps of established technologies
In an established production process, for example the production of a lithium-ion battery of current technology, it may not be possible to obtain primary data from the producer for a spe-cific sub-process, e.g. the fabrication of one of the electrodes. Below, various options that can be pursued are presented.
7.2.1.1 Deriving the data through theoretical modelling
One option is to derive the missing data through theoretical modelling based on information taken from producers, the literature, and experts. Overall, the idea is to get sufficient techni-cal insight to be able to make assumptions about the missing sub-process, which then allows developing a technological model describing it. Using this technological model, an inventory of the required inputs and outputs can be computed. If sufficient information is found through the literature or experts’ advice, the data derived through such models can achieve a high level of quality. Here, two approaches can be helpful:
7.2.1.1.1 Bottom-up modelling
In bottom-up modelling, the starting point is technological knowledge about the production steps at the heart of the process under analysis: the material input flows, the types of ma-chines that can be used to process the specific materials into the wanted forms or more com-plex compounds, chemical reactions that may be needed, etc. Using physical and/or chemical knowledge about these processes, estimates can be derived for energy requirements, and for amounts of emissions, wastes, and scrap. The estimates derived for the initial steps in the pro-cess chain are then used as inputs for the later steps. Thus, using theoretical models based on the physical and chemical characteristics of the involved manufacturing stages, integrated with information from the literature and experts, the system can be modelled from the bottom

Guidelines for the LCA of electric vehicles114
(initial steps of the production chain) up to the final completion of the analysed process, deriv-ing the required material and energy resources as well as corresponding outputs.
7.2.1.1.2 Top-down modelling
Top-down modelling takes the opposite approach as the one presented above. Starting from known macro parameters describing the overall system one tries to use this information to-gether with technological knowledge of the system under analysis to gradually unravel the macro information into data describing the sub-processes of the production system.
A common example is the information one can get from the sustainability reports of compa-nies. These reports sometimes give detailed information such as total energy demand (from various sources) of the factories, etc., that can be attributed to the products of the factory or company. This can be relatively straight forward if the company or factory only produces the component one is interested in. If, however, the company produces a wide palette of differ-ent products, allocation has to be done. Allocation in these cases is often based on the retail price of the component of interest and the total output of these companies. Of course, this estimate can be completely wrong since market prices are influenced by many factors other than energy and resource consumption, and, therefore, the cost structure of various products from the same company can strongly differ. Consequently great care has to be taken if such an approach is used to generate LCI data on materials or resources required for a product.
In practice, a combination of bottom-up modelling and top-down approaches can be used, depending on the available information on the process for which the data is required.
7.2.1.2 Using datasets from similar processes
Another option is to identify data sets or parts of data sets coming from similar processes compared to the one for which data is missing and to use this data as a substitution. Typical situations in this context are:
�� The use of a data set derived for another specific product with similar characteristics (e.g. the use of a specific data set of a particular glass type for a windscreen to describe the production of a glass used for another purpose)
�� The use of a data set describing the average production of a type of product (e.g. the use of a data set describing the average production of glass for modelling the production of a specific glass type in a windscreen)
Sources for these data sets typically are LCI databases.
When using this solution, an important issue is to choose the data sets on the basis of conserv-ative or reasonable worst-case assumptions in order to avoid underestimating the relevance of the investigated process. If the subsequent stages of the LCI reveal that the influence of the approximated process under the worst case assumption is minor, then the approximation is acceptable. On the other hand, if the worst case assumption reveals that the approximated process has a major influence on the overall result, then another solution, one involving a higher quality source for the missing data, needs to be implemented (for example, by identify-ing means and resources for obtaining primary data from the producer or operator).
Guidelines for the LCA of electric vehicles 115
Which of the above solutions (theoretical modelling vs. use of data sets from similar processes) is best suited depends on the specific case and the availability of information and data sets. A key point in order to guarantee sufficient comparability with other studies is to precisely docu-ment the reasons and main details of the final data selection.
Finally, there might be situations in which it is not possible to produce a satisfactory theoreti-cal model or to find alternative data sets for filling data gaps. Through the use of worst-case assumptions, it is then necessary to decide whether the remaining data gap is acceptable or whether the insufficient data ultimately prevents the practitioner from reaching the required level of precision for answering the questions within the goal of the study.
7.2.2 Modelling future technologies
Future technologies are a special case of processes in which the LCI requires a substantial de-gree of modelling. The derivation of LCI data for these types of processes is made particularly difficult by two fundamental aspects:
1) Being technologies that are in development or, depending on the type of study, whose re-alisation might still be under scientific investigation, there may be very little data, apart from patents and/or scientific publications, available to the practitioner.
2) Even if measurements or data from first prototypes are available, the question arises as to how results obtained with this data can be compared to the results of current and established large scale technologies, since the production efforts, infrastructure, and material flows of a prototype or pilot plant are very different from the ones of an established large scale production line. The direct comparison of results from such different production scales would certainly lead to dis-torted conclusions. Hence, not only do future technologies require substantial modelling in terms of deriving the required data for the processes under analysis, but further processing might also be needed if this data is to be used for comparisons with current and established technologies.
Focusing on the first issue, as mentioned above, the key problem is the lack of information. A top-down approach as described in 7.2.1.1.2 cannot be applied since the product is still in de-velopment and data is needed for future processes. Thus, for this class of problems, a bottom-up approach is the only feasible solution if specific data is needed. If data quality requirements are low, one can also use approximations, e.g. according to chapter 7.2.1.2.
With respect to the second challenge of future technologies, the main problem lies in the fact that established technologies are characterised by production processes that typically have undergone several stages of optimization through learning processes and the effects of econ-omy of scale and mass production. Consequently, if the aim of the study is to estimate which impacts might be caused by a future technology compared to an established one, modelling the production process for a future technology has to include learning and scaling effects in an appropriate manner. This could be done by applying appropriate scaling relationships, in order to transform a data set describing a prototype production into one which includes potential effects of learning curves and economy of scale. The description of these modelling techniques is outside the scope of this document and it is left to the practitioner to choose the most appropriate ones for the specific situations that have to be addressed.

Guidelines for the LCA of electric vehicles116
Provisions 7.2: Filling data gaps and future technologies:
I. MAY: Develop theoretical models based on the literature and/or experts’ advice for deriving missing LCI data.
II. SHALL: Precisely document the developed theoretical models by explaining and detailing the sources, assumptions, experts’ advice, etc.
III. MAY20: Fill missing data through alternative data sets if data quality requirements are low and if these effectively increase the overall quality of the final inventory.
IV. MAY20: Proceed with the analysis despite remaining data gaps if worst-case as-sumptions have shown these gaps to be acceptable.
V. SHALL20: Explicitly document remaining data gaps.
VI. SHALL: Precisely document the developed theoretical models for future technol-ogies by explaining and detailing the sources, assumptions, experts’ advice, etc.
VII. SHALL: Avoid the comparison of future and established technologies without ascertaining that the corresponding data is sufficiently consistent in terms of learning curve effects and effects due to economy of scale.
23
7.3 Solving multifunctionality
Once all the data has been collected, it is necessary to identify and solve possible cases of multifunctionality. The main concepts regarding multifunctionality are described in chapter 6.3.2 ‘Multifunctionality’. Hence, for each case of multifunctionality, the practitioner needs to identify which step of the hierarchy has to be used.
As already mentioned in chapter 6.3.2, for electric vehicles and their components, a common and key case of multifunctionality is recycling, reuse, and energy recovery. Since subdivision or virtual subdivision is not feasible in these cases of multifunctionality, the recyclability sub-stitution approach (see ILCD Handbook, chapter 14.5.3) has to be applied for both situations A and B.
Recyclability substitution approachThe recyclability substitution approach is in accordance with system expansion and substitu-tion and it is applied to end-of-life products as well as to waste, e.g. metal scrap in the pro-duction phase. The approach is used in order to assess the potential benefit of an end-of-life product or waste that leaves the product system. It is necessary to expand the system bound-ary and to include the recycling process as well as the substituted process. The substituted process depends on the properties of the secondary good and the market demand.
23 Based on chapters 7.4.2.11.2 ‘Obtaining better unit process data’, 7.4.2.11.3 ‘Dealing with remaining unit process data gaps/missing data’ and 7.4.2.11.4 ‘Documentation’ from ILCD (2010)

Guidelines for the LCA of electric vehicles 117
In the case of sufficient demand, the secondary good can be used in a subsequent product system and can replace the corresponding primary production. The system boundary of the analysed product system is expanded and the recycling process and the substituted primary production process are included. Thereby, the inventory of the substituted primary produc-tion is credited according to the rate at which the end-of-life product or waste is recyclable. This rate accounts for all material losses that occur until the secondary good is produced. In case of a change of the inherent technological properties of the secondary good (e.g. down-cycling or reduced life time), the conditions for the substitution shall be investigated and a value correction included, if necessary. Additionally, the time and place where the secondary good is produced must be considered.
In case there is no demand for the secondary good, and it would normally not be used but disposed of, no credit is given, but waste depositing is modelled. In case the amount of sec-ondary good generated by recycling is smaller than the amount that is used in the product’s production a credit for avoided waste depositing is given (see ILCD, chapter 14.5.2, Figure 34, third and fourth graphic). For more information on the superseded process, please go to ILCD Handbook chapter 14.5.3.4.
A typical example of multifunctionality in an LCA of an electric vehicle or one of its compo-nents is the recycling of metal scrap regardless of whether it occurs during the production or the end-of-life phase. The metal (e.g. steel or aluminium) is used, for example, to produce the car body. Such metals are modelled as a mix of primary and secondary metal. The production route of the primary metal is based on the extraction and processing of metal ore (e.g. iron ore or bauxite) while the secondary metal is generated from the recycling of scrap.
During the manufacturing of the car body, metal scrap can arise from machining and is collect-ed for recycling. In the end-of-life phase, the car body is shredded and separated into material fractions and the resulting metal scrap is also collected for recycling. A common recycling process for metal scrap is smelting. The inventory for this recycling process has to be included as well as all previous treatment steps, collection, and transport. Due to the initial input of the metal mix, and in order to avoid double counting of recycling, the scrap flow is first divided into an internal flow and the net flow of the scrap. The internal flow refers to the initial scrap demand for production of the secondary metal input and can be represented as a closed-loop. The recycling of the net amount of scrap is considered separately, but within the same system boundary. The produced secondary metal can substitute for primary metal on the market. The net amount of secondary metal that is produced and, accordingly, the avoided primary production, depends on the recycling rate and a correction for certain quality requirements as necessary.
In summary, the inventory of the recycling process is added and the inventory of avoided primary production is subtracted. The difference is in accordance to the benefit of the net amount of scrap and is credited to the entire analysed product system (Figure 18). It is possible to consider separate recycling processes for the production scrap and the end-of-life scrap. Thus, the appropriate credits for the corresponding net amounts of new and old scrap can be distinguished. Additionally, this concept allows addressing, e.g. recycling technology changes or the distinct accounting of today’s and future emissions.

Guidelines for the LCA of electric vehicles118
Figure 18: System expansion and substitution using the example of scrap metal.(V=primary (virgin) metal production process, R = recycling process, P = production phase,
U = use phase, EoL = end-of-life treatment, W = waste disposal)
Provisions 7.3: Solving multifunctionality
I. SHALL: Use subdivision as the fi rst choice for solving multifunctionality problems.
II. SHALL: Use system expansion and substitution if subdivision is not possible.
III. SHALL: To solve cases of multifunctionality in recycling, reuse or energy recovery, the recyclability substitution approach shall be used for situations A and B (Annex 14.5 of the general ILCD Handbook). The following issues shall be addressed:�� All processes necessary to produce the secondary good must be consid-
ered in the inventory.�� The recycling rate for all materials shall be considered in order to account
for all losses.�� Inherent changes of technological properties must be considered and, if
necessary, accounted for via value correction.�� The time and place of creation of the secondary good, as well as the market
demand, must be considered when selecting the superseded process.
IV. SHALL: Use allocation if neither subdivision nor system expansion can be applied or if allocation is required according to goal and scope of the study. Provisions 7.9.3 and Annex 14.4 of the general ILCD Handbook shall be used in this case.
Net amount of scrap
Net amount of sec. metal
Sec. metal
Prim. metal
Metal ore Metal ore
Sec. metal
Prim. metal
Metal ore Prim. metal
Sec. metal
Metal-mix Product Product
Internal scrap demand(closed loop)
Scrap ScrapScrap
Generated scrap
R
R
VP U WEoL
R
VV
+
-
+
-

Guidelines for the LCA of electric vehicles 119
7.4 Modelling the entire system
When all cases of multifunctionality have been solved and all inputs and outputs for every component and sub-component in the production chain can be unambiguously associated within the corresponding data sets, the overall system can be linked together.
Typically, the data for the foreground system has been gathered in the form of unit process data sets, each describing a sub-process of the production chain and cleaned of possible mul-tifunctionality problems. Data for the background system usually is taken from a database where it is either stored as unit process data or as LCI results, but in any case related to a certain reference flow. The key point at this stage is to correctly scale the various LCI data sets so their various inputs and outputs consistently match and, ultimately, return the desired reference flow of the life cycle that is under analysis.
If parameterised data sets are used (i.e. data sets in which part or all of the exchange values scale through some characteristic parameter of the output product or service) then these pa-rameters must, too, be set so as to be consistent with the rest of the chain.
Finally, while linking all the processes together, it is of fundamental importance to verify that no double counting has occurred in the modelling of the system, meaning that the same (or part of a) resource, emission, piece of manufacturing equipment, waste flow, etc., has not been included in more than one of the data sets. Often, this can occur when a process is subdivided into several sub-processes. The modelling stage is a convenient moment for verifying that such an error has not occurred.
Provisions 7.4: Modelling the entire system
I. SHALL: Scale the separated inventories correctly to each other and so they return the desired reference flow of the overall system when they are linked together (ILCD, 2010).
II. SHALL: Set parameter values to the required values in all used parameterised process data sets (if present) (ILCD, 2010).
III. SHALL: Verify that no double counting has occurred with any of the system en-tries (e.g. input materials, manufacturing/ processing equipment, emissions, waste flows).
Guidelines for the LCA of electric vehicles120
7.5 Calculating LCI results
After all the inventories have been correctly linked, the overall LCI results can be evaluated, meaning that the elementary flows exchanged with the ecosphere at the system boundary can be quantified by aggregating all the contributions in the system. Further, the share of elemen-tary flows caused by each specific process within the chain can be identified, thus aggregating contributions not only over the entire system, but also over particular modules, sub-processes or life cycles. This is essential for the understanding of the system and the identification of the main causes of environmental impacts. Hence, be it through an extended system of linked data sets or through the use of LCA software, the calculation of the LCI results shall reflect the modular approach described previously in this handbook. If the system has been modelled completely, the resulting aggregated inventory exclusively contains elementary flows in addi-tion to the product system defined by the functional unit. One exception is radioactive waste, which can stay in the inventory since no agreed LCI modelling framework for its long-term management is available yet (ILCD, 2010).
Finally, in comparative LCA studies of electric vehicles, it may occur that the environmental impacts of the electric vehicle are compared to the ones of other technologies. Considering that the internal combustion engine car is the dominant vehicle technology today, it can be expected that one of the most frequent comparisons will be between electric vehicles and some form of ICE vehicle (e.g. diesel, petrol, gas). While it is out of the scope of this hand-book to give guidance on the modelling of these technologies, it is expected that the same principles presented here for electric vehicles (e.g. transparency, modularity, system boundary definition, multifunctionality issues) will be used for other types of vehicles and these shall be used consistently with the methods used for the electric vehicle.
Provisions 7.5: Calculating LCI results
I. SHALL: Compute the LCI results by aggregating the contributions from all the processes within the system boundaries. Apart from aggregating across the entire system, aggregations across key modules, sub-processes, life cycles, etc., should also be taken into account for facilitating the identification of critical points in the system.
II. SHOULD: Radioactive waste can be kept in the inventory for direct use in inter-pretation since no agreed LCI modelling framework for its long-term manage-ment is available yet (ILCD, 2010).
III. SHALL: In comparative LCAs with other vehicle technologies, LCI results shall be derived using the same modelling principles adopted for the electric vehicle.

Guidelines for the LCA of electric vehicles 121
8 Life Cycle Impact Assessment (ILCD 2010)
Life Cycle Impact Assessment is the phase in an LCA where the inputs and outputs of elemen-tary flows that have been collected and reported in the inventory are translated into impact indicator results related to human health, natural environment, and resource depletion. It is important to note that LCA and the impact assessment is analysing the potential environmen-tal impacts that are caused by interventions that cross the border between technosphere and ecosphere and act on the natural environment and humans, often only after fate and exposure steps. The results of LCIA should be seen as environmentally relevant impact potential indica-tors, rather than predictions of actual environmental effects. LCA and LCIA are equally distinct from risk based, substance specific instruments.
See also the related notes in the guidance document “Framework and requirements for Life Cycle Impact Assessment (LCIA) models and indicators”. Using the LCIA methods as identified in the scope phase of the LCI/LCA study, now the LCIA results are to be calculated.
Overview
LCIA is composed of mandatory and optional steps:
�� Based on classification and characterization of the individual elementary flows, which is usually based on work from LCIA experts that provide complete sets of LCIA methods for use by LCA practitioners (see separate guidance document “Framework and require-ments for Life Cycle Impact Assessment (LCIA) models and indicators”), the LCIA results are calculated by multiplying the individual elementary flows of the LCI results with the characterisation factors.
�� In a subsequent, optional step, the LCIA results can be multiplied with normalisation fac-tors that represent the overall inventory of a reference (e.g. a whole country or an average citizen), obtaining dimensionless, normalised LCIA results.
�� In a second optional step these normalised LCIA results can be multiplied by a set of weighting factors, that indicate the different relevance that the different impact cat-egories (midpoint level related weighting) or areas-of-protection (endpoint level relat-ed weighting) may have, obtaining normalised and weighted LCIA results that can be summed up to a single-value overall impact indicator. Note that a weighting set always involves value choices.
Normalisation and weighting necessary?
The decision of inclusion/exclusion of normalisation and weighting shall have been made and documented in the initial scope definition. One has to be aware that, as explained in chapter 6.5, the choice of the reference system for normalization can significantly influence the LCIA re-sults and is often not straight forward. Note that normalisation and weighting may be required as interim step for defining the quantitative cut-off rules (see chapter 6.6.3 in the general ILCD Handbook) and for checking the achieved completeness of the inventory (see chapter 9.3.2); this depends on the chosen approach for implementing the cut-off rules. If used exclusively

Guidelines for the LCA of electric vehicles122
for this purpose, the respective normalised and weighted figures are not staying in the data set or report.
For provisions on normalisation and weighting please check the ILCD Handbook, chapters 8.3 and 8.4. Please also see chapter 8.2 for frequent errors when calculating the LCIA.
Provisions 8: Life Cycle Impact Assessment
I. SHALL: Classification of elementary flows: All elementary flows of the inventory shall be assigned to those one or more impact categories to which they con-tribute (“classification”) and that were selected for the impact assessment in the scope definition of the study.
II. SHALL: Characterisation of elementary flows: To each classified elementary flow one quantitative characterisation factor shall be assigned for each category to which the flow relevantly contributes (“characterisation”). That factor expresses how much that flow contributes to the impact category indicator (at midpoint level) or category endpoint indicator (at endpoint level). For midpoint level in-dicators this relative factor typically relates to a reference flow (e.g. it may be ex-pressed in “kg CO2-equivalents” per kg elementary flow in case of Global Warm-ing Potential). For endpoint level indicators it typically relates to a specific dam-age that relates to the broader area of protection. Examples are e.g. species loss measured e.g. as potentially displaced fraction of species for an affected area and duration (pdf*m2*a), or damage to Human health measured e.g. in Disability Ad-justed Life Years (DALYs). (For terms and details refer to the separate document “Framework and requirements for Life Cycle Impact Assessment (LCIA) models and indicators”).
III. SHALL: Calculate LCIA results per impact category: For each impact category separately, calculate the LCIA indicator results by multiplying the amount of each contributing (i.e. classified) elementary flow of the inventory with its characteri-sation factor. The results may be summed up per impact category, but summing up shall not be done across impact categories. Note that this is done with either the midpoint level (impact potential) or the endpoint level (damage) factors, as had to be decided in scope chapter 6.7.7.
IV. SHALL - Separately calculate LCIA results of long-term emissions: LCIA results of long-term emissions (i.e. beyond 100 years from the time of the study) shall be calculated separately from the LCIA results that relate to interventions that occur within 100 years from the time of study. [ISO!]Note: Given the different extent of uncertainty, these two sets of results will later be presented separately while discussed jointly.

Guidelines for the LCA of electric vehicles 123
V. SHALL: Separately calculate non-generic LCIA results, if included: In the case ad-ditional or modified, non-generic (e.g. geographically or otherwise differenti-ated) characterisation factors or LCIA methods are used, the results applying the original, generic LCIA methods shall be calculated (and later be presented and discussed)
VI. SHOULD: Keep results of non-LCA impacts separate: For LCIA results of impacts that are outside the LCA frame but that were considered relevant for the ana-lysed or compared system(s) and have been included quantitatively, the inven-tory, impact assessment, etc. Shall be kept separately for clear interpretation. [ISO+]

Guidelines for the LCA of electric vehicles124
9 Life Cycle Interpretation
Life Cycle interpretation consists of three to four activities:
�� Identification of significant issues�� Evaluation of the sensitivity of significant issues�� Formulation of conclusions and recommendations�� Additional considerations if the study involves comparisons
In the first step, the main contributors to the LCIA results, i.e. the most relevant stages, proc-esses and elementary flows, are to be identified through a contribution analysis. Then, how sensitive the results are to changes in assumptions and uncertainties shall be evaluated, es-pecially for the main contributors. That not every aspect of uncertainty can be quantified and that the results of an uncertainty analysis do not cover the total uncertainty must be carefully considered. This step builds the basis for drawing conclusions and formulating recommenda-tions. For this, identified limitations must also be considered appropriately. In the case of com-parative studies, one has to be especially careful not to over-interpret insignificant differences and not to draw general conclusions from specific case studies. In this context, it also has to be carefully considered that full functional equivalence is often not given, which limits the conclusions that can be drawn. A typical example is the limitation in range per charge, which makes BEVs not fully comparable to conventional vehicles.
Since the general procedure for life cycle interpretation is independent of the subject of an LCA, this phase cannot be enhanced for the area of electric vehicles and their components. Therefore, the explanations, recommendations and provisions made in chapter 9 of the ILCD Handbook fully apply in the context of electric vehicles also. For specific guidance, please refer to the Handbook (ILDC, 2010). For your convenience, we very briefly summarise the key as-pects and reproduce the provisions from the handbook at the end of this chapter.
Interpretation is needed for two reasons: First, it serves to improve the Life Cycle Inventory model to meet the needs derived from the study goal. Second, it serves to derive robust conclu-sions and - often - recommendations once the final results are available. Interpretation relates to the goal definition and considers all phases of an LCA collectively in the light of achieved accuracy, completeness, and precision of the applied data and assumptions (for detailed guid-ance on data quality quantification please refer to the general ILCD Handbook, ‘Annex A: 12.3 Data quality indicators’). The interpretation proceeds through the identification of significant issues, the evaluation of their sensitivity or influence on the overall results, and ends in the for-mulation of conclusions and recommendations (if the study aims for this, which is usually the case). The ILCD Handbook gives provisions for these three steps of interpretation.

Guidelines for the LCA of electric vehicles 125
Provisions 9.2: Identification of significant issues
This provision applies to all types of deliverables of the study, but for unit process, partly terminated systems, LCI results and LCIA results data sets as deliverables only to improve the data quality during the iterative loops of developing the LCI data or the system model. (Findings may also be included in an LCI study report.)
I. SHALL - Identify significant issues: These can be among the following:
I.a Inventory items: Main contributing “key” life cycle stages, processes, product, waste and elementary flows, parameters. This part is also known as weak point analysis or gravity analysis. Use contribution analysis techniques.
I.b Impact categories: Main contributing “key” impact categories (only identifiable if weighting was applied). Use contribution analysis techniques.
I.c Modelling choices and method assumptions: Relevant modelling choices, such as applied allocation criteria / substitution approaches in the inventory analysis, assumptions made when collecting and modelling inventory data for key proc-esses and flows, selecting secondary data, systematic choices on technological, geographical, and time-related representativeness, methodological consistency, extrapolations, etc. Use scenario analysis techniques.
I.d Commissioner and interested parties: The influence of the commissioner and interested parties on decisions in goal and scope definition, modelling choices, weighting sets and the like. Discuss influences on final results and recommenda-tions. [ISO!]
Note: For analysing the significant issues of unit processes and partly terminated systems, complete the system model as appropriate (e.g. cradle-to-gate) with a background sys-tem before the contribution analysis is done (see chapters 7.8). Focus the contribution analysis to the unit process / partly terminated system itself (i.e. the significant flows, assumptions, parameters, processes etc. within the original system boundary).
Note: the "informative" annex B of ISO 14044:2006 provides a range of examples of life cycle interpretation, including but not only on the identification of significant issues.
Provisions 9.3.2: Completeness check
This provision applies to all types of deliverables of the study, but for unit process, partly terminated systems, LCI results and LCIA results data sets as deliverables only to improve the data quality during the iterative loops of developing the LCI data or the system model. (Findings may also be included in an LCI study report.)

Guidelines for the LCA of electric vehicles126
I. SHALL - Evaluate LCI model completeness (cut-off): The cut-off rules as defined in the scope phase (see chapter 6.6.3) shall be systematically applied to ensure that the final data set inventory/ies meets the pre-defined or goal-derived data quality requirements (see chapter 6.9.2). Evaluate the completeness of the inventory data in relation to the initially defined cut-off criteria in terms of:
I.a Process coverage: Coverage of all relevant processes in the system
I.b Elementary flow coverage: Coverage of all relevant elementary flows in the in-ventories for the processes of the system (and in particular the key processes iden-tified under Significant issues – see chapter 9.2), that have characterisation factors for the relevant impact categories (according to the goal of the LCI/LCA study)
I.c Operationalize cut-off approximation: The cut-off criteria / approach and per-centage as defined in the scope phase shall be used (see 6.6.3). This may be op-erationalized using stepwise the following cut-off rules for flow properties, pre-checking property by property the achieved completeness across all flow types and balancing the aggregated numbers in the inputs against those of the outputs: [ISO+]
I.c.i For product flows: “mass” (of individual key chemical elements), “energy content”, “market value” (or “production/provision cost”, especially for purchased services).
I.c.ii For waste flows: “mass” (of individual key chemical elements), “energy content”, “treatment cost”.
I.c.iii For elementary flows: “mass” (of individual key chemical elements and only for the environmentally relevant flows, i.e. excluding not or less relevant flows such as e.g. incineration air consumed and waste steam leaving the process as emission to air), “energy content”.
I.d Cut-off for comparative assertions: The cut-off shall always be met also by mass and energy, in addition to environmental impact.
I.e Additional relevance criteria for elementary and waste flows: Also those emis-sions and wastes should be include in the data collection that have a low mass and energy content but a known relevance for the respective type of processes or industry (using e.g. legal limits and expert judgement). [ISO+]
I.f Approximating the 100 % value: The 100 % reference of completeness may be approximated by using "best approximation" values for all initially missing infor-mation and data, using among others information from similar processes and ex-pert judgement. This missing information and data can be especially: [ISO+]
I.f.i kind and quantity of initially missing flows,
I.f.ii element composition and energy content of all flows that relevantly contribute to the total mass of the flows,
I.f.iii cost of all goods and services that relevantly contribute to the total production cost and production value
Guidelines for the LCA of electric vehicles 127
I.f.iv environmental impact of yet missing background data sets for consumed goods and services.
I.g Estimating precision of 100 % value approximation: The precision of the 100 % approximation may be judged from analysing the share of the different quality lev-els of the data that make up the inventory: a higher share of low quality data also makes the 100 % approximation less precise. [ISO+]
I.h Completeness of impact: As last step, and using the quantitative cut-off value de-cided upon in chapter 6.6.3, approximate the achieved degree of completeness / cut-off. [ISO+]
I.i Leaving out negligible flows: It is an option to leave out negligible flows that jointly make up less than 10 % of the share of impact that is cut off (e.g. if the com-pleteness is 95 %, 5 % are cut-off. 10 % of these 5 % are 0.5 % that are considered negligible.) It is recommended however to not leave them out. [ISO+]
Note that the LCIA methods and (potentially) normalisation and weighting for use in defining the cut-off was decided in the scope phase, see chapter 6.7.7.
Note that for unit processes and partly terminated systems the completeness is to be judged in relation to the unit process and partly terminated system itself. I.e. any lack of completeness of other processes that were added exclusively to complete the system model for the completeness check shall be disregarded when quantifying the achieved completeness.
II. SHOULD - Improve completeness, if needed: In the case of insufficient complete-ness, the inventory analysis (and sometimes the impact assessment) phases should be revisited to increase the degree of completeness. It is recommended to focus on the key life cycle stages, processes and flows identified as significant issues. This improvement of the LCI data is however to be started by potentially fine-tuning or revising goal and scope, i.e. with a complete iteration (see chapters 2.2.4 and 4, and related Figure 4 and Figure 5).
III. SHALL - Report final completeness; potentially revise scope or goal: If the aimed at completeness has been achieved, or if it cannot be increased further, the finally achieved degree of completeness shall to be reported (as % degree of com-pleteness / cut-off). For LCA studies, it shall be considered when later formulating the limitations in the conclusions and recommendations. If the aimed at or neces-sary completeness cannot be achieved, it shall be decided whether the scope or even the goal needs to be revised or re-defined.

Guidelines for the LCA of electric vehicles128
Provisions 9.3.3: Sensitivity check (of accuracy and precision)
This provision applies to all types of deliverables of the study, but for unit process, partly terminated systems, LCI results and LCIA results data sets as deliverables only to improve the data quality during the iterative loops of developing the LCI data or the system model. (Findings may also be included in an LCI study report.)
I. SHALL - Check sensitivity of results: Check to what extent the accuracy and preci-sion of the overall results meets the requirements posed by the intended applica-tions. Aim at improving it to the required level, as follows:
I.a Sensitivity of significant issues: Identify the most sensitive among the significant issues identified earlier (chapter 9.2) and analyse the sensitivity of these for the overall results, along with their stochastic and systematic uncertainty estimates. The outcome is determining for the accuracy and precision of the overall results and the strength of the conclusions, which can be drawn from the LCI/LCA study and must be reported together with these. Be aware that calculated uncertainty figures may not include the often determining systematic uncertainties caused by model assumptions, data gaps, and lack of accuracy.
I.a.i Sensitivity of LCI items: Evaluate the sensitivity of the LCIA results (or weighted LCIA results, if applied) to key flows, process parameter settings, flow properties, and other data items such as recyclability, life-time of goods, duration of services steps, and the like. Assess how sensitive inventory items influence the data representa-tiveness, and precision. [ISO!]
I.a.ii Sensitivity of LCIA factors: Evaluate the sensitivity of the LCIA results (or weighted LCIA results, if applied) considering the often widely differing uncertainty of the results due to uncertainties in the impact assessment (e.g. Human toxicity, Eco-toxicity etc. with high uncertainties and Global warming, Acidification, etc. with lower uncertainty). [ISO!]
I.a.iii Sensitivity of modelling choices and assumptions: Evaluate the sensitivity of the LCIA results (or weighted LCIA results, if applied) to different modelling choices and method assumptions ("method issues"), e.g. quantitative and qualitative aspects of the functional unit, superseded processes, allocation criteria, etc. [ISO!]
I.b Improve robustness of sensitive issues data, parameters, impact factors, assump-tions, etc. as possible: In the case of lack of quality for some of the significant issues, revisit the inventory analysis and/or the impact assessment phases to improve the concerned data (for data issues), impact factors (for LCIA issues), or try to qualify and discuss the sensitive assumption or choice (for method issues). As for data completeness, also the improvement of the LCI data precision is however to be started by potentially fine-tuning or revising goal and scope, i.e. with a complete iteration (see chapters 2.2.4 and 4).

Guidelines for the LCA of electric vehicles 129
I.c Report final achievements; potentially revise scope or goal: If the certainty of key issues meets the needs, or if it cannot be reduced to obtain the accuracy and pre-cision that is required by the application of the LCI/LCA study, it shall be decided whether the scope or even the goal needs to be revised or re-defined. This shall be reported and for LCA studies later be considered when formulating the limitations in the conclusions and recommendations from the LCA (chapter 9.4).
Provisions 9.3.4: Consistency check
These provisions applies to all types of deliverables of the study, but for unit process data sets as deliverable only to improve the data quality during the iterative loops of developing the LCI data or the system model. (Findings may also be included in an LCI study report.)
For partly terminated systems, LCI results and LCIA results data sets they serve in addi-tion to ensure method consistency across the processes of the model.
For LCA studies, they serve in addition to ensure method consistency across the models of the compared systems.
I. SHALL - Data quality sufficiently consistent?: Check whether any differences in data quality per se (i.e. accuracy, completeness, and precision) and in the selected data sources for the different processes in the system(s) are consistent with the goal and scope of the study. This is especially relevant for comparative studies.
II. SHALL - Method choices consistent?: Check whether all methodological choices (e.g. LCI modelling principles, allocation criteria or system expansion / substitu-tion approach, system boundary, etc.) are consistent with the goal and scope of the study including the intended applications and target audience. This shall be judged by checking whether the method provisions have been met that are given in relation to the applicable Situation A, B, or C1 / C2. [ISO!]
Note that method consistency applies on both unit process level (i.e. consistent ap-proach to develop unit process from raw data) and system level (i.e. consistently model-ling the system). This aspect is especially relevant when combining data from different sources.
III. SHALL - Consistent impact assessment?: Check whether the steps of impact assess-ment (including normalisation and weighting, if included) have been consistently applied and in line with goal and scope.
IV. SHALL - Evaluate relevance of inconsistencies: Evaluate the relevance / significance of any identified inconsistencies (as above) for the results and document them, including when reporting the achieved method consistency and appropriateness. For LCA studies additionally consider these findings when drawing conclusions or recommendations from the results.

Guidelines for the LCA of electric vehicles130
Provisions 9.4: Conclusions, limitations, and recommendations
Note the limitations for Situation C1 and C2 studies in their use for direct decision support.
These provisions apply only to comparative and non-comparative LCA studies.
I. SHALL - Analyse the results from a system's perspective: Separately analyse and jointly discuss the results obtained in the main system(s) model(s) and - if per-formed - with the corresponding reasonably worst and best case assumption sce-narios and possibly further assumption scenarios. Integrate the results of any po-tentially performed uncertainty calculations into the analysis. [ISO!]
I.a) Items that require special or separate analysis:
I.a.i Non-generic LCIA: Separately analyse and jointly discuss the results obtained with the default LCIA methods and those obtained including any potential additional or modified / non-generic (e.g. spatially or otherwise differentiated) LCIA methods.
I.a.ii Long-term emissions: Separately analyse and jointly discuss the results for inter-ventions within the first 100 years from the time of the study and those beyond that time limit.
I.a.iii Carbon storage and delayed emissions: Only if such is included in line with an ex-plicit goal requirement: Separately analyse and jointly discuss the results including and excluding carbon storage and delayed emissions / reuse/recycling/reuse cred-its.
I.b Draw conclusions, if foreseen: Take into account the findings of the earlier elements of the interpretation phase. Draw conclusions in accordance with the goal defined for the LCA study and with the definitions of the scope, in particular those related to data quality requirements, and with the predefined assumptions and known limitations in the methodology and its application in the LCA. Consider all assump-tions and related limitations that were noted down in the course of the study.
I.c Address impacts outside the LCA scope, if any: Name any potential or actual effects on the three areas of protection that are based on other mechanisms than those covered by LCA (e.g. accidents, direct application of products to humans, etc.) and that are considered relevant by the interested parties. Clarify that these are outside the scope of LCA.
Note that within the ILCD Handbook, not quantified effects outside the scope of LCA cannot be explicitly or implicitly assessed regarding their relevance in comparison to the LCA results.
I.d Conclusions for comparisons: Differences in data quality and methodological choices between compared systems shall be consistent with the goal and scope of the study, especially (see also chapter 6.10):
I.d.i The functional unit of the compared alternatives shall be sufficiently similar to al-low for comparisons, especially in view of stakeholders and potential users.
Guidelines for the LCA of electric vehicles 131
I.d.ii The setting of system boundaries shall be consistently applied to all systems.
I.d.iii The inventory data should be of comparable quality (i.e. accuracy, completeness, precision, methodological consistency) for all compared alternatives.
I.d.iv The steps of impact assessment shall be consistently applied for all systems.
I.d.v The significance of any above identified inconsistencies to the results of the com-parison shall be evaluated and considered when drawing conclusions and giving recommendations from the results.
II. SHALL - Recommend strictly based on conclusions and limitations:
II.a Base any recommendations made in the LCA study exclusively on these conclu-sions and respecting the limitations. Derive recommendations unambiguously and in a stepwise logical and reasonable consequence of the conclusions. Do so in ac-cordance with the defined goal of the LCA study and specially the intended appli-cations and target audience.
II.b Recommendations shall be made in a conservative way, only based on significant findings. Any relevant limitations found during the study are to be stated explicitly and clearly in the key message of the LCA study including in the executive sum-mary. [ISO!]
II.c Special care must be taken to avoid misinterpretations also by a non-technical au-dience, to avoid interpretation beyond the scope of the LCA study and beyond what is supported by its outcome.
II.d Equality of compared alternatives shall not be stated, unless it has been shown to be significant: the lack of significant differences alone shall not be misinterpreted as equality of the analysed options. It shall only be stated that with the given data restrictions and/or uncertainties or other causes no significant differences could be identified. [ISO!]
III. SHALL - Comparisons of systems with dominant subjective preference: The results and recommendations of comparative studies on not objectively comparable al-ternatives (e.g. personal services, fashion items, jewellery) shall be presented with the explicit statement that comparability is not assumed per se, but lies with the individual preference and judgement. [ISO!]
IV. SHALL - Conclusions on basket-of-product type of studies: For studies that analyse several processes or systems in a non-competitive manner, i.e. processes / systems that perform clearly different functions (e.g. basket-of-products, identifying prior-ity products) it shall be clearly reported that no comparability exists in terms of preferability among the processes / systems.
Note: Annex 15.3 gives an illustrative example on avoiding misleading goal and scope definition and results interpretation for comparative studies.

Guidelines for the LCA of electric vehicles132
10 Reporting
As discussed in chapter 6.9 ‘Planning reporting” some key aspects of the reporting need to be addressed during scope definition for the study. In this chapter, additional information on contents and report formats is given. Since the method of reporting the results of an LCA is a general matter of thoroughly describing the underlying work, independent of the specific topic, most of the information here is either taken directly from the general ILCD Handbook, or references to the general ILCD Handbook are given for the practitioner to access directly. When almost an entire sub-chapter is taken from the general ILCD Handbook, this is specified in the respective title (see, for example, the next sub-chapter, 10.1).
10.1 Introduction and overview (10.1 in ILCD 2010)
The results and conclusions of the LCI/LCA study shall be completely and accurately reported without bias to the intended audience. The results, data, methods, assumptions and limita-tions shall be transparent and presented in sufficient detail to allow the reader to comprehend the complexities and trade-offs inherent in the LCA. The report shall also allow the results and interpretation to be used in a manner consistent with the goals of the study.
The needs of different audiences should be recognized and addressed when presenting or disseminating the study. Target audiences can be internal, (defined) external, or public, and technical or non-technical. These audiences can include companies, trade associations, gov-ernment agencies, environmental groups, scientific/technical communities, and other non-government organizations, as well as the general public / consumers. Communication in the public domain is especially critical because the risks of misinterpretation are heightened when LCA-derived information is provided to audiences not familiar with the complexity of the methodology and related limitations that may apply.
Good reporting of LCI and LCA studies provides the relevant project details, the process fol-lowed, approaches and methods applied, and results produced. This is essential to ensure re-producibility of the results and to provide the required information to reviewers to judge the quality of the results and appropriateness of conclusions and recommendations (if included).
The complete reporting should also contain the data used and should ensure transparency and consistency of all the methodologies and data employed. It should constitute the primary input to the scientific/technical audience and be a base from which summary reports to other target audiences could be prepared. These latter summaries need to be tailored to the recipi-ent requirements, labelled as summaries only, and include appropriate reference to the prima-ry report and related review reports in order to ensure that they are not taken out of context.
Confidentiality interests around sensitive or proprietary information and data are to be met, while confidential access to at least the reviewers is to be granted to support the review of the data set and/or report. Separate, complementary confidential reports can serve this purpose.

Guidelines for the LCA of electric vehicles 133
10.2 Reporting principles (10.2 in ILCD 2010)
Reports and data sets The form and levels of reporting depends primarily on three factors: �� the type of deliverable(s) of the study, �� the purpose and intended applications of the study and report, and �� the intended target audience (especially technical or non-technical and internal or third-
party/public).
Reporting LCIA results Wherever LCIA results are published in a report or data set, for transparency reasons this is to be accompanied by the LCI results. In the case of normalised or weighted LCIA results, the re-sults of previous steps (classification and characterisation) are equally to be reported. For the same reason, characterisation results at endpoint (damage) level are to be supplemented by midpoint level impact category results, as well as the LCI results.
Confidentiality In the case data or information (e.g. on technologies, catalysts, ingredients) cannot be report-ed for confidentiality or proprietary reasons, this information can be documented in a separate confidential report that does not need to be made available externally, except for foreseen critical reviewers under confidentiality. The kind of information documented in this confiden-tial report shall be named in the detailed report, if any.
Reporting of revised goal and /or scope items In some cases, the goal and the scope of the LCI/LCA study may need to be revised due to unforeseen limitations, constraints or as a result of additional information. The final documen-tation of the LCI/LCA study has to reflect this, including the consequence for completeness, precision, application fields, etc.
Provisions 10.2: Reporting principles (10.2 in ILCD 2010)
I. SHALL - Report complete and unbiased: Results and conclusions of the LCI or LCA study shall be completely and accurately reported without bias to the in-tended audience.
II. SHALL - Use SI units: Per default the Système international d'unités (SI) units (Base units and derived units) shall be used for reporting. In cases where non SI units which are mentioned in the SI are commonly used, these can be used alterna-tively (e.g. hours (h), minutes (min), litre (l), tonne (t), dezibel (dB).

Guidelines for the LCA of electric vehicles134
III. SHALL - Reproducibility and target audience to guide reporting: Results, data, methods, assumptions and limitations shall be transparent and presented in suf-ficient detail to allow the reader to comprehend the complexities and trade-offs inherent in the study and LCA in general. Reporting of technical details shall be guided along the aim to ensure an as good as possible reproducibility of the results and of any conclusions and recommendations (if included). Consider the technical and LCA methodology understanding of the target audience.
IV. SHALL - Reporting LCIA results: Depending on the intended applications, the LCIA results may also be reported in the study report or data set. If done, this shall meet the following requirements:[ISO!]
IV.a) The intended way of reporting LCIA results was identified in the scope definition in accordance with the intended application of the LCI/LCA study and any pre-scription given in the goal definition.
IV.b) For transparency reasons, the LCIA results shall be published jointly with the LCI results. In the case of normalised or weighted LCIA results the previous steps (classification and characterisation) shall equally be reported.
IV.c) Impact assessment results at endpoint (damage) level shall be supplemented by midpoint level impact category results (unless the endpoint LCIA method does not have a midpoint interim step) and also by the LCI results.
Note that if the study is intended to support a comparative assertion to be disclosed to the public, no form of numerical, value-based weighting of the indicator results is permitted.
10.3 Three levels of reporting requirements and reporting elements
Three, classical levels of reporting, with different and increasing requirements, are defined in the general ILCD Handbook: the report for internal use, the third party report, and the report on comparative studies to be disclosed to the public.
The report for internal use is not intended for disclosure to any external party outside the company or institution that has commissioned or (co)financed the study or performed the LCA work. Examples could be studies for identification of internal improvement potentials and focus points for product development.
No formal provisions are made for internal reports. In order to provide appropriate and robust decision support, closely following report requirements for thirdparty reports is recommend-ed (ILCD, 2010).
The third party report is intended to document and communicate the results of the LCA to a third party (i.e. an interested party other than the commissioner or the LCA practitioner per-

Guidelines for the LCA of electric vehicles 135
forming the study). Regardless of other considerations, a third-party report must be prepared as a reference document and a documentation of the study.
The inclusion of confidential information is not required, but does need to be available for reviewers under confidentiality agreements, and would be documented separately or as part of the report for internal use. Third-party reports should have an executive summary for non-technical audiences.
Details on how to address the realisation of the third-party report (and/or the confidential report as described in more detail above, if such is prepared) is described in sub-chapter 10.3 ‘Three levels of reporting requirements’ of the general ILCD Handbook and will not be repeated here.
In order to avoid unnecessary interruptions in the flow of the report, annexes can be used, par-ticularly for information of a more technical and tabular nature. It should include (ILCD, 2010):
�� Questionnaire and/or data collection templates and raw data �� List of all assumptions24 (It is recommended that these include those assumptions that
have been shown to be irrelevant). �� Full LCI results
The report on comparative studies to be disclosed to the public involves a comparison of products and the results are intended to be disclosed to the public. This may or may not involve concluding the superiority of one product (or equality of the analysed products), i.e. it can be a comparative assertion disclosed to the public or a non-assertive comparative study that shall be treated the same as a comparative assertion.
This form of report mostly builds on the third party report, with additional requirements that need to be considered. ‘Note that it shall include an executive summary for non-technical audi-ences. The details on how to address the realization of the reports on comparative, published studies (and/or the confidential report as described above and if such is prepared)’ are de-scribed in sub-chapter 10.3 ‘Three levels of reporting requirements’, and the provisions therein and will not be repeated here.
The general ILCD Handbook recognizes four main elements as parts of LCA reports. These are (ILCD, 2010):
�� the Executive Summary �� the Technical Summary�� the Main Part �� the Annex
Additionally, a fifth part, the Confidential Report, can be compiled if necessary.
24 Note that the important ones are to be repeated and considered quantitatively in the sensitivity analysis and quantitatively and qualitatively in the interpretation. The relevant assumptions are also to be documented in the context where they belong, e.g. for processes together with the processes they concern at the relevant place (LCI chapter or scope definition)

Guidelines for the LCA of electric vehicles136
Again, the reader is referred to chapter 10.3 ‘Three levels of reporting requirements’ of the general ILCD Handbook for the details of what should be described in the various report parts. Particularly, the essential topics that need to be covered in the main part are listed in the con-text of the goal of the study, scope of the study, life cycle inventory, life cycle impact assess-ment and interpretation. Below, only the provisions described in chapter 10.3 of the general ILCD are reported.
25
Provisions 10.3: Three levels of reporting requirements and reporting elements (ILCD 2010)
I. SHALL - The following form and level of reporting shall be done: I.a) The required level of reporting was identified in chapter 6 [ISO+] I.b) Use ILCD report template and data set format22: The ILCD report template and
the ILCD data set format should be used for reporting LCI/LCA studies and data sets, respectively. [ISO+]
I.c) Enclose / reference report to data sets: It is recommended to accompany data sets with a LCI/LCA study report.
I.d) Enclose / reference LCI data sets in report: It is recommended to enclose the modelled LCI data sets to the LCA study report (e.g. as printout and/or via hy-perlinks) as far as confidentiality concerns and ownership rights permit this. The full LCI results shall be included in this report.
I.e) Use / combine correct level(s) of reporting: These specific levels go back to the three main levels of reporting that have a different set of requirements un-der ISO 14044:2006 that shall be used: “Reports for internal use”, “Third-party report”, “Report on comparative studies to be disclosed to the public”. In detail:
I.f ) MAY - Reports for internal use (recommendation only): [ISO+] I.f.i) Document results and conclusions of the LCA in a complete, accurate and unbi-
ased way. I.f.ii) Especially regarding inventory data, it is recommended to document the data
on the level that it enters the calculations before its unit or property conversion, scaling, etc. (i.e. as “raw data”) to provide appropriate information for reviewers and users. This information may be provided together with calculations such as conversions, scaling factors applied, averaging, extrapolations, etc.
I.f.iii) Consider to address some of the requirements to third-party reports or public reports also in internal reports as this will strengthen the robustness and hence reliability of the results.
I.g) SHALL - Third-party reports (10.3.2): The third-party report is a reference doc-ument for any third party to whom the communication is made. The report can be based on confidential information, while this information itself does not need to be included in the third-party report. It is recommended to meet con-fidentiality interests by making sensitive and proprietary data and information available only to the critical reviewers under confidentiality as a separate confi-dential report. [ISO+]
25 To the best of the authors’ knowledge, these templates were not yet available on the ILCD website at the time of writing.

Guidelines for the LCA of electric vehicles 137
I.h) In addition to the requirements on reports for internal use, the following com-ponents and aspects shall be included in the third-party report26: [ISO!]
II. SHALL - Executive summary (for non-technical audience) [ISO+]
III. SHALL - Technical summary (for technical audience / LCA experts) [ISO+]
IV. SHALL - Main report, with the following aspects: Note that the following items and the [ISO+] and [ISO!] marks do relate to the general structuring and items to be included only; the exact items to be re-ported are identified in the other Provisions of this document.
IV.a) General aspects: IV.a.i) date of report; IV.a.ii) statement that the study has been conducted according to the requirements of ISO
14044:2006 and the ILCD Handbook. [ISO!] IV.b) Goal of the study: IV.b.i) intended application(s); IV.b.ii) method, assumptions or impact coverage related limitations; [ISO!] IV.b.iii) reasons for carrying out the study and decision-context; IV.b.iv) the target audiences; IV.b.v) statement as to whether the study intends to support comparative assertions in-
tended to be disclosed to the public IV.b.vi) commissioner of the study and other influential actors, including LCA practitioner
(internal or external). [ISO+] IV.c) Scope of the study: IV.c.i) function, including IV.c.i.1) statement of performance characteristics, and IV.c.i.2) any omission of additional functions in comparisons; IV.c.ii) functional unit(s), including IV.c.ii.1) consistency with goal and scope, IV.c.ii.2) definition, IV.c.ii.3) result of performance measurement; IV.c.iii) reference flow(s) IV.c.iv) LCI modelling framework applied, i.e. according to Situation A or B[ISO!] IV.c.iv.1) uniform application of the procedures IV.c.v) system boundary, including IV.c.v.1) types of inputs and outputs of the system as elementary flows should be provided, IV.c.v.2) decision criteria on system boundary definition, and on individual or systematic
inclusions and exclusions [ISO!] IV.c.v.3) omissions of life cycle stages, activity types, processes, or flows, IV.c.v.4) quantification of energy and material inputs and outputs, and
26 The parts in italics are directly taken from ISO 14044, chapter 5.2, but removing ISO-internal chapter-references. A few aspects have been moved to other places, but all are covered.
Guidelines for the LCA of electric vehicles138
IV.c.v.5) assumptions about electricity production; IV.c.vi) cut-off criteria for initial inclusion of inputs and output, including IV.c.vi.1) description of cut-off criteria and assumptions, IV.c.vi.2) effect of selection on results, IV.c.vi.3) inclusion of mass, energy and environmental cut-off criteria. IV.c.vii) data quality requirements should be included (in addition to the finally achieved
quality) IV.c.viii) LCIA scope settings, including IV.c.viii.1) impact categories and category indicators considered, including a rationale for
their selection and a reference to their source; IV.c.viii.2) descriptions of or reference to all characterization models, characterization fac-
tors and methods used, including all assumptions and limitations; IV.c.viii.3) any differentiations, additions or modifications of original, default LCIA meth-
od with justifications [ISO!] IV.c.viii.4) descriptions of or reference to all value-choices used in relation to impact catego-
ries, characterization models, characterization factors, normalization, grouping, weighting and, elsewhere in the LCIA, a justification for their use and their influence on the results, conclusions and recommendations;
IV.c.viii.5) a statement that the LCIA results are relative expressions and do not predict im-pacts on category endpoints, the exceeding of thresholds, safety margins or risks. and, when included as a part of the LCA, also
IV.c.viii.6) a description and justification of the definition and description of any new im-pact categories, category indicators or characterization models used for the LCIA,
IV.c.viii.7) a statement and justification of any grouping of the impact categories, IV.c.viii.8) any further procedures that transform the indicator results and a justification of
the selected references, weighting factors, etc., IV.c.ix) included comparison between (product) systems IV.c.x) modifications of the initial scope together with their justification should be provided IV.d) Life cycle inventory analysis: IV.d.i) data collection procedures; IV.d.ii) qualitative and quantitative description of unit processes, at least of the fore-
ground system; [ISO!] IV.d.iii) references of all publicly accessible data sources (sources for all data used and
individual identification for the key processes / systems); [ISO!] IV.d.iv) calculation procedures (preferably including the steps from raw data to fore-
ground system unit process(es)); [ISO!] IV.d.v) validation of data, including IV.d.v.1) data quality assessment, and IV.d.v.2) treatment of missing data; IV.d.vi) sensitivity analysis for refining the system boundary; IV.d.vii) specific substitution or allocation procedures for key multifunctional processes
(and products in case the study directly compares multifunctional products), including [ISO!]

Guidelines for the LCA of electric vehicles 139
IV.d.vii.1) justification of the specific procedures IV.e) Life cycle impact assessment results calculation, where applicable: IV.e.i) the LCIA procedures, calculations and results of the study; IV.e.ii) limitations of the LCIA results relative to the defined goal and scope of the LCA; IV.e.iii) the relationship of LCIA results to the defined goal and scope; IV.e.iv) the relationship of the LCIA results to the LCI results; IV.e.v) any analysis of the indicator results, for example sensitivity and uncertainty analy-
sis or the use of environmental data, including any implication for the results, and IV.e.vi) data and indicator results reached prior to any normalization, grouping or weight-
ing shall be made available together with the normalized, grouped or weighted results.
IV.f) Life cycle interpretation: IV.f.i) the results; IV.f.ii) assumptions and limitations associated with the interpretation of results, both
methodology and data related; IV.f.iii) data quality assessment; IV.f.iv) full transparency in terms of value-choices, rationales and expert judgements. IV.g) Critical review, where applicable: IV.g.i) name and affiliation of reviewers; IV.g.ii) critical review reports; IV.g.iii) responses to recommendations.
V. SHALL - Annex: The annex serves to document elements that would inappro-priately interrupt the reading flow of the main part of the report, and are also of a more detailed or tabular technical nature and for reference. It should include: [ISO!]
V.a) Questionnaire/ data collection template and raw data, V.b) list of all assumptions (It should include those assumptions that have been
shown to be irrelevant), V.c) full LCI results.
VI. MAY - Confidential report: If prepared, the confidential report shall contain all those data and information that is confidential or proprietary and cannot be made externally available. It shall however be made available to the critical reviewers under confidentiality.
VII. SHALL - Report for comparative studies: Reporting on assertive and non-assertive comparative studies intended to be disclosed to the public, the fol-lowing additional reporting7 shall be done in addition to the requirements to reports for internal use and third party reports (10.3.3):
VII.a) analysis of material and energy flows to justify their inclusion or exclusion; VII.b) assessment of the precision, completeness and representativeness of data used; VII.c) description of the equivalence of the systems being compared in accordance with
ISO-chapter 4.2.3.7 and related provisions in this document; [ISO!]
Guidelines for the LCA of electric vehicles140
VII.d) description of the critical review process; VII.e) an evaluation of the completeness of the LCIA; VII.f ) a statement as to whether international acceptance exists for the selected category
indicators and a justification for their use; VII.g) an explanation for the scientific and technical validity and environmental relevance
of the category indicators used in the study; VII.h) the results of the uncertainty and sensitivity analyses; VII.i) evaluation of the significance of the differences found.
VIII) Grouping: If grouping is included in the LCA, add the following: VIII.a) the procedures and results used for grouping; VIII.b) a statement that conclusions and recommendations derived from grouping are
based on value-choices; VIII.c) a justification of the criteria used for normalization and grouping (these can be per-
sonal, organizational or national value-choices); VIII.d) the statement that “ISO 14044 does not specify any specific methodology or sup-
port the underlying value choices used to group the impact categories”; VIII.e) the statement that “The value-choices and judgements within the grouping pro-
cedures are the sole responsibilities of the commissioner of the study (e.g. govern-ment, community, organization, etc.)”.
Overall, in addressing the above listed points, the practitioner should keep in mind that, as a general rule, all the points in the previous chapters of this guidance document that urge the practitioner to document, report, describe, justify, etc., on issues such as modelling choices, assumptions, parameter values, data sources, etc., should be part of the final report, as these are key for the understanding and critical evaluation of the study. Finally, care should also be taken in the choice of how the LCIA results are reported. The use of an appropriate degree of modularity in the representation of the LCIA results, in graphs as well as tables, can help read-ers to understand the critical elements of the system under analysis. One possibility is to split the results according to the contributions coming from the production, use, and EoL phases. Also, highlighting the contributions of some key sub-processes (particular devices, services, materials, etc.) can clarify where the main impacts in the system originate. Ultimately, the ap-propriate degree of modularity is the one which allows the reader to best address the ques-tions raised by the goal and scope of the study.

Guidelines for the LCA of electric vehicles 141
11 Critical Review (ILCD 2010)
The scope and type of critical review desired should have been defined in the scope phase of an LCA, and the decision on the type of critical review should have been recorded (see chapter 6.8). As in the previous chapter, the recommendations for critical review are of a general nature that is topic independent. The guidelines below are therefore taken directly from the general ILCD Handbook.
The critical review is one of the key features in LCA. Its process shall assure, among others:
�� whether the methods used to carry out the LCA are consistent with this guidance docu-ment and thereby also with ISO 14040 and 14044:2006,
�� the methods used to carry out the LCA study are scientifically and technically valid, �� the data used are appropriate and reasonable in relation to the goal of the study, �� the interpretations reflect the limitations identified and the goal of the study, and �� the study report is transparent and consistent.
The detailed review requirements regarding what to review and how, and how to report the outcome of the review are given in the separate document “Review scope, methods, and documentation”27.
More details on the minimum required level/type of review for each specific type of delivera-bles of the LCI/LCA study can be found in the separate document “Review schemes for Life Cycle Assessment (LCA)”. Eligibility of reviewers is addressed in the separate document “Re-viewer qualification”28. These documents are available on the “life cycle thinking and assess-ment” website: http://lct.jrc.ec.europa.eu/assessment/publications.
For LCA studies directed towards public audiences, an interactive review process at various stages of the LCA can improve the study’s credibility.
27 This document was under preparation when the present document was finalised. Until it has been published under the ILCD Handbook, the relevant ISO 14040 and 14044 requirements shall be met as a minimum.
28 In the general ILCD Handbook, the title ‘Reviewer qualification’ is given. To date, the only such document available, to the best of the authors’ knowledge, is ‘Reviewer qualification for Life Cycle Inventory (LCI) data sets’.

Guidelines for the LCA of electric vehicles142
Provisions 11: Critical Review (ILCD 2010)
I. SHALL - See chapter 6.8 for key decisions made on the critical review: The scope and type of critical review desired should have been defined in the scope phase of an LCA (see chapter 6.8). The following provisions repeat these key pro-visions that otherwise have to be applied at this point:[ISO!]
I.a) Identify minimum critical review type: Identify along the separate document “Review schemes for Life Cycle Assessment (LCA)” whether a critical review shall be performed and which review type shall be applied as a minimum. This de-pends on the kind of deliverable of the study, its foreseen decision-context, the kind of intended audience (internal / external / public and technical / non-tech-nical), and whether a comparison is part of the study.
I.b) Select eligible reviewers: If a critical review is to be done, eligible reviewer(s) shall be selected. Eligibility of reviewers is addressed in the separate document "Reviewer qualification".
II. SHALL - Review scope, methods, and documentation: The selected reviewer(s) shall perform the review and report its outcome along the provisions of the sep-arate document "Review scope, methods, and documentation". [ISO!]
Guidelines for the LCA of electric vehicles 143
12 References
Althaus 2010 H.-J. Althaus, Marcel Gauch, “Vergleichende Ökobilanz individueller Mobi-lität: Elektromobilität versus konventionelle Mobilität mit Bio- und fossilen Treibstoffen”, Empa Report, 2010
ArGV3 2011 „Wegleitung zur Verordnung 3 zum Arbeitsgesetz“, Swiss State Secretariat for Economic Affair, 2011
Bütler 2013 T. Bütler, H. Winkler, „Energy consumption of battery electric vehicles“, Report available from http://www.empa.ch/plugin/template/empa/*/131727, 2013
Campanari 2009 S. Campanari, G. Manzolini, F. Garcia de la Iglesia, “Energy analysis of elec-tric vehicles using batteries or fuel cells through well-to-wheel driving cycle simulations”, Journal of Power Sources, Vol. 186, pp.464-477, 2009
Duleep 2012 G. Duleep, H. van Essen, B. Kampman, M. Grünig, “Assessment of electric vehi-cle and battery technology”, Report by CE Delft and Ecologic; commissioned by the European Commission within the study: Impacts of electric vehicles – deliverable 2, 2011.
Ekvall 2004 T. Ekvall, B. Weidema, “System Boundaries and Input Data in Consequential Life Cycle Inventory Analysis”, International Journal of Life Cycle Assessment, Vol. 9, pp. 161-171, 2004
eLCAr 2012 Authors: H.-J. Althaus, A. Del Duce, T. Dettmer, P. Egede, E. Szczechowicz, S. Winter, “Workshop 1 Documentation”, Editors: M. Klein, M. Stock, 2012
European Commission 2006 “European Technology Platform – SmartGrids Vision and Strategy for Europe’s
Electricity Networks of the Future”, Report by the Directorate-General for Re-search, Sustainable Energy Systems, of the European Commission, 2006.
FCHY 2011a A. Lozanovski, O. Schuller, M. Faltenbacher: “Guidance document for perform-ing LCA on Hydrogen production systems”, 2011, available from: http://www.fc-hyguide.eu/documents/10156/d0869ab9-4efe-4bea-9e7a-1fb823f4fcfa
FCHY 2011b P. Masoni, A. Zamagni: “Guidance document for performing LCA on fuel cells”, 2011, available from http://www.fc-hyguide.eu/documents/10156/21d22f59-9a01-4b90-a526-537b169081a2
Geringer 2012 B. Geringer, W.K. Tober. “Batterieelektrische Fahrzeuge in der Praxis – Kosten, Reichweite, Umwelt, Komfort”, Report by the Österreichischer Verein für Kraftfahrzeugtechnik (ÖVK) and the Österricher Automobil-, Motorrad-, und Touring Club (ÖAMTC), 2012
Grünig 2011 M. Grünig et al., “An overview of electric vehicles on the market and in develop-ment”, Report by CE Delft and Ecologic; commissioned by the European Com-mission within the study: Impacts of electric vehicles – deliverable 1, 2011.
Habermacher 2011 F. Habermacher, “Modeling material inventories and environmental impacts
of electric passenger cars”, Master Thesis, Department of Environmental Sci-ences, ETH Zurich, 2011.
Guidelines for the LCA of electric vehicles144
Hawkins 2012 T.R. Hawkins, O.M. Gausen, A.H. Strømman: “Environmentals impacts of hy-brid and electric vehicles – a review”, International Journal of Life Cycle As-sessment, Vol. 17, pp. 997-1014, 2012
ILCD 2010 European Commission, Joint Research Centre, Institute for Environmental Sustainability, “International Reference Life Data System (ILCD) Handbook – General guide for Life Cycle Assessment – Detailed guidance”, First edition March 2010.
ISO 14040:2006 International Organization for Standardization, “ISO 14040 Environmental management – Life Cycle Assessment – Principles and framework”, 2006
ISO 14044:2006 International Organization for Standardization, “ISO 14044 Environmental management – Life Cycle Assessment – Requirements and guidelines”, 2006
Jung 2011 M. Jung, A. Kemle, T. Strauss, M. Wawzyniak, “Innenraumheizung von Hybrid- und Elektrofahrzeugen”, Automobiltechnische Zeitschrift (ATZ), pp.396-401, 2011
Khayyam 2011 H. Khayyam, A.Z. Kouzani, E.J. Hu, S. Nahavandi, “Coordinated energy man-agement of vehicle air conditioning system”, Applied Thermal Engineering, Vol.31, pp.750-764, 2011
Lund 2010 H. Lund, B. V. Mathiesen, P. Christensen, J. H. Schmidt, “ Energy system analy-sis of marginal electricity supply in consequential LCA”, International Journal of Life Cycle Assessment, Vol. 15, pp. 260-271, 2010
Majeau-Bettez 2011 G. Majeau-Bettez, T.R. Hawkins, A.H. Strømman, “Life Cycle Environmental As-
sessment of Lihtium-Ion and Nickel Metal Hydride Batteries for Plug-In Hy-brid and Battery Electric Vehicles”, Environmental Science and Technology, Vol. 45, pp.4548-4554, 2011
Mattsson 2001 N. Mattsson, T. Unger, T. Ekvall, “Marginal Effects in a Dynamic System – The case of the nordic power system”, presented to the International Workshop on Electricity Data for Life Cycle Inventories, Cincinnati, USA, 2001.10.23-25
Mock 2012 P. Mock, J. German, A. Bandivadekar, I. Riemersma, “Discrepancies between type approval and “real-world” fuel-consumption and CO2 values”, Interna-tional council on clean transportation, working paper, 2012-2
Schweimer 2000 G.W. Schweimer, M. Levin, “Life Cycle Inventory for the Golf A4”, Research, Environment and Transport Volkswagen AG, Wolfsburg and Center of Envi-ronmental Systems Research, University of Kassel, Germany, 2000
Soltic 2011 P. Soltic, C. Bach, “CO2 reduction and cost efficiency potential of natural gas hybrid passenger cars”, SAE Papers, 2011-24-0110, 2011
Weidema 1999 Weidema, B. P.; Frees, N.; Nielsen, A.-M., „Marginal production technologies for life cycle inventories”, International Journal of Life Cycle Assessment, Vol. 4, pp. 48-56, 1999

Guidelines for the LCA of electric vehicles 145
13 Annex
Below, for each cell marked with a 1 in the interdependency matrix given in chapter 4 (i.e. indi-cating that an interaction occurs), a comment on the type of interaction is given in the legend. For example, the comment on the influence of the e-motor on the vehicle weight can be found as item number 11.
Table 9: Interdependency Matrix. Numbers explained in the legend.
Legend:
1 The weight of the charger may slightly influence the overall vehicle weight.2 The efficiency of the charger might strongly influence the overall energy demand.3 The weight of the traction battery may strongly influence the overall vehicle weight.4 The charge-discharge-efficiency of the battery moderately influences overall energy de-
mand. Stand-by losses (e.g. of high temperature batteries) can strongly increase energy demand in use phase.
5 The charger must fit to the traction battery.6 The voltage and the power of the traction battery may have an influence on the neces-
sary size and performance of the power electronics.7 The volume and the form of the battery may influence the body (frame) form.8 The weight of the power electronics may slightly influence the overall vehicle weight.
Components VehiCle
Char
ger
Tracti
on-B
atte
ry
Powe
r Elec
tronic
s
E-m
otor
Trans
miss
ion
SBSS
Body
(Fra
me)
Aero
dyna
mics
Insu
lation
Non-
p. El.
Syste
m
Vehic
le W
eight
Over
all En
ergy
Dem
and
(in us
e pha
se)
is/ar
e infl
uenc
ed by
…
influence(s)…
Vehi
Cle Vehicle Weight 1 3 8 11 16 18 20 0 22 25 30
Energy Demand (in use phase, NOT via weight)
2 4 9 12 17 19 0 21 23 26 27
Com
pone
nts
Charger 5 0 0 0 0 0 0 0 0 0 0Traction-Battery 0 10 13 0 0 0 0 0 0 0 31Power Electronics 0 6 14 0 0 0 0 0 0 0 32E-motor 0 0 0 0 0 0 0 0 0 0 33Transmission 0 0 0 15 0 0 0 0 0 0 34SBSS 0 0 0 0 0 0 0 0 0 28 35Body (Frame) 0 7 0 0 0 0 0 0 0 29 0Aerodynamics 0 0 0 0 0 0 0 0 0 0 0Insulation 0 0 0 0 0 0 0 0 0 0 0Non-p. El. System 0 0 0 0 0 0 0 0 24 0 0

Guidelines for the LCA of electric vehicles146
9 The energy demand of the power electronics may moderately influence the overall en-ergy demand during use phase.
10 The design of the power electronics can influence the life expectancy of the battery.11 The weight of the e-motor may moderately influence the overall vehicle weight.12 Efficiency and dimensioning of the e-motor may strongly influence the overall energy
demand during use phase.13 The power of the electric motor can influence the charging power during recuperative
braking and thus the life expectancy of the battery.14 The speed of the e-motor may have an influence on the requirements of the power elec-
tronics.15 The speed of the e-motor may have an influence on the requirements of the transmis-
sion.16 The weight of the transmission may slightly influence the overall vehicle weight.17 Efficiency and gearshift strategy of the transmission may strongly influence the overall
energy demand during use phase.18 The weight of the SBSS may slightly influence the overall vehicle weight.19 The energy demand of the SBSS may moderately influence the overall energy demand
during use phase.20 The weight of the body (frame) may strongly influence the overall vehicle weight.21 The drag may strongly influence the overall energy demand during use phase.22 The weight of the insulation may slightly influence the overall vehicle weight.23 The performance of the insulation may moderately influence the overall energy demand
during use phase.24 The performance of the insulation may have an influence on the need for heating and
A/C.25 The weight of the non-propulsion electrical system may slightly influence the overall ve-
hicle weight.26 The energy demand of the non-propulsion electrical system may moderately influence
the overall energy demand during use phase.27 The overall vehicle weight may strongly influence the overall energy demand during use
phase.28 The vehicle weight influences the dimension of the SBSS.29 The vehicle weight may have an influence on the necessary strength of the body
(frame).30 The overall energy demand during use phase may have an influence on the overall vehi-
cle weight via the corresponding mass of e.g. battery and e-motor.31 The overall energy demand during use phase may have an influence on the necessary
energy capacity and power of the battery.32 The overall energy demand during use phase may have an influence on the necessary
power of the power electronics.33 Higher energy demand leads to higher power demand from motor (to ensure same driv-
ing performance).34 Higher energy demand leads to demand of higher strength of transmission (to ensure
same driving performance).35 Higher energy demand leads to demand of higher strength of SBSS (to ensure same driv-
ing performance).

