ford 2008 q1 financial result
TRANSCRIPT

FIRST QUARTER
EARNINGS REVIEWAPRIL 24, 2008
(PRELIMINARY RESULTS)

SLIDE 1
BUSINESS OVERVIEW
Alan MulallyPresident and Chief Executive Officer

SLIDE 2
TOTAL COMPANY
2008 FIRST QUARTER FINANCIAL RESULTS
Wholesales (000)* 1,531 (119)Revenue (Bils.)* $ 39.4 $ (3.6)
Continuing Operations*Pre-Tax Profits (Mils.) $ 736 $ 669After-Tax Profits (Mils.) 525 697Earnings Per Share 0.20 0.29
Special Items Pre-Tax (Mils.) $ (416) $ (303)
Net IncomeAfter-Tax Profits (Mils.) $ 100 $ 382Earnings Per Share 0.05 0.20
Automotive Gross Cash (Bils.)** $ 28.7 $ (6.5)
* Excludes special items, see Slide 8 and Appendix for reconciliations to GAAP
** Automotive Gross Cash includes cash and cash equivalents, net marketable securities, loaned securities, and for 2007 only, short-term Voluntary Employee Beneficiary Association (VEBA) assets
2008O / (U) 2007
First Quarter

SLIDE 3
TOTAL COMPANY
FIRST QUARTER 2008 OPERATIONS RESULTS / HIGHLIGHTS*
• Profitable quarter led by strong results at Ford Europe and FordSouth America
• Ford North America results improved by nearly $600 million compared with First Quarter 2007
• Ford Asia-Pacific Africa, Mazda and Ford Credit were profitable; Volvo incurred a loss
• Reduced costs by $1.7 billion, including $1.2 billion in North America; on track to reach our cost reduction goal
• Ford’s quality continues to improve across the globe -- North America improved 8%, putting Ford quality scores on par with Honda and Toyota
* Profit and cost statements exclude special items; cost statements are at constant volume, mix and exchange

SLIDE 4
TOTAL COMPANY
ACHIEVING OUR PLAN -- KEY 1Q ACCOMPLISHMENTS
• Continued progress as we aggressively restructure to operate profitably, accelerate product development, finance our plan and improve ourbalance sheet, and work together as one team
• Further integration of our global Product Development and Purchasing functions
• Introduced Ford Fiesta, our all-new global small car, at the Geneva Auto Show
• Achieved agreement to reduce North American Ford and ACH hourly personnel by an additional 4,200 employees through our recent enterprise-wide buyout program
• Agreed to sell Jaguar Land Rover to Tata Motors; sold the ACH drive shaft business and Primus Financial Services in Japan
• Introduced the “Drive One” campaign in the U.S. market, a grass roots multi-media effort using employees and dealers as Ford advocates

SLIDE 5
TOTAL COMPANY
ACHIEVING OUR PLAN -- NEXT STEPS
• Achieve our key business objectives, including profitability in North America and total Automotive in 2009*
• Continue to right size the business, including targeted personnel reductions
• Successfully launch the Ford Flex, Lincoln MKS, Ford F-150 in North America as well as the Ford Kuga and Ford Fiesta in Europe
• Complete the sale of Jaguar Land Rover and continue the disposition of our ACH business
• Improve Volvo’s results
* Excluding special items

SLIDE 6
FINANCIAL RESULTS
Don LeclairChief Financial Officer

SLIDE 7SLIDE 7
TOTAL COMPANY
2008 FIRST QUARTER INCOME FROM CONTINUING OPERATIONS COMPARED WITH NET INCOME*
Income (Mils.)
Pre-Tax Income (Excl. Special Items) $ 736 $ 669
Special Items (416) (303)
Pre-Tax Income (Incl. Special Items) $ 320 $ 366
Minority Interest (122) (64)
Taxes (97) 84
Net Income from Continuing Operations $ 101 $ 386
Discontinued Operations (1) (4)
Net Income $ 100 $ 382
* See Slide 8 for details of First Quarter 2008 special items
2008
Amount
B / (W)2007

SLIDE 8SLIDE 8
TOTAL COMPANY
2008 FIRST QUARTER SPECIAL ITEMS
Special ItemsNorth America- Personnel Actions and Associated Curtailments $ (223)- U.S. Dealer Reductions (Including Investment Write-Off) (108)- Ballard Restructuring / Other (72)
Subtotal North America $ (403)
Other Personnel Actions (13)
Jaguar Land Rover 0*
Total Special Items $ (416)
Memo: Special Items Impact on Earnings Per Share** $(0.15)
* Operating profit was essentially offset by an impairment charge; wholesale and revenue data are shown in the Appendix** Earnings per share from continuing operations is calculated on a basis that includes pre-tax profit, provision for taxes, and minority interest; see Appendix for method of calculation
(Mils.)
Pre-Tax Profit / (Loss)

SLIDE 9
TOTAL COMPANY
2008 FIRST QUARTER PRE-TAX PROFIT / (LOSS)
BY SECTOR*
* Excludes special items; see Slide 8 and Appendix for reconciliation to GAAP
Memo:B / (W) 2007 $669 $895 $(226)
FinancialServices
Automotive
(Mils.)
Total
$736$669
$67
SLIDE 10
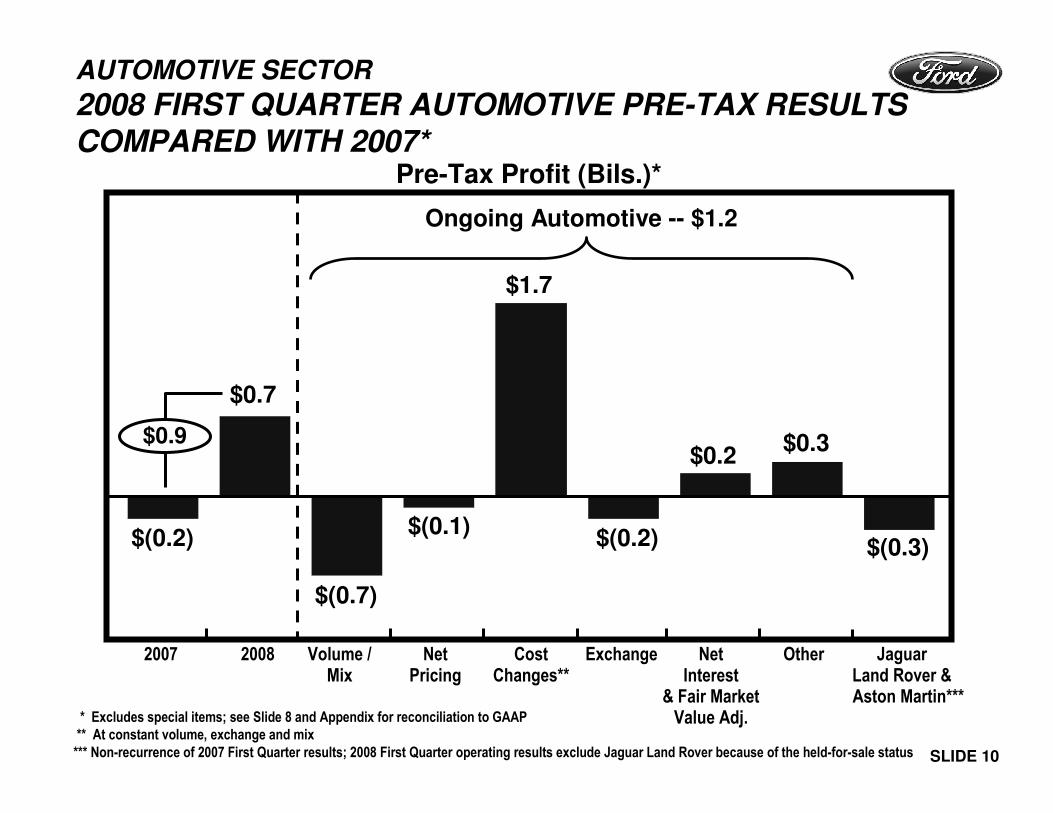
AUTOMOTIVE SECTOR
2008 FIRST QUARTER AUTOMOTIVE PRE-TAX RESULTS
COMPARED WITH 2007*Pre-Tax Profit (Bils.)*
20082007 Volume /Mix
NetPricing
CostChanges**
OtherExchange
Ongoing Automotive -- $1.2
JaguarLand Rover &Aston Martin***
* Excludes special items; see Slide 8 and Appendix for reconciliation to GAAP** At constant volume, exchange and mix*** Non-recurrence of 2007 First Quarter results; 2008 First Quarter operating results exclude Jaguar Land Rover because of the held-for-sale status
NetInterest
& Fair Market Value Adj.
$(0.2)
$(0.7)
$(0.2)
$0.7
$0.9
$1.7
$(0.3)$(0.1)
$0.3$0.2

SLIDE 11
AUTOMOTIVE SECTOR
2008 FIRST QUARTER COST CHANGES*
* At constant volume, mix, and exchange; excludes special items
2008 Costs B / (W) 2007 (Bils.)
NetProductCosts
Warranty OverheadSpending-Related
Mfg. /Engrg.
Pension /OPEB
Advertising& Sales
Promotions
Total $1.7 Bils.
$0.2
$0.3 $0.3
$0.1 $0.1
$0.6
$0.1

SLIDE 12
AUTOMOTIVE SECTOR
2008 FIRST QUARTER PROFIT / (LOSS) BY SEGMENT*
* Excludes special items; see Slide 8 and Appendix for reconciliation to GAAP
B / (W) Than $895 $568 $144 $520 $(245) $27 $28 $161 $(308)2007
Pre-Tax Profit (Mils.)*
SouthAmerica
Asia Pacific & Africa
Total NorthAmerica
OtherAuto.
VolvoEurope
Net Interest $(472)
Fair Market Value Adj. 291
Mazda
$669
$(45)
$257
$739
$(151)
$1$49
$(181)
$0
JaguarLand Rover &Aston Martin
$850 Million
$1,042 Million

SLIDE 13
AUTOMOTIVE SECTOR -- FORD NORTH AMERICA
FIRST QUARTER KEY METRICS -- 2008 vs. 2007
Revenue (Bils.)Wholesales (000) Pre-Tax Profits (Mils.)*
2008200720082007 20082007Memo: U.S. Market Share 15.1% 15.0%U.S. Dealer Inventories- First Quarter 568 565- O / (U) Prior Quarter (2) 32
* Excludes special items; see Slide 8 and Appendix for reconciliation to GAAP
744$18.5
$(613)
$(45)
$17.1704

SLIDE 14
(Bils.)
AUTOMOTIVE SECTOR -- FORD NORTH AMERICA
2008 FIRST QUARTER AUTOMOTIVE PRE-TAX RESULTS
COMPARED WITH 2007*
20082007 Volume /Mix
NetPricing
CostChanges
Other
* Excludes special items; see Slide 8 and Appendix for reconciliation to GAAP
Structural Costs $0.8Net Product Costs 0.3Other 0.1
Exchange
$(0.6)
Industry $(0.3)Stocks 0.1Mix / Other (0.3)
$0
$(0.5)
$(0.3)
$1.2
$0.1 $0.1
$0.6

SLIDE 15* Ford and Lincoln Mercury
AUTOMOTIVE SECTOR -- FORD NORTH AMERICA
U.S. MARKET SHARE*
Memo: Total (Worse) Than Prior Year (2.1) Pts. (1.1) Pts. (2.1) Pts. (0.7) Pts. (0.1) Pts.
Second Quarter2007
Fleet
Third Quarter2007
First Quarter2007
First Quarter2008
15.1%
5.0%
10.1%
15.6%
5.4%
10.2%
15.0%
13.4%
10.5% 9.8%
2.9%5.2%
Retail
14.1%
9.8%
4.3%
Fourth Quarter2007

SLIDE 16
AUTOMOTIVE SECTOR -- FORD NORTH AMERICA
OPERATING COST REDUCTIONS*
Memo (Absolutes):Total Personnel Level (000) 122 89 89Straight-Time Manned Capacity (Mils.) 3.4 2.9 2.9
Cumulative Costs B / (W) Than December 31, 2005 (Bils.)
December 31, 2006
December 31, 2007
March 31,2008
$1.5
$2.1
$3.3
* At constant volume, mix and exchange; excludes special items
2008 Plan $5 Billion

SLIDE 17
NORTH AMERICA
OPERATING-RELATED COST REDUCTIONS*
2006(Bils.)
2007(Bils.)
ProjectedFull Year(Bils.)
Net Product Costs
Product Adds $(0.9) $(2.0) $(0.1) $ (0.5) $ (0.6)
Commodities (0.3) (0.8) 0.1 (0.5) - (0.7) (0.4) - (0.6)
Material Cost Reductions 1.2 0.8 0.3 0.7 - 1.1 1.0 - 1.4
Subtotal $ 0 $(2.0) $ 0.3 $(0.3) - (0.1) $ 0 - 0.2
Structural / Other 1.5 2.6 0.9 1.7 - 2.1 2.6 - 3.0
Total $ 1.5 $ 0.6 $ 1.2 $ 1.4 - 2.0 $ 2.6 - 3.2
* At constant volume, mix, and exchange; excludes special items
$5 billion
FirstQuarter(Bils.)
2008
Balanceof Year(Bils.)

SLIDE 18
AUTOMOTIVE SECTOR -- FORD SOUTH AMERICA
FIRST QUARTER KEY METRICS -- 2008 vs. 2007 Revenue (Bils.)Wholesales (000)
Memo: Market Share** 11.1% 9.5%
* Excludes special items; see Slide 8 and Appendix for reconciliation to GAAP** South America market share is based, in part, on estimated vehicle registrations for our six major markets in that region
2008200720082007 20082007
Pre-Tax Profits (Mils.)*
84
$1.3
$113
92 $1.8
$257

SLIDE 19
AUTOMOTIVE SECTOR -- FORD EUROPE
FIRST QUARTER KEY METRICS -- 2008 vs. 2007
Revenue (Bils.)Wholesales (000) Pre-Tax Profits (Mils.)*
Memo: Market Share** 9.1% 8.9%
* Excludes special items; see Slide 8 and Appendix for reconciliation to GAAP** Market share for Ford Europe is based, in part, on estimated vehicle registrations for our 19 major European markets
2008200720082007 20082007
500
$8.6
$219
$10.2 $739500

SLIDE 20
(Bils.)
AUTOMOTIVE SECTOR -- FORD EUROPE
2008 FIRST QUARTER AUTOMOTIVE PRE-TAX PROFITS
COMPARED WITH 2007*
20082007 Volume /Mix
NetPricing
CostChanges
Other
* Excludes special items; see Slide 8 and Appendix for reconciliation to GAAP
Exchange
$0.2
$0.7
$0
$0.2$0.3
$0.2
$0.5
$(0.2)
Net Product Costs $0.2Warranty 0.2Other (0.1)

SLIDE 21
AUTOMOTIVE SECTOR -- VOLVO
FIRST QUARTER KEY METRICS -- 2008 vs. 2007
20082007
Revenue (Bils.)
20082007
Wholesales (000)
20082007
Pre-Tax Profits (Mils.)*
Memo:Market Share**U.S. 0.7% 0.7%Europe 1.5 1.4
* Excludes special items; see Slide 8 and Appendix for reconciliation to GAAP** Europe market share for Volvo is based, in part, on estimated vehicle registrations for our 19 major European markets
128 $4.6
$94
106$4.2
$(151)

SLIDE 22
(Mils.)
AUTOMOTIVE SECTOR -- VOLVO
2008 FIRST QUARTER AUTOMOTIVE PRE-TAX PROFITS
COMPARED WITH 2007*
20082007 Volume /Mix
NetPricing
CostChanges
* Excludes special items; see Slide 8 and Appendix for reconciliation to GAAP
Exchange
$94$110
$(70)
$(210)
$(151)
$(245)
Stocks $ (60)Other Volume (150)
$(40) $(35)
Net Product Costs $80Manufacturing 20Warranty / Other 10
Other

SLIDE 23
AUTOMOTIVE SECTOR -- FORD ASIA PACIFIC AFRICA AND MAZDA
2008 FIRST QUARTER PRE-TAX PROFITS*
* Excludes special items; see Slide 8 and Appendix for reconciliation to GAAP
Memo:B / (W) 2007 $55 $27 $28
(Mils.)
Asia Pacific Africa and Mazda
Asia Pacific Africa Mazda andAssoc. Operations
$50
$1
$49

SLIDE 24
AUTOMOTIVE SECTOR -- FORD ASIA PACIFIC AFRICA
FIRST QUARTER KEY METRICS -- 2008 vs. 2007
20082007
Revenue (Bils.)
20082007
Wholesales (000) Pre-Tax Profits (Mils.)*
Memo: Market Share** 2.1% 2.0%
20082007
* Excludes special items; see Slide 8 and Appendix for reconciliation to GAAP** Asia Pacific Africa market share is based on estimated vehicle sales for our twelve major markets in that region
126 $1.8
$(26)
129$1.7
$1

SLIDE 25
AUTOMOTIVE SECTOR
2008 FIRST QUARTER CASH* FirstQuarter(Bils.)Gross Cash
March 31, 2008 $28.7December 31, 2007 34.6
Change in Gross Cash $ (5.9)
Operating-Related Cash FlowAutomotive Pre-Tax Profits** $ 0.7Capital Spending (1.4)Depreciation and Amortization 1.5Changes in Working Capital / Other (incl. Timing Differences) (1.3)
Subtotal $(0.5)
Up-Front Subvention Payments to Ford Credit (1.0)
Total Automotive Operating-Related Cash Flow $(1.5)
Other Changes in CashPersonnel Separation Programs $(0.1)Pension Contributions (0.6)VEBA Related*** (4.5)Tax Refunds, Tax Payments, and Tax Receipts from Affiliates 0.9Divestitures 0.1All Other (0.2)
Change in Gross Cash $(5.9)
* See Appendix for reconciliation to GAAP** Excludes special items; see Slide 8 and Appendix for reconciliation to GAAP*** Includes transfers to Temporary Asset Account

SLIDE 26
AUTOMOTIVE SECTOR
AUTOMOTIVE FINANCIAL RESOURCES
Gross Cash* $ 28.7
Available Automotive Credit Lines
(Secured and Unsecured)** 11.9
Total Liquidity $ 40.6
Memo: Debt $ 27.1
* Includes cash and cash equivalents, net marketable securities, and loaned securities, and excludes UAW-Ford Temporary Asset Account securities
** Total committed secured and unsecured automotive credit lines (including local lines available to foreign affiliates) were $13.2 billion on March 31, 2008
March 31, 2008(Bils.)

SLIDE 27
FINANCIAL SERVICES SECTOR
2008 FIRST QUARTER PRE-TAX PROFIT / (LOSS)
BY SEGMENT
Memo:B / (W) 2007 $(226) $(257) $31
(Mils.)
Total Ford Credit Other
$67
$36*$31
* Includes a net loss of $159 million related to market valuation adjustments from derivatives

SLIDE 28
(Bils.)
FINANCIAL SERVICES SECTOR
2008 FIRST QUARTER FORD CREDIT PRE-TAX PROFIT
COMPARED WITH 2007
$(0.2)
$0
FinancingMargin
LeaseResidual
$(0.3)
Volume2008
$(0.1)
2007 CreditLoss
$0
$0.3
$0.1
$0.2
Other SFAS 133*
$(0.2)
Memo:Excl. SFAS 133*(Mils.) $329 $195
$(0.3)
* Market valuation adjustments from derivatives
Change in Reserve $(0.2)Loss Severity (0.1)
SLIDE 29
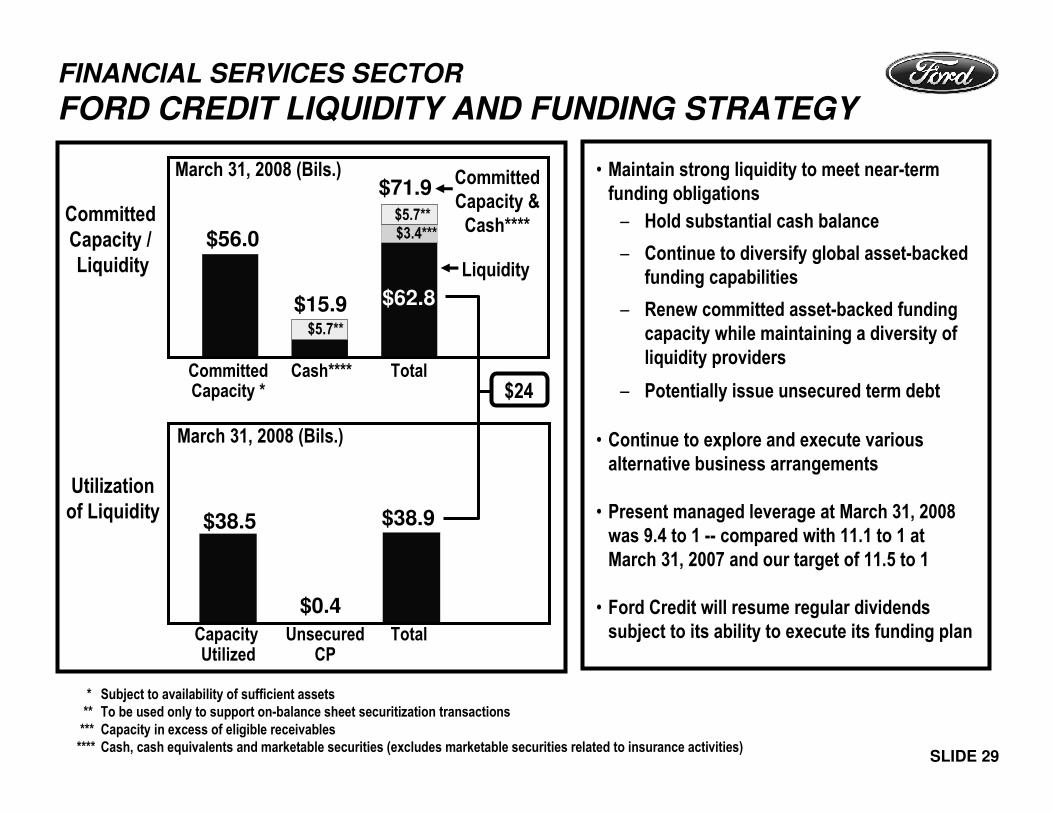
FINANCIAL SERVICES SECTOR
FORD CREDIT LIQUIDITY AND FUNDING STRATEGY
* Subject to availability of sufficient assets** To be used only to support on-balance sheet securitization transactions*** Capacity in excess of eligible receivables**** Cash, cash equivalents and marketable securities (excludes marketable securities related to insurance activities)
• Maintain strong liquidity to meet near-term funding obligations
– Hold substantial cash balance
– Continue to diversify global asset-backed funding capabilities
– Renew committed asset-backed funding capacity while maintaining a diversity of liquidity providers
– Potentially issue unsecured term debt
• Continue to explore and execute various alternative business arrangements
• Present managed leverage at March 31, 2008 was 9.4 to 1 -- compared with 11.1 to 1 at March 31, 2007 and our target of 11.5 to 1
• Ford Credit will resume regular dividends subject to its ability to execute its funding plan
Committed Capacity / Liquidity
Utilizationof Liquidity
CommittedCapacity *
Cash**** Total
$5.7**
$3.4***
CommittedCapacity &Cash****
Liquidity
March 31, 2008 (Bils.)
Capacity Utilized
UnsecuredCP
Total
March 31, 2008 (Bils.)
$5.7**
$62.8
$56.0
$71.9
$15.9
$38.5
$0.4
$38.9
$24

SLIDE 30
AUTOMOTIVE SECTOR
2008 PLANNING ASSUMPTIONS AND
OPERATIONAL METRICS
Planning Assumptions
Industry Volume (SAAR) -- U.S. (Mils.) 16.0 15.6 15.3 - 15.6-- Europe (Mils.)* 17.6 18.0 17.6 - 18.0
Operational MetricsCompared with 2007
- Quality Improve Improved On Track
- Automotive Costs** Improve by about $3 Billion Improved On Trackby $1.7 Billion
Absolute Amount- U.S. Market Share (Ford and Lincoln Mercury) Low End of 14-15% Range 15.0% On Track
- Operating Cash Flow Negative $(1.5) Billion On Track
- Capital Spending Around $6 Billion 1.4 On Track
* European 19 markets
** At constant volume, mix, and exchange; excludes special items
Full YearPlan First Quarter
Full YearOutlook

SLIDE 31
AUTOMOTIVE SECTOR
2008 PRODUCTION VOLUMES
Ford North America 692 (48) 710 (101)
Ford Europe 539 16 565 53
Volvo 112 (23) 116 0
Units(000)
O / (U)2007(000)
Units(000)
O / (U)2007(000)
First Quarter Actual
Second QuarterForecast
SLIDE 32
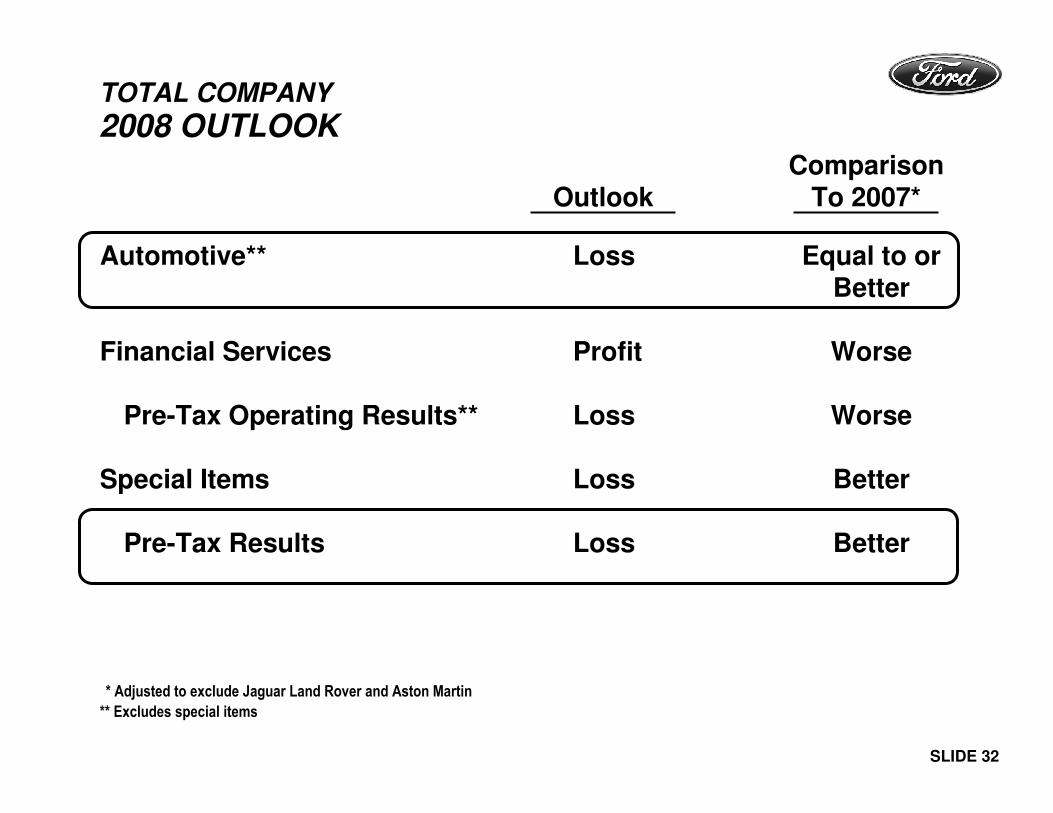
TOTAL COMPANY
2008 OUTLOOK
Automotive** Loss Equal to orBetter
Financial Services Profit Worse
Pre-Tax Operating Results** Loss Worse
Special Items Loss Better
Pre-Tax Results Loss Better
* Adjusted to exclude Jaguar Land Rover and Aston Martin
** Excludes special items
OutlookComparison
To 2007*

SLIDE 33
TOTAL COMPANY
FORWARD YEAR KEY BUSINESS METRICS
• Profitable in North America andTotal Automotive in 2009* On Plan
• $5 billion cost reductions in North Americaby 2008 compared with 2005** On Plan
• 14-15% U.S. market share Low End of Range(Ford and Lincoln Mercury) for 2008
• Cash outflow of $12 - $14 billion in 2007 - 2009 to fund operating losses and On Planrestructuring (employee separations)
* Excluding special items** At constant volume, mix, and exchange; excludes special items
Status

SLIDE 34
TOTAL COMPANY
OUR KEY PRIORITIES
• Aggressively restructure to operate profitably at current demand and changing model mix
• Accelerate development of new products our customers want and value
• Finance our plan and improve our balance sheet
• Work together effectively as one team to leverage our global resources

SLIDE 35
SAFE HARBORRisk FactorsStatements included herein may constitute “forward-looking statements” within the meaning of the Private Securities Litigation Reform Act of 1995. Forward-looking statements are based on expectations, forecasts and assumptions by our management and involve a number of risks, uncertainties, and other factors that could cause actual results to differ materially from those stated,including, without limitation:
• Continued decline in market share;
• Continued or increased price competition resulting from industry overcapacity, currency fluctuations or other factors;
• An increase in or acceleration of market shift away from sales of trucks, sport utility vehicles, or other more profitable vehicles, particularly in the United States;
• A significant decline in industry sales, particularly in the United States or Europe, resulting from slowing economic growth, geo-political events or other factors;
• Lower-than-anticipated market acceptance of new or existing products;
• Continued or increased high prices for or reduced availability of fuel;
• Currency or commodity price fluctuations;
• Adverse effects from the bankruptcy or insolvency of, change in ownership or control of, or alliances entered into by a major competitor;
• Economic distress of suppliers that has in the past and may in the future require us to provide financial support or take other measures to ensure supplies of components or materials;
• Labor or other constraints on our ability to restructure our business;
• Work stoppages at Ford or supplier facilities or other interruptions of supplies;
• Single-source supply of components or materials;
• Substantial pension and postretirement health care and life insurance liabilities impairing our liquidity or financial condition;
• Inability to implement Memorandum of Understanding with UAW to fund and discharge retiree health care obligations because of failure to obtain court approval or otherwise;
• Worse-than-assumed economic and demographic experience for our postretirement benefit plans (e.g., discount rates, investment returns, and health care cost trends);
• The discovery of defects in vehicles resulting in delays in new model launches, recall campaigns or increased warranty costs;
• Increased safety, emissions (e.g., CO2), fuel economy, or other regulation resulting in higher costs, cash expenditures, and/or sales restrictions;
• Unusual or significant litigation or governmental investigations arising out of alleged defects in our products or otherwise;
• A change in our requirements for parts or materials where we have entered into long-term supply arrangements that commit us to purchase minimum or fixed quantities of certain parts or materials, or to pay a minimum amount to the seller ("take-or-pay" contracts);
• Adverse effects on our results from a decrease in or cessation of government incentives;
• Adverse effects on our operations resulting from certain geo-political or other events;
• Substantial negative Automotive operating-related cash flows for the near- to medium-term affecting our ability to meet our obligations, invest in our business or refinance our debt;
• Substantial levels of Automotive indebtedness adversely affecting our financial condition or preventing us from fulfilling our debt obligations (which may grow because we are able to incur substantially more debt, including additional secured debt);
• Inability of Ford Credit to access debt or securitization markets around the world at competitive rates or in sufficient amounts due to additional credit rating downgrades, market volatility, market disruption or otherwise;
• Higher-than-expected credit losses;
• Increased competition from banks or other financial institutions seeking to increase their share of financing Ford vehicles;
• Changes in interest rates;
• Collection and servicing problems related to finance receivables and net investment in operating leases;
• Lower-than-anticipated residual values or higher-than-expected return volumes for leased vehicles; and
• New or increased credit, consumer or data protection or other regulations resulting in higher costs and/or additional financing restrictions.
We cannot be certain that any expectation, forecast or assumption made by management in preparing forward-looking statements will prove accurate, or that any projection will be realized. It is tobe expected that there may be differences between projected and actual results. Our forward-looking statements speak only as of the date of their initial issuance, and we do not undertake anyobligation to update or revise publicly any forward-looking statement, whether as a result of new information, future events or otherwise. For additional discussion of these risks, see“Item 1A. Risk Factors” of our 2007 10-K Report.

APPENDIX

TOTAL COMPANY
2005 - 2007 PRE-TAX RESULTS INCLUDING
SPECIAL ITEMS*
North America $(2,461) $(16,006) $(702) $ (67) $(689) $(2,681) $(4,139)South America 399 661 113 255 386 418 1,172
Europe (437) 371 208 184 254 98 744Volvo 267 (256) 90 (91) (174) (2,543) (2,718)
Asia Pacific Africa 42 (250) (28) 18 19 (7) 2Mazda and Assoc. Operations 247 259 21 72 14 75 182Subtotal $(1,943) $(15,221) $(298) $ 371 $(190) $(4,640) $(4,757)
Other Automotive (55) 247 (342) (106) (602) (10) (1,060)Subtotal Ongoing Automotive $(1,998) $(14,974) $(640) $ 265 $(792) $(4,650) $(5,817)
JLR and Aston Martin (1,901) (2,066) 301 557 81 (93) 846Total Automotive $(3,899) $(17,040) $(339) $ 822 $(711) $(4,743) $(4,971)
Financial Services 4,930 1,951 293 99 557 273 1,222Total Company $ 1,031 $(15,089) $ (46) $ 921 $(154) $(4,470) $(3,749)
* Pre-tax profits adjusted for discontinued operations at Ford Credit and for reassignment of AutoAlliance International results from Mazda and AssociatedOperations to North America Appendix 1 of 20
2005(Mils.)
2006(Mils.)
FirstQuarter(Mils.)
SecondQuarter(Mils.)
ThirdQuarter(Mils.)
FourthQuarter(Mils.)
FullYear(Mils.)
Full Year 2007
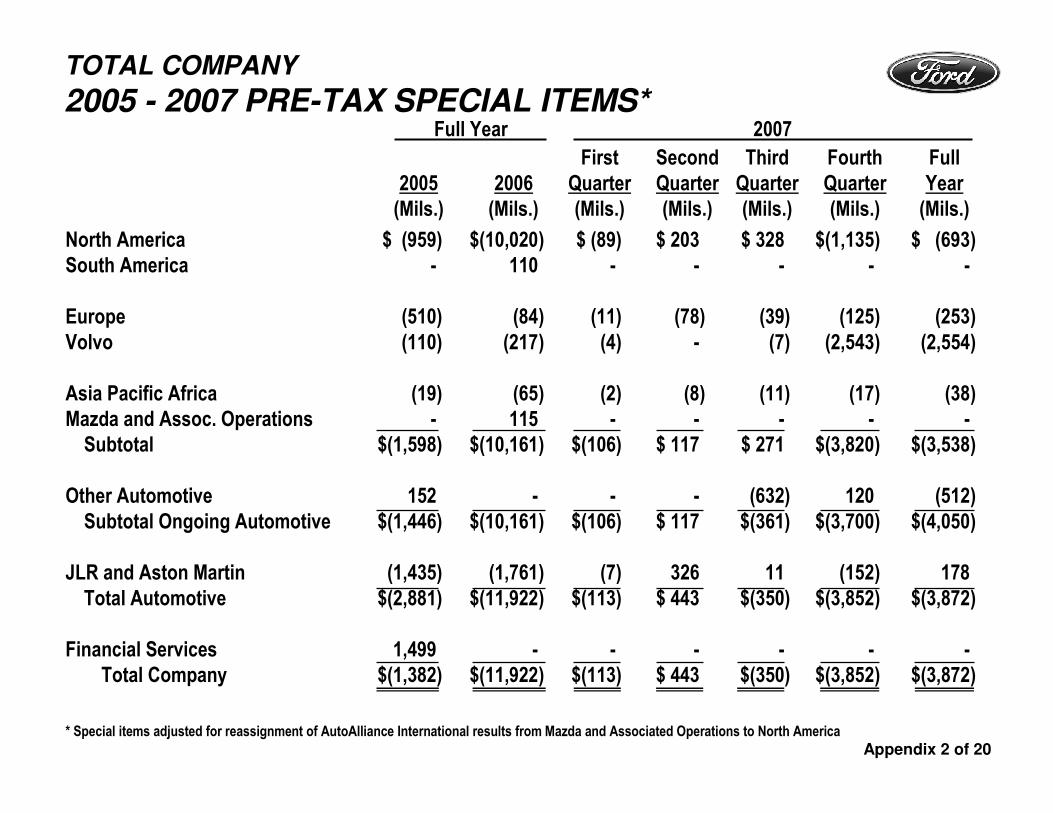
TOTAL COMPANY
2005 - 2007 PRE-TAX SPECIAL ITEMS*
North America $ (959) $(10,020) $ (89) $ 203 $ 328 $(1,135) $ (693)South America - 110 - - - - -
Europe (510) (84) (11) (78) (39) (125) (253)Volvo (110) (217) (4) - (7) (2,543) (2,554)
Asia Pacific Africa (19) (65) (2) (8) (11) (17) (38)Mazda and Assoc. Operations - 115 - - - - -Subtotal $(1,598) $(10,161) $(106) $ 117 $ 271 $(3,820) $(3,538)
Other Automotive 152 - - - (632) 120 (512)Subtotal Ongoing Automotive $(1,446) $(10,161) $(106) $ 117 $(361) $(3,700) $(4,050)
JLR and Aston Martin (1,435) (1,761) (7) 326 11 (152) 178Total Automotive $(2,881) $(11,922) $(113) $ 443 $(350) $(3,852) $(3,872)
Financial Services 1,499 - - - - - -Total Company $(1,382) $(11,922) $(113) $ 443 $(350) $(3,852) $(3,872)
* Special items adjusted for reassignment of AutoAlliance International results from Mazda and Associated Operations to North America
Appendix 2 of 20
2005(Mils.)
2006(Mils.)
FirstQuarter(Mils.)
SecondQuarter(Mils.)
ThirdQuarter(Mils.)
FourthQuarter(Mils.)
FullYear(Mils.)
Full Year 2007

TOTAL COMPANY
2005 - 2007 PRE-TAX RESULTS EXCLUDING
SPECIAL ITEMS*
North America $(1,502) $(5,986) $(613) $(270) $(1,017) $(1,546) $(3,446)South America 399 551 113 255 386 418 1,172
Europe 73 455 219 262 293 223 997Volvo 377 (39) 94 (91) (167) 0 (164)
Asia Pacific Africa 61 (185) (26) 26 30 10 40Mazda and Assoc. Operations 247 144 21 72 14 75 182Subtotal $ (345) $(5,060) $(192) $ 254 $ (461) $ (820) $(1,219)
Other Automotive (207) 247 (342) (106) 30 (130) (548)Subtotal Ongoing Automotive $ (552) $(4,813) $(534) $148 $ (431) $ (950) $(1,767)
JLR and Aston Martin (466) (305) 308 231 70 59 668Total Automotive $(1,018) $(5,118) $(226) $ 379 $ (361) $ (891) $(1,099)
Financial Services 3,431 1,951 293 99 557 273 1,222Total Company $ 2,413 $(3,167) $ 67 $ 478 $ 196 $ (618) $ 123
* Pre-tax profits adjusted for discontinued operations at Ford Credit and for reassignment of AutoAlliance International results from Mazdaand Associated Operations to North America Appendix 3 of 20
2005(Mils.)
2006(Mils.)
FirstQuarter(Mils.)
SecondQuarter(Mils.)
ThirdQuarter(Mils.)
FourthQuarter(Mils.)
FullYear(Mils.)
Full Year 2007

TOTAL COMPANY
2005 - 2007 REVENUE*
North America $81,163 $70,590 $18,559 $18,961 $16,688 $17,257 $71,465South America 4,366 5,697 1,283 1,827 2,064 2,411 7,585
Europe 29,918 30,394 8,632 9,203 8,328 10,287 36,450Volvo 17,109 16,105 4,572 4,373 3,844 5,070 17,859
Asia Pacific Africa 7,684 6,539 1,769 1,727 1,782 1,768 7,046Mazda and Assoc. Operations - - - - - - -Subtotal Ongoing Automotive $140,240 $129,325 $34,815 $36,091 $32,706 $36,793 $140,405
JLR and Aston Martin 13,174 13,923 3,815 4,015 3,564 3,954 15,348Total Automotive $153,414 $143,248 $38,630 $40,106 $36,270 $40,747 $155,753
Financial Services 23,341 16,750 4,375 4,115 4,795 4,730 18,015Total Company $176,755 $159,998 $43,005 $44,221 $41,065 $45,477 $173,768
* Revenue shown excluding special items, adjusted for discontinued operations at Ford Credit, and adjusted for reassignment of AutoAlliance Internationalfrom Mazda and Associated Operations to North America. Special items are reductions to Fourth Quarter 2007 revenues of $1,099 million forNorth America, $120 million for Europe, $87 million for Volvo, $15 million for Asia Pacific, $53 million for Jaguar Land Rover / Aston Martin representing a one-time non-cash charge related to a change in our business practice for offering and announcing retail variable marketing incentives to our dealers
Appendix 4 of 20
2005(Mils.)
2006(Mils.)
FirstQuarter(Mils.)
SecondQuarter(Mils.)
ThirdQuarter(Mils.)
FourthQuarter(Mils.)
FullYear(Mils.)
Full Year 2007
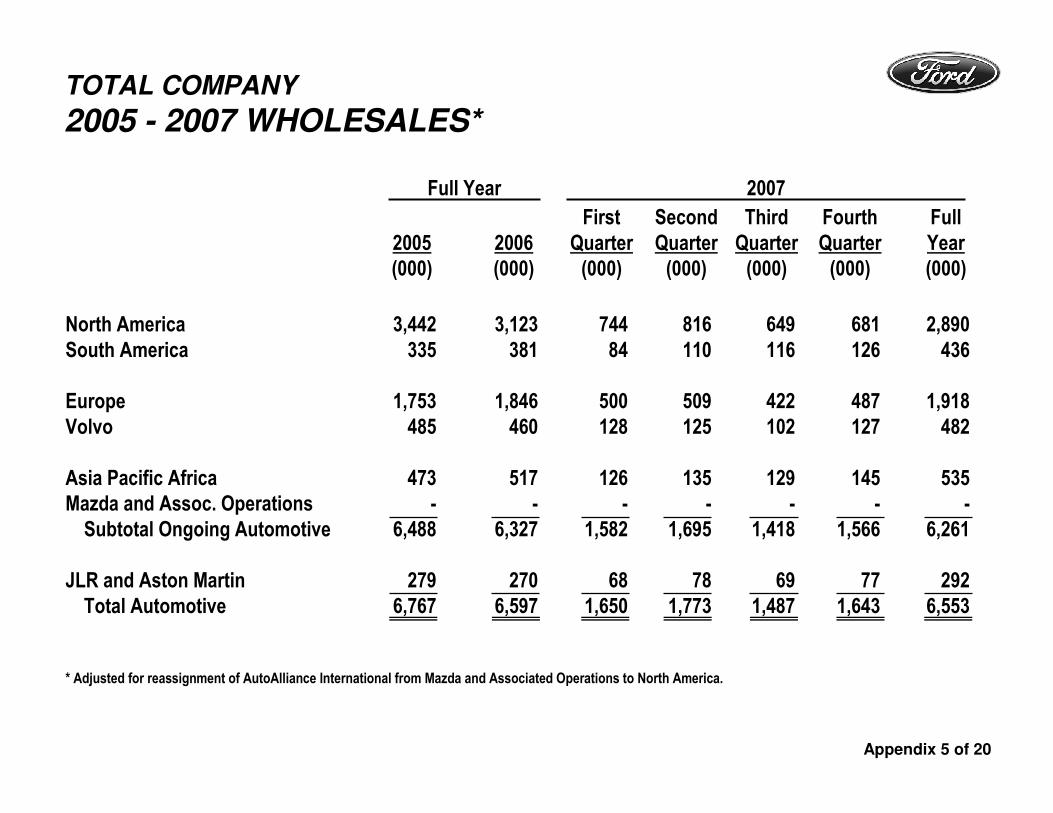
TOTAL COMPANY
2005 - 2007 WHOLESALES*
North America 3,442 3,123 744 816 649 681 2,890South America 335 381 84 110 116 126 436
Europe 1,753 1,846 500 509 422 487 1,918Volvo 485 460 128 125 102 127 482
Asia Pacific Africa 473 517 126 135 129 145 535Mazda and Assoc. Operations - - - - - - -Subtotal Ongoing Automotive 6,488 6,327 1,582 1,695 1,418 1,566 6,261
JLR and Aston Martin 279 270 68 78 69 77 292Total Automotive 6,767 6,597 1,650 1,773 1,487 1,643 6,553
* Adjusted for reassignment of AutoAlliance International from Mazda and Associated Operations to North America.
Appendix 5 of 20
2005(000)
2006(000)
FirstQuarter(000)
SecondQuarter(000)
ThirdQuarter(000)
FourthQuarter(000)
FullYear(000)
Full Year 2007

TOTAL COMPANY
CALCULATION OF EARNINGS PER SHARE
NetIncome(Mils.)Numerator
Net Income $ 100 $ 525Impact on Income from assumed exchangeof convertible notes and convertible trustpreferred securities 0 66
Income for EPS $ 100 $ 591
DenominatorAverage shares outstanding 2,188 2,188Net issuable shares, primarily stock options 20 20Convertible notes 0 538Convertible trust preferred securities 0 162
Average shares for EPS 2,208 2,908
EPS $ 0.05 $ 0.20
Appendix 6 of 20
Cont. Ops. --Excl.
Special Items(Mils.)
First Quarter 2008

TOTAL COMPANY
2008 FIRST QUARTER EFFECTIVE TAX RATE
PBT $ 736 $ 320
Less: Unconsolidated Subsidiaries (142) (142)
Adjusted PBT $ 594 $(208) (35.0)% $ 178 $ (62) (35.0)%
Tax Credits / Adjustments / Valuation Allowance 119 20.0 (35) (19.5)
Tax Provision $ (89) (15.0)% $ (97) (54.5)%
Appendix 7 of 20
Taxes(Mils.)
Tax Rate(Pct.)
Excluding Special Items Including Special Items
PBT(Mils.)
Continuing Operations
Taxes(Mils.)
Tax Rate(Pct.)
PBT(Mils.)

TOTAL COMPANY
2007 – 2008 FIRST QUARTER PRE-TAX RESULTS*
North America $(702) $(448) $ (89) $(403) $(613) $ (45)South America 113 257 0 0 113 257
Europe 208 731 (11) (8) 219 739Volvo 90 (151) (4) 0 94 (151)
Asia Pacific Africa (28) (4) (2) (5) (26) 1Mazda and Assoc. Operations 21 49 0 0 21 49
Subtotal $(298) $ 434 $(106) $(416) $(192) $ 850
Other Automotive (342) (181) 0 0 (342) (181)Subtotal Ongoing Auto. $(640) $ 253 $(106) $(416) $(534) $ 669
JLR and Aston Martin 301 0 (7) 0 308 0Total Automotive $(339) $ 253 $(113) $(416) $(226) $ 669
Financial Services 293 67 0 0 293 67Total Company $ (46) $ 320 $(113) $(416) $ 67 $ 736
* From continuing operations, 2007 adjusted for discontinued operations at Ford Credit and for reassignment of AutoAlliance International resultsfrom Mazda and Associated Operations to North America
2008(Mils.)
Pre-Tax Profits(Incl. Special Items) Special Items
Pre-Tax Profits(Excl. Special Items)
2008(Mils.)
2008(Mils.)
Appendix 8 of 20
2007(Mils.)
2007(Mils.)
2007(Mils.)

TOTAL COMPANY
2007 – 2008 FIRST QUARTER REVENUE*
North America $18,559 $17,110 $ 0 $ 0 $18,559 $17,110South America 1,283 1,842 0 0 1,283 1,842
Europe 8,632 10,155 0 0 8,632 10,155Volvo 4,572 4,197 0 0 4,572 4,197
Asia Pacific Africa 1,769 1,668 0 0 1,769 1,668Mazda and Assoc. Operations 0 0 0 0 0 0
Subtotal Ongoing Auto. $34,815 $34,972 $ 0 $ 0 $34,815 $34,972
JLR and Aston Martin 3,815 4,145 0 4,145 3,815 0Total Automotive $38,630 $39,117 $ 0 $ 4,145 $38,630 $34,972
Financial Services 4,375 4,396 0 0 4,375 4,396Total Company $43,005 $43,513 $ 0 $ 4,145 $43,005 $39,368
* From continuing operations, 2007 adjusted for discontinued operations at Ford Credit, and for reassignment of AutoAlliance
International from Mazda and Associated Operations to North America.
2008(Mils.)
Revenue(Incl. Special Items) Special Items
Revenue(Excl. Special Items)
2008(Mils.)
2008(Mils.)
Appendix 9 of 20
2007(Mils.)
2007(Mils.)
2007(Mils.)

North America* 744 704 0 0 744 704South America 84 92 0 0 84 92
Europe 500 500 0 0 500 500Volvo 128 106 0 0 128 106
Asia Pacific Africa** 126 129 0 0 126 129Mazda and Assoc. Operations 0 0 0 0 0 0Subtotal 1,582 1,531 0 0 1,582 1,531
Other Automotive 0 0 0 0 0 0Subtotal Automotive Ops. 1,582 1,531 0 0 1,582 1,531
JLR and Aston Martin 68 74 0 74 68 0Total Automotive 1,650 1,605 0 74 1,650 1,531
TOTAL COMPANY
2008 FIRST QUARTER WHOLESALES*
* Includes consolidation of Automotive Alliance International (AAI) wholesales from production of Mazda6 vehicles only** Included in wholesales of Asia Pacific Africa are Ford-badged vehicles sold in China and Malaysia by certain unconsolidated affiliates
totaling about 55,000 and 38,000 units in 2008 and 2007, respectively.
2008(000)
Wholesales(Incl. Special Items) Special Items
2008(Mils.)
2008(Mils.)
2007(Mils.)
2007(Mils.)
2007(000)
Appendix 10 of 20
Wholesales(Excl. Special Items)
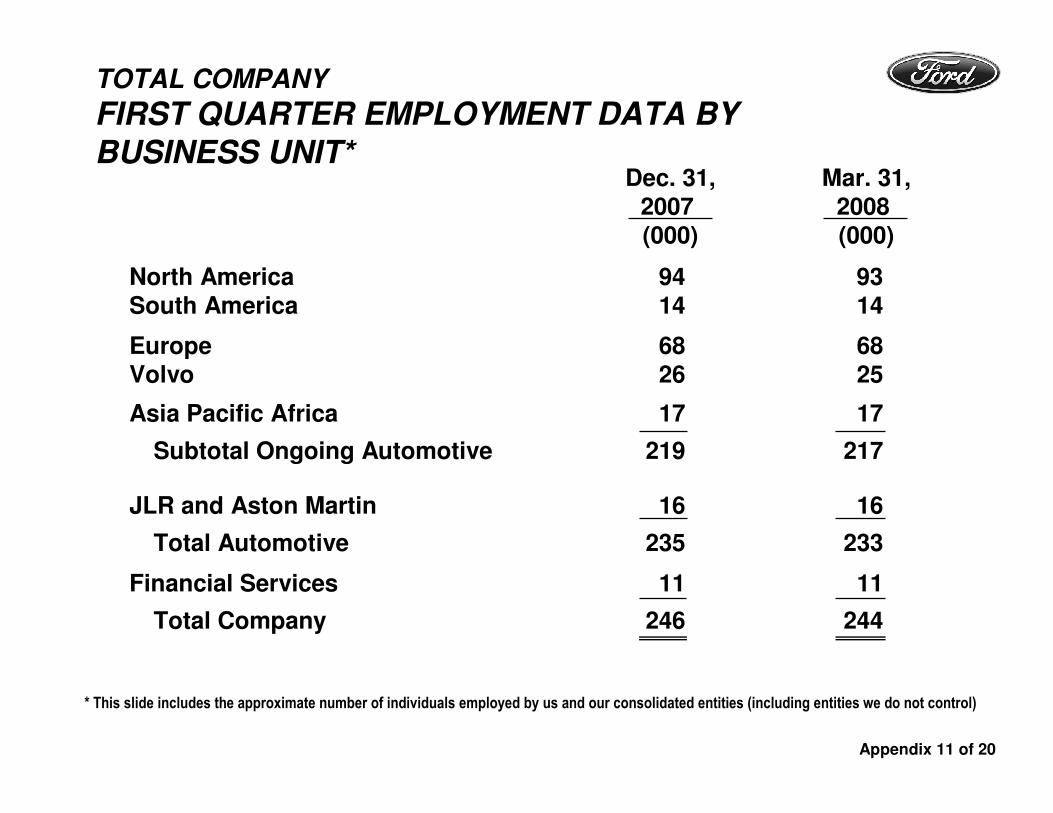
TOTAL COMPANY
FIRST QUARTER EMPLOYMENT DATA BY
BUSINESS UNIT*
Appendix 11 of 20
* This slide includes the approximate number of individuals employed by us and our consolidated entities (including entities we do not control)
Dec. 31,2007 (000)
Mar. 31,2008 (000)
North America 94 93South America 14 14
Europe 68 68Volvo 26 25
Asia Pacific Africa 17 17
Subtotal Ongoing Automotive 219 217
JLR and Aston Martin 16 16
Total Automotive 235 233
Financial Services 11 11
Total Company 246 244

AUTOMOTIVE SECTOR -- FORD NORTH AMERICA
PERSONNEL LEVELS FROM YEAR-END 2005
* Excludes Supplemental Replacement Personnel** Primarily entities that we do not control but are consolidated under FIN46 Appendix 12 of 20
Salaried 35,600 32,400 24,300 24,300
Hourly
- Manufacturing / Other 86,200 78,900 58,600 58,300
- ACH* 13,900 11,100 6,100 6,000
Total Hourly 100,100 90,000 64,700 64,300
Subtotal 135,700 122,400 89,000 88,600
Dealership Personnel** 7,000 5,700 4,600 4,400
Total 142,700 128,100 93,600 93,000
Dec. 31,2005
Dec. 31,2006
Dec. 31,2007
March 31,2008

AUTOMOTIVE SECTOR
2008 FIRST QUARTER MARKET RESULTS
U.S.Industry SAAR (Mils.) 15.6 (1.4) Market Share (Pct.)- Ford and Lincoln Mercury 15.0% (0.1) Pts.- Volvo 0.7 0
Total U.S. Market Share 15.7% (0.1) Pts.
Memo: Jaguar Land Rover 0.3% 0 Pts.
EuropeIndustry SAAR (Mils.) 18.0 0Market Share (Pct.)*- Ford 8.9% (0.2) Pts.
- Volvo 1.4 (0.1)Total Europe Market Share 10.3% (0.3) Pts.
Memo: Jaguar Land Rover 0.8% (0.1) Pts.
Other RegionsFord Brand Market Share (Pct.)- South America** 9.5% (1.6) Pts.- Asia Pacific Africa*** 2.0 (0.1)
* European market share for Ford Europe, Volvo, and Jaguar Land Rover is based, in part, on estimated vehicle registrations for our19 major European markets
** South American market share is based, in part, on estimated vehicle registrations for our six major markets in that region
*** Asia Pacific Africa market share is based, in part, on estimated vehicle sales for our twelve major markets in that region Appendix 13 of 20
AbsoluteB / (W)2007
First Quarter

AUTOMOTIVE SECTOR
COSTS AND EXPENSES
Total Costs and Expenses* $38,564 $ 226
Select Cost Items:
Depreciation and Amortization
- Depreciation $ 744 $ 156
- Amortization -- Special Tools 766 108
Total Depreciation / Amortization $ 1,510 $ 264
Postretirement Expense $ 600 $ 100
* Includes Jaguar Land Rover
Appendix 14 of 20
Amount(Mils.)
B / (W)First Qtr.2007(Mils.)
First Quarter 2008

AUTOMOTIVE SECTOR
GROSS CASH RECONCILIATION TO GAAP
Cash and Cash Equivalents $20.7 $18.7 $(2.0)
Marketable Securities 2.0 6.6 4.6
Loaned Securities 10.3 6.7 (3.6)
Total Cash / Marketable and Loaned Securities $33.0 $32.0 $(1.0)
Securities-In-Transit (0.3) (0.7) (0.4)
Short-Term VEBA Assets* 1.9 - (1.9)
UAW-Ford Temporary Asset Account - (2.6) (2.6)
Gross Cash $34.6 $28.7 $(5.9)
* Historically, amounts accessible within 18 months; short-term VEBA is no longer reported within gross cash as of January 1, 2008,
consistent with our new UAW VEBA agreement (which is subject to court approval)
Appendix 15 of 20
March 31, 2008B / (W)
Dec. 31, 2007(Bils.)
March 31,2008(Bils.)
Dec. 31,2007(Bils.)

AUTOMOTIVE SECTOR
GAAP RECONCILIATION OF
OPERATING-RELATED CASH FLOWS
Cash Flows from Operating Activities of Continuing Operations $ 0.7 $(0.8)
Items Included in Operating-Related Cash Flows- Capital Expenditures (1.4) (0.1)- Net Transactions Between Automotive and
Financial Services Sector (0.7) (0.2)- Net Cash Flows from Non-Designated Derivatives 0.3 0.1
Items Not Included in Operating-Related Cash Flows- Cash Impact of Jobs Bank Benefits & Separation Programs 0.1 (1.1)- Net (Sales) / Purchases of Trading Securities - (0.8)- Pension Contributions 0.6 (0.3)- VEBA Cash Flows -- Net Reimbursement for Benefits Paid - -- Tax Refunds and Tax Payments from Affiliates (0.9) 1.1- Other (0.2) (0.5)
Operating-Related Cash Flows $(1.5) $(2.6)
* 2008 excludes Jaguar Land Rover and 2007 includes Jaguar Land RoverAppendix 16 of 20
Amount*(Bils.)
First Quarter 2008O / (U)
First Quarter2007(Bils.)

Key Metrics*Pre-Tax Profits (Mils.) First Quarter
Receivables (Bils.)On-Balance Sheet $135 $141Managed 146 146Charge-Offs (Mils.)On-Balance Sheet $105 $227Managed 123 242Loss-to-Receivables RatioOn-Balance Sheet 0.32% 0.65%Managed- U.S. Retail and Lease 0.50 1.07- Worldwide Total 0.34 0.66Allow. for Credit LossesWorldwide Amount (Bils.) $ 1.0 $ 1.2Pct. Of EOP Receivables 0.76% 0.84%Leverage (To 1)Financial Statement 11.2 10.2Managed 11.1 9.4Dividend / Distribution (Bils.) $ 0 $ 0
Net Income (Mils.) $193 $ 24
2007 2008
First Quarter2007
First Quarter2008
* See Appendix for calculation, definitions and reconciliation to GAAP** Market valuation adjustments from derivatives
FINANCIAL SERVICES SECTOR
FORD CREDIT RESULTS AND METRICS --2008 FIRST QUARTER
$293
$36
SFAS 133** (Mils.) $(36) $(159)Pre-Tax Profits Excl.SFAS 133** (Mils.) 329 195
$(257)
Appendix 17 of 20

FORD CREDIT KEY METRIC DEFINITIONS
In addition to evaluating Ford Credit’s financial performance on a GAAP financial statement basis, Ford Credit management also uses other criteria, some of which were previously disclosed in this presentation and are defined below. Information about the impact of on-balance sheet securitization is also included below:
Managed Receivables -- receivables reported on Ford Credit’s balance sheet, excluding unearned interest supplements related to finance receivables, and receivables Ford Credit sold in off-balance sheet securitizations and continues to service
Serviced Receivables -- includes managed receivables and receivables Ford Credit sold in whole-loan sale transactions (i.e., receivables for which Ford Credit has no continuing exposure or risk of loss)
Charge-offs on Managed Receivables -- charge-offs associated with receivables reported on Ford Credit’s balance sheet plus charge-offs associated with receivables Ford Credit sold in off-balance sheet securitizations and continues to service
Equity -- shareholder’s interest and historical stockholder’s equity reported on Ford Credit’s balance sheet
Impact of On-Balance Sheet Securitization -- finance receivables (retail and wholesale) and net investment in operating leases reported on Ford Credit's balance sheet include assets included in securitizations that do not qualify for accounting sale treatment. These assets are available only for repayment of the debt or other obligations issued or arising in the securitization transactions; they are not available to pay the other obligations of Ford Credit or the claims of Ford Credit's other creditors. Debt reported on Ford Credit's balance sheet includes obligations issued or arising in securitizations that are payable only out of collections on the underlying securitized assets and related enhancements
Appendix 18 of 20

FINANCIAL SERVICES SECTOR
FORD CREDIT RATIO DEFINITIONSIn addition to evaluating Ford Credit’s financial performance on a GAAP financial statement basis, Ford Credit management also uses other criteria, some of which were previously disclosed in this presentation and are defined below:
Leverage:
Total Debt- Financial Statement Leverage =
Equity
Total Debt
SecuritizedOff-Balance
SheetReceivables
Cash, CashEquivalents &MarketableSecurities*
Adjustments forHedge Accountingon Total Debt**
Equity MinorityInterest
Adjustments for Hedge Accounting on Equity**
- Managed Leverage + - - -=
+ -
RetainedInterest inSecuritizedOff-Balance
SheetReceivables
Charge-offs=
Average ReceivablesLoss-to-Receivables Ratio
* Excludes marketable securities related to insurance activities** Primarily related to market valuation adjustments from derivatives due to movements in interest rates
Appendix 19 of 20
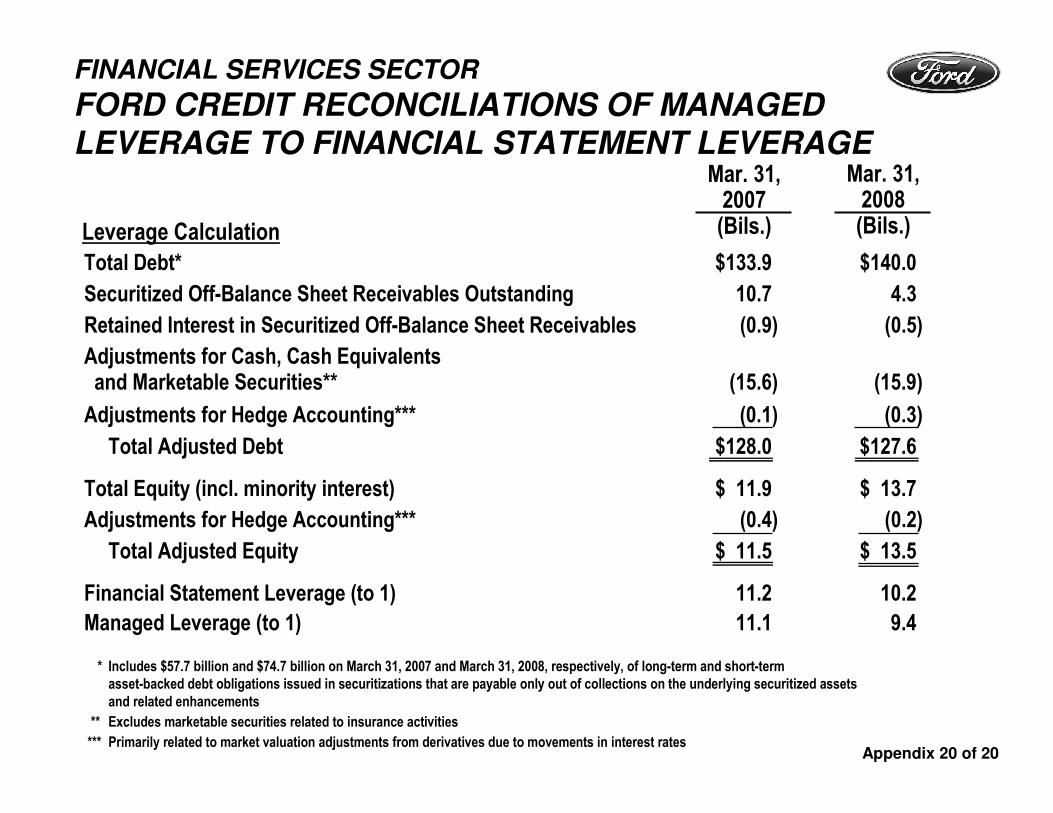
Total Debt* $133.9 $140.0
Securitized Off-Balance Sheet Receivables Outstanding 10.7 4.3
Retained Interest in Securitized Off-Balance Sheet Receivables (0.9) (0.5)
Adjustments for Cash, Cash Equivalents and Marketable Securities** (15.6) (15.9)
Adjustments for Hedge Accounting*** (0.1) (0.3)
Total Adjusted Debt $128.0 $127.6
Total Equity (incl. minority interest) $ 11.9 $ 13.7
Adjustments for Hedge Accounting*** (0.4) (0.2)
Total Adjusted Equity $ 11.5 $ 13.5
Financial Statement Leverage (to 1) 11.2 10.2
Managed Leverage (to 1) 11.1 9.4
* Includes $57.7 billion and $74.7 billion on March 31, 2007 and March 31, 2008, respectively, of long-term and short-termasset-backed debt obligations issued in securitizations that are payable only out of collections on the underlying securitized assetsand related enhancements
** Excludes marketable securities related to insurance activities
*** Primarily related to market valuation adjustments from derivatives due to movements in interest rates
Mar. 31,2008(Bils.)Leverage Calculation
Mar. 31,2007(Bils.)
FINANCIAL SERVICES SECTOR
FORD CREDIT RECONCILIATIONS OF MANAGED
LEVERAGE TO FINANCIAL STATEMENT LEVERAGE
Appendix 20 of 20