forecasting wind energy costs & cost drivers · forecasting wind energy costs and cost drivers...
TRANSCRIPT
The Views of the World’s Leading Experts
FORECASTING WIND ENERGY COSTS & COST DRIVERS
June 2016 | IEA Wind Task 26

LBNL- 1005717
Forecasting Wind Energy Costs
and Cost Drivers:
The Views of the World’s Leading Experts
Authors: Ryan Wiser,1 Karen Jenni,2 Joachim Seel,1 Erin Baker,3 Maureen Hand,4 Eric Lantz,4 Aaron Smith4 1 Lawrence Berkeley National Laboratory 2 Insight Decisions, LLC 3 University of Massachusetts—Amherst 4 National Renewable Energy Laboratory
Contributors: Volker Berkhout, Aidan Duffy, Brendan Cleary, Roberto Lacal-Arántegui, Leif Husabø, Jørgen Lemming, Silke Lüers, Arjan Mast, Walt Musial, Bob Prinsen, Klaus Skytte, Gavin Smart, Brian Smith, Iver Bakken Sperstad, Paul Veers, Aisma Vitina, David Weir
June 2016
This work was supported by the Wind and Water Power Technologies Office of the U.S. Department of Energy’s Office of Energy Efficiency and Renewable Energy under Lawrence Berkeley National Laboratory Contract No. DE-AC02-05CH11231, and National Renewable Energy Laboratory Contract No. DE-AC36-09GO28308.

Disclaimers
This document was prepared as an account of work sponsored by the United States Government. While this
document is believed to contain correct information, neither the United States Government nor any agency
thereof, nor The Regents of the University of California, nor any of their employees, makes any warranty,
express or implied, or assumes any legal responsibility for the accuracy, completeness, or usefulness of any
information, apparatus, product, or process disclosed, or represents that its use would not infringe privately
owned rights. Reference herein to any specific commercial product, process, or service by its trade name,
trademark, manufacturer, or otherwise, does not necessarily constitute or imply its endorsement,
recommendation, or favoring by the United States Government or any agency thereof, or The Regents of the
University of California. The views and opinions of authors expressed herein do not necessarily state or
reflect those of the United States Government or any agency thereof, or The Regents of the University of
California.
Ernest Orlando Lawrence Berkeley National Laboratory is an equal opportunity employer.
The International Energy Agency Implementing Agreement for Co-operation in the Research, Development,
and Deployment of Wind Energy Systems, also known as IEA Wind, functions within a framework created by
the International Energy Agency (IEA). Views, findings and publications of IEA Wind do not necessarily
represent the views or policies of the IEA Secretariat or of all its individual member countries. IEA Wind is
part of IEA’s Technology Collaboration Programme (TCP).
Forecasting Wind Energy Costs and Cost Drivers │i
Acknowledgements
This global elicitation survey of wind energy experts would not have been possible without the
assistance and support of many individuals and organizations.
Funders: This report was sponsored by the International Energy Agency (IEA) Wind Implementing
Agreement for Cooperation in the Research, Development, and Deployment of Wind Energy Systems
(IEA Wind), and it was funded by the respective entities in the participating countries of Task 26, The
Cost of Wind Energy, including Denmark, Germany, Ireland, Netherlands, Norway, Sweden, United
Kingdom, the European Commission, and the United States. We thank the IEA Wind Executive
Committee for supporting this work, particularly those members who sponsor the corresponding
research in each of the participating countries. Specifically, this effort would not have been possible
without the funding of the Wind and Water Power Technologies Office of the U.S. Department of
Energy (DOE) under Lawrence Berkeley National Laboratory (LBNL) Contract No. DE-AC02-05CH11231,
and National Renewable Energy Laboratory (NREL) Contract No. DE-AC36-09GO28308. Thanks
especially to Jose Zayas, Patrick Gilman, Mark Higgins, Richard Tusing, and Daniel Beals of the U.S. DOE.
Survey Respondents: This work would not have been possible without the gracious contributions of the
experts who chose to participate in the survey—we list those individuals, and their affiliated
organizations, in Appendix A. For assistance in identifying possible survey respondents, we thank the
members of IEA Wind Task 26 and a wide variety of others: American Wind Energy Association (Michael
Goggin, Hannah Hunt), BVG Associates (Bruce Valpy), Danish Wind Industry Association (Martin Risum
Bøndergaard), IEA Wind Executive Committee, Denmark Technical University (Peter Hauge Madsen,
Peter Hjuler Jensen), Energy Centre of Netherlands (Bernard Bulder), European Wind Energy
Association (Andrew Ho, Giorgio Corbetta), Global Wind Energy Council (Steve Sawyer), and
International Renewable Energy Agency (Michael Taylor).
Project Execution: Earlier versions of the survey were reviewed by members of IEA Wind Task 26 on
several occasions, as well as a select group of other wind energy experts. Additionally, for participating
in an expert workshop and early pilot of the survey, and providing comments therein, we thank: Aaron
Barr (MAKE), Daniel Beals (DOE), Michael Finger (EDP Renewables), Mark Higgins (DOE), Ben Quinn
(Vestas), Walt Musial (NREL), Bruce Valpy (BVG), Paul Veers (NREL), Emily Williams (Altenex), and Adam
Wilson (formerly NREL). Ultimately, the survey was implemented online via a platform designed by
Near Zero, and we greatly appreciate Near Zero’s many efforts to creatively implement aspects of our
complex design: thanks especially to Steve Davis, Seth Nickell, and Karen Fries. We also thank Claudine
Custodio (formerly of LBNL) for assistance with survey design and Naim Darghouth (LBNL) for assistance
with the literature review of future cost reduction estimates.
Review Comments and Editing: For reviewing earlier versions of this manuscript, we thank: Volker
Berkhout (Fraunhofer IWES), Robert Brückmann (Eclareon), Bernard Chabot (consultant), Steve Sawyer
(GWEC), Iver Bakken Sperstad (SINTEF Energy Research), Bruce Valpy (BVG Associates), Aisma Vitina (EA
Energy Analyses), and Carolin Wiegand (Fraunhofer IWES). We appreciate Jarett Zuboy’s assistance in
improving the text of this report, and Ben Paulos (PaulosAnalysis) for communications support.
Forecasting Wind Energy Costs and Cost Drivers │ii
Table of Contents
Acknowledgements ........................................................................................................................................ i
Table of Contents .......................................................................................................................................... ii
Executive Summary ...................................................................................................................................... iii
1. Introduction ............................................................................................................................................ 1
2. The Expert Elicitation Survey .................................................................................................................. 2
2.1. Review of Expert Elicitation and other Methods to Assess Future Costs ...................................... 2
2.2. Scope of Expert Assessment: What Were We Asking? .................................................................. 4
2.3. Application of Expert Elicitation Principles .................................................................................... 7
2.4. Survey Design, Testing, and Implementation ................................................................................ 9
2.5. Selection and Response of Experts ................................................................................................ 9
3. Summary of Elicitation Results ............................................................................................................. 11
3.1. Forecasts for LCOE Reduction ...................................................................................................... 12
3.2. Baseline Values for 2014 .............................................................................................................. 18
3.3. Sources of LCOE Reduction: CapEx, OpEx, Capacity Factor, Lifetime, WACC .............................. 20
3.4. Expectations for Wind Turbine Size ............................................................................................. 24
3.5. Future Wind Technology, Market, and Other Changes Affecting Costs ...................................... 27
3.6. Broad Market, Policy, and R&D Conditions Enabling Low LCOE .................................................. 32
3.7. Comparison of Expert-Specified LCOE Reduction to Broader Literature ..................................... 34
4. Conclusions ........................................................................................................................................... 39
References .................................................................................................................................................. 42
Appendix A. Survey Respondents ............................................................................................................... 47
Appendix B. Additional Survey Results ....................................................................................................... 51
Appendix C. Documents Included in Forecast Comparison ........................................................................ 74
Forecasting Wind Energy Costs and Cost Drivers │iii
Executive Summary
This report summarizes the results of an expert elicitation survey of 163 of the world’s foremost wind
energy experts, aimed at better understanding future wind energy costs and potential technology
advancement. We specifically sought to gain insight on the possible magnitude of future cost
reductions, the sources of those reductions, and the enabling conditions needed to realize continued
innovation and lower costs. In implementing what may be the largest single elicitation ever performed
on an energy technology in terms of expert participation, we sought to complement other tools for
evaluating cost-reduction potential, including learning curves, engineering assessments, and other
means of synthesizing expert knowledge. Wind applications covered by the survey include onshore,
fixed-bottom offshore, and floating offshore wind. Ultimately, the study is intended to inform policy
and planning decisions, research and development decisions, and industry investment and strategy
development while also improving the representation of wind energy in energy-sector planning models.
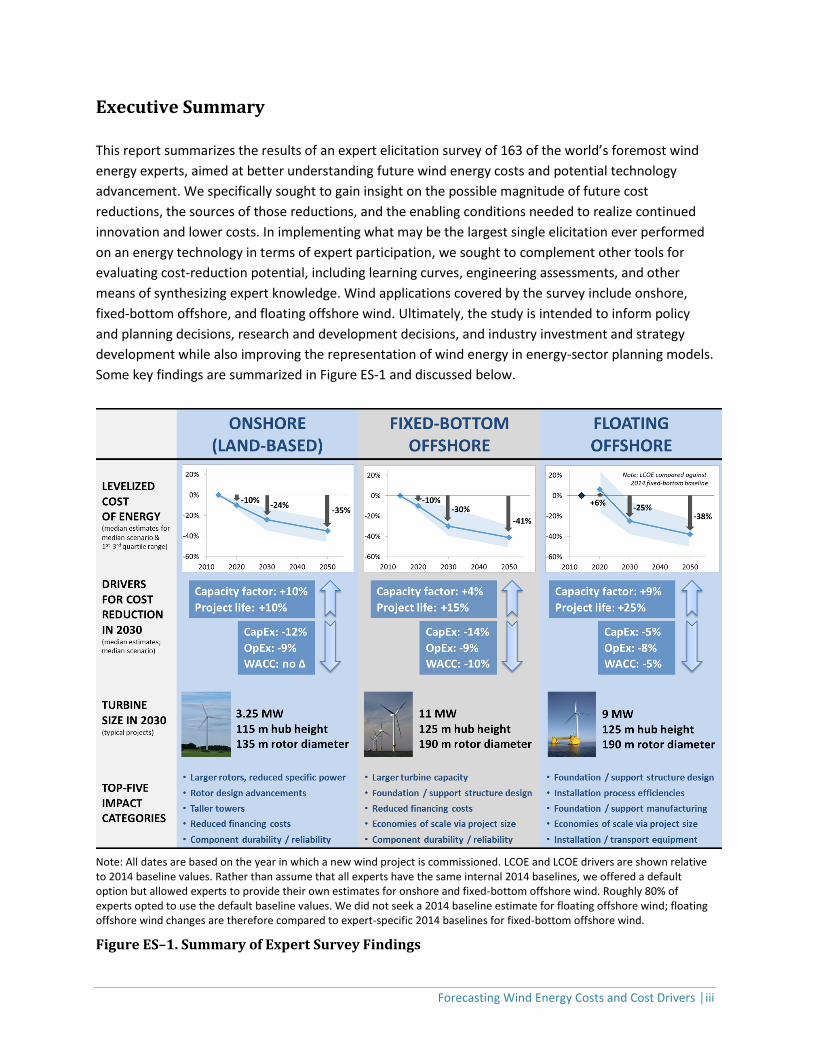
Some key findings are summarized in Figure ES-1 and discussed below.
Note: All dates are based on the year in which a new wind project is commissioned. LCOE and LCOE drivers are shown relative to 2014 baseline values. Rather than assume that all experts have the same internal 2014 baselines, we offered a default option but allowed experts to provide their own estimates for onshore and fixed-bottom offshore wind. Roughly 80% of experts opted to use the default baseline values. We did not seek a 2014 baseline estimate for floating offshore wind; floating offshore wind changes are therefore compared to expert-specific 2014 baselines for fixed-bottom offshore wind.
Figure ES–1. Summary of Expert Survey Findings
Forecasting Wind Energy Costs and Cost Drivers │iv
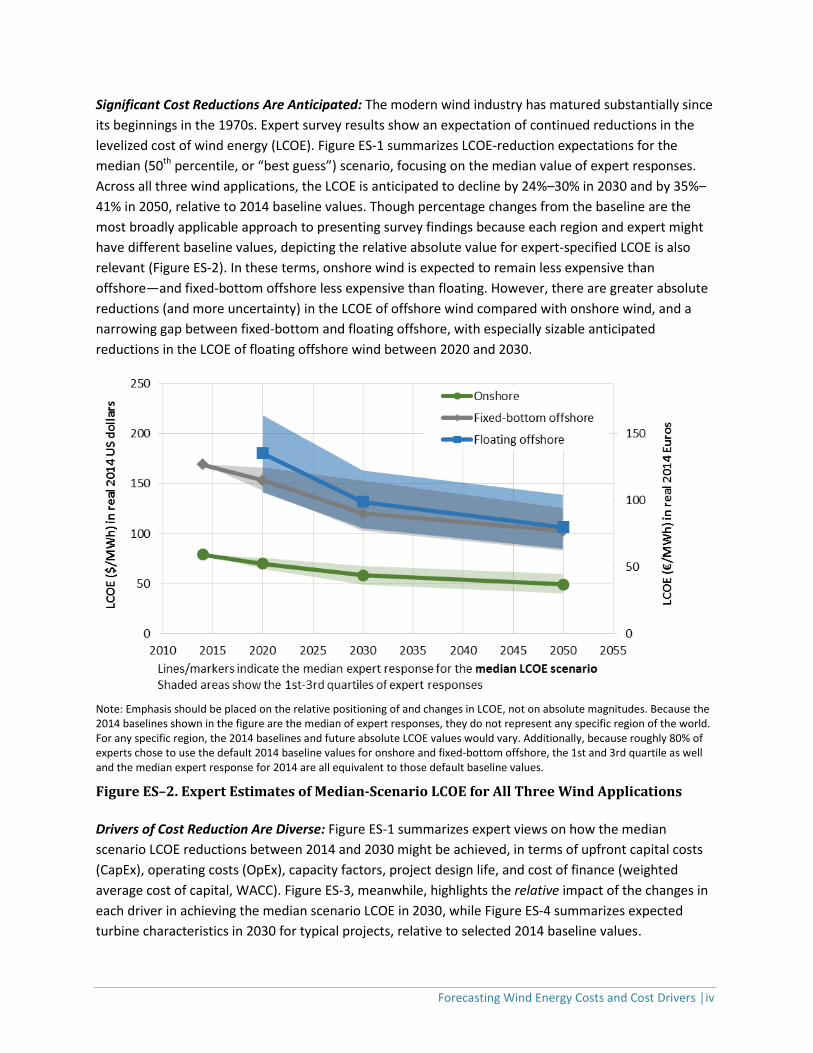
Significant Cost Reductions Are Anticipated: The modern wind industry has matured substantially since
its beginnings in the 1970s. Expert survey results show an expectation of continued reductions in the
levelized cost of wind energy (LCOE). Figure ES-1 summarizes LCOE-reduction expectations for the
median (50th percentile, or “best guess”) scenario, focusing on the median value of expert responses.
Across all three wind applications, the LCOE is anticipated to decline by 24%–30% in 2030 and by 35%–
41% in 2050, relative to 2014 baseline values. Though percentage changes from the baseline are the
most broadly applicable approach to presenting survey findings because each region and expert might
have different baseline values, depicting the relative absolute value for expert-specified LCOE is also
relevant (Figure ES-2). In these terms, onshore wind is expected to remain less expensive than
offshore—and fixed-bottom offshore less expensive than floating. However, there are greater absolute
reductions (and more uncertainty) in the LCOE of offshore wind compared with onshore wind, and a
narrowing gap between fixed-bottom and floating offshore, with especially sizable anticipated
reductions in the LCOE of floating offshore wind between 2020 and 2030.
Note: Emphasis should be placed on the relative positioning of and changes in LCOE, not on absolute magnitudes. Because the 2014 baselines shown in the figure are the median of expert responses, they do not represent any specific region of the world. For any specific region, the 2014 baselines and future absolute LCOE values would vary. Additionally, because roughly 80% of experts chose to use the default 2014 baseline values for onshore and fixed-bottom offshore, the 1st and 3rd quartile as well and the median expert response for 2014 are all equivalent to those default baseline values.
Figure ES–2. Expert Estimates of Median-Scenario LCOE for All Three Wind Applications
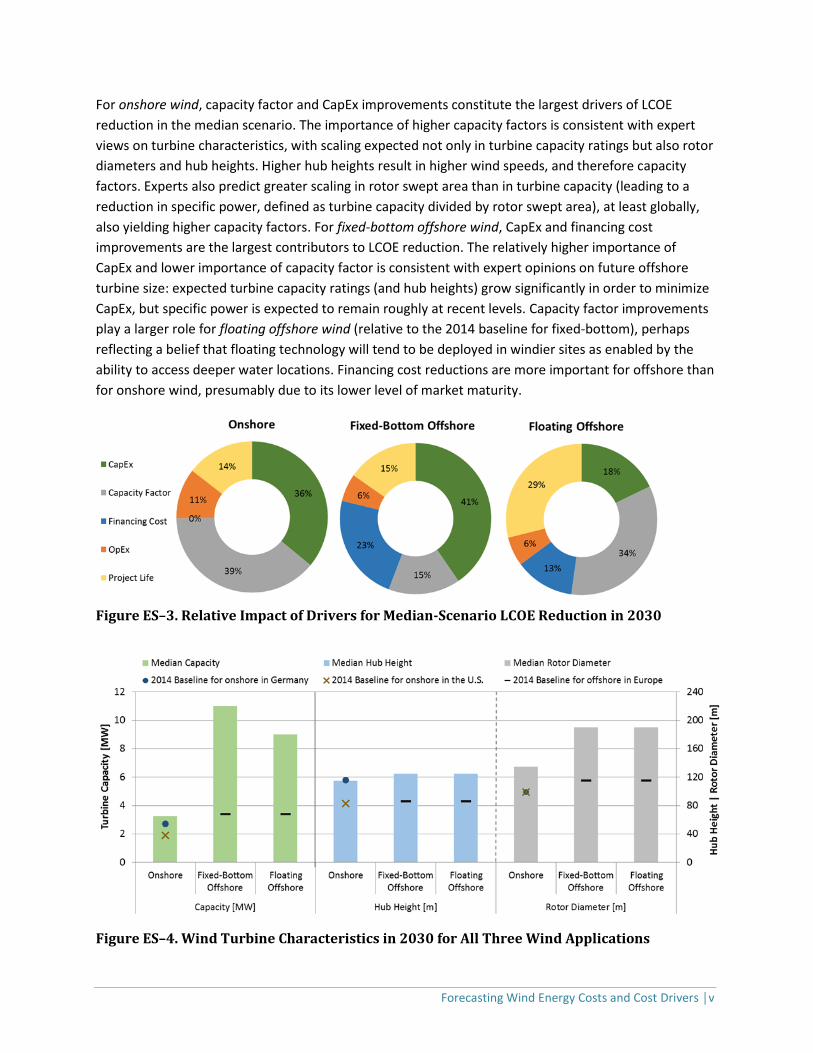
Drivers of Cost Reduction Are Diverse: Figure ES-1 summarizes expert views on how the median
scenario LCOE reductions between 2014 and 2030 might be achieved, in terms of upfront capital costs
(CapEx), operating costs (OpEx), capacity factors, project design life, and cost of finance (weighted
average cost of capital, WACC). Figure ES-3, meanwhile, highlights the relative impact of the changes in
each driver in achieving the median scenario LCOE in 2030, while Figure ES-4 summarizes expected
turbine characteristics in 2030 for typical projects, relative to selected 2014 baseline values.
Forecasting Wind Energy Costs and Cost Drivers │v
For onshore wind, capacity factor and CapEx improvements constitute the largest drivers of LCOE
reduction in the median scenario. The importance of higher capacity factors is consistent with expert
views on turbine characteristics, with scaling expected not only in turbine capacity ratings but also rotor
diameters and hub heights. Higher hub heights result in higher wind speeds, and therefore capacity
factors. Experts also predict greater scaling in rotor swept area than in turbine capacity (leading to a
reduction in specific power, defined as turbine capacity divided by rotor swept area), at least globally,
also yielding higher capacity factors. For fixed-bottom offshore wind, CapEx and financing cost
improvements are the largest contributors to LCOE reduction. The relatively higher importance of
CapEx and lower importance of capacity factor is consistent with expert opinions on future offshore
turbine size: expected turbine capacity ratings (and hub heights) grow significantly in order to minimize
CapEx, but specific power is expected to remain roughly at recent levels. Capacity factor improvements
play a larger role for floating offshore wind (relative to the 2014 baseline for fixed-bottom), perhaps
reflecting a belief that floating technology will tend to be deployed in windier sites as enabled by the
ability to access deeper water locations. Financing cost reductions are more important for offshore than
for onshore wind, presumably due to its lower level of market maturity.
Figure ES–3. Relative Impact of Drivers for Median-Scenario LCOE Reduction in 2030
Figure ES–4. Wind Turbine Characteristics in 2030 for All Three Wind Applications
Forecasting Wind Energy Costs and Cost Drivers │vi
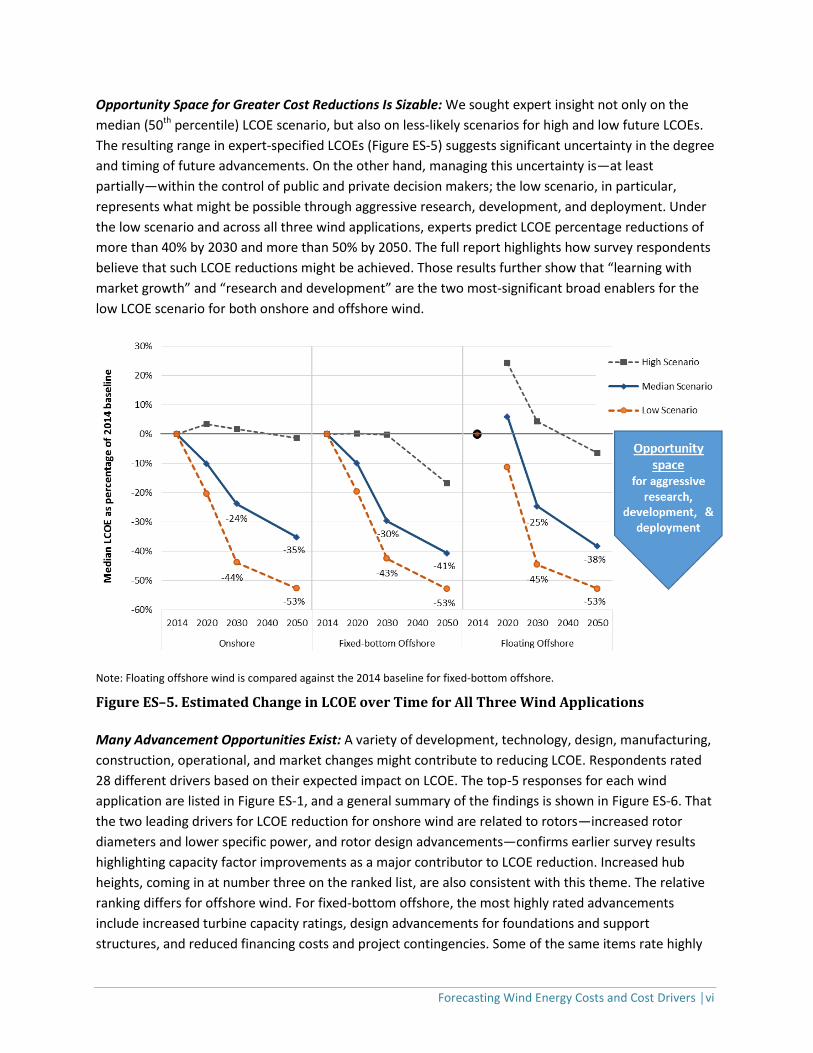
Opportunity Space for Greater Cost Reductions Is Sizable: We sought expert insight not only on the
median (50th percentile) LCOE scenario, but also on less-likely scenarios for high and low future LCOEs.
The resulting range in expert-specified LCOEs (Figure ES-5) suggests significant uncertainty in the degree
and timing of future advancements. On the other hand, managing this uncertainty is—at least
partially—within the control of public and private decision makers; the low scenario, in particular,
represents what might be possible through aggressive research, development, and deployment. Under
the low scenario and across all three wind applications, experts predict LCOE percentage reductions of
more than 40% by 2030 and more than 50% by 2050. The full report highlights how survey respondents
believe that such LCOE reductions might be achieved. Those results further show that “learning with
market growth” and “research and development” are the two most-significant broad enablers for the
low LCOE scenario for both onshore and offshore wind.
Note: Floating offshore wind is compared against the 2014 baseline for fixed-bottom offshore.
Figure ES–5. Estimated Change in LCOE over Time for All Three Wind Applications
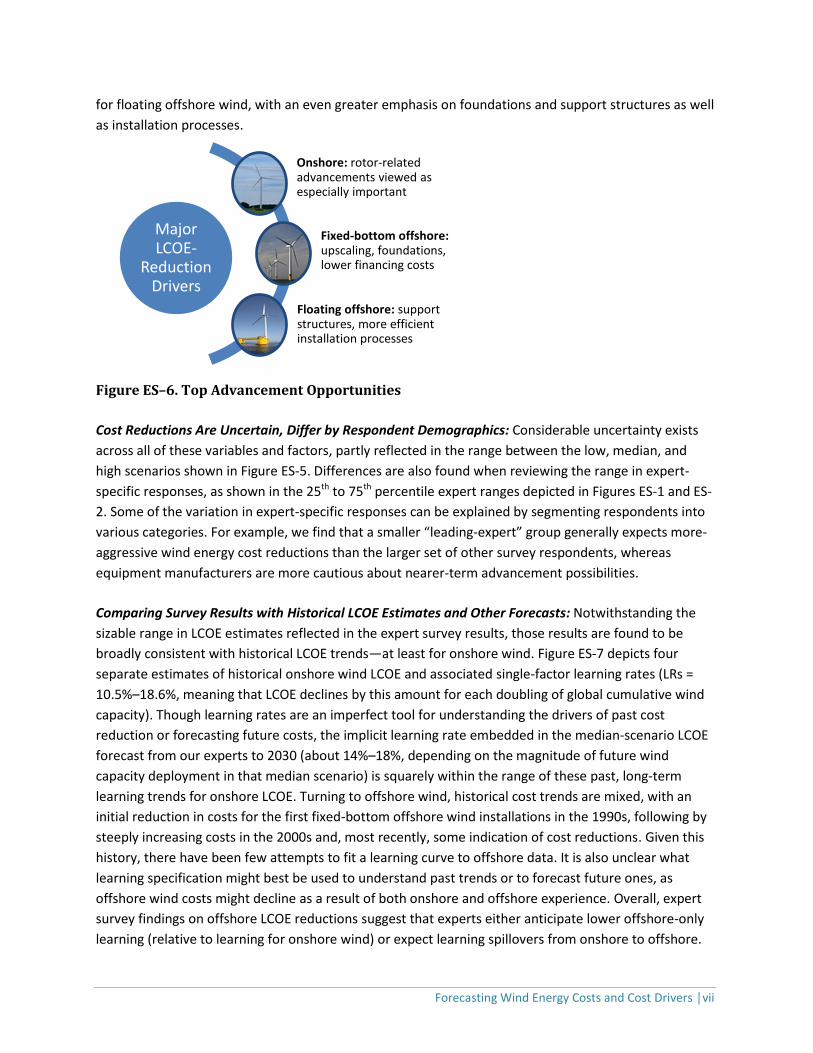
Many Advancement Opportunities Exist: A variety of development, technology, design, manufacturing,
construction, operational, and market changes might contribute to reducing LCOE. Respondents rated
28 different drivers based on their expected impact on LCOE. The top-5 responses for each wind
application are listed in Figure ES-1, and a general summary of the findings is shown in Figure ES-6. That
the two leading drivers for LCOE reduction for onshore wind are related to rotors—increased rotor
diameters and lower specific power, and rotor design advancements—confirms earlier survey results
highlighting capacity factor improvements as a major contributor to LCOE reduction. Increased hub
heights, coming in at number three on the ranked list, are also consistent with this theme. The relative
ranking differs for offshore wind. For fixed-bottom offshore, the most highly rated advancements
include increased turbine capacity ratings, design advancements for foundations and support
structures, and reduced financing costs and project contingencies. Some of the same items rate highly
Forecasting Wind Energy Costs and Cost Drivers │vii
for floating offshore wind, with an even greater emphasis on foundations and support structures as well
as installation processes.
Figure ES–6. Top Advancement Opportunities
Cost Reductions Are Uncertain, Differ by Respondent Demographics: Considerable uncertainty exists
across all of these variables and factors, partly reflected in the range between the low, median, and
high scenarios shown in Figure ES-5. Differences are also found when reviewing the range in expert-
specific responses, as shown in the 25th to 75th percentile expert ranges depicted in Figures ES-1 and ES-
2. Some of the variation in expert-specific responses can be explained by segmenting respondents into
various categories. For example, we find that a smaller “leading-expert” group generally expects more-
aggressive wind energy cost reductions than the larger set of other survey respondents, whereas
equipment manufacturers are more cautious about nearer-term advancement possibilities.
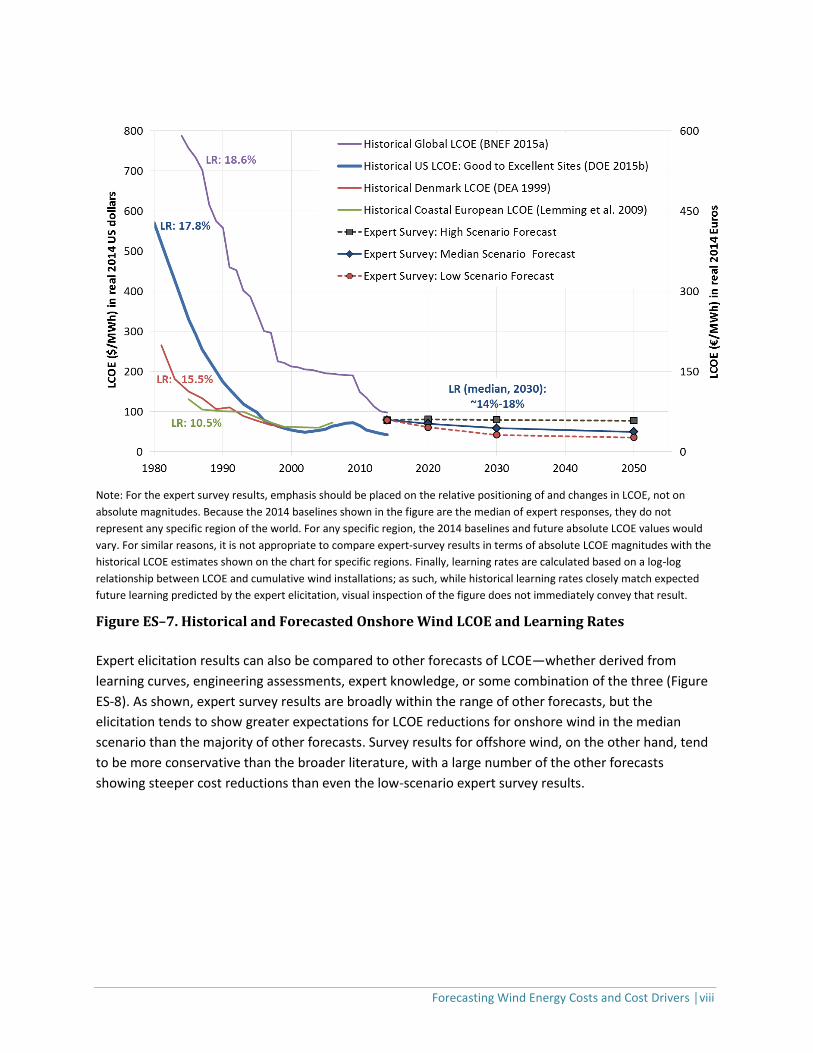
Comparing Survey Results with Historical LCOE Estimates and Other Forecasts: Notwithstanding the
sizable range in LCOE estimates reflected in the expert survey results, those results are found to be
broadly consistent with historical LCOE trends—at least for onshore wind. Figure ES-7 depicts four
separate estimates of historical onshore wind LCOE and associated single-factor learning rates (LRs =
10.5%–18.6%, meaning that LCOE declines by this amount for each doubling of global cumulative wind
capacity). Though learning rates are an imperfect tool for understanding the drivers of past cost
reduction or forecasting future costs, the implicit learning rate embedded in the median-scenario LCOE
forecast from our experts to 2030 (about 14%–18%, depending on the magnitude of future wind
capacity deployment in that median scenario) is squarely within the range of these past, long-term
learning trends for onshore LCOE. Turning to offshore wind, historical cost trends are mixed, with an
initial reduction in costs for the first fixed-bottom offshore wind installations in the 1990s, following by
steeply increasing costs in the 2000s and, most recently, some indication of cost reductions. Given this
history, there have been few attempts to fit a learning curve to offshore data. It is also unclear what
learning specification might best be used to understand past trends or to forecast future ones, as
offshore wind costs might decline as a result of both onshore and offshore experience. Overall, expert
survey findings on offshore LCOE reductions suggest that experts either anticipate lower offshore-only
learning (relative to learning for onshore wind) or expect learning spillovers from onshore to offshore.
Major LCOE-
Reduction Drivers
Onshore: rotor-related advancements viewed as especially important
Fixed-bottom offshore: upscaling, foundations, lower financing costs
Floating offshore: support structures, more efficient installation processes
Forecasting Wind Energy Costs and Cost Drivers │viii
Note: For the expert survey results, emphasis should be placed on the relative positioning of and changes in LCOE, not on
absolute magnitudes. Because the 2014 baselines shown in the figure are the median of expert responses, they do not
represent any specific region of the world. For any specific region, the 2014 baselines and future absolute LCOE values would
vary. For similar reasons, it is not appropriate to compare expert-survey results in terms of absolute LCOE magnitudes with the
historical LCOE estimates shown on the chart for specific regions. Finally, learning rates are calculated based on a log-log
relationship between LCOE and cumulative wind installations; as such, while historical learning rates closely match expected
future learning predicted by the expert elicitation, visual inspection of the figure does not immediately convey that result.
Figure ES–7. Historical and Forecasted Onshore Wind LCOE and Learning Rates
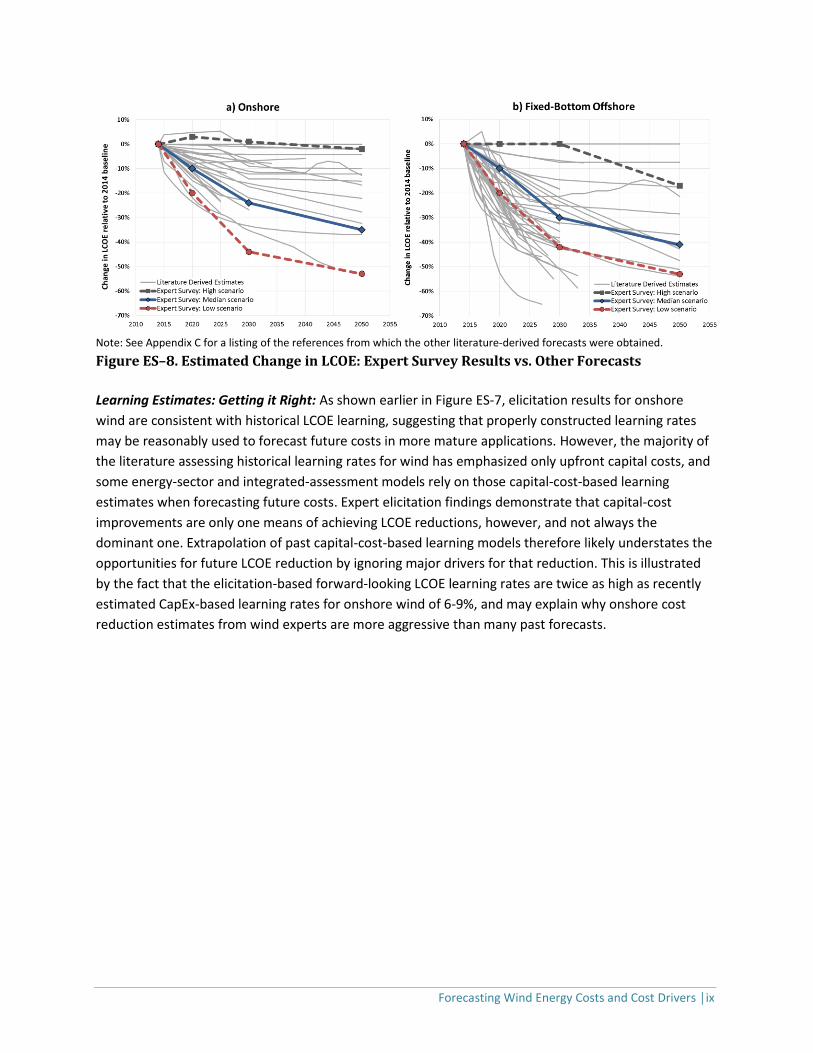
Expert elicitation results can also be compared to other forecasts of LCOE—whether derived from
learning curves, engineering assessments, expert knowledge, or some combination of the three (Figure
ES-8). As shown, expert survey results are broadly within the range of other forecasts, but the
elicitation tends to show greater expectations for LCOE reductions for onshore wind in the median
scenario than the majority of other forecasts. Survey results for offshore wind, on the other hand, tend
to be more conservative than the broader literature, with a large number of the other forecasts
showing steeper cost reductions than even the low-scenario expert survey results.
Forecasting Wind Energy Costs and Cost Drivers │ix
Note: See Appendix C for a listing of the references from which the other literature-derived forecasts were obtained.
Figure ES–8. Estimated Change in LCOE: Expert Survey Results vs. Other Forecasts
Learning Estimates: Getting it Right: As shown earlier in Figure ES-7, elicitation results for onshore
wind are consistent with historical LCOE learning, suggesting that properly constructed learning rates
may be reasonably used to forecast future costs in more mature applications. However, the majority of
the literature assessing historical learning rates for wind has emphasized only upfront capital costs, and
some energy-sector and integrated-assessment models rely on those capital-cost-based learning
estimates when forecasting future costs. Expert elicitation findings demonstrate that capital-cost
improvements are only one means of achieving LCOE reductions, however, and not always the
dominant one. Extrapolation of past capital-cost-based learning models therefore likely understates the
opportunities for future LCOE reduction by ignoring major drivers for that reduction. This is illustrated
by the fact that the elicitation-based forward-looking LCOE learning rates are twice as high as recently
estimated CapEx-based learning rates for onshore wind of 6-9%, and may explain why onshore cost
reduction estimates from wind experts are more aggressive than many past forecasts.
Forecasting Wind Energy Costs and Cost Drivers │1
1. Introduction
Wind energy supply has grown rapidly over the last decade, supported by a myriad of national and sub-
national energy policies and facilitated by technology advancements and related cost reductions (IEA
2013; GWEC 2015; IRENA 2015; REN21 2015). Though the vast majority of this expansion has occurred
onshore (>97%), offshore wind power deployment has also recently increased, especially in Europe. The
rising maturity of wind power technology suggests that wind energy might play a significant future role
in global electricity supply, perhaps especially in the context of efforts to reduce greenhouse gas
emissions (Wiser et al. 2011; IPCC 2014; GWEC 2014; Luderer et al. 2014; IEA 2015).
The long-term contribution that wind energy makes to global energy supply, and the degree to which
policy support is necessary to motivate higher levels of deployment, depends—in part—on the future
costs of both onshore and offshore wind. Those costs will be affected by technology advancements, as
impacted by private and public research and development (R&D), among other factors. Yet there
remains sizable uncertainty about both the degree to which costs will continue to decline and the
conditions that might drive greater cost reduction (Wiser et al. 2011; Lantz et al. 2012; DOE 2015a).
This report summarizes the results of an expert elicitation survey on future wind energy costs and
technology advancement possibilities. The research relies on expert knowledge to gain insight into the
possible magnitude of future wind energy cost reductions, and to identify the sources of future cost
reduction and the enabling conditions needed to realize continued innovation and lower costs. An
understanding of the potential for wind power costs to fall and the means by which future cost
reductions could be delivered can inform policy and planning decisions affecting wind power
deployment, R&D in the private and public sectors, and industry investment and strategy development.
Enhanced insight into future cost-reduction opportunities also supports improved representation of
wind energy technology in energy-sector modeling efforts.
Lawrence Berkeley National Laboratory and the National Renewable Energy Laboratory led the
gathering of data and insights through an online elicitation survey of a large sample of the world’s
foremost wind energy experts, under the auspices of the International Energy Agency (IEA) Wind
Implementing Agreement. The survey is global in scope—though with a focus on North America and
Europe—and covers onshore (land-based), fixed-bottom offshore, and floating offshore wind
technology. It emphasizes costs and associated drivers of cost changes in 2030, but with additional
markers in 2020 and 2050. This report summarizes the 163 survey responses received, in what may be
the largest single expert elicitation ever performed on an energy technology. Insights gained through
this survey can complement other tools for evaluating cost-reduction potential, including the use of
learning curves, engineering assessments, and less-formal means of synthesizing expert knowledge.
The remainder of this report is organized as follows. Chapter 2 introduces expert elicitation and
discusses the scope, design, and implementation of our assessment. Chapter 3 summarizes our core
results. Finally, Chapter 4 offers conclusions and discusses anticipated future work.
Forecasting Wind Energy Costs and Cost Drivers │2
2. The Expert Elicitation Survey
2.1. Review of Expert Elicitation and other Methods to Assess Future Costs
Though multiple approaches have been used to assess the past and future cost of wind energy
(discussed below), ours is one of the first publically available formal expert elicitation surveys with an
explicit focus on future wind energy costs and related technology advancements.
Expert elicitation is a tool used to develop estimates of unknown or uncertain quantities based on
careful assessment of the knowledge and beliefs of experts about those quantities (Morgan 2014).
Several options are available to a researcher who wishes to make such estimates: make projections
based on past data and trends, review existing literature and adopt projections made by others,
develop detailed models based on experience in related fields and apply them to create forecasts, and
so on. The expert elicitation approach is to carefully assess projections of the quantities of interest from
relevant subject-matter experts. It is often considered the best—or perhaps the only—way to develop
credible estimates when data are sparse or lacking, or when projections are sought for future
conditions that are very different from past conditions (Kotra et al. 1996; Meyer and Booker 2001).
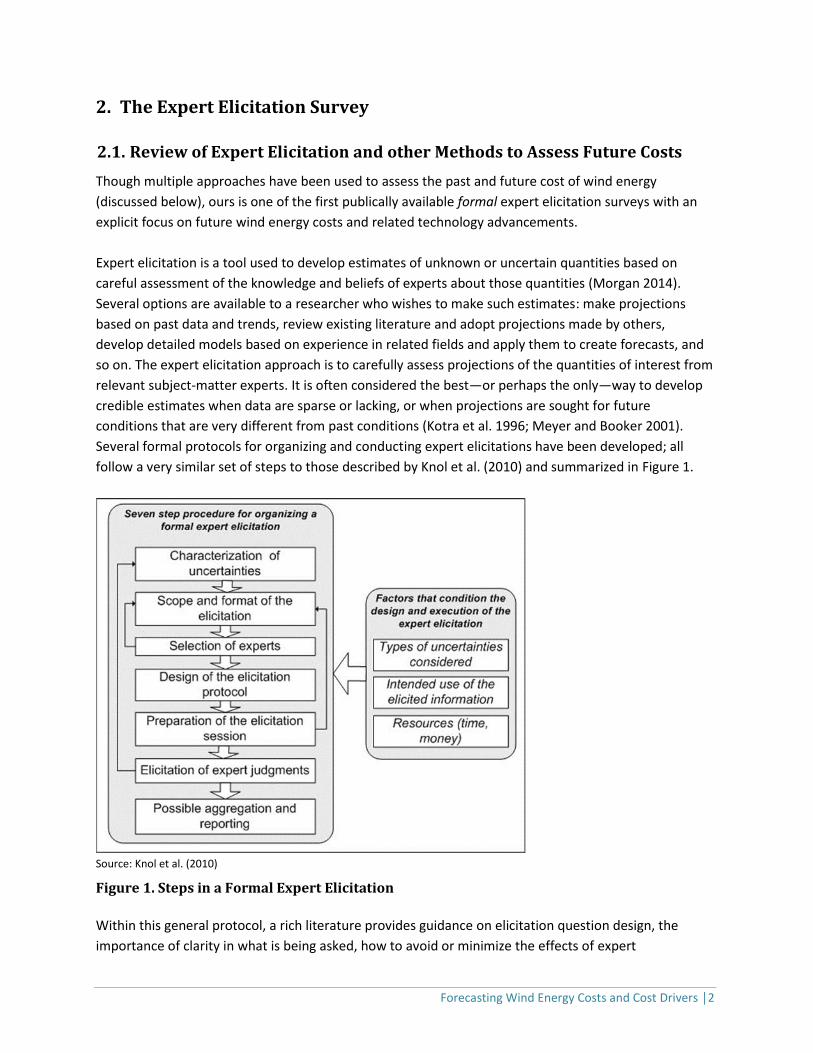
Several formal protocols for organizing and conducting expert elicitations have been developed; all
follow a very similar set of steps to those described by Knol et al. (2010) and summarized in Figure 1.
Source: Knol et al. (2010)
Figure 1. Steps in a Formal Expert Elicitation
Within this general protocol, a rich literature provides guidance on elicitation question design, the
importance of clarity in what is being asked, how to avoid or minimize the effects of expert
Forecasting Wind Energy Costs and Cost Drivers │3
motivational and cognitive biases, and the importance of providing feedback to experts and providing
opportunities for them to review and update their assessments (Hora 2007; Coppersmith et al. 2009;
Morgan 2014). Section 2.3 below describes how we applied these principles in our expert elicitation.
Expert elicitations have been widely used to support decision making in the private sector (Sharpe and
Keelin 1998) and in policy decisions (Hora and von Winterfeldt 1997). Their use is explicitly called for in
a review of the Intergovernmental Panel on Climate Change (InterAcademy Council 2010) and implicitly
called for in a National Academies review of the U.S. Department of Energy’s Applied Energy R&D
programs (NRC 2007). Within the energy community, expert elicitation is increasingly common as a tool
for making estimates of the future costs of energy technologies under different possible future
scenarios. Baker et al. (2015), for example, review nearly 20 such elicitations conducted over the past
decade, including studies focused on carbon capture and storage, solar, nuclear, biomass, and storage
technologies. Gillenwater (2013) uses expert elicitation to explore wind investment decisions, and
Kempton et al. (2016) use elicitation to understand future offshore wind costs in one region of the
United States, but formal elicitation procedures have not yet been widely applied to wind energy costs
and related technology advancements. Verdolini et al. (2016) provide a comprehensive review of
energy technology expert elicitation studies.
Expert elicitation is not without weaknesses—in general and when applied to wind energy. Expert
responses may be affected by the design of the data-collection instrument, by the individuals selected
to submit their views, by the behavior of the interviewers (for in-person elicitation), and by features of
the questionnaire or web-based instrument. Notably, it is impossible to entirely eliminate—or even to
fully test for—the possibility of motivational or cognitive biases. Those individuals who are considered
subject-matter experts on wind energy, for example, might have a tendency to be optimistic about the
future of the sector. On the other hand, experts sometimes underestimate the possibility of
technological change, as has been the case with solar energy (Verdolini et al. 2016). Regardless of the
possible limitations, though, when implemented well, expert elicitation can provide valuable insights on
the views of subject-matter experts, complementing other tools to assess cost-reduction potential,
including learning curves, engineering assessments, and less-formal means of synthesizing expert
knowledge (Lantz et al. 2012). These other methods have been used regularly—both individually and in
combination—to assess potential future wind energy cost reductions:
Learning curves have a long history within the wind sector (see Wiser et al. 2011; Lindman and
Söderholm 2012; Rubin et al. 2015), but they have been criticized for simplifying the many causal
mechanisms that lead to cost reduction (Ferioli et al. 2009; Mukora et al. 2009; Ek and Söderholm
2010; Junginger et al. 2010; Yeh and Rubin 2012; Witajewski-Baltvilks et al. 2015). Further, few
published studies focus on the most important metric of wind energy costs, the levelized cost of
energy (LCOE) (BNEF 2015a; Wiser et al. 2011; Rubin et al. 2015), with most research directed
towards one component of LCOE: upfront capital costs (Ferioli et al. 2009; Dinica 2011; Rubin et al.
2015). In addition, using historical data to generate learning rates that are then extrapolated into
the future implicitly assumes that future trends will replicate past ones (Arrow 1962; Nordhaus
2009; Ferioli et al. 2009). For technologies with limited historical data, such as floating offshore
Forecasting Wind Energy Costs and Cost Drivers │4
wind, it is not even possible to compute technology-specific learning rates.
Engineering assessments provide a bottom-up, technology-rich alternative or complement to
learning curve analyses (Mukora et al. 2009). They involve detailed modeling of specific possible
technology advancements (e.g., BVG 2015; Bywaters et al. 2005; Malcolm and Hansen 2002;
Fingersh et al. 2006; Crown Estate 2012; Sieros et al. 2012; Fitchner-Prognos 2013; Valpy and
English 2014a,b). Because this approach often models both cost and performance, it inherently
emphasizes expected reductions in LCOE. It requires a robust understanding of possible technology
advancements, thus the opportunities captured by engineering studies are often incremental and
generally realizable in the near to medium term (less than 15 years). This approach also generally
requires sophisticated design and cost models to capture the full array of component- and system-
level interactions, and rarely provides insight into the probability of different outcomes.
Expert knowledge can be obtained through many means, not only through formal elicitation
procedures. Through interviews, workshops, and other approaches, expert insight is a mainstay of
many recent attempts to forecast future wind technology advancement and cost reduction. It can
be paired with engineering assessment and learning curve tools to bolster the reliability of the
overall estimates, garner a more detailed understanding of how cost reductions may be realized,
and clarify the uncertainty in these estimates. The use of expert knowledge has proven especially
valuable for emergent offshore wind technologies, for which historical data are often lacking
(Junginger et al. 2004; Crown Estate 2012; Fitchner-Prognos 2013; Navigant 2013; TKI Wind op Zee
2015), but expert insight has also been used to assess onshore wind (Cohen et al. 2008; Neij 2008)
and to compare onshore and offshore (Wüstemeyer et al. 2015). As with more-formal elicitation
procedures, care is needed to avoid bias and overconfidence in expert responses.
2.2. Scope of Expert Assessment: What Were We Asking?
The scope of our assessment comprises three wind power applications: utility-scale onshore wind,
fixed-bottom offshore wind, and floating offshore wind. Onshore (i.e., land-based) wind is relatively
mature, and it already makes a significant contribution to energy supply in many countries. Fixed-
bottom offshore wind can use multiple foundation types (e.g., monopile, jacket, gravity base). It is less
mature than onshore wind, but it is being deployed at scale in Europe and, to a lesser degree, outside of
Europe. Floating offshore wind (e.g., spar buoy, semi-submersible platform, tension-leg platform) is not
yet fully commercialized, but it has been deployed in full scale demonstration projects.
Our analysis centers on potential changes in the LCOE of projects that use each of the three wind
applications, in dollars or euros per megawatt-hour ($/MWh or €/MWh). The LCOE is the levelized cost
per unit of generated electricity from a specific source over its project design life that allows recovery of

Forecasting Wind Energy Costs and Cost Drivers │5
all project expenses and meets investor return expectations.1 Though LCOE should not be the only
metric used when comparing electric generation assets, the LCOE is regularly and appropriately used to
assess the unit costs of electric-generation technologies, and minimizing LCOE is a primary goal of the
wind industry and of wind energy R&D.2
In surveying the experts, we sought insight on the LCOE of the three wind applications at four time
points: a recent-cost baseline in 2014 (for which respondents could accept a predefined baseline or
create their own) and then in 2020, 2030, and 2050.3 Note that these dates are based on the year in
which a new wind project is commissioned. We did not seek a baseline estimate for floating offshore
wind, given the nascent present state of that technology and lack of current commercial applications.
For the baseline year, and for our focus year of 2030, we further requested details on five core input
components of LCOE: (1) total upfront capital costs to build the project (CapEx, $ or €/kW); (2) levelized
total annual operating expenditures over the project design life, including maintenance and all other
ongoing costs, e.g., insurance and land payments (OpEx, $ or €/kW-yr); (3) average annual net project-
level energy output (capacity factor, %); (4) project design life considered by investors (years); and (5)
costs of financing, in terms of the after-tax, nominal weighted-average cost of capital (WACC, %).4,5 For
the other two time points (2020, 2050), we solicited only estimates of the LCOE.
1 We calculate LCOE in real 2014$ or 2014€ per MWh. This LCOE estimate equates to the minimum power price a
project must obtain to cover all project costs, service debt, pay expected returns to equity shareholders, and
cover income tax. LCOE is calculated at the plant boundary and excludes the valuation of public benefits (e.g.,
Renewable Energy Credits, carbon credits, Green Certificates) as well as ratepayer, taxpayer, or other forms of
project-level government support (e.g., investment and production tax credits, feed-in-tariff premiums). The
formula used to calculate LCOE and more details on its use in this survey can be found at:
http://rincon.lbl.gov/lcoe_v2/background.html. 2 Though LCOE is useful for showing generation cost trends, simply comparing LCOEs among different electric-
generation technologies is not sufficient to judge the relative value of those technologies. This is because electric
system planners and modelers must consider not only levelized generation costs, but also system costs that
include consideration of system peaking needs, transmission expenditure, and variable generation integration
(Joskow 2011; Wiser et al. 2011; Edenhofer et al. 2013; Hirth 2013; Mills and Wiser 2013). Differences in taxation,
incentives, and societal benefits and costs are also often considered. 3 Inclusion of a 2014 baseline allows for any changes over time to be characterized in absolute ($ or €) and relative
terms (% increase or decrease). 4 This represents the average return required by the combination of equity and debt investors to make a project
an attractive investment opportunity, where each category of capital is proportionately weighted. The WACC may
be defined in after-tax or pre-tax terms. Owing to highly variable tax rules as well as the use of the tax code to
incentivize wind energy in some countries, this survey relies exclusively on an after-tax WACC. Under these
conditions, respective equity returns should reflect the annual average rate of return for equity positions after
expenses and taxes, independent of how the rate of equity return is impacted by the applicable tax code.
Similarly, debt interest rates should account for their status as a business tax deduction where applicable. In
practice, after-tax WACCs may be considered either in real or nominal terms. Assuming an inflation rate of 2%, the
following conversions between nominal and real apply: 4% nominal WACC = 2% real WACC; 8% nominal WACC =
5.9% real WACC; 12% nominal WACC = 9.8% real WACC.
Forecasting Wind Energy Costs and Cost Drivers │6
For the 2014 and 2030 CapEx estimates, respondents were asked to include only costs within the plant
boundary, which include costs for electrical cabling within the plant but exclude costs for any needed
substations, transmission lines, or grid interconnection costs. As applied to offshore wind, this means
that CapEx includes costs for within-plant array cabling but excludes the costs for offshore substations,
any high-voltage direct-current collector stations and associated cables, and grid connection to land
(e.g., subsea export cables, onshore substations, and onshore transmission cables). As defined in the
survey, OpEx excludes any costs associated with grid interconnection, substations, or transmission use;
for offshore wind, transmission system use charges are also excluded.
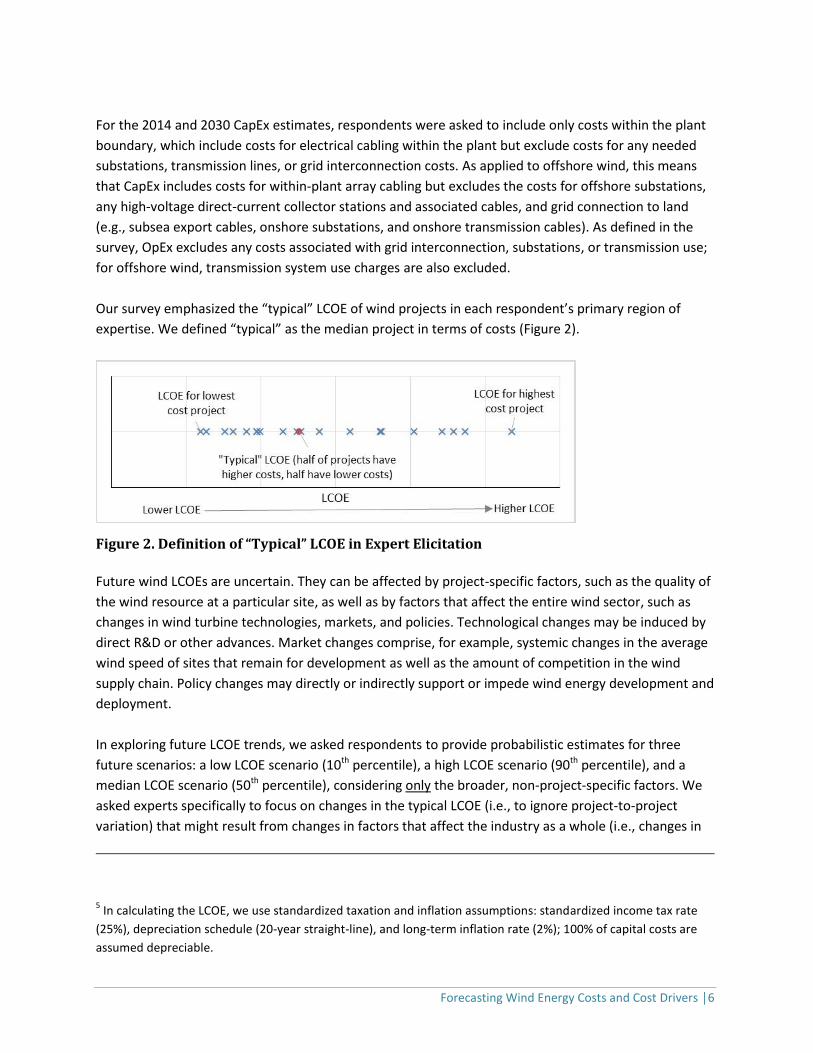
Our survey emphasized the “typical” LCOE of wind projects in each respondent’s primary region of
expertise. We defined “typical” as the median project in terms of costs (Figure 2).
Figure 2. Definition of “Typical” LCOE in Expert Elicitation
Future wind LCOEs are uncertain. They can be affected by project-specific factors, such as the quality of
the wind resource at a particular site, as well as by factors that affect the entire wind sector, such as
changes in wind turbine technologies, markets, and policies. Technological changes may be induced by
direct R&D or other advances. Market changes comprise, for example, systemic changes in the average
wind speed of sites that remain for development as well as the amount of competition in the wind
supply chain. Policy changes may directly or indirectly support or impede wind energy development and
deployment.
In exploring future LCOE trends, we asked respondents to provide probabilistic estimates for three
future scenarios: a low LCOE scenario (10th percentile), a high LCOE scenario (90th percentile), and a
median LCOE scenario (50th percentile), considering only the broader, non-project-specific factors. We
asked experts specifically to focus on changes in the typical LCOE (i.e., to ignore project-to-project
variation) that might result from changes in factors that affect the industry as a whole (i.e., changes in
5 In calculating the LCOE, we use standardized taxation and inflation assumptions: standardized income tax rate
(25%), depreciation schedule (20-year straight-line), and long-term inflation rate (2%); 100% of capital costs are
assumed depreciable.
Forecasting Wind Energy Costs and Cost Drivers │7
wind energy technologies, markets, and policies). We also asked respondents to assume no changes in
macroeconomic conditions (such as interest rates, inflation, and currency fluctuations), materials and
commodity prices, and other factors not directly related to the wind energy business.6
In addition to asking about LCOE and the five core LCOE inputs, we asked about the market and
technology characteristics and drivers most likely to impact LCOE trends in 2030. Specifically, we sought
information on: (1) expected typical turbine characteristics for projects installed in 2030—nameplate
capacity, hub height, and rotor diameter for all three wind applications; (2) the expected impact of each
of a list of specific changes in wind development, technology, design, manufacturing, construction,
operations, and markets on achieving reduced LCOE by 2030 for all three wind applications; and (3)
broad drivers most likely to facilitate achieving “low” estimates of LCOE in 2030 as opposed to
“median” estimates in that year, separately for onshore and fixed-bottom offshore wind.
2.3. Application of Expert Elicitation Principles
We applied many of the basic concepts, tools, and guidelines of a well-designed expert elicitation in
order to minimize biases. Best elicitation practices include clearly defining the quantities that are being
assessed, minimizing extra cognitive burden on the expert by asking questions using familiar
terminology and units, and minimizing the need for “side” calculations. In addition, we sought to
minimize the effects of anchoring and overconfidence biases (Kahneman et al. 1982) by asking for low-
and high-scenario estimates before asking for a mid-point estimate, and providing experts with
feedback and the opportunity to review and modify their responses (Coppersmith et al. 2009). Our
online survey format created challenges (e.g., we had a limited ability to tailor questions to respondent
preferences) but also provided benefits over traditional interview-based elicitations in terms of easily
accessible calculation and graphical display tools that gave experts immediate feedback and context for
their assessments.
We carefully and clearly defined each of the cost-related factors for which we elicited input, and we
reinforced those definitions throughout the survey. In part we took extra care here because of
differences across the industry in how each factor is defined—for example, whether a project’s CapEx
includes or excludes transmission and grid interconnection costs, or whether nominal or real WACC is
used in calculating LCOE. Because we could not ask each expert how he or she defined each term, and
because we wanted to compare answers across the experts, we needed to provide detailed definitions
of each quantity.
Although the experts could not challenge the definitions of the quantities being assessed, we provided
some flexibility in how they provided responses, and we reduced the need for extraneous calculations.
Respondents could answer cost questions in real U.S. dollars or real euros (we used the average 2014
exchange rate of €1 = US $1.33). They were also asked to indicate which of the three wind applications
they were comfortable discussing, and then they were asked questions only about those applications.
They were provided with an in-survey, easy-to-use LCOE calculator to translate component estimates 6 For more detail, see: http://rincon.lbl.gov/lcoe_v2/typical_costs.html.

Forecasting Wind Energy Costs and Cost Drivers │8
into an LCOE estimate.7 Additionally, respondents had the opportunity to qualify their answers with
additional written comments and could skip questions they did not feel comfortable answering.
A particular challenge in online elicitations is how to provide experts with feedback and context for
their responses so they can consider their own internal consistency and modify their assessments as
desired. Without personal interaction, the elicitation team cannot direct an expert’s attention to
particular questions and responses. We addressed this issue by including graphical elements in the
survey instrument and by building useful feedback into the instrument based on the results of
pretesting that identified feedback needs. Most critical was the use of a time-trend graphical interface
that (1) displayed the experts’ previous assessments of a 2014 baseline LCOE and their low, median,
and high scenario LCOE values for 2030, and (2) asked for low, median, and high scenario LCOE
estimates for 2020 and 2050 on the same graph. This interface explicitly showed the experts all of their
LCOE responses, encouraging them to think about the internal consistency of those estimates.
Though we followed expert elicitation principles and design guidelines in our assessment, three unique
aspects of the present assessment deserve mention:
Casting a Wide Net with an Online Survey: Many expert elicitations feature detailed and sometimes
lengthy in-person interviews with fewer than 20 experts. In contrast, we distributed our survey
online to a wide group of possible respondents. This necessitated a shorter, more focused survey
than would be common in an in-person setting, with less follow-up and in-depth exploration of
responses.8 In part, this choice reflected the need for a greater number of overall respondents to
address one goal of our effort: to compare responses by wind application, organizational type,
location, expertise, and other respondent characteristics.9
No Comprehensive Elicitation of Probability Distributions or Technical Parameters: Our assessment
combined aspects of expert elicitation and an opinion survey. We focused the expert elicitation on
LCOE and the five key inputs to LCOE under low, median, and high scenarios, and we limited
consideration of the five key inputs to only two specific points in time. Our assessment of technical
and market drivers mirrored an opinion survey—we did not seek detailed quantitative assessment
of the LCOE effect of specific technical advancement possibilities. Instead we asked experts to
7 For an example, see http://rincon.lbl.gov/lcoe_v2/lcoe_calculator.html.
8 Some research shows that elicitations relying on self-administered, web-based surveys yield results different
from those relying on in-person interviews (Verdolini et al. 2015; Nemet et al. 2016), whereas other research
shows less evidence of such differences (Anadon et al. 2013; Baker et al. 2015); where differences exist, the
relative accuracy of the two methods remains unclear, though it is generally believed that in-person interviews
represent the “gold standard.” On the other hand, Baker et al. (2015) and Nemet et al. (2016) also suggest there is
value in including diverse and relatively large groups of experts when conducting elicitations, suggesting—all else
being equal, and due to the resource intensity of in-person elicitation—that there is value to online elicitations. 9 Our interest in assessing the effect of respondent type on elicitation results follows related work conducted by
Anadon et al. (2013) on nuclear energy cost expectations, Verdolini et al. (2015) on solar photovoltaics, and
Nemet et al. (2016) on a range of energy technologies.
Forecasting Wind Energy Costs and Cost Drivers │9
identify which advancements they believe would be larger contributors to cost reductions.
No Elicitation of Opinions Conditional on Specific R&D, Policy, Deployment, or Other Factors: We
asked respondents to make low, high, and median scenario estimates of future LCOE, and we left it
to them to define for themselves the future scenarios that might drive those cost changes. In
contrast, many expert elicitations condition responses based on defined R&D expenditures and on
specific market and policy scenarios, in order to more directly inform R&D and policy decisions. Our
survey was designed to map the universe of possible future LCOEs but provides only limited
information about specific contributions to lower or higher costs.
2.4. Survey Design, Testing, and Implementation
We gathered data and insights through an online elicitation survey (via the Near Zero platform10) of a
large sample of the world’s foremost wind energy experts under the auspices of IEA Wind Task 26 on
the “Cost of Wind Energy.”
The survey was carefully designed over a number of months, including numerous rounds of review,
testing, and revision. Reviewers included the core survey design team, IEA Wind Task 26 members, and
a select group of external wind energy experts. An expert workshop was held early in the process to
discuss the goals of the survey and to pilot test an early draft of the survey. A PDF version of the final
survey can be found online at: https://emp.lbl.gov/iea-wind-expert-survey.
The survey was launched in October 2015 and closed in December 2015. During the intervening period,
various steps were taken to maximize response rate and ensure respondent comprehension of the
survey. In particular, we first “pre-announced” the survey to possible respondents, and we invited
participation in a webinar during which we discussed the purpose, structure, and details of the
elicitation: 33 people attended the webinar, the recording was viewed 19 times, and the slides were
made available for download. The online survey was distributed with personalized web links, and six
separate waves of reminders were sent before the survey finally closed—including personalized and
less-personalized email reminders as well as some phone and in-person exhortations. Because of the
depth and length of the online survey, respondents were allowed to complete it in multiple sittings as
necessary. In some cases, several individuals within an organization collaborated on a single, collective
survey response.
2.5. Selection and Response of Experts
The success of an expert elicitation depends on the expertise and commitment of the contributing
experts. Given the focus of our elicitation on project-level LCOE, our ideal respondents included
strategic, system-level thought leaders with wind technology, cost, and/or market expertise. Such
individuals might come from the various strands of the private wind industry, public R&D institutes,
academia, or a range of other organizations. We sought a relatively large number of respondents in part
10
See: http://www.nearzero.org/.

Forecasting Wind Energy Costs and Cost Drivers │10
to ensure an adequate number of possible experts versed in each of the three wind applications.
Though the survey was global in scope, we focused on experts from North America and Europe given
the constitution of the members of IEA Wind Task 26.
We received considerable assistance in identifying possible respondents from IEA Wind Task 26
members and their affiliated institutions, and we reached out to many other wind energy experts and
organizations to ensure broad coverage. We allowed our initial set of potential respondents to suggest
additional names, which yielded a small number of additional respondents.
In addition to the full survey sample, we identified a smaller group of “leading experts.” These
individuals were selected through an iterative, deliberative process by a core group of IEA Wind Task 26
members and several leading external wind energy experts. The survey team believed this small group
was uniquely qualified to complete the survey, and the group was created in part to enable comparison
of survey results between the smaller leading-expert sub-sample (paralleling a more traditional
elicitation) and the larger group (excluding the leading-expert sub-sample).
We successfully distributed surveys to 482 experts, including 42 in the leading-expert group. The total
number of returned surveys was 163, of which 22 came from the leading-expert group and the
remaining 141 fall within the larger group. This reflects a response rate of 34% across the full set and
52% among the smaller group.11 Appendix A lists the individuals who submitted responses.
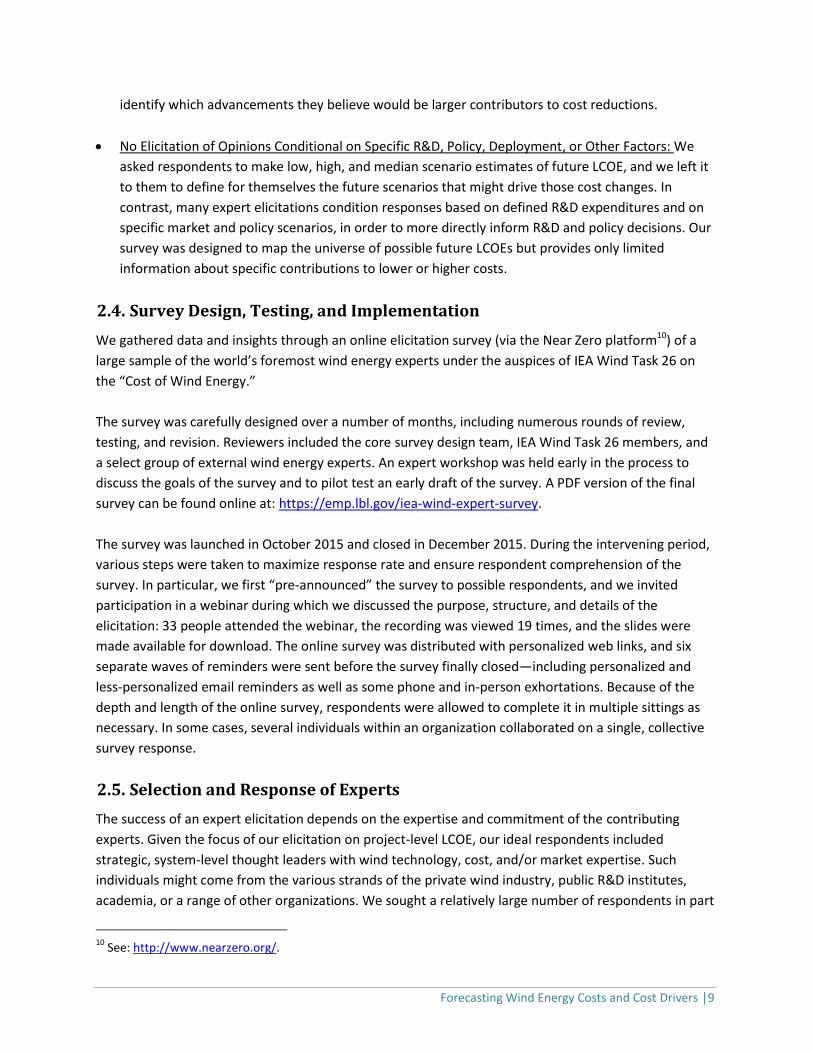
Responses came from a broad cross-section of the wind sector. Figure 3 summarizes the characteristics
of the 163 respondents by wind application area addressed, region of the world with which experts are
most familiar, organizational type, and type of expertise. Note that respondents were able to identify
multiple wind applications, geographies, and types of expertise. The median respondent dedicated 49
minutes to completing the survey, with the 25th-to-75th percentile range from 29 to 99 minutes.
11
In practice, there were some instances in which multiple individuals collaborated on a single survey response.
Where we know of these instances, they are marked in Appendix A, and they result in a total response rate of 36%
(by experts).
Forecasting Wind Energy Costs and Cost Drivers │11
Figure 3. Characteristics of the 163 Expert Survey Respondents
3. Summary of Elicitation Results
The analysis presented in this report summarizes the full set of 163 survey responses received.
Additionally, in a number of text boxes, we highlight—on a cursory basis—notable differences in
responses: (1) between the smaller leading-expert group vs. the full set of responses less that group; (2)
by organizational type12; (3) between respondents who provided opinions on only onshore or offshore
wind vs. those who provided responses to both onshore and offshore wind; (4) by type of expertise;
12
We consolidated the nine organizational type categories presented in Figure 3 into five larger categories: (1)
public R&D and academic (consolidating two of the original categories, and called the “research” group for the
remainder of the report); (2) wind developer/owner/financier/operator and construction/installation contractor
(consolidating two of the original categories, and called the “wind deployment” group); (3) wind turbine and/or
component manufacturer (called the “equipment manufacturing” group); (4) other private-sector wind industry;
and (5) other (consolidating three of the original categories—government agency not associated with research,
other not-for-profit, and other).

Forecasting Wind Energy Costs and Cost Drivers │12
and (5) by familiarity with different geographic regions.13 Such comparisons are insightful in their own
right, but might also help reveal underlying biases in the survey sample. Future work is planned to
assess more thoroughly any systematic differences in survey responses by respondent characteristics.
3.1. Forecasts for LCOE Reduction
For each of the wind applications, experts provided a single estimate of LCOE for 2014 (the “baseline”
value) and then provided low-, median-, and high-scenario estimates for the typical LCOE of wind
projects in 2020, 2030, and 2050. In estimating the low-, median-, and high-scenario estimates, experts
were asked to ignore project-to-project variation and instead to focus on factors that affect the industry
as a whole, e.g., changes in wind energy technologies, markets, and policies. All dates are based on the
year in which a new wind project is commissioned.
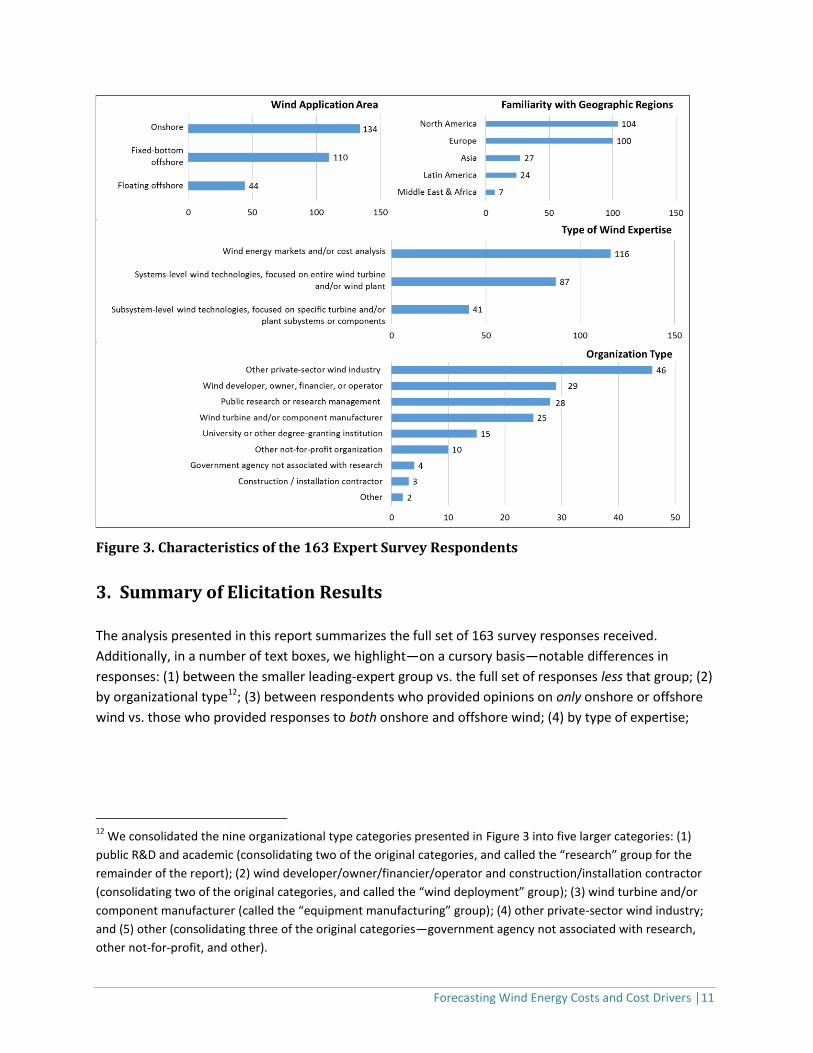
Figure 4 shows the resulting changes in LCOE from 2014 through 2050 in percentage terms for (a)
onshore, (b) fixed-bottom offshore, and (c) floating offshore wind. Expert-specific changes in LCOE are
calculated using each expert’s baseline and later values. Because a 2014 baseline was not established
for floating offshore, the change is shown relative to the expert-specific baseline for fixed-bottom
offshore wind. The figure shows the change from the baseline values for each of the three scenarios the
experts were asked to provide: low, median, and high scenarios of typical LCOE. Expert opinions on
these changes vary, and the figure also shows the range of those opinions. Lines and markers show the
median value of expert responses, and the shaded regions around each line show the range (25th to 75th
percentile) of expert responses.
While the figure summarizes the full set of survey responses, Text Box 1 highlights key differences in
LCOE estimates among various respondent groups. Though the differences identified in the text box are
notable, it is also important that the results from most respondent groups—by organization, by region,
and by expertise type—vary only to a relatively small degree. This suggests that any biases in the results
that derive from our survey sample are either limited or apply similarly to many of the wind expert
respondent groupings.
13
Note that in many instances a single respondent may have identified multiple geographies (e.g., North America
and Europe) or types of expertise (e.g., expertise on wind energy costs and on wind energy technologies). Such
respondents may, therefore, fall within multiple categories when the survey responses are split by geography or
expertise type. In these instances, careful interpretation is required. This issue is not present when culling results
by organizational type; leading experts vs. larger group; or onshore, offshore, vs. both onshore and offshore—in
each of the latter cases, the groupings are mutually exclusive.
Forecasting Wind Energy Costs and Cost Drivers │13
Note: All dates are based on the year in which a new wind project is commissioned.
Figure 4. Estimated Change in LCOE over Time for (a) Onshore, (b) Fixed-Bottom Offshore, and (c) Floating Offshore Wind Projects

Forecasting Wind Energy Costs and Cost Drivers │14
Focusing first on the median (50th percentile) scenario for typical LCOE, experts clearly predict
significant continued reductions in the cost of wind energy. Though onshore wind technology is already
relatively mature, experts anticipate further advancements, with the median value of expert responses
(also referred to as the median-expert response) showing LCOE reductions from baseline values of 10%
in 2020, 24% in 2030, and 35% in 2050. Expert views on the long-term opportunities for fixed-bottom
offshore wind are even more aggressive—perhaps not surprisingly, given the earlier state of the
technology—with median LCOE reductions of 10% in 2020, 30% in 2030, and 41% in 2050. Floating
offshore wind comes in at a 6% LCOE premium in 2020 relative to the 2014 fixed-bottom offshore
baseline (reflective of the emerging state of the technology), but then it steeply declines to 25% below
and then 38% below baseline values by 2030 and 2050, respectively.
There is also clearly a sizable range of uncertainty in future LCOEs, reflected both in the median-expert
response for the low-scenario and high-scenario LCOE estimates as well as the range of expert views for
all three scenarios shown by the shaded regions. For onshore wind, under the high scenario, the
median-expert response shows effectively no change in LCOE from 2014 to 2050. Under the low
scenario, however, the LCOE declines by 44% in 2030 and 53% in 2050. For fixed-bottom offshore wind,
high-scenario LCOEs similarly remain at 2014 values, but only to 2030—in contrast with the onshore
wind results, the high-scenario LCOE declines for fixed-bottom offshore after 2030, with a 17%
reduction by 2050 for the median-expert response. High-scenario estimates for floating offshore wind
show a somewhat different pattern: 25% higher than baseline values in 2020, 5% higher in 2030, and
then 6% lower in 2050. Low-scenario estimates, at least in the long term, show a similar pattern for
fixed-bottom and floating offshore wind (also bearing a strong similarity to onshore wind): a 43%–45%
reduction in 2030 and a 53% reduction in 2050. Overall, the range in results among the high, median,
and low scenarios demonstrates a sizable “opportunity space” for R&D- and deployment-related
advancements.
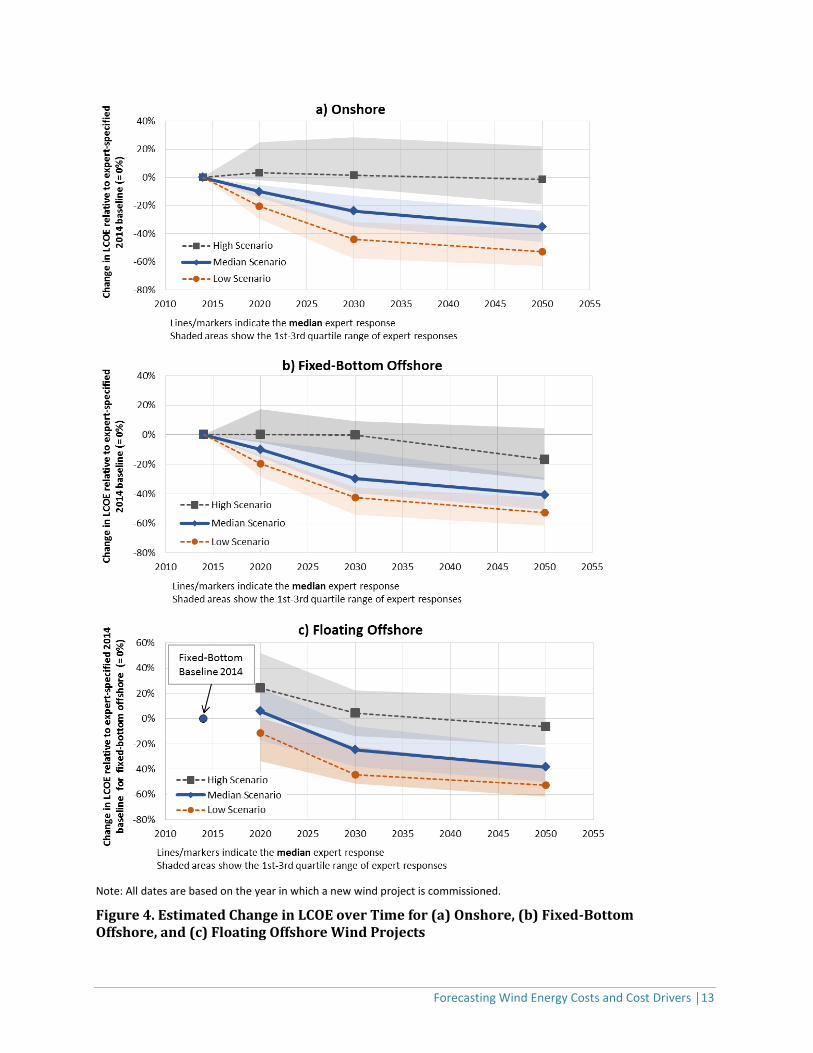
Though percentage changes from the baseline are the most broadly applicable approach to presenting
survey findings, depicting the relative absolute value for expert-specified LCOE (in $ or €/MWh) is also
relevant. Figure 5 shows the estimated LCOE values for all three wind energy applications, over time, on
a single plot, focusing only on the median scenario and depicting the median value of all expert
responses as well as the range of expert responses. In reviewing this chart, emphasis should be placed
on the relative positioning of and changes in LCOE, not on absolute magnitudes. This is because experts
could accept a given 2014 baseline, or could create their own baseline. The median baseline shown in
the figure therefore does not intend to represent any specific region of the world; for any specific
region, the 2014 baseline figure and therefore expected absolute future LCOEs relative to that figure
would vary. Additionally, because roughly 80% of experts chose to use the default 2014 baseline values
for onshore and fixed-bottom offshore, the 1st and 3rd quartile as well and the median expert response
for 2014 are all equivalent to those default baseline values. Appendix B includes two similar figures
focused on the low-scenario (Figure A-1) and the high-scenario (Figure A-2) LCOE estimates.
Not surprisingly, experts clearly believe that onshore wind energy will remain lower cost than offshore,
at least for typical projects. That being said, offshore wind energy is anticipated to see more-significant
Forecasting Wind Energy Costs and Cost Drivers │15
absolute reductions in LCOE over time, and so a narrowing occurs between the LCOEs of onshore and
offshore wind applications. A similar trend is apparent for fixed-bottom and floating offshore wind:
while the typical floating offshore wind project is expected to remain more costly than fixed-bottom
wind over the entire period, the gap narrows over time, especially because of the sizable expected
LCOE reductions for floating offshore wind between 2020 and 2030. Under the median scenario, of
those experts who provided both fixed-bottom and floating LCOE figures, 23% see floating as less
expensive than fixed-bottom by 2030, and 40% see it as less expensive by 2050.14 These LCOE results—
and comparisons—exclude costs of transmission interconnection to shore; differential interconnection
costs between fixed-bottom and floating projects could therefore shift these relative LCOE results.
Finally, there is clearly much higher uncertainty for the future LCOE of offshore wind energy than for
onshore wind energy, depicted by the much larger 25th-to-75th percentile range for expert responses.
Figure 5. Expert Estimates of Median-Scenario LCOE for All Three Wind Applications
14
In the median scenario , the median-respondent LCOE of floating offshore wind is anticipated to remain slightly
higher than that of fixed-bottom offshore wind through 2050, but the gap narrows and is very small by 2050
(Figure 5). In the low scenario, the median respondent expects an earlier LCOE convergence (see Appendix B). A
deeper review shows that the leading-expert group is somewhat more optimistic for this convergence than the
larger group of respondents (less the leading group). In the median LCOE scenario in 2050, for example, the small
number of leading experts predicts a median LCOE reduction of 51% for fixed-bottom and 50% for floating
offshore wind, whereas the larger respondent group predicts a 40% reduction for fixed-bottom and 31% for
floating (see Figure 6, in Text Box 1). In the low-LCOE scenario, meanwhile, the leading experts predict median
LCOE reductions of 62% for fixed-bottom and 64% for floating offshore wind (lower costs for floating offshore
wind than fixed-bottom), whereas the larger respondent group expects a 53% reduction for fixed-bottom and 50%
for floating (Appendix B).

Forecasting Wind Energy Costs and Cost Drivers │16
Respondents were given the option of providing a textual discussion of the conditions that might
produce low-, median-, or high-scenario LCOE estimates; these qualitative observations complement
other survey results discussed later in this report that cover similar themes. For onshore wind, the
experts identify a wide variety of factors as important to achieving low-scenario LCOE and, to a lesser
extent, median-scenario LCOE estimates, including technical advancements (e.g., larger rotor and taller
towers as well as improved and lighter materials, component reliability, turbine life, controls, and
understanding of wind flow) and other market factors (e.g., learning through deployment volume and
policy stability, transmission to access high-quality sites, lower-cost financing with industry maturation,
and supply-chain efficiencies). Expert comments also reveal the tradeoff between CapEx and capacity
factor, with some experts anticipating continued capacity factor improvements but only with stagnating
CapEx value in order to pay for those performance increases. Conditions that might lead to high-
scenario LCOE estimates often include weak demand for new wind power additions and/or a depletion
of higher-quality wind resource sites (and/or lack of investment in new transmission to access those
sites).
Expert-provided conditions for achieving low-, median-, or high-scenario LCOE for offshore wind
energy—whether fixed-bottom or floating—are easier to summarize. The dominant themes relate to
deployment volumes and market stability. Simply put, many experts believe that significant deployment
is an essential precondition to the technical advancements, standardization, and supply-chain
efficiencies in manufacturing, installation, and operations that would be required to achieve the low-
scenario or even median-scenario LCOE estimate. Larger machine ratings are also especially important,
according to the experts.
Forecasting Wind Energy Costs and Cost Drivers │17
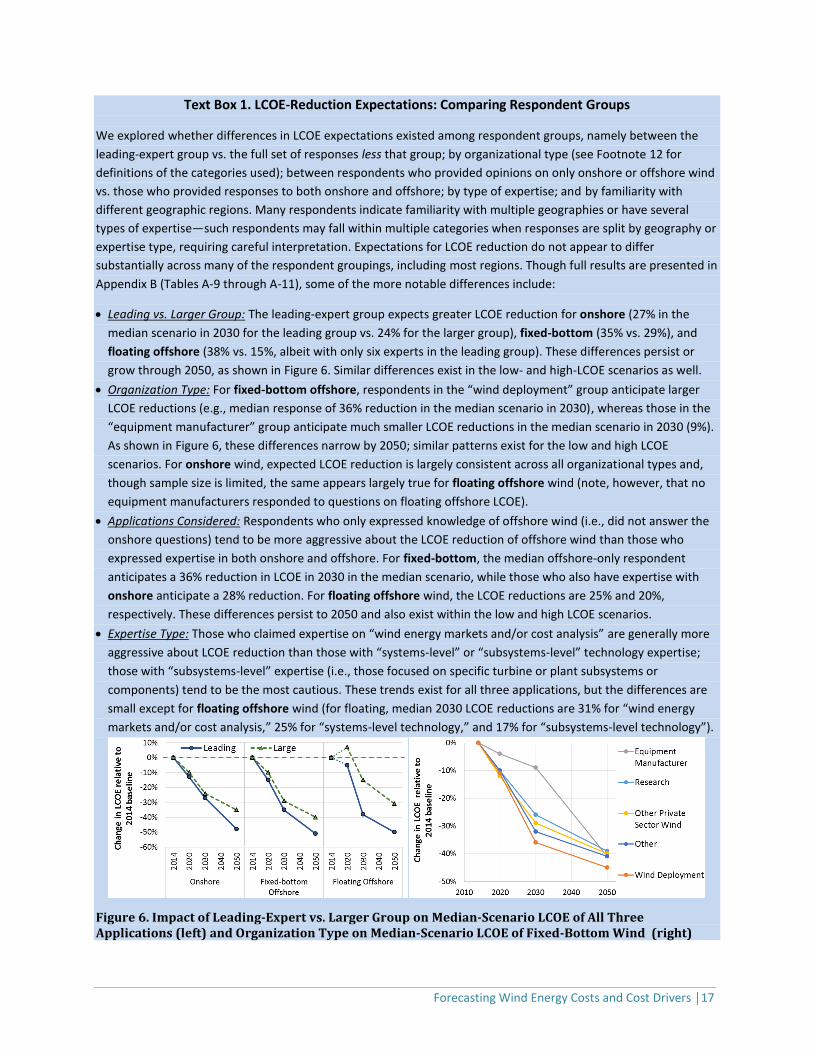
Text Box 1. LCOE-Reduction Expectations: Comparing Respondent Groups
We explored whether differences in LCOE expectations existed among respondent groups, namely between the
leading-expert group vs. the full set of responses less that group; by organizational type (see Footnote 12 for
definitions of the categories used); between respondents who provided opinions on only onshore or offshore wind
vs. those who provided responses to both onshore and offshore; by type of expertise; and by familiarity with
different geographic regions. Many respondents indicate familiarity with multiple geographies or have several
types of expertise—such respondents may fall within multiple categories when responses are split by geography or
expertise type, requiring careful interpretation. Expectations for LCOE reduction do not appear to differ
substantially across many of the respondent groupings, including most regions. Though full results are presented in
Appendix B (Tables A-9 through A-11), some of the more notable differences include:
Leading vs. Larger Group: The leading-expert group expects greater LCOE reduction for onshore (27% in the
median scenario in 2030 for the leading group vs. 24% for the larger group), fixed-bottom (35% vs. 29%), and
floating offshore (38% vs. 15%, albeit with only six experts in the leading group). These differences persist or
grow through 2050, as shown in Figure 6. Similar differences exist in the low- and high-LCOE scenarios as well.
Organization Type: For fixed-bottom offshore, respondents in the “wind deployment” group anticipate larger
LCOE reductions (e.g., median response of 36% reduction in the median scenario in 2030), whereas those in the
“equipment manufacturer” group anticipate much smaller LCOE reductions in the median scenario in 2030 (9%).
As shown in Figure 6, these differences narrow by 2050; similar patterns exist for the low and high LCOE
scenarios. For onshore wind, expected LCOE reduction is largely consistent across all organizational types and,
though sample size is limited, the same appears largely true for floating offshore wind (note, however, that no
equipment manufacturers responded to questions on floating offshore LCOE).
Applications Considered: Respondents who only expressed knowledge of offshore wind (i.e., did not answer the
onshore questions) tend to be more aggressive about the LCOE reduction of offshore wind than those who
expressed expertise in both onshore and offshore. For fixed-bottom, the median offshore-only respondent
anticipates a 36% reduction in LCOE in 2030 in the median scenario, while those who also have expertise with
onshore anticipate a 28% reduction. For floating offshore wind, the LCOE reductions are 25% and 20%,
respectively. These differences persist to 2050 and also exist within the low and high LCOE scenarios.
Expertise Type: Those who claimed expertise on “wind energy markets and/or cost analysis” are generally more
aggressive about LCOE reduction than those with “systems-level” or “subsystems-level” technology expertise;
those with “subsystems-level” expertise (i.e., those focused on specific turbine or plant subsystems or
components) tend to be the most cautious. These trends exist for all three applications, but the differences are
small except for floating offshore wind (for floating, median 2030 LCOE reductions are 31% for “wind energy
markets and/or cost analysis,” 25% for “systems-level technology,” and 17% for “subsystems-level technology”).
Figure 6. Impact of Leading-Expert vs. Larger Group on Median-Scenario LCOE of All Three Applications (left) and Organization Type on Median-Scenario LCOE of Fixed-Bottom Wind (right)

Forecasting Wind Energy Costs and Cost Drivers │18
3.2. Baseline Values for 2014
To unpack the LCOE results presented earlier, it is first important to better understand the 2014
baseline values used by experts—not only for LCOE but also for the five key components that drive
LCOE: CapEx, OpEx, capacity factor, project design life, and cost of financing. Rather than assume that
all experts have the same internal “baseline” for the typical LCOE of recent projects, we offered a
default option but allowed experts to provide their own estimates for onshore and fixed-bottom
offshore wind; we did not provide or seek a baseline estimate for floating offshore wind, given the
nascent state of that technology and lack of current commercial applications. The default baseline
values offered for onshore wind were intended to reflect an average 2014 project installed in the
United States or Europe, while the offshore baseline was intended to reflect European experience.
Table 1 and Table 2 summarize both the default values and the range of other values provided by those
experts who opted to provide their own.
The majority of experts accepted the default baseline values. For experts providing input on onshore
wind projects, 103 of 134 respondents used the default baseline values shown in the tables. For experts
providing input on offshore wind projects, 88 of 110 respondents used the baseline values.
Among experts modifying the 2014 baseline values for onshore wind projects, most estimated a lower
LCOE, through lower CapEx and OpEx and through a longer project design life and higher capacity
factor. Based on a review of open-ended responses to a question asking experts to describe their
revised baseline, these revisions towards a lower LCOE came primarily from respondents who were
seeking to reflect lower-cost projects in the United States, often through higher capacity factors, lower
CapEx, or both. Those who revised the baseline figures to better reflect European costs did so less
consistently in one direction or the other, given very different market and resource contexts from one
European country to the next; a number of participants reduced the default capacity factor to better
match European—and especially German—conditions, for example, while others left capacity factor at
the default value but altered CapEx to better match conditions in certain windier European countries.15
In contrast to the onshore wind results, among those modifying the baseline values for offshore wind
projects, most estimated a higher LCOE, in part through higher operating expenses. These upward
revisions came from respondents seeking to better reflect European projects and, to a much lesser
degree, hypothetical North American projects. In both cases, the revisions tended to result in higher
2014 baseline LCOEs; the upward revisions were particularly sizable in the few cases reflecting projects
in the United States, perhaps due to the lack commercial offshore experience in that country.
15
As is apparent in some of the figures in Appendix B, some experts altered the default baseline values very
significantly. In some cases, these revisions were made to reflect conditions that might be considered reasonably
widespread, e.g., very high capacity factors in parts of the United States. In a few cases, however, respondents
developed these “outlier” values considering relatively narrow project parameters, e.g., a small project in the
Northeastern United States or in a difficult site in Switzerland.
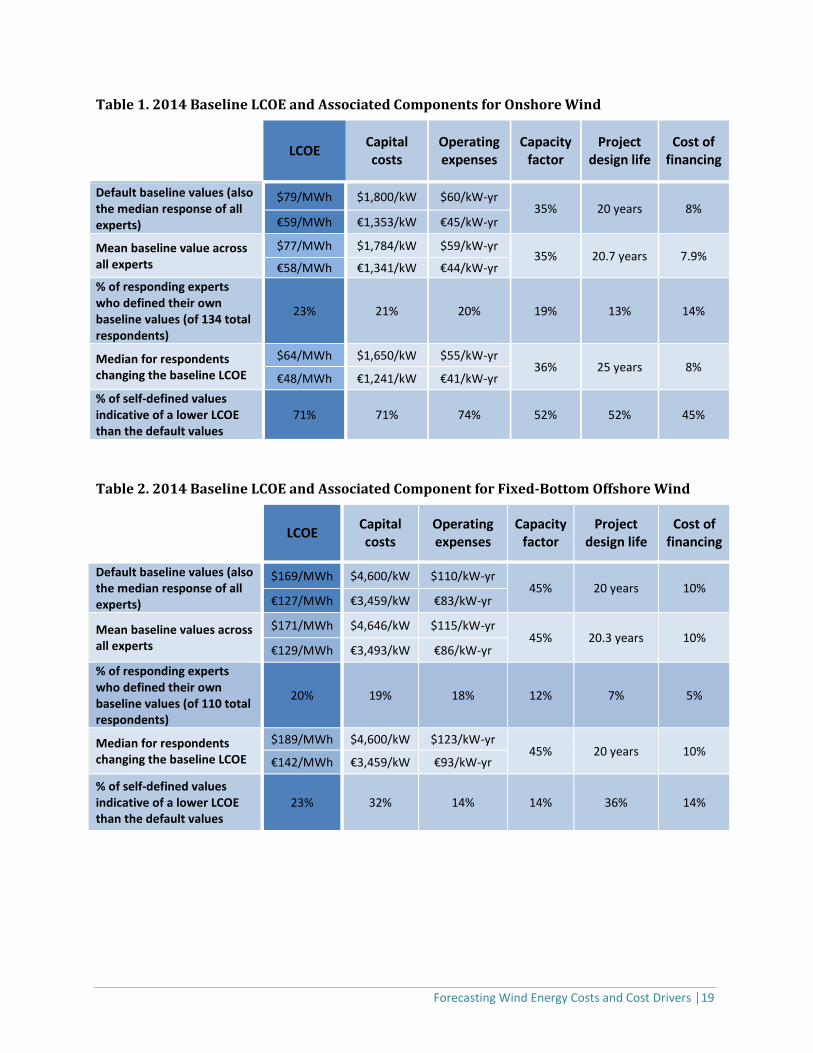
Forecasting Wind Energy Costs and Cost Drivers │19
Table 1. 2014 Baseline LCOE and Associated Components for Onshore Wind
LCOE
Capital costs
Operating expenses
Capacity factor
Project design life
Cost of financing
Default baseline values (also the median response of all experts)
$79/MWh $1,800/kW $60/kW-yr 35% 20 years 8%
€59/MWh €1,353/kW €45/kW-yr
Mean baseline value across all experts
$77/MWh $1,784/kW $59/kW-yr 35% 20.7 years 7.9%
€58/MWh €1,341/kW €44/kW-yr
% of responding experts who defined their own baseline values (of 134 total respondents)
23% 21% 20% 19% 13% 14%
Median for respondents changing the baseline LCOE
$64/MWh $1,650/kW $55/kW-yr 36% 25 years 8%
€48/MWh €1,241/kW €41/kW-yr
% of self-defined values indicative of a lower LCOE than the default values
71% 71% 74% 52% 52% 45%
Table 2. 2014 Baseline LCOE and Associated Component for Fixed-Bottom Offshore Wind
LCOE
Capital costs
Operating expenses
Capacity factor
Project design life
Cost of financing
Default baseline values (also the median response of all experts)
$169/MWh $4,600/kW $110/kW-yr 45% 20 years 10%
€127/MWh €3,459/kW €83/kW-yr
Mean baseline values across all experts
$171/MWh $4,646/kW $115/kW-yr 45% 20.3 years 10%
€129/MWh €3,493/kW €86/kW-yr
% of responding experts who defined their own baseline values (of 110 total respondents)
20% 19% 18% 12% 7% 5%
Median for respondents changing the baseline LCOE
$189/MWh $4,600/kW $123/kW-yr 45% 20 years 10%
€142/MWh €3,459/kW €93/kW-yr
% of self-defined values indicative of a lower LCOE than the default values
23% 32% 14% 14% 36% 14%
Forecasting Wind Energy Costs and Cost Drivers │20
3.3. Sources of LCOE Reduction: CapEx, OpEx, Capacity Factor, Lifetime, WACC
With the baseline values now presented, the earlier LCOE results can be unpacked into five key
components that impact LCOE. Due in part to the complexity of the relationships between the various
LCOE components,16 the elicitation focused on the distribution of LCOE, asking for a 10th (low scenario),
50th (median scenario), and 90th (high scenario) percentile estimate for the typical LCOE of wind
projects, as presented earlier. Associated with each of these LCOE values, for 2030, the experts
provided a set of LCOE component estimates that they felt would represent a project with that LCOE.
With this focus, the component values themselves should not be directly interpreted as defining a
specific probability range for each factor, but they do provide insight into which components experts
believe are more likely to change, and by how much, as LCOE changes over time.
Appendix B provides detailed box-and-whisker charts showing the full range of expert opinions for LCOE
and the five components for the 2014 baseline and for the low-, median-, and high-scenario 2030
estimates (Figures A-3 to A-5). To complement these results, Figure 7 focuses on relative changes in
LCOE and LCOE components. For this analysis, each expert’s responses for low-, median-, and high-
scenario values in 2030 are compared to their 2014 baseline values, and the median result across all
experts is shown in the figure. The change between the 2014 baseline and the estimates associated
with the 2030 median scenario are shown with blue bars; markers also show the relative change
associated with the low- and high-LCOE scenarios for 2030. Mean baseline values for each factor are
shown in the x-axis labels for reference. Though the figure uses the full set of survey responses, Text
Box 2 highlights key differences among various respondent groups.
Starting with the median scenario for onshore wind (LCOE reduction of 24%), experts anticipate that
CapEx (-12%) and OpEx (-9%) will decline by 2030, while capacity factor (+10%) and project life (+10%)
will increase; the median respondent anticipates no change in the cost of financing.17 Under the low
LCOE scenario, these directional trends become even stronger, while cost of financing declines.
Expectations for fixed-bottom offshore component trends from 2014 to 2030 differ from onshore.
Under the median scenario (LCOE reduction of 30%), experts anticipate a slightly larger reduction in
CapEx (-14%) than onshore, a smaller increase in capacity factors (+4%), and a sizable decline in the cost
of financing (-10%). Results for OpEx (-9%) are consistent with onshore, in percentage terms, while
experts are somewhat more optimistic on extended project lifetimes offshore (+15%). For floating
offshore wind (LCOE reduction of 25%, relative to 2014 fixed-bottom baseline), experts anticipate a
tradeoff between smaller CapEx improvements (-5%) and stronger capacity factor growth (+9%),
relative to fixed-bottom wind; financing cost reductions (-5%), project life extensions (+25%), and OpEx
16
For example, there is a non-linear relationship between the components and LCOE, and a logical dependency
among the components: e.g., a higher CapEx may lead to higher capacity factors (and possibly, lower LCOE). 17
That the cost of financing does not change in the median scenario is—initially—somewhat surprising. Most
respondents are most-familiar with the established markets in North America and Europe, however, where
advancements in the cost of financing are less-likely than in less-developed wind regions. Results based on mean
survey responses (Figure A – 3) do show a reduction in the cost of finance even in the median scenario.
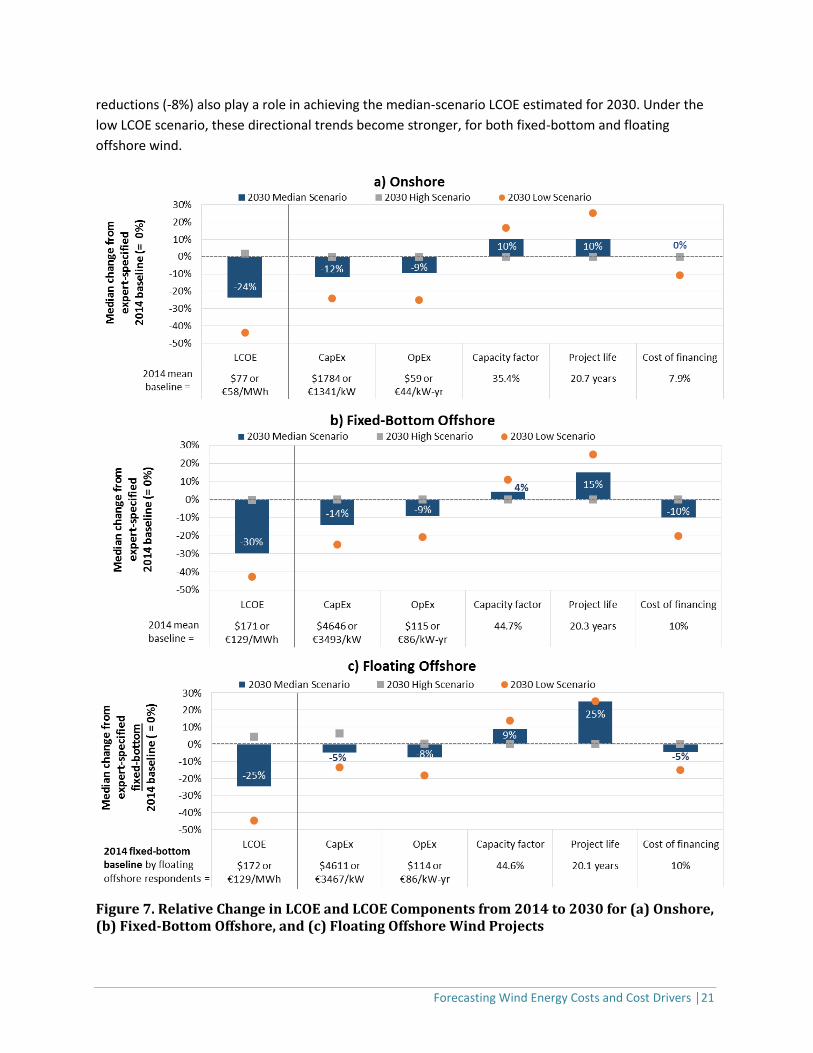
Forecasting Wind Energy Costs and Cost Drivers │21
reductions (-8%) also play a role in achieving the median-scenario LCOE estimated for 2030. Under the
low LCOE scenario, these directional trends become stronger, for both fixed-bottom and floating
offshore wind.
Figure 7. Relative Change in LCOE and LCOE Components from 2014 to 2030 for (a) Onshore, (b) Fixed-Bottom Offshore, and (c) Floating Offshore Wind Projects
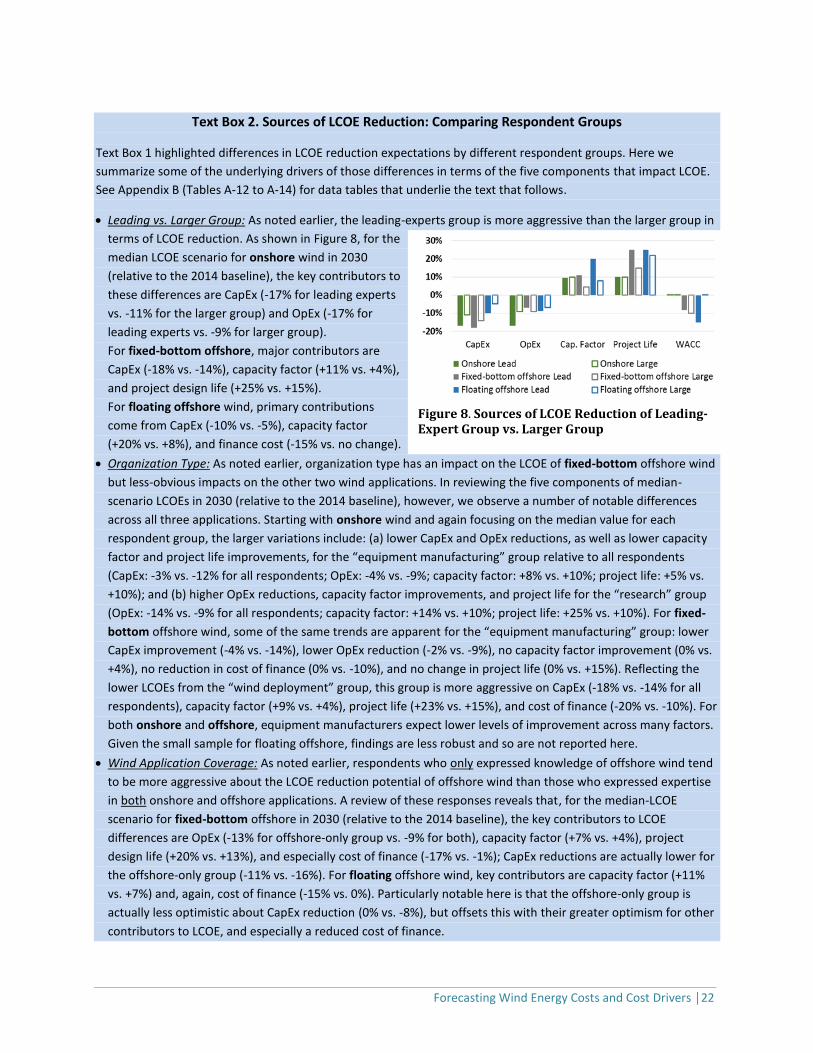
Forecasting Wind Energy Costs and Cost Drivers │22
Text Box 2. Sources of LCOE Reduction: Comparing Respondent Groups
Text Box 1 highlighted differences in LCOE reduction expectations by different respondent groups. Here we
summarize some of the underlying drivers of those differences in terms of the five components that impact LCOE.
See Appendix B (Tables A-12 to A-14) for data tables that underlie the text that follows.
Leading vs. Larger Group: As noted earlier, the leading-experts group is more aggressive than the larger group in
terms of LCOE reduction. As shown in Figure 8, for the
median LCOE scenario for onshore wind in 2030
(relative to the 2014 baseline), the key contributors to
these differences are CapEx (-17% for leading experts
vs. -11% for the larger group) and OpEx (-17% for
leading experts vs. -9% for larger group).
For fixed-bottom offshore, major contributors are
CapEx (-18% vs. -14%), capacity factor (+11% vs. +4%),
and project design life (+25% vs. +15%).
For floating offshore wind, primary contributions
come from CapEx (-10% vs. -5%), capacity factor
(+20% vs. +8%), and finance cost (-15% vs. no change).
Organization Type: As noted earlier, organization type has an impact on the LCOE of fixed-bottom offshore wind
but less-obvious impacts on the other two wind applications. In reviewing the five components of median-
scenario LCOEs in 2030 (relative to the 2014 baseline), however, we observe a number of notable differences
across all three applications. Starting with onshore wind and again focusing on the median value for each
respondent group, the larger variations include: (a) lower CapEx and OpEx reductions, as well as lower capacity
factor and project life improvements, for the “equipment manufacturing” group relative to all respondents
(CapEx: -3% vs. -12% for all respondents; OpEx: -4% vs. -9%; capacity factor: +8% vs. +10%; project life: +5% vs.
+10%); and (b) higher OpEx reductions, capacity factor improvements, and project life for the “research” group
(OpEx: -14% vs. -9% for all respondents; capacity factor: +14% vs. +10%; project life: +25% vs. +10%). For fixed-
bottom offshore wind, some of the same trends are apparent for the “equipment manufacturing” group: lower
CapEx improvement (-4% vs. -14%), lower OpEx reduction (-2% vs. -9%), no capacity factor improvement (0% vs.
+4%), no reduction in cost of finance (0% vs. -10%), and no change in project life (0% vs. +15%). Reflecting the
lower LCOEs from the “wind deployment” group, this group is more aggressive on CapEx (-18% vs. -14% for all
respondents), capacity factor (+9% vs. +4%), project life (+23% vs. +15%), and cost of finance (-20% vs. -10%). For
both onshore and offshore, equipment manufacturers expect lower levels of improvement across many factors.
Given the small sample for floating offshore, findings are less robust and so are not reported here.
Wind Application Coverage: As noted earlier, respondents who only expressed knowledge of offshore wind tend
to be more aggressive about the LCOE reduction potential of offshore wind than those who expressed expertise
in both onshore and offshore applications. A review of these responses reveals that, for the median-LCOE
scenario for fixed-bottom offshore in 2030 (relative to the 2014 baseline), the key contributors to LCOE
differences are OpEx (-13% for offshore-only group vs. -9% for both), capacity factor (+7% vs. +4%), project
design life (+20% vs. +13%), and especially cost of finance (-17% vs. -1%); CapEx reductions are actually lower for
the offshore-only group (-11% vs. -16%). For floating offshore wind, key contributors are capacity factor (+11%
vs. +7%) and, again, cost of finance (-15% vs. 0%). Particularly notable here is that the offshore-only group is
actually less optimistic about CapEx reduction (0% vs. -8%), but offsets this with their greater optimism for other
contributors to LCOE, and especially a reduced cost of finance.
Figure 8. Sources of LCOE Reduction of Leading-Expert Group vs. Larger Group
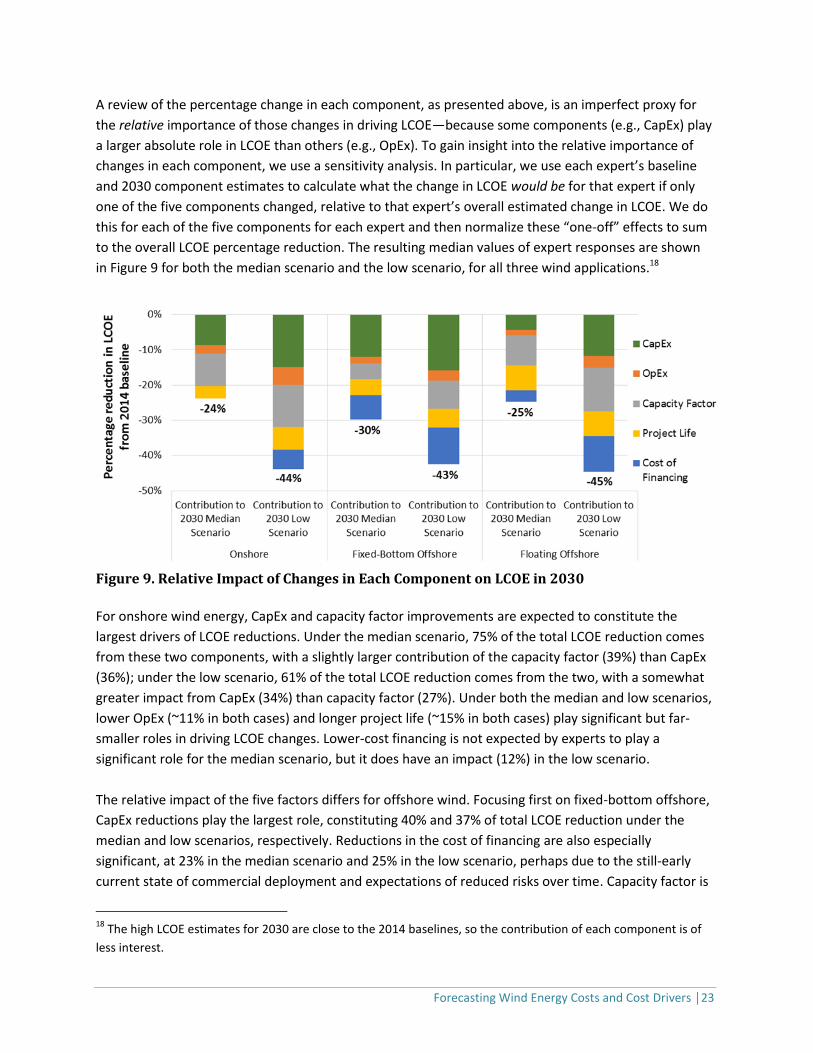
Forecasting Wind Energy Costs and Cost Drivers │23
A review of the percentage change in each component, as presented above, is an imperfect proxy for
the relative importance of those changes in driving LCOE—because some components (e.g., CapEx) play
a larger absolute role in LCOE than others (e.g., OpEx). To gain insight into the relative importance of
changes in each component, we use a sensitivity analysis. In particular, we use each expert’s baseline
and 2030 component estimates to calculate what the change in LCOE would be for that expert if only
one of the five components changed, relative to that expert’s overall estimated change in LCOE. We do
this for each of the five components for each expert and then normalize these “one-off” effects to sum
to the overall LCOE percentage reduction. The resulting median values of expert responses are shown
in Figure 9 for both the median scenario and the low scenario, for all three wind applications.18
Figure 9. Relative Impact of Changes in Each Component on LCOE in 2030
For onshore wind energy, CapEx and capacity factor improvements are expected to constitute the
largest drivers of LCOE reductions. Under the median scenario, 75% of the total LCOE reduction comes
from these two components, with a slightly larger contribution of the capacity factor (39%) than CapEx
(36%); under the low scenario, 61% of the total LCOE reduction comes from the two, with a somewhat
greater impact from CapEx (34%) than capacity factor (27%). Under both the median and low scenarios,
lower OpEx (~11% in both cases) and longer project life (~15% in both cases) play significant but far-
smaller roles in driving LCOE changes. Lower-cost financing is not expected by experts to play a
significant role for the median scenario, but it does have an impact (12%) in the low scenario.
The relative impact of the five factors differs for offshore wind. Focusing first on fixed-bottom offshore,
CapEx reductions play the largest role, constituting 40% and 37% of total LCOE reduction under the
median and low scenarios, respectively. Reductions in the cost of financing are also especially
significant, at 23% in the median scenario and 25% in the low scenario, perhaps due to the still-early
current state of commercial deployment and expectations of reduced risks over time. Capacity factor is
18
The high LCOE estimates for 2030 are close to the 2014 baselines, so the contribution of each component is of
less interest.
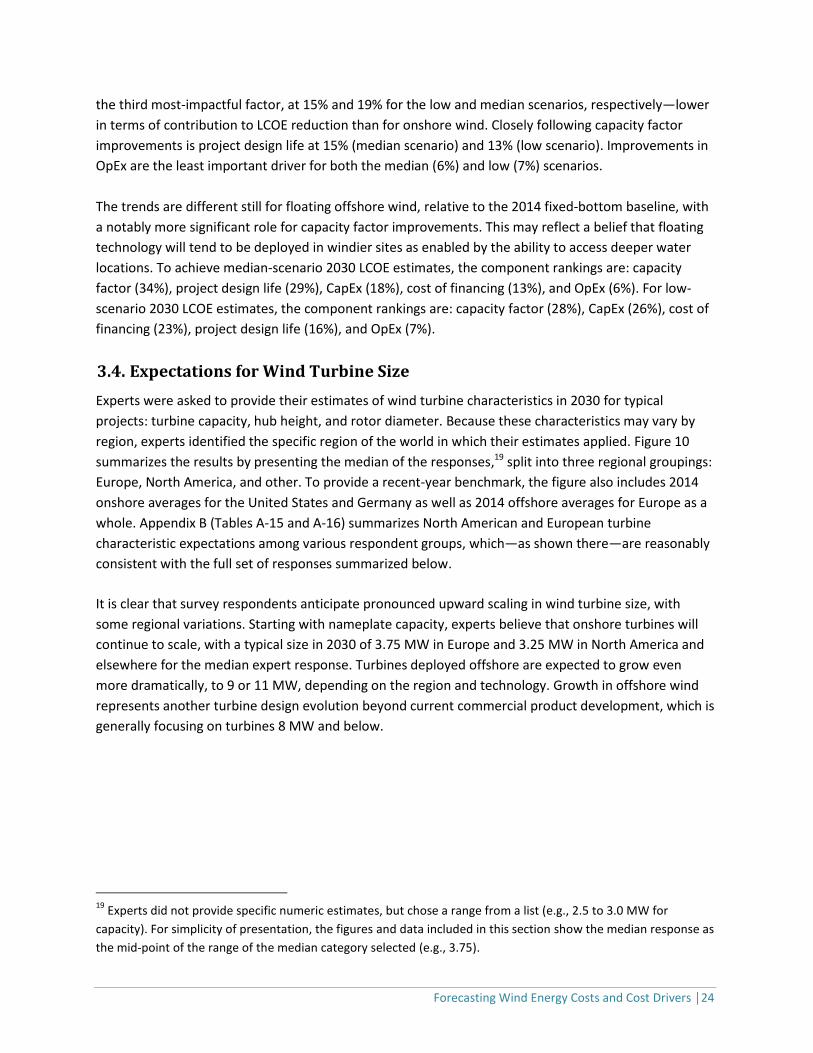
Forecasting Wind Energy Costs and Cost Drivers │24
the third most-impactful factor, at 15% and 19% for the low and median scenarios, respectively—lower
in terms of contribution to LCOE reduction than for onshore wind. Closely following capacity factor
improvements is project design life at 15% (median scenario) and 13% (low scenario). Improvements in
OpEx are the least important driver for both the median (6%) and low (7%) scenarios.
The trends are different still for floating offshore wind, relative to the 2014 fixed-bottom baseline, with
a notably more significant role for capacity factor improvements. This may reflect a belief that floating
technology will tend to be deployed in windier sites as enabled by the ability to access deeper water
locations. To achieve median-scenario 2030 LCOE estimates, the component rankings are: capacity
factor (34%), project design life (29%), CapEx (18%), cost of financing (13%), and OpEx (6%). For low-
scenario 2030 LCOE estimates, the component rankings are: capacity factor (28%), CapEx (26%), cost of
financing (23%), project design life (16%), and OpEx (7%).
3.4. Expectations for Wind Turbine Size
Experts were asked to provide their estimates of wind turbine characteristics in 2030 for typical
projects: turbine capacity, hub height, and rotor diameter. Because these characteristics may vary by
region, experts identified the specific region of the world in which their estimates applied. Figure 10
summarizes the results by presenting the median of the responses,19 split into three regional groupings:
Europe, North America, and other. To provide a recent-year benchmark, the figure also includes 2014
onshore averages for the United States and Germany as well as 2014 offshore averages for Europe as a
whole. Appendix B (Tables A-15 and A-16) summarizes North American and European turbine
characteristic expectations among various respondent groups, which—as shown there—are reasonably
consistent with the full set of responses summarized below.
It is clear that survey respondents anticipate pronounced upward scaling in wind turbine size, with
some regional variations. Starting with nameplate capacity, experts believe that onshore turbines will
continue to scale, with a typical size in 2030 of 3.75 MW in Europe and 3.25 MW in North America and
elsewhere for the median expert response. Turbines deployed offshore are expected to grow even
more dramatically, to 9 or 11 MW, depending on the region and technology. Growth in offshore wind
represents another turbine design evolution beyond current commercial product development, which is
generally focusing on turbines 8 MW and below.
19
Experts did not provide specific numeric estimates, but chose a range from a list (e.g., 2.5 to 3.0 MW for
capacity). For simplicity of presentation, the figures and data included in this section show the median response as
the mid-point of the range of the median category selected (e.g., 3.75).
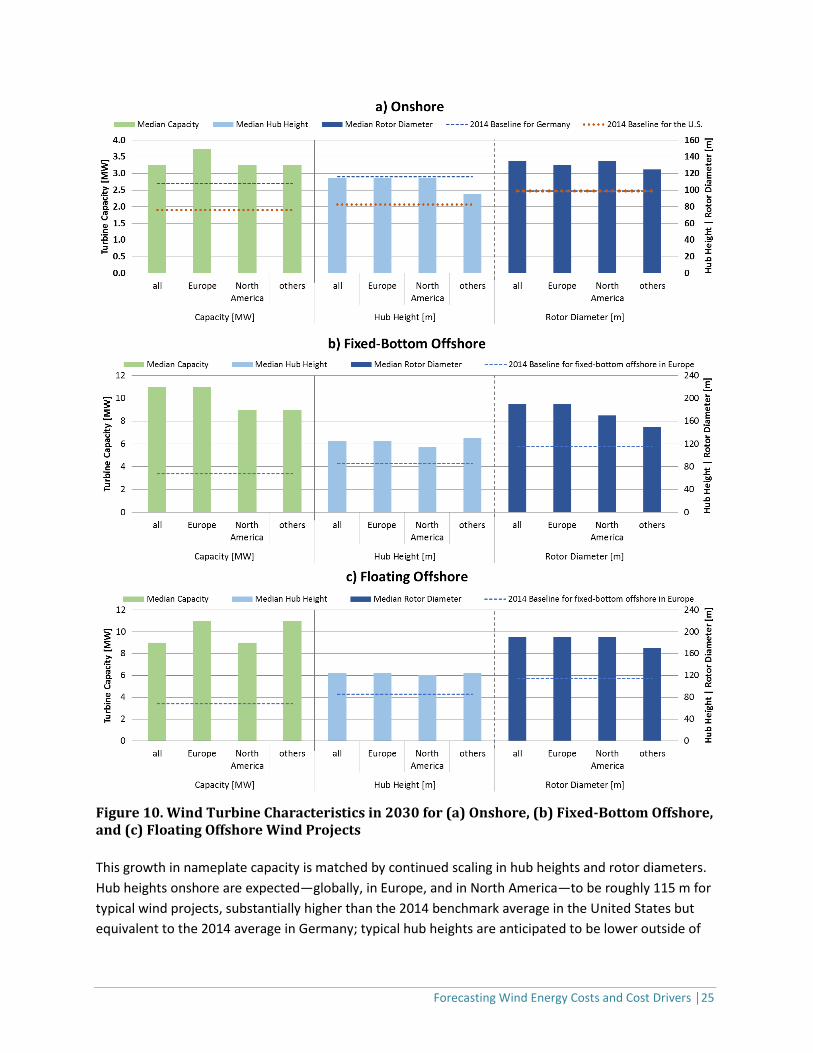
Forecasting Wind Energy Costs and Cost Drivers │25
Figure 10. Wind Turbine Characteristics in 2030 for (a) Onshore, (b) Fixed-Bottom Offshore, and (c) Floating Offshore Wind Projects
This growth in nameplate capacity is matched by continued scaling in hub heights and rotor diameters.
Hub heights onshore are expected—globally, in Europe, and in North America—to be roughly 115 m for
typical wind projects, substantially higher than the 2014 benchmark average in the United States but
equivalent to the 2014 average in Germany; typical hub heights are anticipated to be lower outside of

Forecasting Wind Energy Costs and Cost Drivers │26
Europe and North America. Increased hub heights offshore are also expected, to roughly 125 m, though
with some modest regional variation. Turning to rotor diameters, onshore averages are expected to
reach roughly 135 m for typical projects, with some regional variations, while median offshore
estimates equal 190 m, though again with some regional differences.
Overall, for offshore wind, expectations are for somewhat smaller turbines—capacity, hub height, and
rotor diameters—in North America than in Europe. While the reasons for this modest divergence are
unclear, it might be hypothesized that, as the leading offshore market globally, European projects may
be expected to remain on the leading edge of technology deployment. Experts may simply believe that
offshore development in North America, a lagging market, will emphasize somewhat smaller turbines
for which greater commercial experience exists.
All of these results reflect expectations for typical wind projects deployed in 2030; in reality, turbines
used in 2030 will—of course—span a wide range, depending on site characteristics. Moreover, the
results presented here represent median expert responses, but experts have divergent views on the
degree of future scaling; accordingly, Appendix B shows the distribution of expert responses in
histogram form (Figure A-6), and it presents median responses based on different respondent
groupings (Tables A-15 and A-16).
Finally, we calculated the implied 2030 turbine specific power20 for each expert, with
Figure 11 summarizing median responses for that metric. As shown, the median specific power
estimate for onshore wind is roughly 260 W/m2, with lower estimates for North America (250 W/m2)
and somewhat higher estimates in Europe and especially outside of Europe and North America. These
specific power estimates are similar to 2014 averages from the United States, and they demonstrate
that specific power is expected to decline globally by 2030, but only to the current averages already
seen in the United States. In North America, continued reductions in average specific power are not
anticipated, through 2030.
Turning to offshore wind, estimates of typical specific power in 2030 vary regionally, but with a rough
average of 375 W/m2 for fixed-bottom offshore and 390 W/m2 for floating offshore installations, slightly
higher than the 2014 European averages of 325 W/m2 and considerably higher than the 2030 estimates
for onshore wind. The higher specific power for offshore wind—whether fixed-bottom or floating—in
concert with other survey findings suggests that experts are prioritizing turbine capacity scaling (with
proportional rotor scaling) and associated CapEx reductions in reducing offshore LCOE, whereas, for
onshore wind, the declining global specific power reflects a more significant role for capacity factor
improvements in driving LCOE trends. Appendix B offers a closer look at the distribution of the experts’
implicit estimates of specific power (Figure A-7).
20
Specific power was calculated by dividing the turbine capacity by the rotor swept area, a function of rotor
diameter; because turbine characteristics were presented as ranges (e.g., 4–5 MW), we used midpoints of each
range for turbine capacity and for turbine rotor diameter to estimate the specific power for each expert.
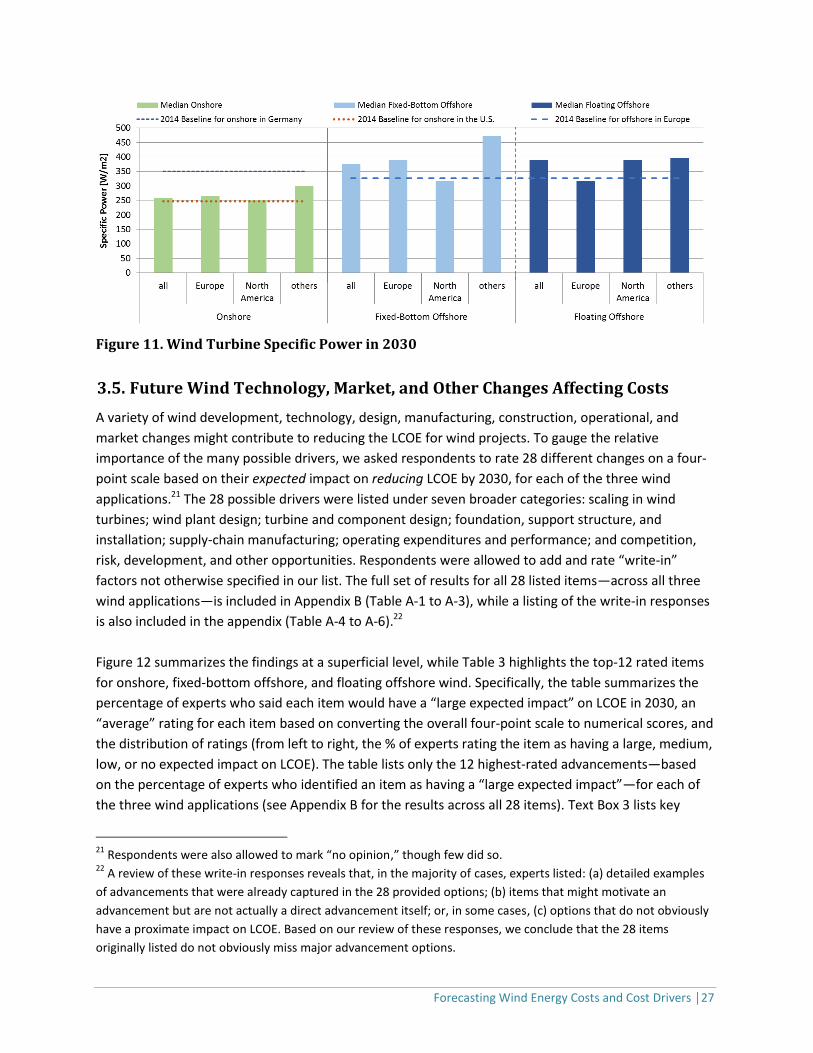
Forecasting Wind Energy Costs and Cost Drivers │27
Figure 11. Wind Turbine Specific Power in 2030
3.5. Future Wind Technology, Market, and Other Changes Affecting Costs
A variety of wind development, technology, design, manufacturing, construction, operational, and
market changes might contribute to reducing the LCOE for wind projects. To gauge the relative
importance of the many possible drivers, we asked respondents to rate 28 different changes on a four-
point scale based on their expected impact on reducing LCOE by 2030, for each of the three wind
applications.21 The 28 possible drivers were listed under seven broader categories: scaling in wind
turbines; wind plant design; turbine and component design; foundation, support structure, and
installation; supply-chain manufacturing; operating expenditures and performance; and competition,
risk, development, and other opportunities. Respondents were allowed to add and rate “write-in”
factors not otherwise specified in our list. The full set of results for all 28 listed items—across all three
wind applications—is included in Appendix B (Table A-1 to A-3), while a listing of the write-in responses
is also included in the appendix (Table A-4 to A-6).22
Figure 12 summarizes the findings at a superficial level, while Table 3 highlights the top-12 rated items
for onshore, fixed-bottom offshore, and floating offshore wind. Specifically, the table summarizes the
percentage of experts who said each item would have a “large expected impact” on LCOE in 2030, an
“average” rating for each item based on converting the overall four-point scale to numerical scores, and
the distribution of ratings (from left to right, the % of experts rating the item as having a large, medium,
low, or no expected impact on LCOE). The table lists only the 12 highest-rated advancements—based
on the percentage of experts who identified an item as having a “large expected impact”—for each of
the three wind applications (see Appendix B for the results across all 28 items). Text Box 3 lists key
21
Respondents were also allowed to mark “no opinion,” though few did so. 22
A review of these write-in responses reveals that, in the majority of cases, experts listed: (a) detailed examples
of advancements that were already captured in the 28 provided options; (b) items that might motivate an
advancement but are not actually a direct advancement itself; or, in some cases, (c) options that do not obviously
have a proximate impact on LCOE. Based on our review of these responses, we conclude that the 28 items
originally listed do not obviously miss major advancement options.
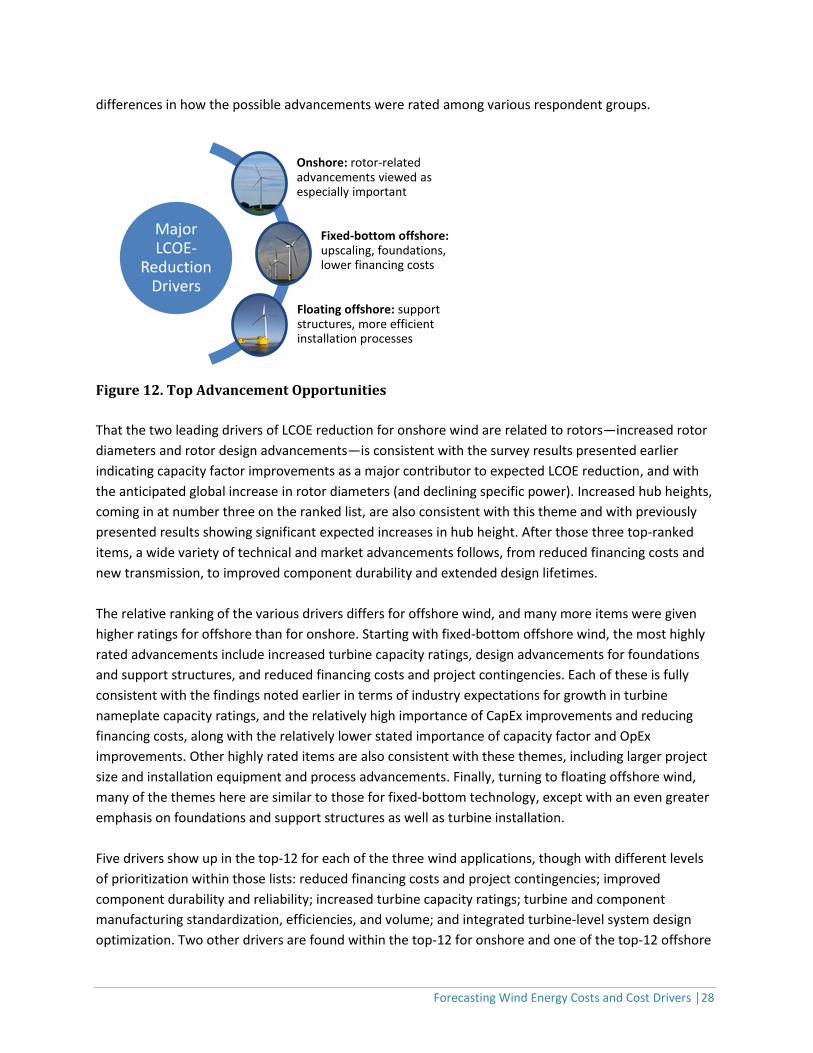
Forecasting Wind Energy Costs and Cost Drivers │28
differences in how the possible advancements were rated among various respondent groups.
Figure 12. Top Advancement Opportunities
That the two leading drivers of LCOE reduction for onshore wind are related to rotors—increased rotor
diameters and rotor design advancements—is consistent with the survey results presented earlier
indicating capacity factor improvements as a major contributor to expected LCOE reduction, and with
the anticipated global increase in rotor diameters (and declining specific power). Increased hub heights,
coming in at number three on the ranked list, are also consistent with this theme and with previously
presented results showing significant expected increases in hub height. After those three top-ranked
items, a wide variety of technical and market advancements follows, from reduced financing costs and
new transmission, to improved component durability and extended design lifetimes.
The relative ranking of the various drivers differs for offshore wind, and many more items were given
higher ratings for offshore than for onshore. Starting with fixed-bottom offshore wind, the most highly
rated advancements include increased turbine capacity ratings, design advancements for foundations
and support structures, and reduced financing costs and project contingencies. Each of these is fully
consistent with the findings noted earlier in terms of industry expectations for growth in turbine
nameplate capacity ratings, and the relatively high importance of CapEx improvements and reducing
financing costs, along with the relatively lower stated importance of capacity factor and OpEx
improvements. Other highly rated items are also consistent with these themes, including larger project
size and installation equipment and process advancements. Finally, turning to floating offshore wind,
many of the themes here are similar to those for fixed-bottom technology, except with an even greater
emphasis on foundations and support structures as well as turbine installation.
Five drivers show up in the top-12 for each of the three wind applications, though with different levels
of prioritization within those lists: reduced financing costs and project contingencies; improved
component durability and reliability; increased turbine capacity ratings; turbine and component
manufacturing standardization, efficiencies, and volume; and integrated turbine-level system design
optimization. Two other drivers are found within the top-12 for onshore and one of the top-12 offshore
Major LCOE-
Reduction Drivers
Onshore: rotor-related advancements viewed as especially important
Fixed-bottom offshore: upscaling, foundations, lower financing costs
Floating offshore: support structures, more efficient installation processes

Forecasting Wind Energy Costs and Cost Drivers │29
lists: rotor design advancements and extended turbine design lifetimes. The remaining items are more
exclusive to either onshore or offshore wind, but not both. For example, increased rotor diameters and
tower heights, new transmission, operating efficiencies, and improved plant layout are included in the
top-12 list for onshore wind, but not for offshore. Similarly, a wide variety of foundation, support
structure, installation, and transportation advancements as well as increased competition and project
size are embedded in the top-12 lists for offshore wind, but not for onshore wind.
Experts identify some items as having no or negligible effect on reducing LCOE by 2030. As shown in
Appendix B, for onshore wind, these include: lower decommissioning costs, reduced fixed operation
and maintenance costs, installation process efficiencies, altered siting and permitting procedures,
foundation design and manufacturing advancements, maintenance equipment advancements, and non-
conventional turbine designs. For offshore wind, some of the same themes are evident, but added to
those are site-specific turbine designs, non-conventional plant layouts, and increased tower height and
tower design advancements.
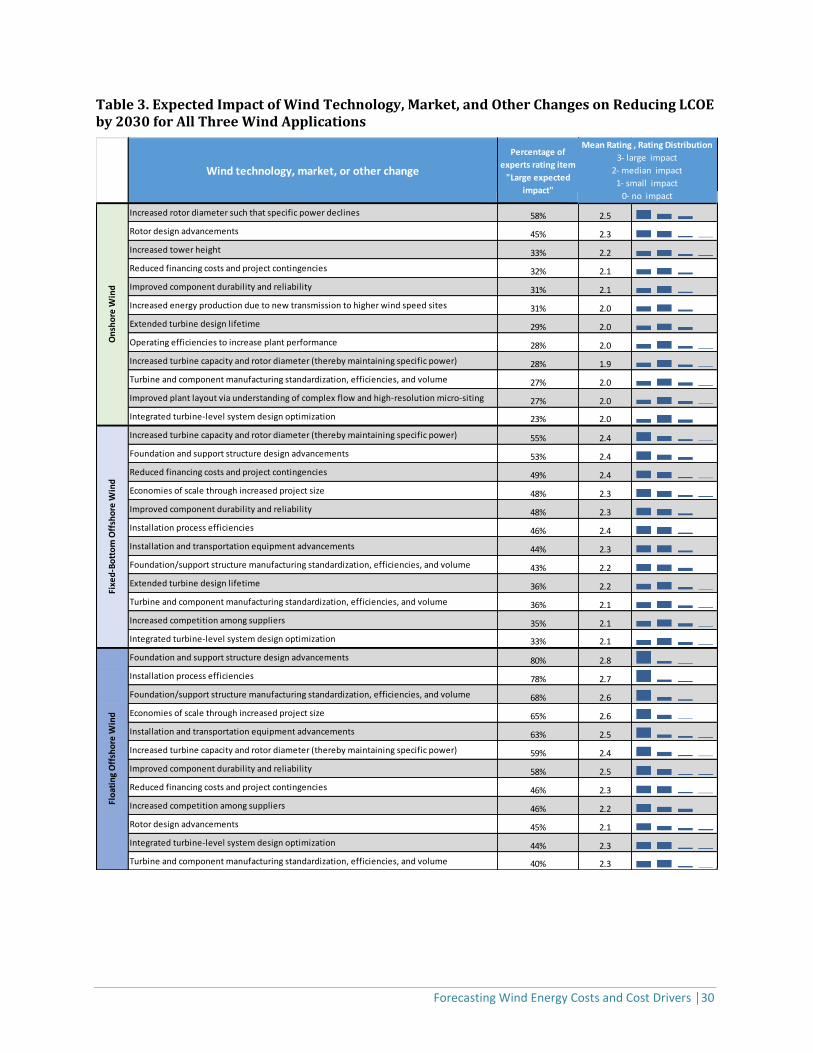
Forecasting Wind Energy Costs and Cost Drivers │30
Table 3. Expected Impact of Wind Technology, Market, and Other Changes on Reducing LCOE by 2030 for All Three Wind Applications
Wind technology, market, or other change
Percentage of
experts rating item
"Large expected
impact"
Mean rating
Distribution of
expected impact
ratings
Increased rotor diameter such that specific power declines 58% 2.5
Rotor design advancements 45% 2.3
Increased tower height 33% 2.2
Reduced financing costs and project contingencies 32% 2.1
Improved component durability and reliability 31% 2.1
Increased energy production due to new transmission to higher wind speed sites 31% 2.0
Extended turbine design lifetime 29% 2.0
Operating efficiencies to increase plant performance 28% 2.0
Increased turbine capacity and rotor diameter (thereby maintaining specific power) 28% 1.9
Turbine and component manufacturing standardization, efficiencies, and volume 27% 2.0
Improved plant layout via understanding of complex flow and high-resolution micro-siting 27% 2.0
Integrated turbine-level system design optimization 23% 2.0
Increased turbine capacity and rotor diameter (thereby maintaining specific power) 55% 2.4
Foundation and support structure design advancements 53% 2.4
Reduced financing costs and project contingencies 49% 2.4
Economies of scale through increased project size 48% 2.3
Improved component durability and reliability 48% 2.3
Installation process efficiencies 46% 2.4
Installation and transportation equipment advancements 44% 2.3
Foundation/support structure manufacturing standardization, efficiencies, and volume 43% 2.2
Extended turbine design lifetime 36% 2.2
Turbine and component manufacturing standardization, efficiencies, and volume 36% 2.1
Increased competition among suppliers 35% 2.1
Integrated turbine-level system design optimization 33% 2.1
Foundation and support structure design advancements 80% 2.8
Installation process efficiencies 78% 2.7
Foundation/support structure manufacturing standardization, efficiencies, and volume 68% 2.6
Economies of scale through increased project size 65% 2.6
Installation and transportation equipment advancements 63% 2.5
Increased turbine capacity and rotor diameter (thereby maintaining specific power) 59% 2.4
Improved component durability and reliability 58% 2.5
Reduced financing costs and project contingencies 46% 2.3
Increased competition among suppliers 46% 2.2
Rotor design advancements 45% 2.1
Integrated turbine-level system design optimization 44% 2.3
Turbine and component manufacturing standardization, efficiencies, and volume 40% 2.3
On
sho
re W
ind
Fixe
d-B
ott
om
Off
sho
re W
ind
Flo
atin
g O
ffsh
ore
Win
d
Mean Rating , Rating Distribution
3- large impact
2- median impact
1- small impact
0- no impact

Forecasting Wind Energy Costs and Cost Drivers │31
Text Box 3. Technology, Market, and Other Changes Affecting LCOE: Comparing Respondent Groups
As presented in tabular form in Appendix B (Table A-17 to A-19), there is a substantial consistency across
respondent groups in how the technology, market, and other changes are ranked based on expected impact on
LCOE. There are, however some interesting differences, some of which are summarized below. Note that we focus
on the leading-expert vs. larger-group distinction and on different organization types; we emphasize only items
prioritized within the top-12 of at least one of the two groups being compared, and we only highlight those items
that are at least five ranks different between the two comparison groups.
Onshore Wind: All respondent categories agree about the importance of increased rotor diameters and related
rotor design advancements, and the various respondent categories agree—in broad terms—to the full ranking of
items. The leading-expert group, however, places a number of items higher on its rank-ordered list in comparison
to the larger group, notable examples of which include: improved plant-level layout; increased competition among
suppliers; and installation and transportation equipment advancements. The leading-expert group places lower on
its list—comparatively—items such as: turbine and component manufacturing standardization, efficiencies, and
volume; increased turbine capacity; and reduced financing costs and contingencies.
Fixed-Bottom Offshore Wind: Again, the various respondent types agree—in broad terms—to the full ranking of
items. The leading-expert group, however, places a number of items higher on its list in comparison to the larger
group, including: improved component durability and reliability, extended turbine design lifetime, rotor design
advancements, maintenance process efficiencies, operating efficiencies to increase plant performance, and
increased energy production due to new transmission. The leading-expert group places lower on its list items such
as: integrated turbine-level system design optimization; turbine and component manufacturing standardization,
efficiencies, and volume; foundation and support structure manufacturing standardization, efficiencies, and
volume; installation process efficiencies; and reduced financing costs and contingencies.
Floating Offshore Wind: Notwithstanding the smaller respondent sample for floating offshore wind, many of the
respondent categories again generally agree to the full ranking of items. The leading-expert group places a number
of items higher on its list, including: increased turbine capacity, integrated turbine-level system design
optimization, innovative non-conventional turbine designs, tower design advancements, nacelle components
design advancements, operating efficiencies to increase plant performance, and improved plant-level layout. The
leading-expert group places lower on its list items such as: extended turbine design lifetime; turbine and
component manufacturing standardization, efficiencies, and volume; and increased competition among suppliers.
Differences by organization type match expectations. The research group, for example, tends to rank emerging
areas of research as more important. For onshore wind, this means comparatively higher rankings for: improved
plant-level layout, integrated turbine-level system design optimization, and innovative non-conventional plant-
level layouts. For floating offshore wind, integrated turbine-level system design optimization, innovative non-
conventional turbine designs, and tower design advancements all rank comparatively higher. Equipment
manufacturers, on the other hand, tend to focus on issues related to component and equipment design,
manufacturing, and installation. As one example, for onshore wind, this means higher rankings for: turbine and
component manufacturing standardization, efficiencies, and volume; large variety of alternative turbine designs to
suit site-specific conditions; and innovative non-conventional turbine designs. Finally, the wind deployment group
tends to place additional emphasis on matters related to development and operations. For fixed-bottom offshore
wind, as one example, this means comparatively higher rankings for: extended turbine design lifetime; increased
competition among suppliers; and reduced fixed operating costs, excluding maintenance.

Forecasting Wind Energy Costs and Cost Drivers │32
3.6. Broad Market, Policy, and R&D Conditions Enabling Low LCOE
Whether future LCOE trends generally follow the low-, median-, or high-scenario estimates is—in part—
under the control of public and private decision makers. As such, in a final question, we asked experts
to rank four broad drivers that might enable achieving low-scenario LCOE (as opposed to median-
scenario LCOE) in 2030 for onshore and fixed-bottom offshore wind separately (we did not ask a similar
question for floating offshore wind). The four drivers were defined as:
Research and Development: Breakthrough discoveries and technological innovation resulting from
public- and private-sector research and development
Learning with Market Growth: Incremental technical, manufacturing, process, and/or workforce-
efficiency improvements resulting from learning with market growth
Increased Competition and Decreased Risk: Lower contingencies and greater competition within
the supply chain resulting from market maturity and reduced technology and construction risk
Eased Wind Project and Transmission Siting: Reduced development costs and/or increased access
to higher wind resources resulting from conditions that ease wind project and transmission siting
Table 4 shows the overall expert rankings of these four drivers. In particular, the table shows the
percentage of experts who ranked each item as the most important, an “average” rank for each item,
and the distribution of rankings (from left to right, the % of experts ranking each driver as 1, 2, 3, 4, or
lower than 4). Respondents were allowed to add and rank additional “write-in” items—a listing of those
write-in responses is included in Appendix B (Table A-7 and A-8).23 Text Box 4 highlights key differences
in how these broad drivers were rated among various respondent groups.
Overall, respondents ranked “learning with market growth,” followed closely by “research and
development,” as the two leading drivers for achieving low LCOE estimates, and they did so for both
onshore and offshore wind. Experts clearly view these two items as the highest priority items for
achieving low-scenario LCOE estimates. For onshore wind, “increased competition and decreased risk”
and then “eased wind project and transmission siting” followed. For offshore wind, these last two items
were switched in order. Somewhat surprising is the low ranking of “increased competition and
decreased risk” for offshore wind energy, given the current state of the offshore wind sector.24
23
A review of write-in responses reveals that most are consistent in tone and detail with the question and results
discussed in Section 3.6: no obvious major “broad driver” was missed in our question formulation. 24
Note that the question asked respondents to rank these drivers based on their expected impact in achieving the
low-scenario LCOE estimates in 2030 as opposed to median-scenario estimates in 2030. Presuming that this
careful wording was understood by respondents, experts might believe that “increased competition and
decreased risk” is important in driving LCOE towards median-scenario values in 2030, but that there is relatively
limited incremental opportunity for that driver to motivate even-lower LCOE.
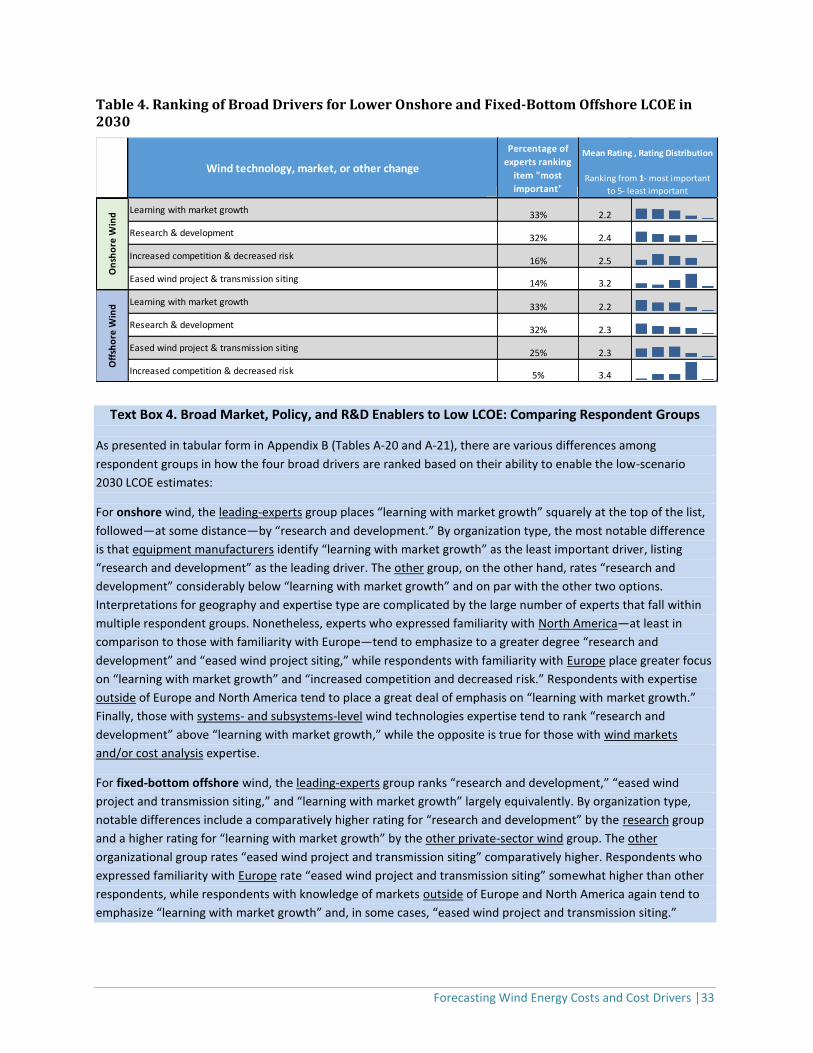
Forecasting Wind Energy Costs and Cost Drivers │33
Table 4. Ranking of Broad Drivers for Lower Onshore and Fixed-Bottom Offshore LCOE in 2030
Text Box 4. Broad Market, Policy, and R&D Enablers to Low LCOE: Comparing Respondent Groups
As presented in tabular form in Appendix B (Tables A-20 and A-21), there are various differences among
respondent groups in how the four broad drivers are ranked based on their ability to enable the low-scenario
2030 LCOE estimates:
For onshore wind, the leading-experts group places “learning with market growth” squarely at the top of the list,
followed—at some distance—by “research and development.” By organization type, the most notable difference
is that equipment manufacturers identify “learning with market growth” as the least important driver, listing
“research and development” as the leading driver. The other group, on the other hand, rates “research and
development” considerably below “learning with market growth” and on par with the other two options.
Interpretations for geography and expertise type are complicated by the large number of experts that fall within
multiple respondent groups. Nonetheless, experts who expressed familiarity with North America—at least in
comparison to those with familiarity with Europe—tend to emphasize to a greater degree “research and
development” and “eased wind project siting,” while respondents with familiarity with Europe place greater focus
on “learning with market growth” and “increased competition and decreased risk.” Respondents with expertise
outside of Europe and North America tend to place a great deal of emphasis on “learning with market growth.”
Finally, those with systems- and subsystems-level wind technologies expertise tend to rank “research and
development” above “learning with market growth,” while the opposite is true for those with wind markets
and/or cost analysis expertise.
For fixed-bottom offshore wind, the leading-experts group ranks “research and development,” “eased wind
project and transmission siting,” and “learning with market growth” largely equivalently. By organization type,
notable differences include a comparatively higher rating for “research and development” by the research group
and a higher rating for “learning with market growth” by the other private-sector wind group. The other
organizational group rates “eased wind project and transmission siting” comparatively higher. Respondents who
expressed familiarity with Europe rate “eased wind project and transmission siting” somewhat higher than other
respondents, while respondents with knowledge of markets outside of Europe and North America again tend to
emphasize “learning with market growth” and, in some cases, “eased wind project and transmission siting.”
Wind technology, market, or other change
Percentage of
experts ranking
item "most
important"
Mean rating
Distribution of
expected impact
ratings
Learning with market growth33% 2.2
Research & development32% 2.4
Increased competition & decreased risk 16% 2.5
Eased wind project & transmission siting 14% 3.2
Learning with market growth33% 2.2
Research & development32% 2.3
Eased wind project & transmission siting25% 2.3
Increased competition & decreased risk 5% 3.4
On
sho
re W
ind
Off
sho
re W
ind
Mean Rating , Rating Distribution
Ranking from 1- most important
to 5- least important
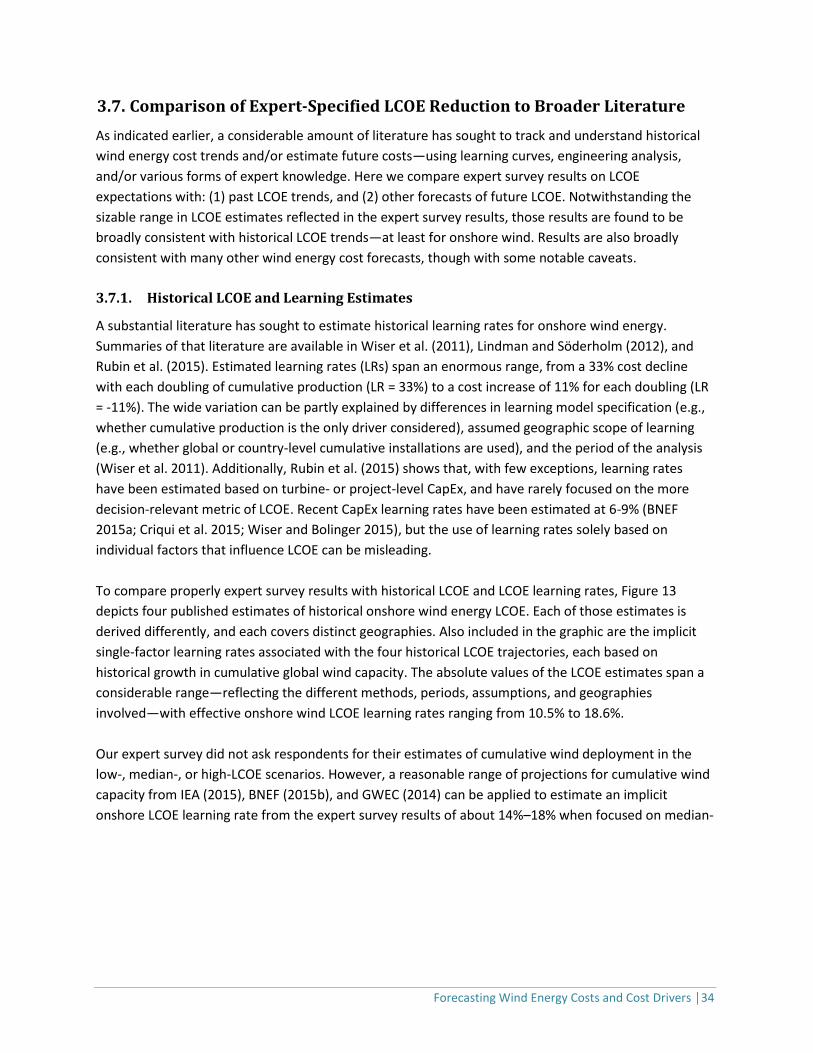
Forecasting Wind Energy Costs and Cost Drivers │34
3.7. Comparison of Expert-Specified LCOE Reduction to Broader Literature
As indicated earlier, a considerable amount of literature has sought to track and understand historical
wind energy cost trends and/or estimate future costs—using learning curves, engineering analysis,
and/or various forms of expert knowledge. Here we compare expert survey results on LCOE
expectations with: (1) past LCOE trends, and (2) other forecasts of future LCOE. Notwithstanding the
sizable range in LCOE estimates reflected in the expert survey results, those results are found to be
broadly consistent with historical LCOE trends—at least for onshore wind. Results are also broadly
consistent with many other wind energy cost forecasts, though with some notable caveats.
3.7.1. Historical LCOE and Learning Estimates
A substantial literature has sought to estimate historical learning rates for onshore wind energy.
Summaries of that literature are available in Wiser et al. (2011), Lindman and Söderholm (2012), and
Rubin et al. (2015). Estimated learning rates (LRs) span an enormous range, from a 33% cost decline
with each doubling of cumulative production (LR = 33%) to a cost increase of 11% for each doubling (LR
= -11%). The wide variation can be partly explained by differences in learning model specification (e.g.,
whether cumulative production is the only driver considered), assumed geographic scope of learning
(e.g., whether global or country-level cumulative installations are used), and the period of the analysis
(Wiser et al. 2011). Additionally, Rubin et al. (2015) shows that, with few exceptions, learning rates
have been estimated based on turbine- or project-level CapEx, and have rarely focused on the more
decision-relevant metric of LCOE. Recent CapEx learning rates have been estimated at 6-9% (BNEF
2015a; Criqui et al. 2015; Wiser and Bolinger 2015), but the use of learning rates solely based on
individual factors that influence LCOE can be misleading.
To compare properly expert survey results with historical LCOE and LCOE learning rates, Figure 13
depicts four published estimates of historical onshore wind energy LCOE. Each of those estimates is
derived differently, and each covers distinct geographies. Also included in the graphic are the implicit
single-factor learning rates associated with the four historical LCOE trajectories, each based on
historical growth in cumulative global wind capacity. The absolute values of the LCOE estimates span a
considerable range—reflecting the different methods, periods, assumptions, and geographies
involved—with effective onshore wind LCOE learning rates ranging from 10.5% to 18.6%.
Our expert survey did not ask respondents for their estimates of cumulative wind deployment in the
low-, median-, or high-LCOE scenarios. However, a reasonable range of projections for cumulative wind
capacity from IEA (2015), BNEF (2015b), and GWEC (2014) can be applied to estimate an implicit
onshore LCOE learning rate from the expert survey results of about 14%–18% when focused on median-
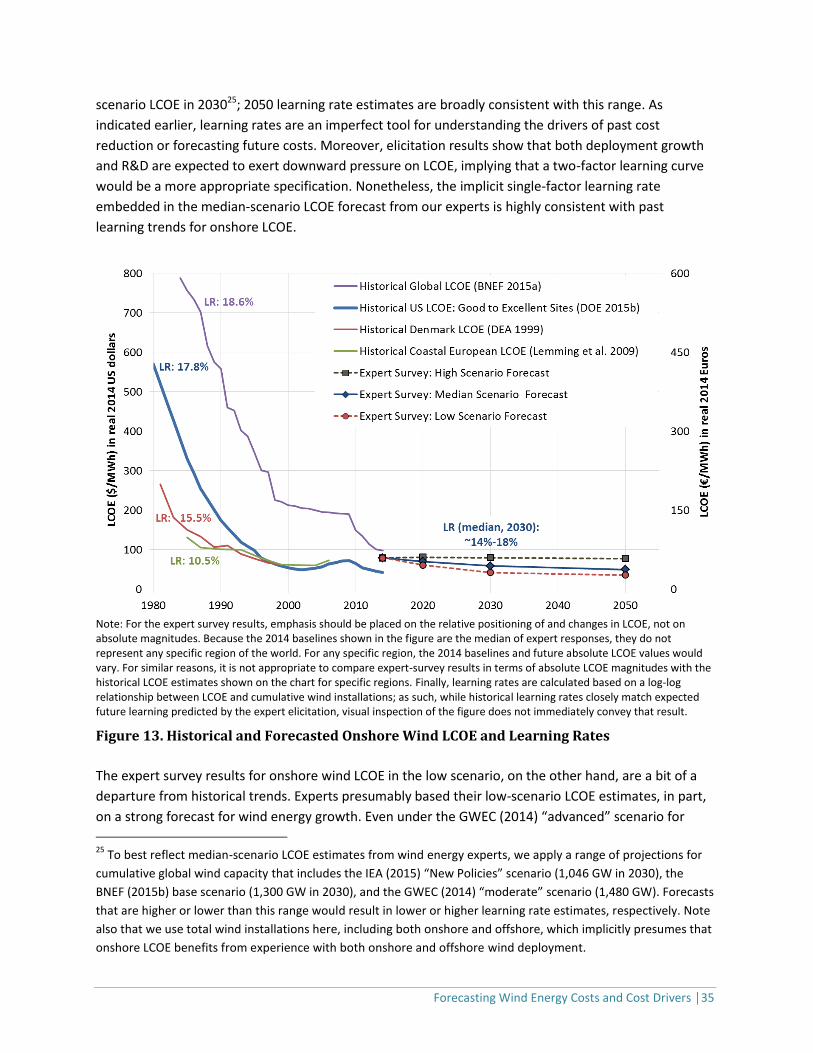
Forecasting Wind Energy Costs and Cost Drivers │35
scenario LCOE in 203025; 2050 learning rate estimates are broadly consistent with this range. As
indicated earlier, learning rates are an imperfect tool for understanding the drivers of past cost
reduction or forecasting future costs. Moreover, elicitation results show that both deployment growth
and R&D are expected to exert downward pressure on LCOE, implying that a two-factor learning curve
would be a more appropriate specification. Nonetheless, the implicit single-factor learning rate
embedded in the median-scenario LCOE forecast from our experts is highly consistent with past
learning trends for onshore LCOE.
Note: For the expert survey results, emphasis should be placed on the relative positioning of and changes in LCOE, not on absolute magnitudes. Because the 2014 baselines shown in the figure are the median of expert responses, they do not represent any specific region of the world. For any specific region, the 2014 baselines and future absolute LCOE values would vary. For similar reasons, it is not appropriate to compare expert-survey results in terms of absolute LCOE magnitudes with the historical LCOE estimates shown on the chart for specific regions. Finally, learning rates are calculated based on a log-log relationship between LCOE and cumulative wind installations; as such, while historical learning rates closely match expected future learning predicted by the expert elicitation, visual inspection of the figure does not immediately convey that result.
Figure 13. Historical and Forecasted Onshore Wind LCOE and Learning Rates
The expert survey results for onshore wind LCOE in the low scenario, on the other hand, are a bit of a
departure from historical trends. Experts presumably based their low-scenario LCOE estimates, in part,
on a strong forecast for wind energy growth. Even under the GWEC (2014) “advanced” scenario for
25
To best reflect median-scenario LCOE estimates from wind energy experts, we apply a range of projections for
cumulative global wind capacity that includes the IEA (2015) “New Policies” scenario (1,046 GW in 2030), the
BNEF (2015b) base scenario (1,300 GW in 2030), and the GWEC (2014) “moderate” scenario (1,480 GW). Forecasts
that are higher or lower than this range would result in lower or higher learning rate estimates, respectively. Note
also that we use total wind installations here, including both onshore and offshore, which implicitly presumes that
onshore LCOE benefits from experience with both onshore and offshore wind deployment.

Forecasting Wind Energy Costs and Cost Drivers │36
wind deployment (1,900 GW in 2030; 4,040 GW in 2050), however, resulting implicit learning rates are
23% (2030) and 21% (2050)—higher than estimated historical rates of LCOE learning. Under the lower
GWEC “moderate” scenario for future wind capacity, implicit learning rates are even higher: 27% (2030)
and 25% (2050). To be sure, these implicit learning rates (as well as the ones calculated earlier) may
overstate the actual rate of expected learning. Specifically, these rates do not account for the fact that
aging wind turbines would need to be replaced over the duration of the forecast period to 2030 and—
especially—2050. Were those replacement turbines considered in the cumulative wind capacity
forecasts, estimated learning rates would be lower. As one example, if one assumes full repowering
after a 20-year project life, then the GWEC (2014) “advanced” scenario would require a total wind
turbine installation level of roughly 2,130 GW in 2030 and 5,980 GW in 2050, yielding implicit learning
rates for onshore wind under the low-LCOE scenario of 22% (2030) and 18% (2050)—closer to historical
learning rates, at least in the 2050 timeframe.
Turning to offshore wind, historical cost trends are mixed, with an initial reduction in costs for the first
fixed-bottom offshore wind installations in the 1990s, following by steeply increasing costs in the 2000s
and, most recently, some indication of cost reductions (IRENA 2015; Smith et al. 2015; Voormolen et al.
2016; Willow and Valpy 2015). Given this history—and the limited amount of total deployment—there
have been few attempts to fit a learning curve to offshore data. van der Zwaan (2012) finds a learning
rate of 3%–5% when focused on CapEx, whereas Dismukes and Upton (2015) find little evidence of
learning thus far. Others conclude that a simple learning curve cannot readily be used to explain
historical cost developments (Voormolen et al. 2016). It is also unclear what learning specification
might best be used to understand past trends or to forecast future ones. Offshore wind technology is
distinct from onshore, and so cumulative offshore installed capacity might be reasonably viewed as the
primary driver for LCOE reduction in a single-factor learning estimate. There is obvious overlap in
onshore and offshore turbine-related learning, however, such that continued future onshore wind
deployment might also contribute to future offshore LCOE reductions.
As with onshore wind, the expert survey did not ask respondents for their estimate of cumulative
offshore wind deployment. However, when applying an offshore-only forecast of cumulative wind
power capacity from BNEF (2016) of 123 GW by 2030, an implicit fixed-bottom offshore learning rate of
8% is estimated for the median-scenario 2030 LCOE estimates and 13% for low-scenario 2030
estimates.26 These rates are considerably lower than those estimated previously for onshore wind. In
contrast, if one applies a range of projections for cumulative total (onshore and offshore) wind capacity
from IEA (2015), BNEF (2015b), and GWEC (2014) (which, while much greater in total capacity terms,
leads to fewer total “doublings” of capacity given the higher starting point in 2014), then implicit LCOE
learning rates from the expert survey range from about 16%–20% when focused on median LCOE in
2030. This learning rate range is somewhat higher than but closer to the range for onshore wind.
Overall, these results for offshore wind suggest that experts either anticipate lower offshore-only
learning (relative to learning for onshore wind) or expect learning spillovers from onshore to offshore.
26
We do not calculate implicit learning rates for floating offshore wind.

Forecasting Wind Energy Costs and Cost Drivers │37
3.7.2. Forecasts for Future LCOE Reduction
It is also relevant to compare the expert elicitation results to other forecasts of LCOE change over time.
Figure 14 does just that, for onshore wind and for fixed-bottom offshore wind (see Appendix C for a
listing of the references from which the other forecasts were obtained).27
The expert survey results for onshore wind are generally within the range of other forecasts, but
elicitation results tend to show greater expectations for LCOE reductions for onshore wind in the
median scenario than the majority of other forecasts. The reasons for this somewhat-more aggressive
set of onshore LCOE estimates from wind energy experts in the median scenario is not known.
However, other forecasts are sometimes informed by published learning rates that, as noted earlier,
have been primarily based on CapEx (Criqui et al. 2015). Learning rates based on CapEx alone, however,
will understate LCOE-based learning given concomitant advances in capacity factor, OpEx, and other
factors impacting LCOE (BNEF 2015a). Recent estimates of CapEx-based learning (LR = 6-9%) cited
earlier, for example, are well below the historical LCOE-based learning rates shown in Figure 13. As
such, at least some of the broader literature might be biased low in terms of onshore wind energy LCOE
forecasts due to inappropriate use of CapEx-based learning estimates (Criqui et al. 2015). Alternatively,
our expert survey results could be biased in some way, or other forecasters might have tended to err on
the side of conservatism for other reasons, such as a presumed decline in the learning rate over time.
The expert survey results for fixed-bottom offshore wind, meanwhile, tend to be more conservative
than the broader literature, both for the median and low scenarios. Specifically, a sizable number of
other forecasts anticipate steeper LCOE reductions than even the low-scenario expert survey results. As
indicated earlier, offshore wind energy costs have not experienced the sizable historical reductions
witnessed onshore. Those historical data points may be encouraging some conservatism among the
experts, at least relative to the broader literature.
27
We do not include a similar chart for floating offshore wind because of the limited number of unique estimates
for the future cost of this technology, relative to a 2014 fixed-bottom baseline.
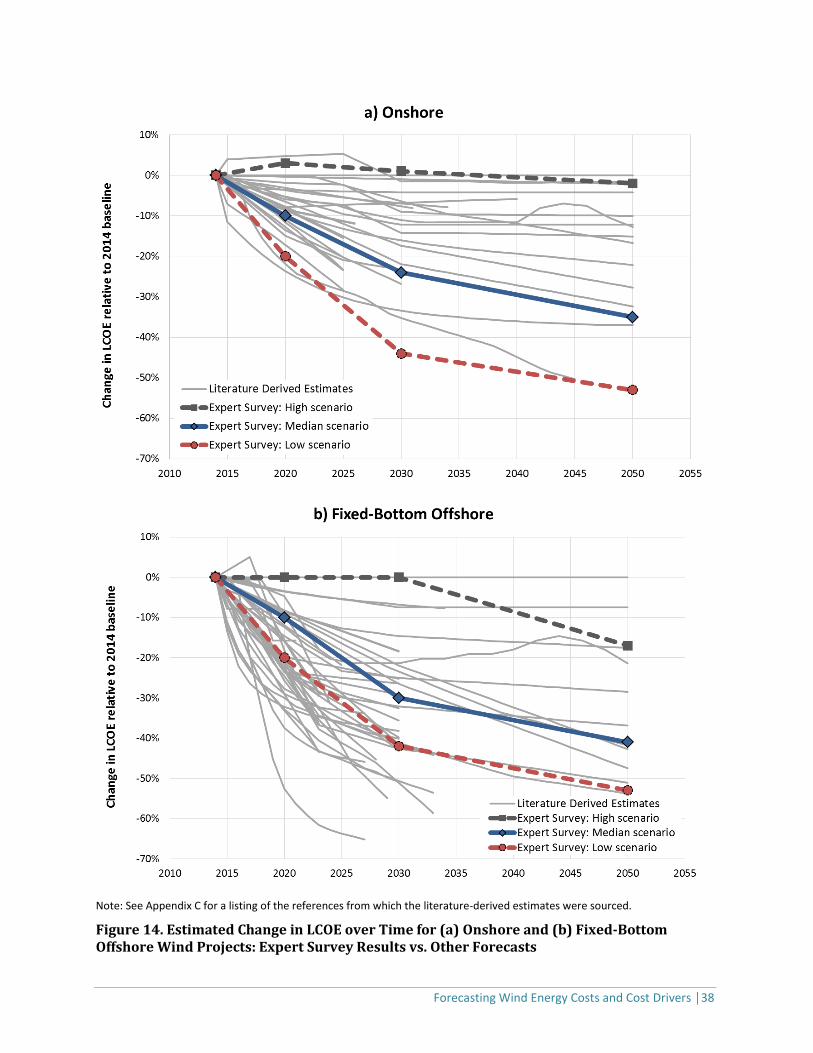
Forecasting Wind Energy Costs and Cost Drivers │38
Note: See Appendix C for a listing of the references from which the literature-derived estimates were sourced.
Figure 14. Estimated Change in LCOE over Time for (a) Onshore and (b) Fixed-Bottom Offshore Wind Projects: Expert Survey Results vs. Other Forecasts
Forecasting Wind Energy Costs and Cost Drivers │39
4. Conclusions
The wind energy industry has matured substantially since its beginnings in the 1970s, as has wind
power technology. Sizable reductions in the cost of onshore wind energy have accompanied that
maturation, with some experts anticipating that those reductions will also be witnessed offshore. But
how much additional cost reduction is possible, both onshore and offshore? What technological and
market factors are the most likely contributors to those reductions? And what broad trends might drive
even greater technological advancements and cost reductions?
This study has sought to help answer these questions, leveraging the unique insights of 163 of the
world’s foremost wind energy experts. Specifically, we have summarized the core results of an expert
elicitation survey on future wind energy costs and technology advancement possibilities, in what may
be the largest single elicitation ever performed on an energy technology in terms of expert
participation. Insights gained through this survey can complement other tools for evaluating cost-
reduction potential, including the use of learning curves, engineering assessments, and less-formal
means of synthesizing expert knowledge. Ultimately, we hope this work informs policy and planning
decisions, R&D decisions, and industry investment and strategy development while improving the
representation of wind energy in energy-sector planning models.
Notwithstanding the growing maturity of onshore wind and the limited evidence of historical cost
reductions for offshore wind, we find that experts anticipate significant additional reductions in the
levelized cost of wind energy across all three applications. As summarized in Figure 15, under the
median scenario, experts anticipate 24%–30% reductions by 2030 and 35%–41% reductions by 2050.
Costs could be even lower: experts predict a 10% chance that reductions will be more than 40% by 2030
and more than 50% by 2050. Though onshore wind is anticipated to remain less expensive than
offshore—and fixed-bottom less expensive than floating—there are greater absolute reductions (and
more uncertainty) in the long-term LCOE of offshore wind compared with onshore wind.
For onshore wind, CapEx and capacity factor improvements are expected to constitute the largest
drivers of LCOE reduction. The importance of higher capacity factors is consistent with expert views on
turbine characteristics, with scaling expected not only in turbine capacity ratings but also rotor
diameters and hub heights. For fixed-bottom offshore wind, on the other hand, CapEx reductions and
improvements in financing costs are the largest expected contributors to LCOE reduction. The relatively
higher importance of CapEx and lower importance of capacity factor is consistent with expert opinions
on future offshore turbine size: expected turbine capacity ratings (and hub heights) grow significantly in
order to minimize CapEx, but specific power is expected to remain roughly at recent levels. Capacity
factor improvements play a larger role for floating offshore wind (relative to the 2014 baseline for
fixed-bottom), perhaps reflecting a belief that floating technology will tend to be deployed in windier
sites as enabled by the ability to access deeper water locations. Some of the specific technology,
market, and other changes expected to drive down LCOE are listed in Figure 15 and detailed earlier.
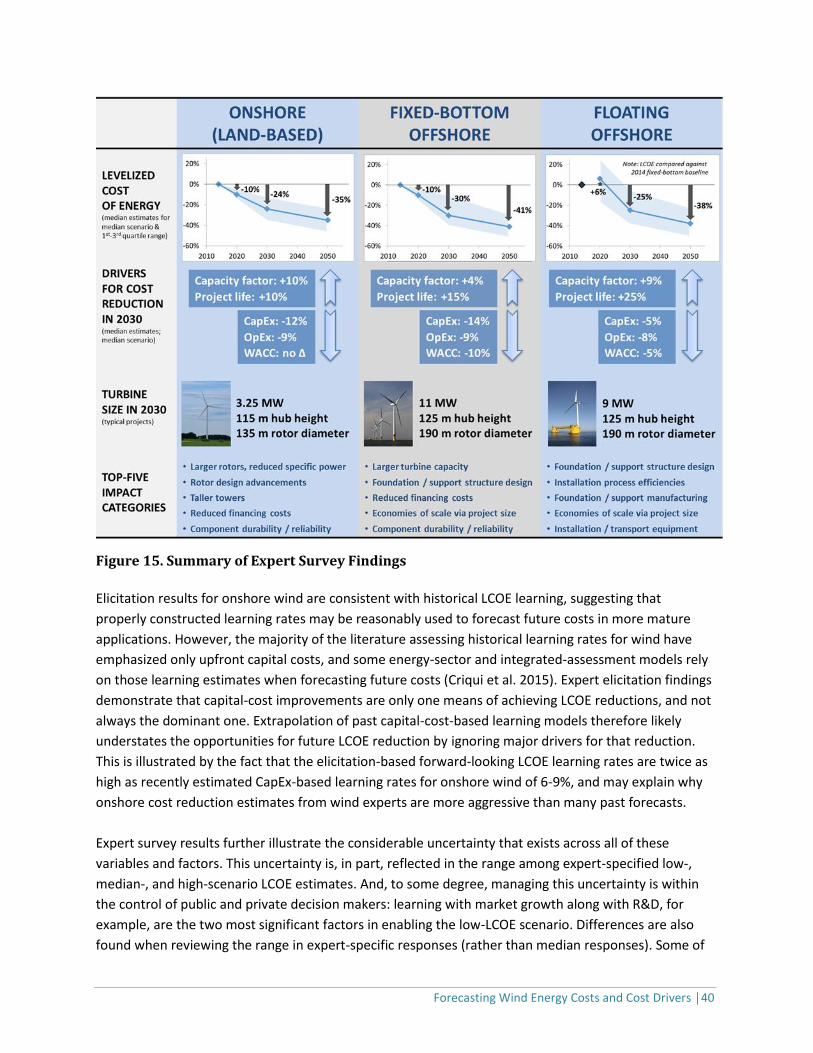
Forecasting Wind Energy Costs and Cost Drivers │40
Figure 15. Summary of Expert Survey Findings
Elicitation results for onshore wind are consistent with historical LCOE learning, suggesting that
properly constructed learning rates may be reasonably used to forecast future costs in more mature
applications. However, the majority of the literature assessing historical learning rates for wind have
emphasized only upfront capital costs, and some energy-sector and integrated-assessment models rely
on those learning estimates when forecasting future costs (Criqui et al. 2015). Expert elicitation findings
demonstrate that capital-cost improvements are only one means of achieving LCOE reductions, and not
always the dominant one. Extrapolation of past capital-cost-based learning models therefore likely
understates the opportunities for future LCOE reduction by ignoring major drivers for that reduction.
This is illustrated by the fact that the elicitation-based forward-looking LCOE learning rates are twice as
high as recently estimated CapEx-based learning rates for onshore wind of 6-9%, and may explain why
onshore cost reduction estimates from wind experts are more aggressive than many past forecasts.
Expert survey results further illustrate the considerable uncertainty that exists across all of these
variables and factors. This uncertainty is, in part, reflected in the range among expert-specified low-,
median-, and high-scenario LCOE estimates. And, to some degree, managing this uncertainty is within
the control of public and private decision makers: learning with market growth along with R&D, for
example, are the two most significant factors in enabling the low-LCOE scenario. Differences are also
found when reviewing the range in expert-specific responses (rather than median responses). Some of

Forecasting Wind Energy Costs and Cost Drivers │41
the variation in expert-specific responses, meanwhile, can be explained by segmenting respondents
into various categories. As presented in various text boxes earlier, for example, we find that the smaller
“leading-expert” group generally expects greater wind energy cost reductions than the larger set of
other respondents, whereas equipment manufacturers are sometimes more cautious about nearer-
term advancement possibilities. Future work is planned to assess more thoroughly these differences in
survey responses by respondent characteristics.
Forecasting Wind Energy Costs and Cost Drivers │42
References
Anadón, L.D., G. Nemet and E. Verdolini. 2013. “The future cost of nuclear power using multiple expert elicitations: effects of RD&D and elicitation design.” Environmental Research Letters 8: 1-10.
Arrow, K.J. 1962. “The economic implications of learning by doing.” The Review of Economic Studies 29: 155-173.
Baker, E., V. Bosetti, L.D. Anadon, M. Henrion and L.A. Reis. 2015. “Future costs key low-carbon energy technologies: Harmonization and aggregation of energy technology expert elicitation data.” Energy Policy 80: 219-232.
BNEF. 2015a. The Future Cost of Onshore Wind – An Accelerating Rate of Progress. Wind Insight. Bloomberg New Energy Finance.
BNEF. 2015b. New Energy Outlook 2015. Wind Insight. Bloomberg New Energy Finance.
BNEF. 2016. H1 2016 Offshore Wind Market Outlook. Wind Insight. Bloomberg New Energy Finance.
BVG. 2015. Offshore Wind: Delivering More for Less. Prepared for Statkraft UK.
Bywaters, G. V. John, J. Lynch, P. Mattila, G. Norton, J. Stowell, M. Salata, O. Labath, A. Chertok and D. Hablanian. 2005. Northern Power Systems WindPACT Drive Train Alternative Design Study Report. Golden, Colorado: National Renewable Energy Laboratory.
Cohen, J. T. Schweizer, A. Laxson, S. Butterfield, S. Schreck, L. Fingersh, P. Veers and T. Ashwill. 2008. Technology Improvement Opportunities for Low Wind Speed Turbines and Implications for Cost of Energy Reduction. Golden, Colorado: National Renewable Energy Laboratory.
Coppersmith, K.J., K.E. Jenni, R.C. Perman and R.R. Youngs. 2009. “Formal expert assessment in probabilistic seismic and volcanic hazard analysis.” In Connor, C.B., N.A. Chapman, and L.J. Connor (eds). Volcanic and Tectonic Hazard Assessment for Nuclear Facilities. Cambridge, UK: Cambridge University Press.
Criqui, P., S. Mima, P. Menanteau and A. Kitous. 2015. “Mitigation strategies and energy technology learning: An assessment with the POLES model.” Technology Forecasting & Social Change 90: 119-136.
Crown Estate. 2012. Offshore Wind Cost Reduction Pathways Study. London, UK: The Crown Estate.
DEA. 1999. Wind Power in Denmark: Technologies, Policies, and Results. Danish Energy Agency.
Dinica, V. 2011. “Renewable electricity production costs—A framework to assist policy-makers’ decisions on price support.” Energy Policy 39: 4153-4167.
Dismukes, D.E. and G.B. Upton Jr. 2015. “Economies of scale, learning effects and offshore wind development costs.” Renewable Energy 83: 61-66.
DOE. 2015a. Wind Vision: A New Era for Wind Power in the United States. Washington, DC: U.S. Department of Energy.
DOE. 2015b. Revolution Now. The Future Arrives for Five Clean Energy Technologies - 2015 Update. Washington, DC: U.S. Department of Energy.
Forecasting Wind Energy Costs and Cost Drivers │43
Edenhofer, O., L. Hirth, B. Knopf, M. Pahle, S. Schlomer, E. Schmid and F. Ueckerdt. 2013. “On the economics of renewable energy sources.” Energy Economics 40: S12-S23.
Ek, K. and P. Söderholm. 2010. “Technology learning in the presence of public R&D: The case of European wind power.” Ecological Economics: 2356-2362.
Ferioli, F., K. Schoots and B.C.C. Van der Zwaan. 2009. “Use and limitations of learning curves for energy technology policy: A component-learning hypothesis.” Energy Policy: 2525- 2535.
Fingersh, L., M. Hand and A. Laxson. 2006. Wind Turbine Design Cost and Scaling Model. Golden, Colorado: National Renewable Energy Laboratory.
Fitchner-Prognos. 2013. Cost Reduction Potentials of Offshore Wind Power in Germany. Prepared for the German Offshore Wind Energy Foundation.
Gillenwater, M. 2013. “Probabilistic decision model of wind power investment and influence of green power market.” Energy Policy 63: 1111-1125.
GWEC. 2014. Global Wind Energy Outlook 2014. Brussels, Belgium: Global Wind Energy Council.
GWEC. 2015. Global Wind Report: Annual Market Update 2014. Brussels, Belgium: Global Wind Energy Council.
Hirth, L. 2013. “The market value of variable renewables: The effect of solar wind power variability on their relative price.” Energy Economics 38: 218–236.
Hora, S. and D. von Winterfelt. 1997. “Nuclear waste and future societies: A look into the deep future.” Technological Forecasting and Social Change 56: 155–170.
Hora, S. 2007. “Assessing Probabilities from Experts.” In Edwards, W., R.F. Miles and D. von Winterfeldt (eds). Advances in Decision Analysis: From Foundations to Applications. Cambridge, UK: Cambridge University Press.
IEA. 2013. Technology Roadmap: Wind energy. Paris, France: International Energy Agency.
IEA. 2015. World Energy Outlook 2015. Paris, France: International Energy Agency.
InterAcademy Council. 2010. Climate Change Assessments: Review of the Processes and Procedures of the IPCC. Alkmaar, The Netherlands: InterAcademy Council.
IPCC. 2014. Climate Change 2014: Mitigation of Climate Change [O. Edenhofer, R. Pichs‐Madruga, Y. Sokona (eds)]. Cambridge, UK and New York, NY, US: Cambridge University Press.
IRENA. 2015. Renewable Power Generation Costs in 2014. Bonn, Germany: International Renewable Energy Agency.
Joskow P.L. 2011. “Comparing the costs of intermittent and dispatchable electricity generating technologies.” American Economic Review: Papers & Proceedings 100: 238–241.
Junginger M., A. Faaij and W.C. Turkenburg. 2004. “Cost reduction prospects for offshore wind farms.” Wind Engineering 28: 97-118.
Junginger, M., W.V. Sark and A Faaij (eds). 2010. Technological Learning in the Energy Sector: Lessons for Policy, Industry and Science. Northampton, Massachusetts, US: Edward Elgar.

Forecasting Wind Energy Costs and Cost Drivers │44
Kahneman D., P. Slovic and A. Tversky. 1982. Judgment under Uncertainty: Heuristics and Biases. Cambridge, UK: Cambridge University Press.
Kempton, W., S. McClellan and D. Ozkan. 2016. Massachusetts Offshore Wind Future Cost Study. University of Delaware Special Initiative on Offshore Wind.
Knol, A.B., P.E. Slottje, J.P. van der Sluijs and E. Lebret. 2010. “The use of expert elicitation in environmental health impact assessment: a seven step procedure.” Environmental Health 9(19).
Kotra, J.P., M.P. Lee, N.A. Eisenberg and A.R. DeWispelare. 1996. Branch Technical Position on the Use of Expert Elicitation in the High-Level Radioactive Waste Program. Washington, DC: Nuclear Regulatory Commission.
Lemming, J.K., P.E. Morthorst, N.E. Clausen and P.H. Jensen. 2009. Contribution to the Chapter on Wind Power in Energy Technology Perspectives 2008. Roskilde, Denmark: Risø National Laboratory for Sustainable Energy.
Lantz, E., R. Wiser and M. Hand. 2012. The Past and Future Cost of Wind Energy. International Energy Agency Wind Task 26 Report. Golden, Colorado: National Renewable Energy Laboratory.
Lindman, Å. and P. Söderholm. 2012. “Wind power learning rates: a conceptual review and meta-analysis.” Energy Economics 34: 754-761.
Luderer, G., V. Krey, K. Calvin, J. Merrick, S. Mima, R. Pietzcker, J. Van Vliet and K. Wada. 2014. “The role of renewable energy in climate stabilization: results from the EMF27 scenarios.” Climatic Change 123: 427-441.
Malcom, D. and A. Hansen. 2002. WindPACT Turbine Rotor Design Study. Golden, Colorado: National Renewable Energy Laboratory.
Meyer, M.A and J.M. Booker. 2001. Eliciting and Analyzing Expert Judgment: A Practical Guide. Philadelphia, Pennsylvania: Society for Industrial and Applied Mathematics (SIAM).
Mills A. and R. Wiser. 2013. “Changes in the economic value of wind energy and flexible resources at increasing penetration levels in the Rocky Mountain Power Area.” Wind Energy 16: 1711-1726.
Morgan, M.G. 2014. “Use (and abuse) of expert elicitation in support of decision making for public policy.” Proceedings of the National Academy of Sciences (PNAS) 111: 7176-7184.
Mukora A., M. Winskel, H.F. Jeffrey and M. Mueller. 2009. “Learning curves for emerging energy technologies.” Proceedings of the Institution of Civil Engineers – Energy 162: 151-159.
Navigant. 2013. U.S. Offshore Wind Manufacturing and Supply Chain Development. Burlington, Massachusetts: Navigant Consulting.
Neij, L. 2008. “Cost development of future technologies for power generation – A study based on experience curves and complementary bottom-up assessments.” Energy Policy 36: 2200-2211.
Nemet, G.F., L.D. Anadon and E. Verdolini. 2016. “Quantifying the effects of expert selection and elicitation design on experts’ confidence in their judgements about future energy technologies.” Risk Analysis.
Nordhaus, W.D. 2009. The Perils of the Learning Model For Modeling Endogenous Technological Change. Cambridge, Massachusetts: National Bureau of Economic Research.

Forecasting Wind Energy Costs and Cost Drivers │45
NRC. 2007. Prospective Evaluation of Applied Energy Research and Development at DOE (Phase Two). National Research Council. Washington D.C.: The National Academies Press.
REN21. 2015. Renewables 2015: Global Status Report. Paris, France: Renewable Energy Policy Network for the 21st Century.
Rubin, E.S., I. Azevedo, P. Jaramillo and S. Yeh. 2015. “A review of learning rates for electricity supply technologies.” Energy Policy 86:198-218.
Sharpe, P. and T. Keelin. 1998. “How SmithKline Beecham makes better resource allocation decisions.” Harvard Business Review 76: 45–57.
Sieros G., P. Chaviaropoulos, J. Sørensen, B. Bulder and P. Jamieson. 2010. “Upscaling wind turbines: theoretical and practical aspects and the impact on the cost of energy”. Wind Energy 15: 3-17.
Smith, A., T. Stehly and W. Musial. 2015. 2014-2015 Offshore Wind Technologies Market Report. Golden, Colorado: National Renewable Energy Laboratory.
TKI Wind op Zee. 2015. Cost reduction options for offshore wind in the Netherlands FID 2010-2020. Prepared for TKI Wind op Zee.
Valpy, B. and P.English. 2014a. Future Renewable Energy Costs: Offshore Wind. BVG Associates and KIC InnoEnergy.
Valpy, B. and P.English. 2014b. Future Renewable Energy Costs: Onshore Wind. BVG Associates and KIC InnoEnergy.
van der Zwaan, B.C.C., R. Rivera-Tinoco, S. Lensink and P. van den Oosterkamp. 2012. “Cost reductions for offshore wind power: exploring the balance between scaling, learning and R&D.” Renewable Energy 41: 389-393.
Verdolini, E., L.D. Anadon, J. Lu and G. Nemet. 2015. “The effects of expert selection, elicitation design, and R&D assumptions on experts’ estimates of the future cost of photovoltaics.” Energy Policy 80: 233-243.
Verdolini, E., L.D. Anadon, E. Baker, V. Bosetti and L.A. Reis. 2016. “The future of energy technologies: an overview of expert elicitations.” Under submission to Review of Environmental Economics and Policy.
Voormolen, J.A., H.M. Junginger and W.G.J.H.M. van Sark. 2016. “Unravelling historical cost developments of offshore wind energy in Europe.” Energy Policy 88: 435-444.
Willow, C. and B. Valpy. 2015. Approaches to Cost-Reduction in Offshore Wind. A report to the Committee on Climate Change.
Wiser, R., Z. Yang, M. Hand, O. Hohmeyer, D. Infield, P. H. Jensen, V. Nikolaev, M. O’Malley, G. Sinden and A. Zervos. 2011. “Wind Energy.” In Edenhofer, O., R. Pichs‐Madruga, Y. Sokona, K. Seyboth, P. Matschoss, S. Kadner, T. Zwickel, P. Eickemeier, G. Hansen, S. Schlömer and C. von Stechow (eds). IPCC Special Report on Renewable Energy Sources and Climate Change Mitigation. Cambridge, UK and New York, NY, US: Cambridge University Press.
Wiser, R. and M. Bolinger. 2015. 2014 Wind Technologies Market Report. Washington, DC: U.S. Department of Energy.

Forecasting Wind Energy Costs and Cost Drivers │46
Witajewski-Baltvilks, J., E. Verdolini and M. Tavoni. 2015. “Bending the learning curve.” Energy Economics 52: S86-S99.
Wüstemeyer, C., R. Madlener and D.W. Bunn. 2015. “A stakeholder analysis of divergent supply-chain trends for the European onshore and offshore wind installations.” Energy Policy 80: 36-44.
Yeh, S. and E.S. Rubin. 2012. “A review of uncertainties in technology experience curves.” Energy Economics 34: 762-771.
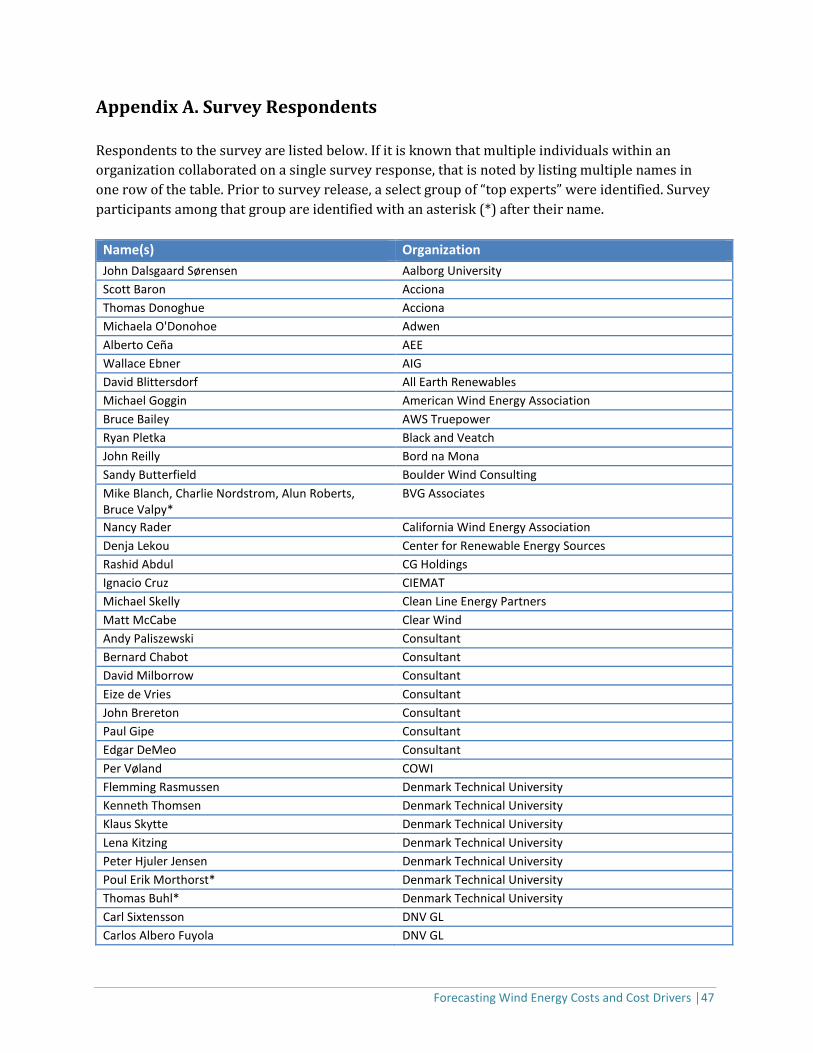
Forecasting Wind Energy Costs and Cost Drivers │47
Appendix A. Survey Respondents
Respondents to the survey are listed below. If it is known that multiple individuals within an
organization collaborated on a single survey response, that is noted by listing multiple names in
one row of the table. Prior to survey release, a select group of “top experts” were identified. Survey
participants among that group are identified with an asterisk (*) after their name.
Name(s) Organization
John Dalsgaard Sørensen Aalborg University
Scott Baron Acciona
Thomas Donoghue Acciona
Michaela O'Donohoe Adwen
Alberto Ceña AEE
Wallace Ebner AIG
David Blittersdorf All Earth Renewables
Michael Goggin American Wind Energy Association
Bruce Bailey AWS Truepower
Ryan Pletka Black and Veatch
John Reilly Bord na Mona
Sandy Butterfield Boulder Wind Consulting
Mike Blanch, Charlie Nordstrom, Alun Roberts, Bruce Valpy*
BVG Associates
Nancy Rader California Wind Energy Association
Denja Lekou Center for Renewable Energy Sources
Rashid Abdul CG Holdings
Ignacio Cruz CIEMAT
Michael Skelly Clean Line Energy Partners
Matt McCabe Clear Wind
Andy Paliszewski Consultant
Bernard Chabot Consultant
David Milborrow Consultant
Eize de Vries Consultant
John Brereton Consultant
Paul Gipe Consultant
Edgar DeMeo Consultant
Per Vøland COWI
Flemming Rasmussen Denmark Technical University
Kenneth Thomsen Denmark Technical University
Klaus Skytte Denmark Technical University
Lena Kitzing Denmark Technical University
Peter Hjuler Jensen Denmark Technical University
Poul Erik Morthorst* Denmark Technical University
Thomas Buhl* Denmark Technical University
Carl Sixtensson DNV GL
Carlos Albero Fuyola DNV GL
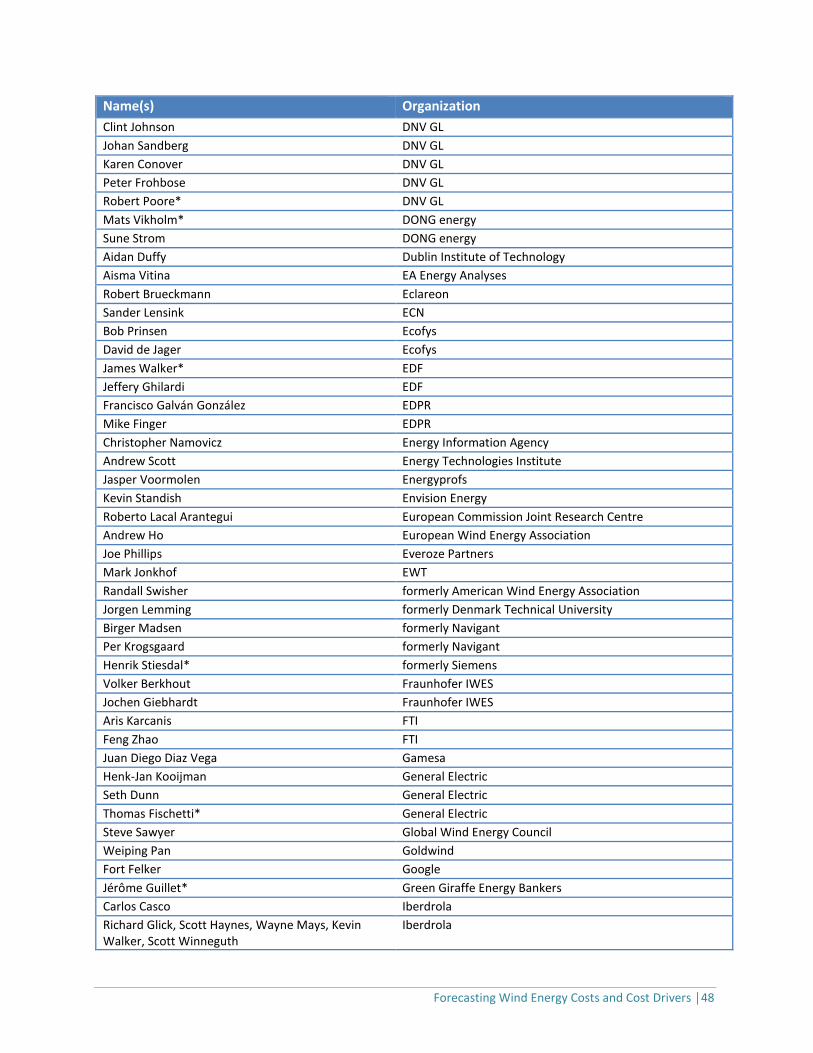
Forecasting Wind Energy Costs and Cost Drivers │48
Name(s) Organization
Clint Johnson DNV GL
Johan Sandberg DNV GL
Karen Conover DNV GL
Peter Frohbose DNV GL
Robert Poore* DNV GL
Mats Vikholm* DONG energy
Sune Strom DONG energy
Aidan Duffy Dublin Institute of Technology
Aisma Vitina EA Energy Analyses
Robert Brueckmann Eclareon
Sander Lensink ECN
Bob Prinsen Ecofys
David de Jager Ecofys
James Walker* EDF
Jeffery Ghilardi EDF
Francisco Galván González EDPR
Mike Finger EDPR
Christopher Namovicz Energy Information Agency
Andrew Scott Energy Technologies Institute
Jasper Voormolen Energyprofs
Kevin Standish Envision Energy
Roberto Lacal Arantegui European Commission Joint Research Centre
Andrew Ho European Wind Energy Association
Joe Phillips Everoze Partners
Mark Jonkhof EWT
Randall Swisher formerly American Wind Energy Association
Jorgen Lemming formerly Denmark Technical University
Birger Madsen formerly Navigant
Per Krogsgaard formerly Navigant
Henrik Stiesdal* formerly Siemens
Volker Berkhout Fraunhofer IWES
Jochen Giebhardt Fraunhofer IWES
Aris Karcanis FTI
Feng Zhao FTI
Juan Diego Diaz Vega Gamesa
Henk-Jan Kooijman General Electric
Seth Dunn General Electric
Thomas Fischetti* General Electric
Steve Sawyer Global Wind Energy Council
Weiping Pan Goldwind
Fort Felker Google
Jérôme Guillet* Green Giraffe Energy Bankers
Carlos Casco Iberdrola
Richard Glick, Scott Haynes, Wayne Mays, Kevin Walker, Scott Winneguth
Iberdrola
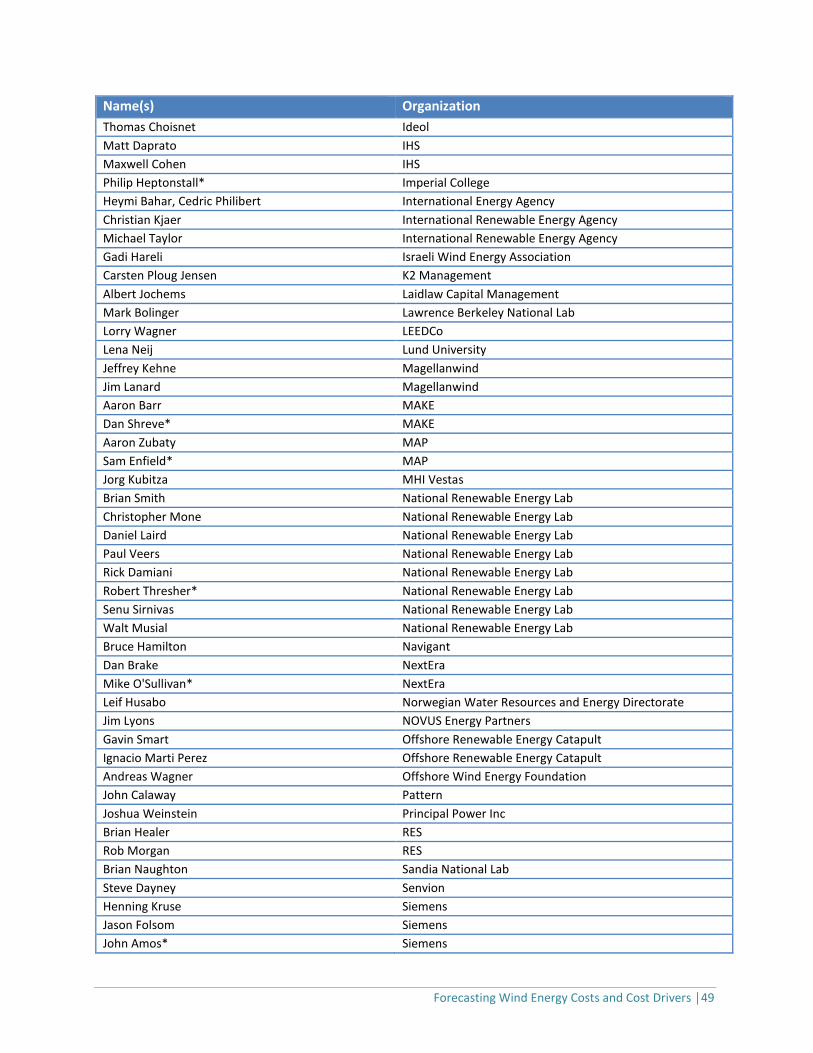
Forecasting Wind Energy Costs and Cost Drivers │49
Name(s) Organization
Thomas Choisnet Ideol
Matt Daprato IHS
Maxwell Cohen IHS
Philip Heptonstall* Imperial College
Heymi Bahar, Cedric Philibert International Energy Agency
Christian Kjaer International Renewable Energy Agency
Michael Taylor International Renewable Energy Agency
Gadi Hareli Israeli Wind Energy Association
Carsten Ploug Jensen K2 Management
Albert Jochems Laidlaw Capital Management
Mark Bolinger Lawrence Berkeley National Lab
Lorry Wagner LEEDCo
Lena Neij Lund University
Jeffrey Kehne Magellanwind
Jim Lanard Magellanwind
Aaron Barr MAKE
Dan Shreve* MAKE
Aaron Zubaty MAP
Sam Enfield* MAP
Jorg Kubitza MHI Vestas
Brian Smith National Renewable Energy Lab
Christopher Mone National Renewable Energy Lab
Daniel Laird National Renewable Energy Lab
Paul Veers National Renewable Energy Lab
Rick Damiani National Renewable Energy Lab
Robert Thresher* National Renewable Energy Lab
Senu Sirnivas National Renewable Energy Lab
Walt Musial National Renewable Energy Lab
Bruce Hamilton Navigant
Dan Brake NextEra
Mike O'Sullivan* NextEra
Leif Husabo Norwegian Water Resources and Energy Directorate
Jim Lyons NOVUS Energy Partners
Gavin Smart Offshore Renewable Energy Catapult
Ignacio Marti Perez Offshore Renewable Energy Catapult
Andreas Wagner Offshore Wind Energy Foundation
John Calaway Pattern
Joshua Weinstein Principal Power Inc
Brian Healer RES
Rob Morgan RES
Brian Naughton Sandia National Lab
Steve Dayney Senvion
Henning Kruse Siemens
Jason Folsom Siemens
John Amos* Siemens
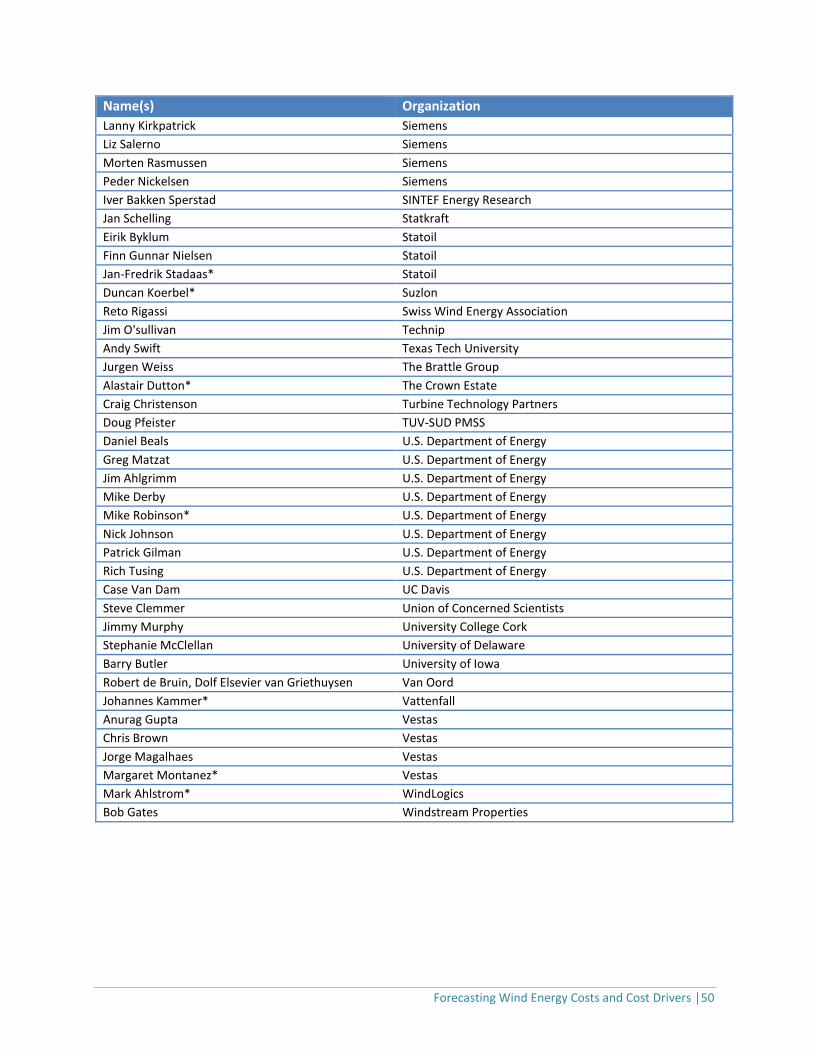
Forecasting Wind Energy Costs and Cost Drivers │50
Name(s) Organization
Lanny Kirkpatrick Siemens
Liz Salerno Siemens
Morten Rasmussen Siemens
Peder Nickelsen Siemens
Iver Bakken Sperstad SINTEF Energy Research
Jan Schelling Statkraft
Eirik Byklum Statoil
Finn Gunnar Nielsen Statoil
Jan-Fredrik Stadaas* Statoil
Duncan Koerbel* Suzlon
Reto Rigassi Swiss Wind Energy Association
Jim O'sullivan Technip
Andy Swift Texas Tech University
Jurgen Weiss The Brattle Group
Alastair Dutton* The Crown Estate
Craig Christenson Turbine Technology Partners
Doug Pfeister TUV-SUD PMSS
Daniel Beals U.S. Department of Energy
Greg Matzat U.S. Department of Energy
Jim Ahlgrimm U.S. Department of Energy
Mike Derby U.S. Department of Energy
Mike Robinson* U.S. Department of Energy
Nick Johnson U.S. Department of Energy
Patrick Gilman U.S. Department of Energy
Rich Tusing U.S. Department of Energy
Case Van Dam UC Davis
Steve Clemmer Union of Concerned Scientists
Jimmy Murphy University College Cork
Stephanie McClellan University of Delaware
Barry Butler University of Iowa
Robert de Bruin, Dolf Elsevier van Griethuysen Van Oord
Johannes Kammer* Vattenfall
Anurag Gupta Vestas
Chris Brown Vestas
Jorge Magalhaes Vestas
Margaret Montanez* Vestas
Mark Ahlstrom* WindLogics
Bob Gates Windstream Properties
Forecasting Wind Energy Costs and Cost Drivers │51
Appendix B. Additional Survey Results
This appendix includes a number of additional figures and tables based on the survey results:
Absolute LCOE, 2014-2050: The main report includes a figure (Figure 5) depicting estimated
absolute LCOE values for all three wind energy applications, over time, on a single plot, focusing
only on median-scenario LCOE estimates, and showing the median and range of expert responses.
This appendix includes two similar figures, one focused on the low-scenario LCOE and the other one
on the high-scenario LCOE.
LCOE and LCOE Components, 2014 and 2030: This appendix includes three detailed figures for
LCOE and the five components of LCOE for the baseline year of 2014 and 2030, one for each of the
wind applications. These figures show the mean, median, and range of expert estimates in box-and-
whiskers plots. In these plots, shaded grey boxes show the 1st to 3rd quartile values, and the
“whiskers” generally show the minimum to maximum assessed values, except where there are
outlier values, which appears as small circles. Outliers are defined as values that are less than the 1st
quartile or greater than the 3rd quartile by more than 1.5 times the inter-quartile difference. Most
experts endorsed the default 2014 baseline values—as a result, the median values for 2014 as well
as the 25th and 75th percentiles are all equal to the default baseline values, and all cases where
experts defined baseline values different from the default values appear as outliers.
Turbine Characteristics, 2030: This appendix includes histograms of respondent assessments of
turbine nameplate capacity, hub height, and rotor diameter, for all three wind energy applications.
Implied specific power is also presented, in the form of a box-and-whiskers plot; unlike in (2),
above, however, outlier values are not presented in this chart, and so the whiskers do not
necessarily represent absolute maximum or minimum respondent values.
Wind Technology, Market, and Other Changes: This appendix provides survey results for all 28
wind technology, market, and other changes that might impact LCOE by 2030, for each of the three
wind applications. It also lists the expert-provided “write-in” responses to the question, separately
for onshore, fixed-bottom offshore, and floating offshore wind.
Broad Drivers for Lower LCOE: This appendix lists the expert-provided “write-in” responses to the
question about broad drivers for achieving low LCOE estimates in 2030, for onshore and fixed-
bottom offshore wind projects.
Differences among Respondent Groups: This appendix includes a series of color coded tables that
provide additional detail on the results found in text boxes and elsewhere throughout the main
body of the report, summarizing key differences in expert responses based on various respondent
groupings.
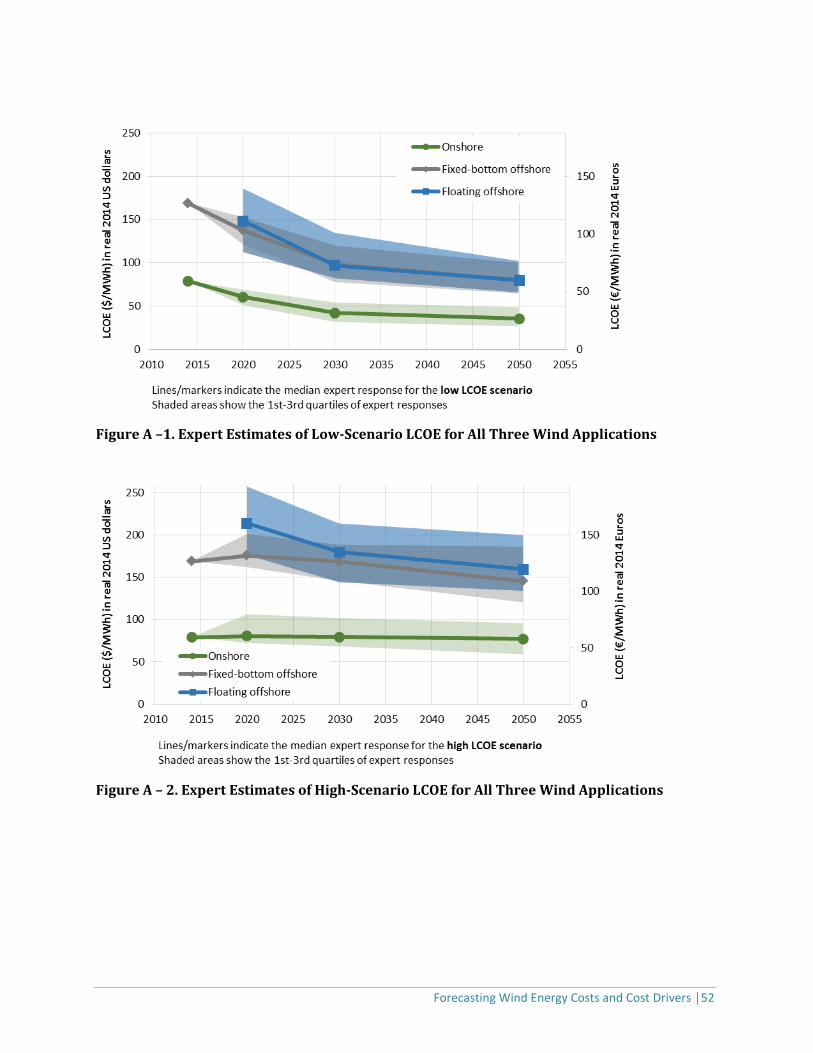
Forecasting Wind Energy Costs and Cost Drivers │52
Figure A –1. Expert Estimates of Low-Scenario LCOE for All Three Wind Applications
Figure A – 2. Expert Estimates of High-Scenario LCOE for All Three Wind Applications
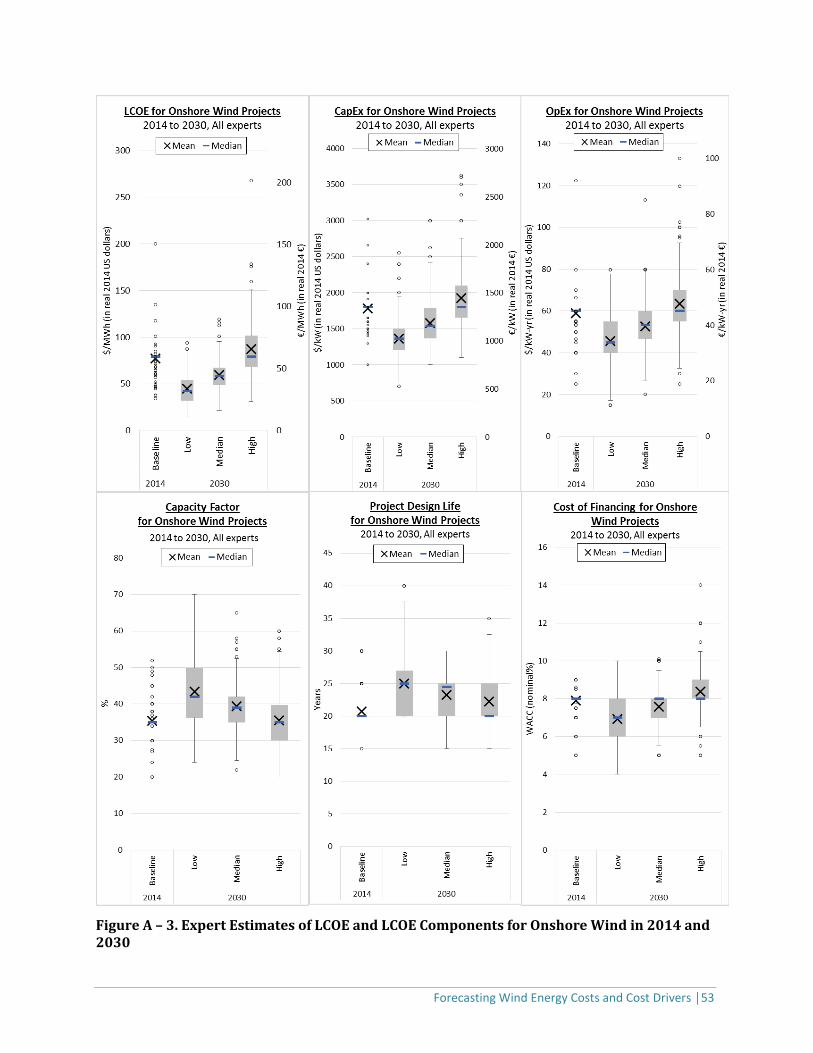
Forecasting Wind Energy Costs and Cost Drivers │53
Figure A – 3. Expert Estimates of LCOE and LCOE Components for Onshore Wind in 2014 and 2030
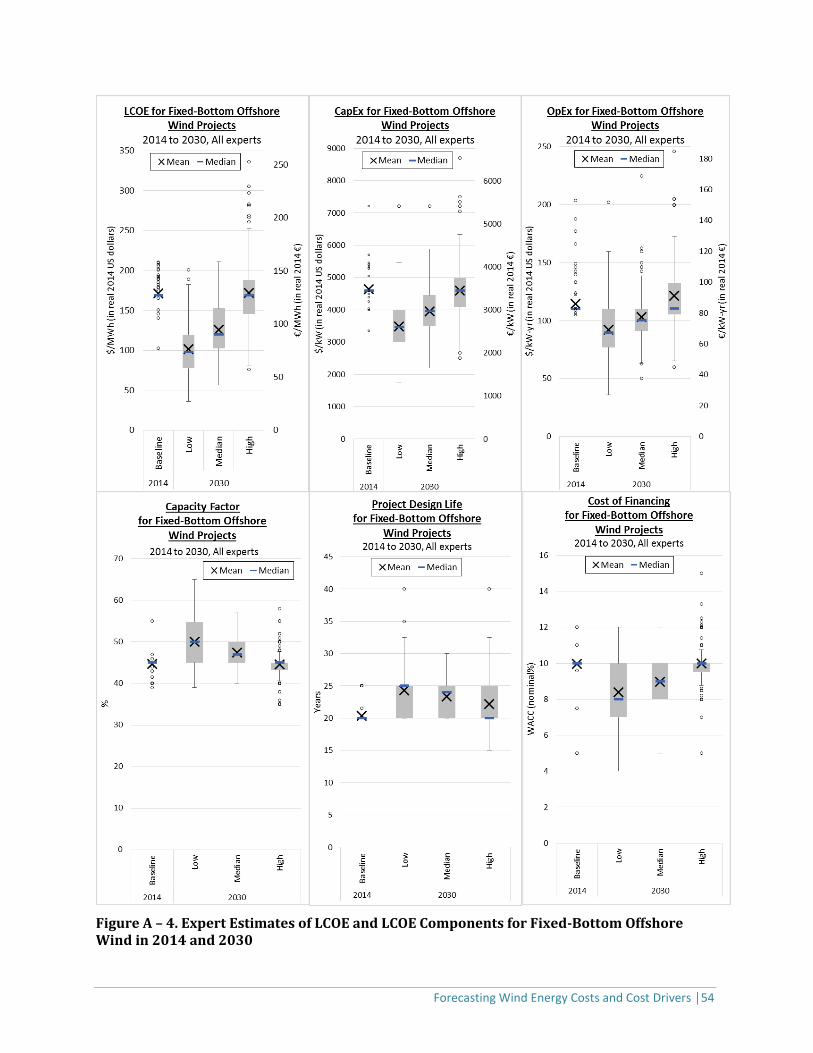
Forecasting Wind Energy Costs and Cost Drivers │54
Figure A – 4. Expert Estimates of LCOE and LCOE Components for Fixed-Bottom Offshore Wind in 2014 and 2030
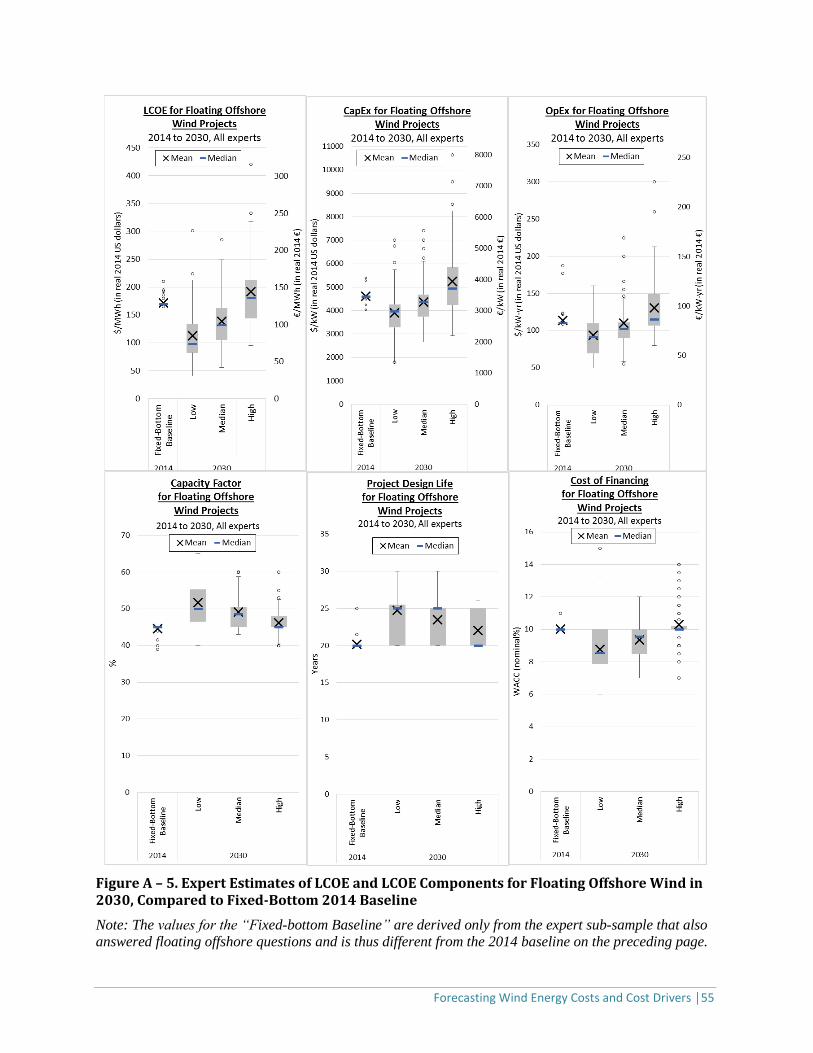
Forecasting Wind Energy Costs and Cost Drivers │55
Figure A – 5. Expert Estimates of LCOE and LCOE Components for Floating Offshore Wind in 2030, Compared to Fixed-Bottom 2014 Baseline
Note: The values for the “Fixed-bottom Baseline” are derived only from the expert sub-sample that also
answered floating offshore questions and is thus different from the 2014 baseline on the preceding page.
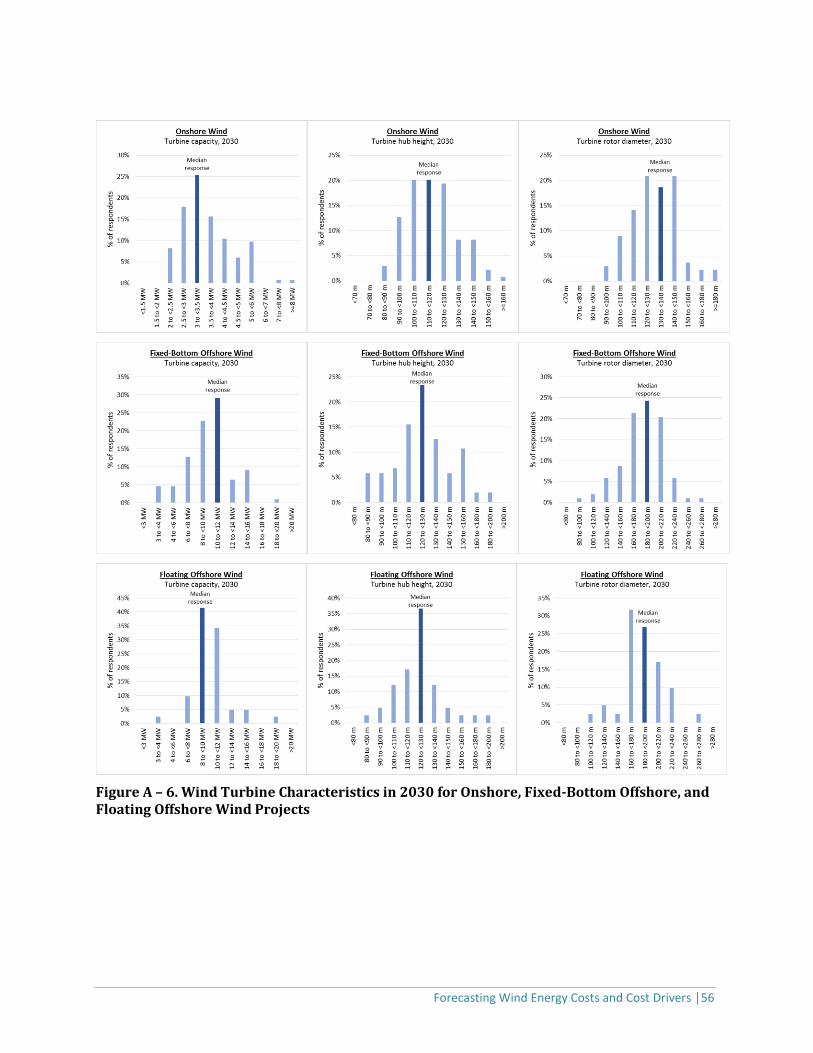
Forecasting Wind Energy Costs and Cost Drivers │56
Figure A – 6. Wind Turbine Characteristics in 2030 for Onshore, Fixed-Bottom Offshore, and Floating Offshore Wind Projects
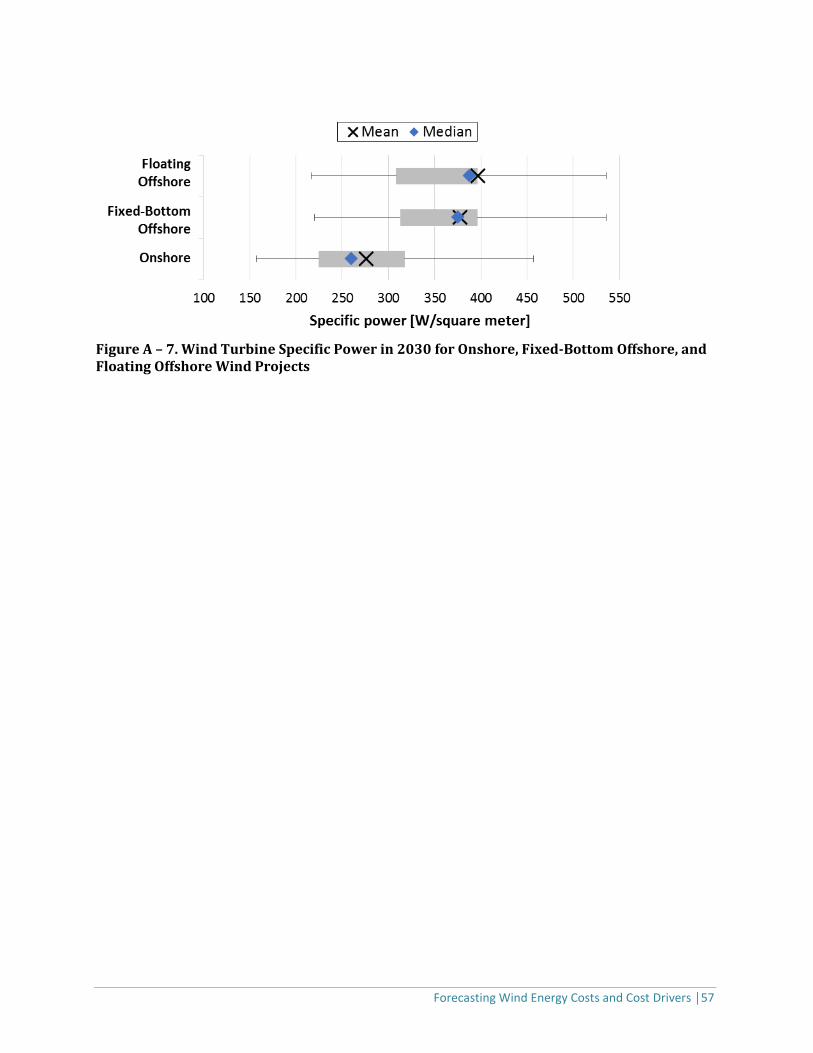
Forecasting Wind Energy Costs and Cost Drivers │57
Figure A – 7. Wind Turbine Specific Power in 2030 for Onshore, Fixed-Bottom Offshore, and Floating Offshore Wind Projects
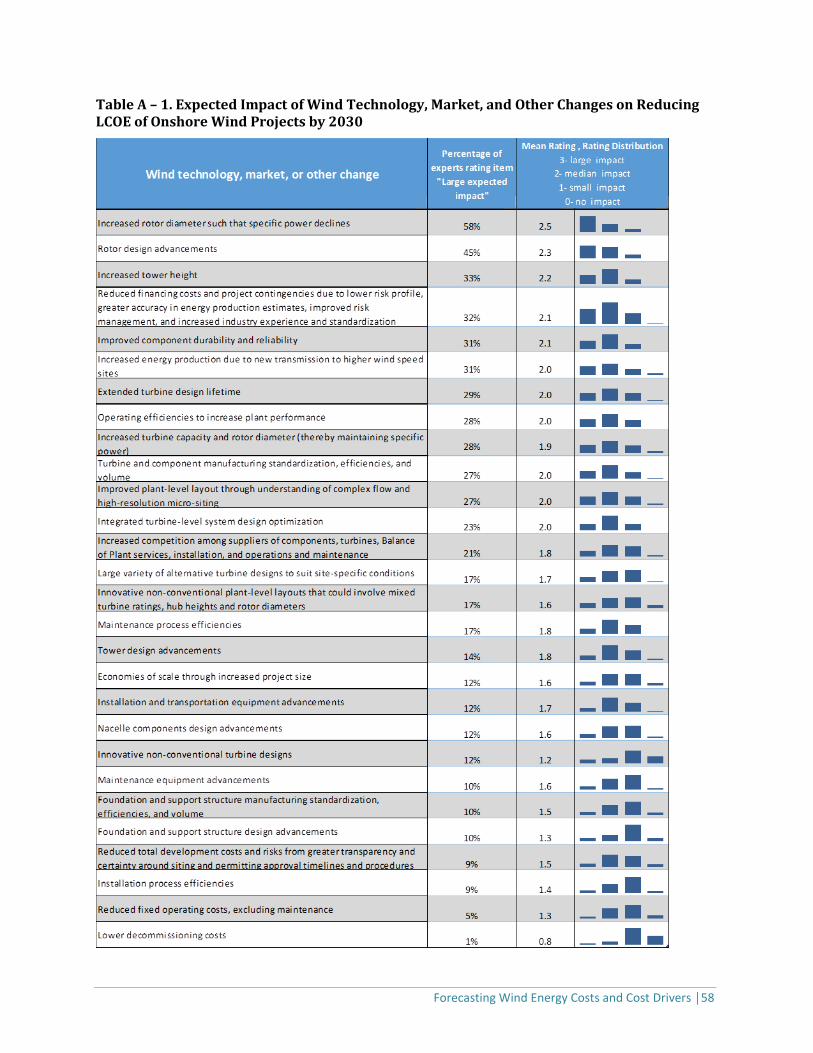
Forecasting Wind Energy Costs and Cost Drivers │58
Table A – 1. Expected Impact of Wind Technology, Market, and Other Changes on Reducing LCOE of Onshore Wind Projects by 2030
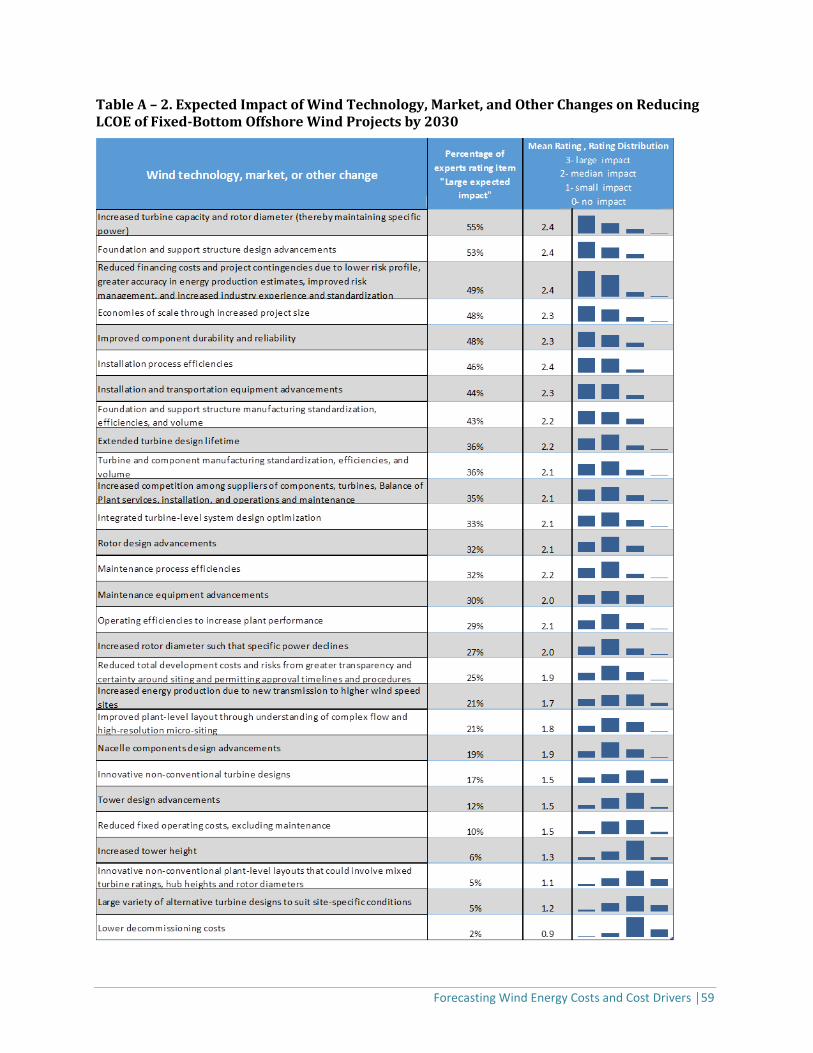
Forecasting Wind Energy Costs and Cost Drivers │59
Table A – 2. Expected Impact of Wind Technology, Market, and Other Changes on Reducing LCOE of Fixed-Bottom Offshore Wind Projects by 2030
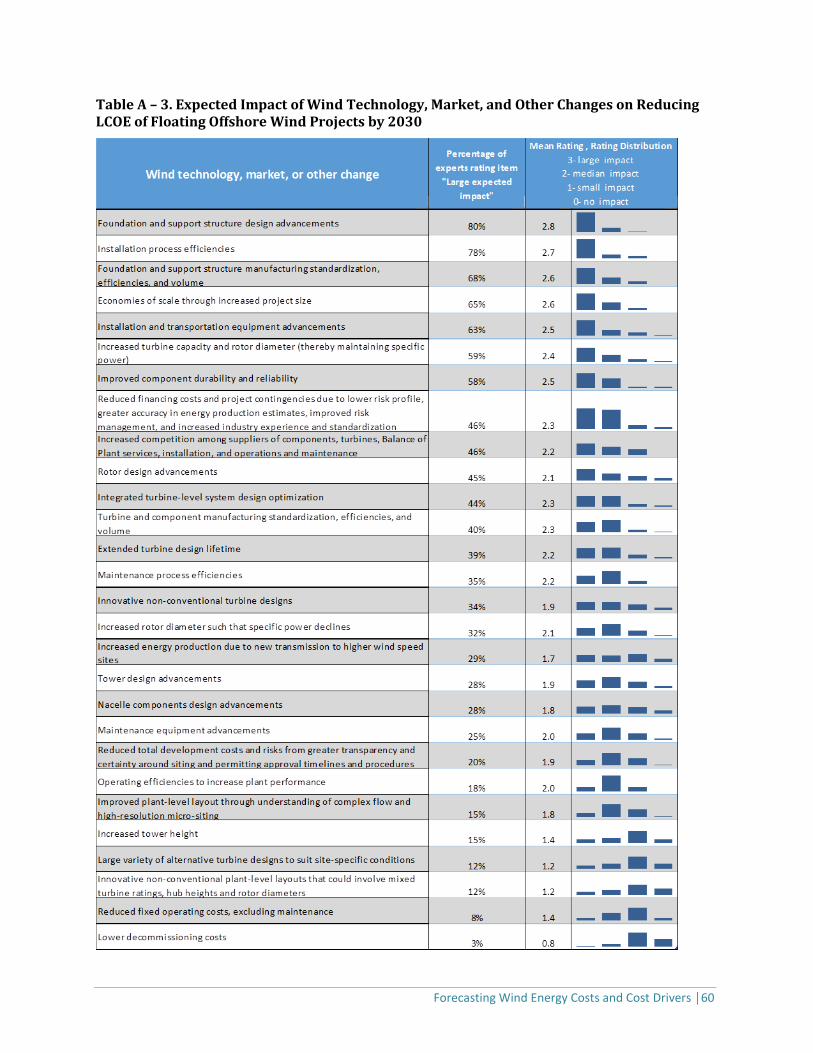
Forecasting Wind Energy Costs and Cost Drivers │60
Table A – 3. Expected Impact of Wind Technology, Market, and Other Changes on Reducing LCOE of Floating Offshore Wind Projects by 2030
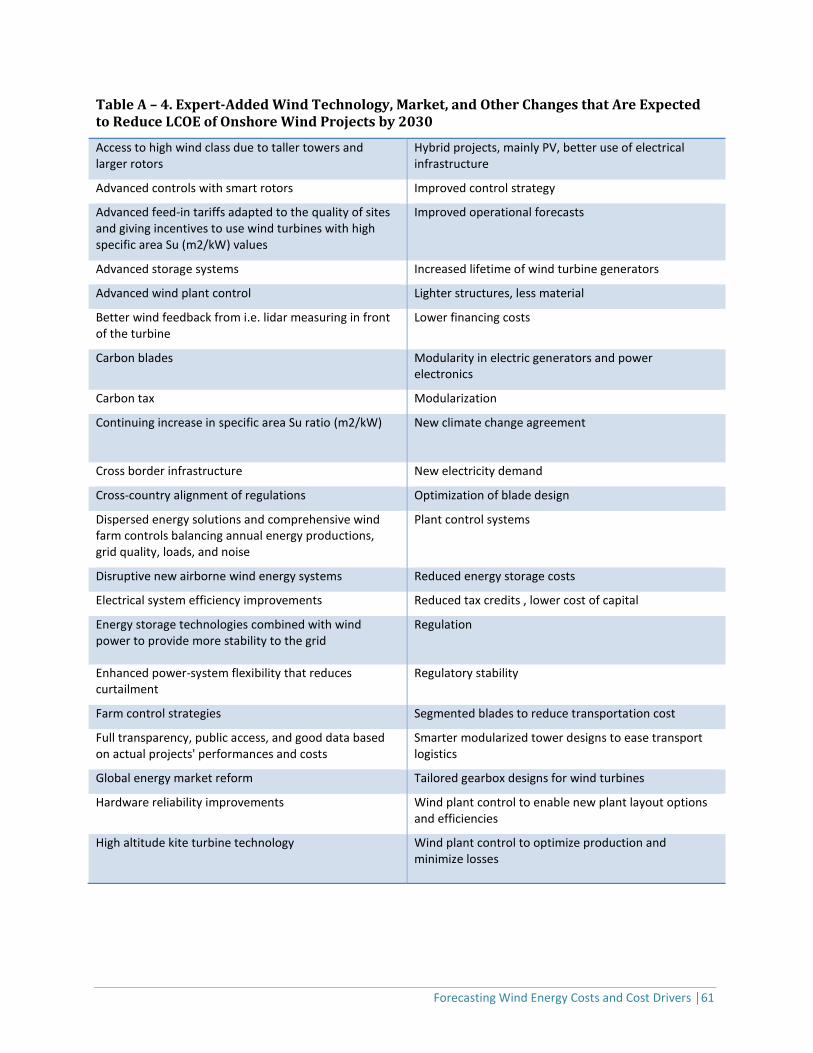
Forecasting Wind Energy Costs and Cost Drivers │61
Table A – 4. Expert-Added Wind Technology, Market, and Other Changes that Are Expected to Reduce LCOE of Onshore Wind Projects by 2030
Access to high wind class due to taller towers and larger rotors
Hybrid projects, mainly PV, better use of electrical infrastructure
Advanced controls with smart rotors Improved control strategy
Advanced feed-in tariffs adapted to the quality of sites and giving incentives to use wind turbines with high specific area Su (m2/kW) values
Improved operational forecasts
Advanced storage systems Increased lifetime of wind turbine generators
Advanced wind plant control Lighter structures, less material
Better wind feedback from i.e. lidar measuring in front of the turbine
Lower financing costs
Carbon blades Modularity in electric generators and power electronics
Carbon tax Modularization
Continuing increase in specific area Su ratio (m2/kW) New climate change agreement
Cross border infrastructure New electricity demand
Cross-country alignment of regulations Optimization of blade design
Dispersed energy solutions and comprehensive wind farm controls balancing annual energy productions, grid quality, loads, and noise
Plant control systems
Disruptive new airborne wind energy systems Reduced energy storage costs
Electrical system efficiency improvements Reduced tax credits , lower cost of capital
Energy storage technologies combined with wind power to provide more stability to the grid
Regulation
Enhanced power-system flexibility that reduces curtailment
Regulatory stability
Farm control strategies Segmented blades to reduce transportation cost
Full transparency, public access, and good data based on actual projects' performances and costs
Smarter modularized tower designs to ease transport logistics
Global energy market reform Tailored gearbox designs for wind turbines
Hardware reliability improvements Wind plant control to enable new plant layout options and efficiencies
High altitude kite turbine technology
Wind plant control to optimize production and minimize losses
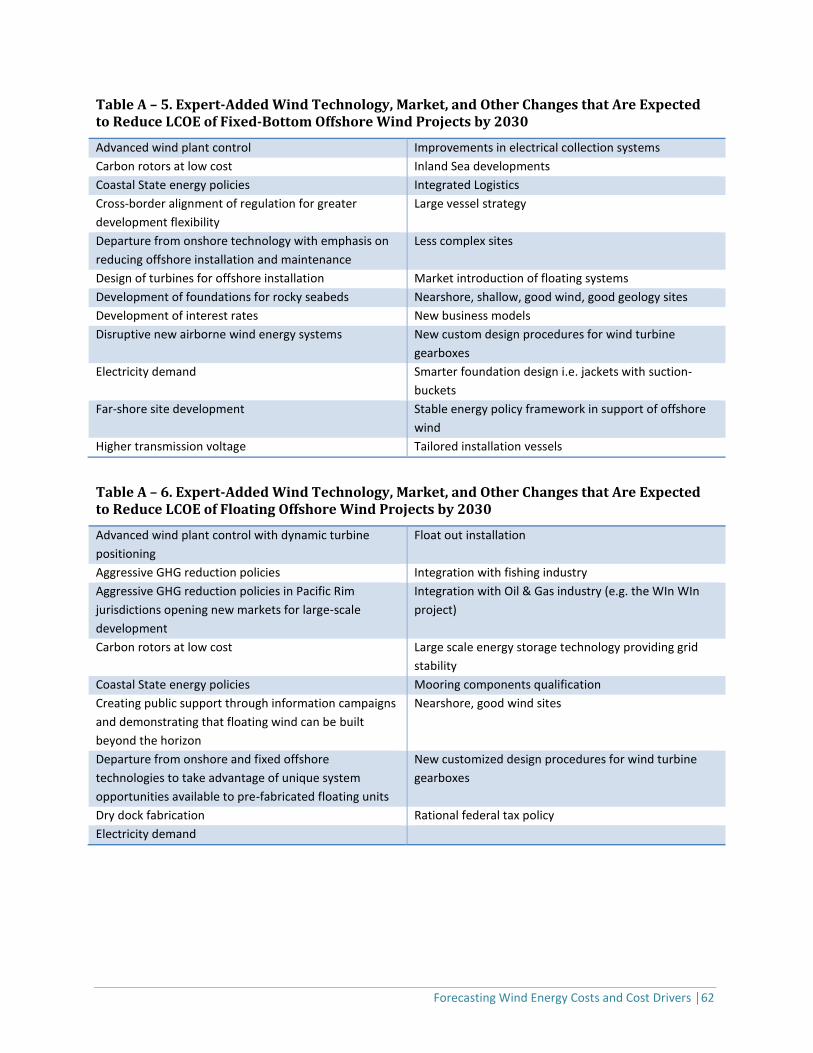
Forecasting Wind Energy Costs and Cost Drivers │62
Table A – 5. Expert-Added Wind Technology, Market, and Other Changes that Are Expected to Reduce LCOE of Fixed-Bottom Offshore Wind Projects by 2030
Advanced wind plant control Improvements in electrical collection systems
Carbon rotors at low cost Inland Sea developments
Coastal State energy policies Integrated Logistics
Cross-border alignment of regulation for greater
development flexibility
Large vessel strategy
Departure from onshore technology with emphasis on
reducing offshore installation and maintenance
Less complex sites
Design of turbines for offshore installation Market introduction of floating systems
Development of foundations for rocky seabeds Nearshore, shallow, good wind, good geology sites
Development of interest rates New business models
Disruptive new airborne wind energy systems New custom design procedures for wind turbine
gearboxes
Electricity demand Smarter foundation design i.e. jackets with suction-
buckets
Far-shore site development Stable energy policy framework in support of offshore
wind
Higher transmission voltage Tailored installation vessels
Table A – 6. Expert-Added Wind Technology, Market, and Other Changes that Are Expected to Reduce LCOE of Floating Offshore Wind Projects by 2030
Advanced wind plant control with dynamic turbine
positioning
Float out installation
Aggressive GHG reduction policies Integration with fishing industry
Aggressive GHG reduction policies in Pacific Rim
jurisdictions opening new markets for large-scale
development
Integration with Oil & Gas industry (e.g. the WIn WIn
project)
Carbon rotors at low cost Large scale energy storage technology providing grid
stability
Coastal State energy policies Mooring components qualification
Creating public support through information campaigns
and demonstrating that floating wind can be built
beyond the horizon
Nearshore, good wind sites
Departure from onshore and fixed offshore
technologies to take advantage of unique system
opportunities available to pre-fabricated floating units
New customized design procedures for wind turbine
gearboxes
Dry dock fabrication Rational federal tax policy
Electricity demand
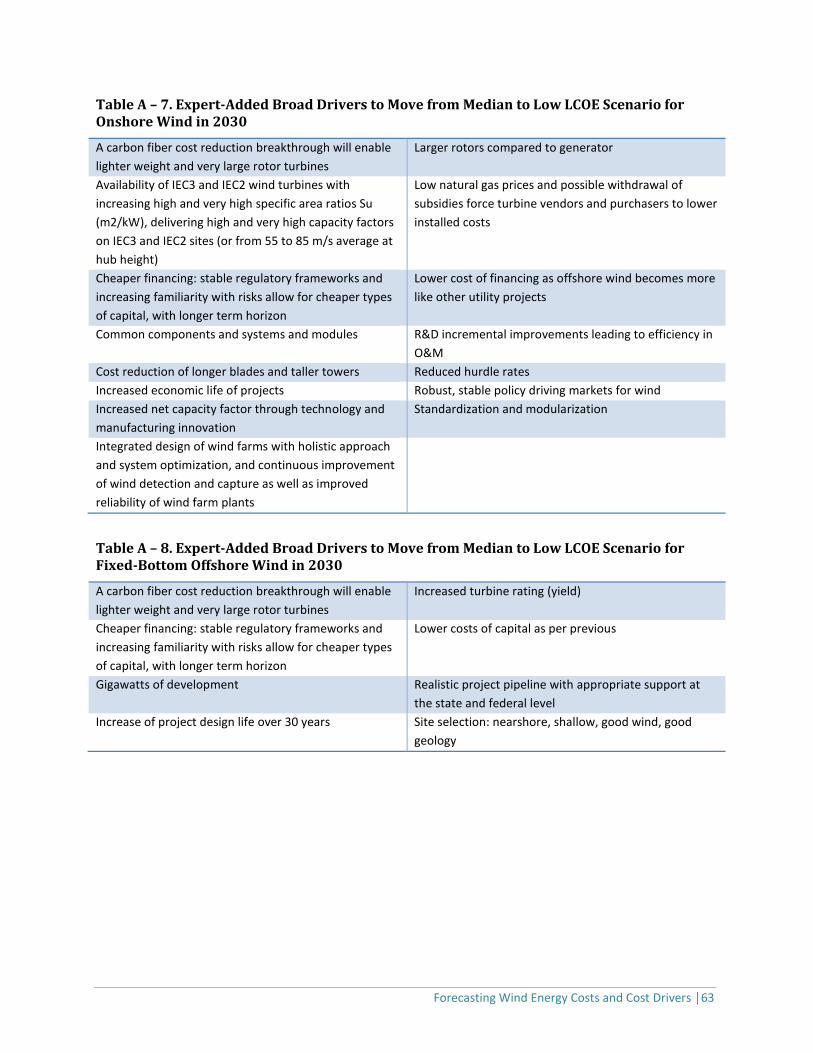
Forecasting Wind Energy Costs and Cost Drivers │63
Table A – 7. Expert-Added Broad Drivers to Move from Median to Low LCOE Scenario for Onshore Wind in 2030
A carbon fiber cost reduction breakthrough will enable
lighter weight and very large rotor turbines
Larger rotors compared to generator
Availability of IEC3 and IEC2 wind turbines with
increasing high and very high specific area ratios Su
(m2/kW), delivering high and very high capacity factors
on IEC3 and IEC2 sites (or from 55 to 85 m/s average at
hub height)
Low natural gas prices and possible withdrawal of
subsidies force turbine vendors and purchasers to lower
installed costs
Cheaper financing: stable regulatory frameworks and
increasing familiarity with risks allow for cheaper types
of capital, with longer term horizon
Lower cost of financing as offshore wind becomes more
like other utility projects
Common components and systems and modules R&D incremental improvements leading to efficiency in
O&M
Cost reduction of longer blades and taller towers Reduced hurdle rates
Increased economic life of projects Robust, stable policy driving markets for wind
Increased net capacity factor through technology and
manufacturing innovation
Standardization and modularization
Integrated design of wind farms with holistic approach
and system optimization, and continuous improvement
of wind detection and capture as well as improved
reliability of wind farm plants
Table A – 8. Expert-Added Broad Drivers to Move from Median to Low LCOE Scenario for Fixed-Bottom Offshore Wind in 2030
A carbon fiber cost reduction breakthrough will enable
lighter weight and very large rotor turbines
Increased turbine rating (yield)
Cheaper financing: stable regulatory frameworks and
increasing familiarity with risks allow for cheaper types
of capital, with longer term horizon
Lower costs of capital as per previous
Gigawatts of development Realistic project pipeline with appropriate support at
the state and federal level
Increase of project design life over 30 years Site selection: nearshore, shallow, good wind, good
geology
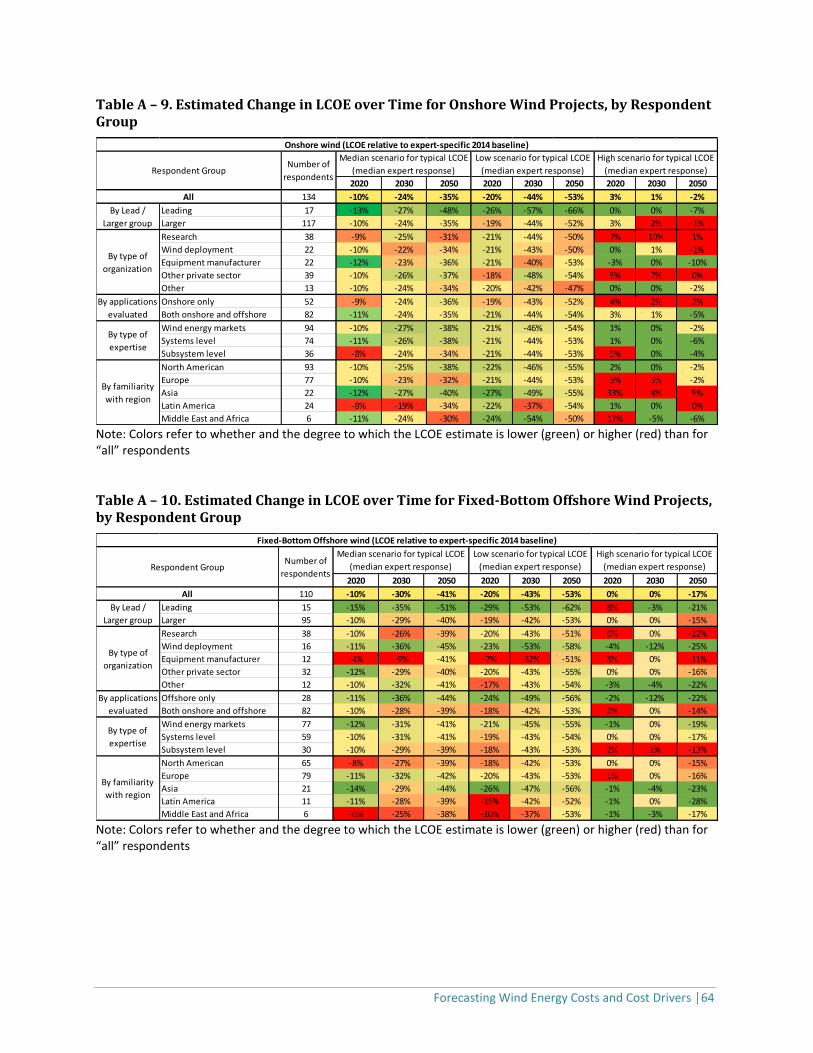
Forecasting Wind Energy Costs and Cost Drivers │64
Table A – 9. Estimated Change in LCOE over Time for Onshore Wind Projects, by Respondent Group
Note: Colors refer to whether and the degree to which the LCOE estimate is lower (green) or higher (red) than for “all” respondents
Table A – 10. Estimated Change in LCOE over Time for Fixed-Bottom Offshore Wind Projects, by Respondent Group
Note: Colors refer to whether and the degree to which the LCOE estimate is lower (green) or higher (red) than for “all” respondents
2020 2030 2050 2020 2030 2050 2020 2030 2050
134 -10% -24% -35% -20% -44% -53% 3% 1% -2%
Leading 17 -13% -27% -48% -26% -57% -66% 0% 0% -7%
Larger 117 -10% -24% -35% -19% -44% -52% 3% 2% -1%
Research 38 -9% -25% -31% -21% -44% -50% 7% 10% 1%
Wind deployment 22 -10% -22% -34% -21% -43% -50% 0% 1% -1%
Equipment manufacturer 22 -12% -23% -36% -21% -40% -53% -3% 0% -10%
Other private sector 39 -10% -26% -37% -18% -48% -54% 5% 7% 0%
Other 13 -10% -24% -34% -20% -42% -47% 0% 0% -2%
Onshore only 52 -9% -24% -36% -19% -43% -52% 4% 2% 3%
Both onshore and offshore 82 -11% -24% -35% -21% -44% -54% 3% 1% -5%
Wind energy markets 94 -10% -27% -38% -21% -46% -54% 1% 0% -2%
Systems level 74 -11% -26% -38% -21% -44% -53% 1% 0% -6%
Subsystem level 36 -8% -24% -34% -21% -44% -53% 5% 0% -4%
North American 93 -10% -25% -38% -22% -46% -55% 2% 0% -2%
Europe 77 -10% -23% -32% -21% -44% -53% 5% 5% -2%
Asia 22 -12% -27% -40% -27% -49% -55% 33% 4% 9%
Latin America 24 -8% -19% -34% -22% -37% -54% 1% 0% 0%
Middle East and Africa 6 -11% -24% -30% -24% -54% -50% 17% -5% -6%
Onshore wind (LCOE relative to expert-specific 2014 baseline)
Respondent GroupNumber of
respondents
All
Median scenario for typical LCOE
(median expert response)
Low scenario for typical LCOE
(median expert response)
High scenario for typical LCOE
(median expert response)
By familiarity
with region
By type of
expertise
By applications
evaluated
By type of
organization
By Lead /
Larger group
2020 2030 2050 2020 2030 2050 2020 2030 2050
110 -10% -30% -41% -20% -43% -53% 0% 0% -17%
Leading 15 -15% -35% -51% -29% -53% -62% 8% -3% -21%
Larger 95 -10% -29% -40% -19% -42% -53% 0% 0% -15%
Research 38 -10% -26% -39% -20% -43% -51% 6% 0% -12%
Wind deployment 16 -11% -36% -45% -23% -53% -58% -4% -12% -25%
Equipment manufacturer 12 -4% -9% -41% -7% -32% -51% 3% 0% -11%
Other private sector 32 -12% -29% -40% -20% -43% -55% 0% 0% -16%
Other 12 -10% -32% -41% -17% -43% -54% -3% -4% -22%
Offshore only 28 -11% -36% -44% -24% -49% -56% -2% -12% -22%
Both onshore and offshore 82 -10% -28% -39% -18% -42% -53% 2% 0% -14%
Wind energy markets 77 -12% -31% -41% -21% -45% -55% -1% 0% -19%
Systems level 59 -10% -31% -41% -19% -43% -54% 0% 0% -17%
Subsystem level 30 -10% -29% -39% -18% -43% -53% 2% 1% -13%
North American 65 -8% -27% -39% -18% -42% -53% 0% 0% -15%
Europe 79 -11% -32% -42% -20% -43% -53% 1% 0% -16%
Asia 21 -14% -29% -44% -26% -47% -56% -1% -4% -23%
Latin America 11 -11% -28% -39% -15% -42% -52% -1% 0% -28%
Middle East and Africa 6 -6% -25% -38% -10% -37% -53% -1% -3% -17%
Median scenario for typical LCOE
(median expert response)
Low scenario for typical LCOE
(median expert response)
High scenario for typical LCOE
(median expert response)
Fixed-Bottom Offshore wind (LCOE relative to expert-specific 2014 baseline)
All
Respondent Group
By Lead /
Larger group
By type of
organization
By applications
evaluated
By type of
expertise
By familiarity
with region
Number of
respondents
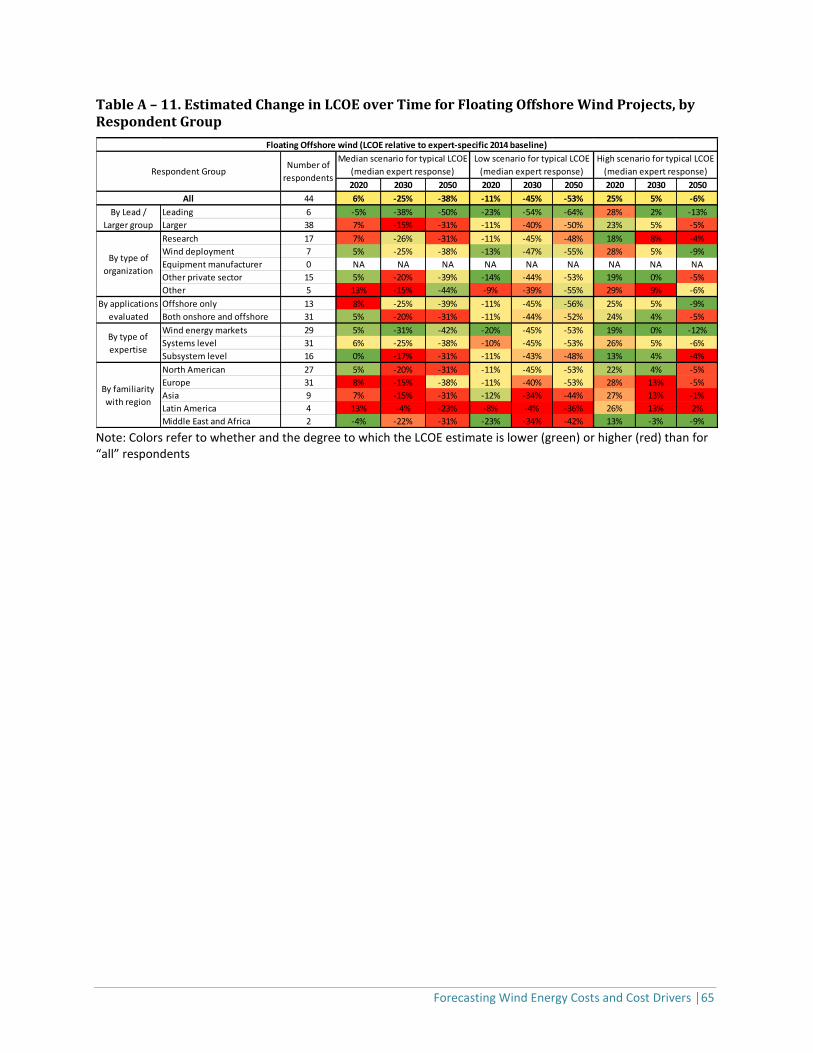
Forecasting Wind Energy Costs and Cost Drivers │65
Table A – 11. Estimated Change in LCOE over Time for Floating Offshore Wind Projects, by Respondent Group
Note: Colors refer to whether and the degree to which the LCOE estimate is lower (green) or higher (red) than for “all” respondents
2020 2030 2050 2020 2030 2050 2020 2030 2050
44 6% -25% -38% -11% -45% -53% 25% 5% -6%
Leading 6 -5% -38% -50% -23% -54% -64% 28% 2% -13%
Larger 38 7% -15% -31% -11% -40% -50% 23% 5% -5%
Research 17 7% -26% -31% -11% -45% -48% 18% 8% -4%
Wind deployment 7 5% -25% -38% -13% -47% -55% 28% 5% -9%
Equipment manufacturer 0 NA NA NA NA NA NA NA NA NA
Other private sector 15 5% -20% -39% -14% -44% -53% 19% 0% -5%
Other 5 13% -15% -44% -9% -39% -55% 29% 9% -6%
Offshore only 13 8% -25% -39% -11% -45% -56% 25% 5% -9%
Both onshore and offshore 31 5% -20% -31% -11% -44% -52% 24% 4% -5%
Wind energy markets 29 5% -31% -42% -20% -45% -53% 19% 0% -12%
Systems level 31 6% -25% -38% -10% -45% -53% 26% 5% -6%
Subsystem level 16 0% -17% -31% -11% -43% -48% 13% 4% -4%
North American 27 5% -20% -31% -11% -45% -53% 22% 4% -5%
Europe 31 8% -15% -38% -11% -40% -53% 28% 13% -5%
Asia 9 7% -15% -31% -12% -34% -44% 27% 13% -1%
Latin America 4 13% -4% -23% -8% -4% -36% 26% 13% 2%
Middle East and Africa 2 -4% -22% -31% -23% -34% -42% 13% -3% -9%
Floating Offshore wind (LCOE relative to expert-specific 2014 baseline)
Respondent Group
All
By type of
organization
By applications
evaluated
High scenario for typical LCOE
(median expert response)
By type of
expertise
By familiarity
with region
Number of
respondents
Median scenario for typical LCOE
(median expert response)
Low scenario for typical LCOE
(median expert response)
By Lead /
Larger group
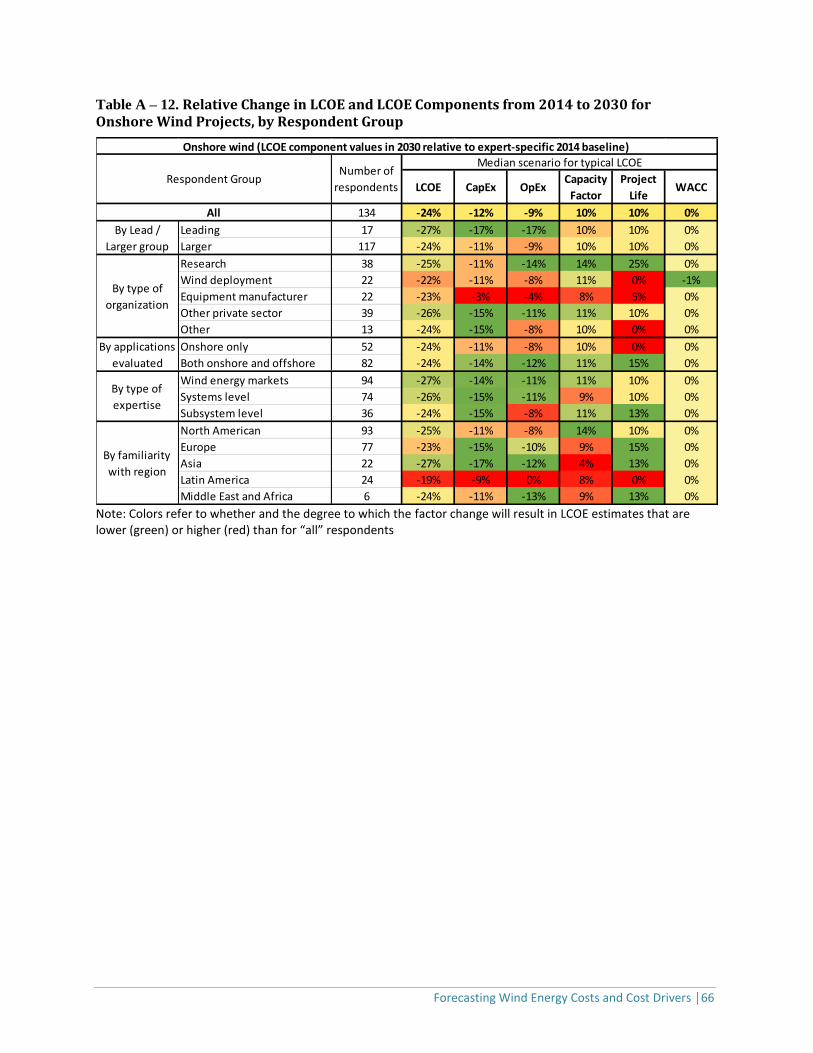
Forecasting Wind Energy Costs and Cost Drivers │66
Table A – 12. Relative Change in LCOE and LCOE Components from 2014 to 2030 for Onshore Wind Projects, by Respondent Group
Note: Colors refer to whether and the degree to which the factor change will result in LCOE estimates that are lower (green) or higher (red) than for “all” respondents
LCOE CapEx OpExCapacity
Factor
Project
LifeWACC
134 -24% -12% -9% 10% 10% 0%
Leading 17 -27% -17% -17% 10% 10% 0%
Larger 117 -24% -11% -9% 10% 10% 0%
Research 38 -25% -11% -14% 14% 25% 0%
Wind deployment 22 -22% -11% -8% 11% 0% -1%
Equipment manufacturer 22 -23% -3% -4% 8% 5% 0%
Other private sector 39 -26% -15% -11% 11% 10% 0%
Other 13 -24% -15% -8% 10% 0% 0%
Onshore only 52 -24% -11% -8% 10% 0% 0%
Both onshore and offshore 82 -24% -14% -12% 11% 15% 0%
Wind energy markets 94 -27% -14% -11% 11% 10% 0%
Systems level 74 -26% -15% -11% 9% 10% 0%
Subsystem level 36 -24% -15% -8% 11% 13% 0%
North American 93 -25% -11% -8% 14% 10% 0%
Europe 77 -23% -15% -10% 9% 15% 0%
Asia 22 -27% -17% -12% 4% 13% 0%
Latin America 24 -19% -9% 0% 8% 0% 0%
Middle East and Africa 6 -24% -11% -13% 9% 13% 0%
By Lead /
Larger group
Onshore wind (LCOE component values in 2030 relative to expert-specific 2014 baseline)
Respondent Group
All
By type of
organization
By applications
evaluated
By type of
expertise
By familiarity
with region
Median scenario for typical LCOENumber of
respondents
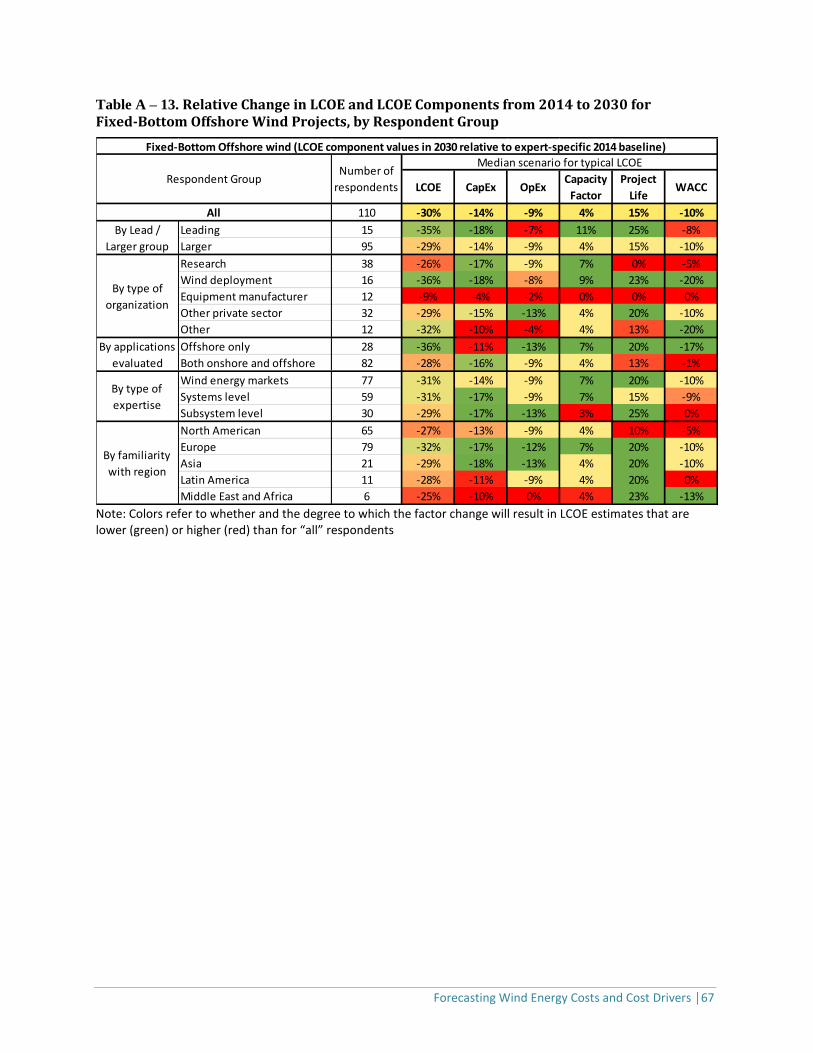
Forecasting Wind Energy Costs and Cost Drivers │67
Table A – 13. Relative Change in LCOE and LCOE Components from 2014 to 2030 for Fixed-Bottom Offshore Wind Projects, by Respondent Group
Note: Colors refer to whether and the degree to which the factor change will result in LCOE estimates that are lower (green) or higher (red) than for “all” respondents
LCOE CapEx OpExCapacity
Factor
Project
LifeWACC
110 -30% -14% -9% 4% 15% -10%
Leading 15 -35% -18% -7% 11% 25% -8%
Larger 95 -29% -14% -9% 4% 15% -10%
Research 38 -26% -17% -9% 7% 0% -5%
Wind deployment 16 -36% -18% -8% 9% 23% -20%
Equipment manufacturer 12 -9% -4% -2% 0% 0% 0%
Other private sector 32 -29% -15% -13% 4% 20% -10%
Other 12 -32% -10% -4% 4% 13% -20%
Offshore only 28 -36% -11% -13% 7% 20% -17%
Both onshore and offshore 82 -28% -16% -9% 4% 13% -1%
Wind energy markets 77 -31% -14% -9% 7% 20% -10%
Systems level 59 -31% -17% -9% 7% 15% -9%
Subsystem level 30 -29% -17% -13% 3% 25% 0%
North American 65 -27% -13% -9% 4% 10% -5%
Europe 79 -32% -17% -12% 7% 20% -10%
Asia 21 -29% -18% -13% 4% 20% -10%
Latin America 11 -28% -11% -9% 4% 20% 0%
Middle East and Africa 6 -25% -10% 0% 4% 23% -13%
All
Fixed-Bottom Offshore wind (LCOE component values in 2030 relative to expert-specific 2014 baseline)
By type of
expertise
By familiarity
with region
Number of
respondents
Median scenario for typical LCOE
By Lead /
Larger group
By type of
organization
By applications
evaluated
Respondent Group
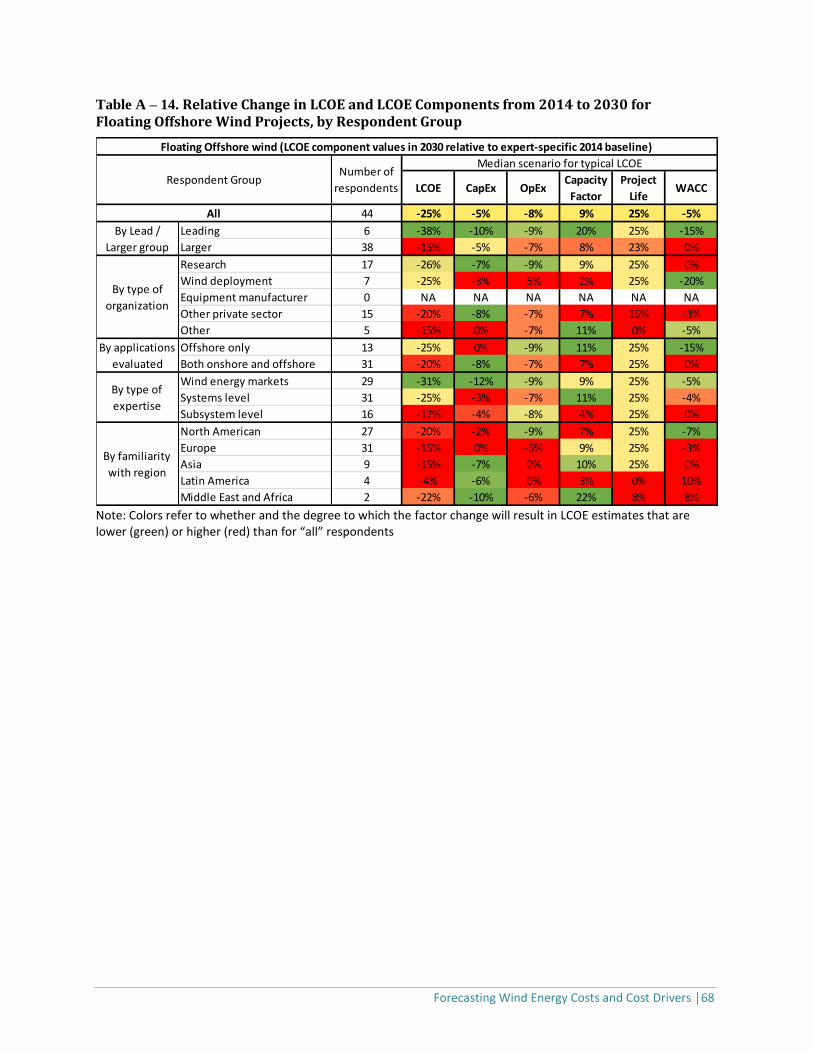
Forecasting Wind Energy Costs and Cost Drivers │68
Table A – 14. Relative Change in LCOE and LCOE Components from 2014 to 2030 for Floating Offshore Wind Projects, by Respondent Group
Note: Colors refer to whether and the degree to which the factor change will result in LCOE estimates that are lower (green) or higher (red) than for “all” respondents
LCOE CapEx OpExCapacity
Factor
Project
LifeWACC
44 -25% -5% -8% 9% 25% -5%
Leading 6 -38% -10% -9% 20% 25% -15%
Larger 38 -15% -5% -7% 8% 23% 0%
Research 17 -26% -7% -9% 9% 25% 0%
Wind deployment 7 -25% -3% 5% 2% 25% -20%
Equipment manufacturer 0 NA NA NA NA NA NA
Other private sector 15 -20% -8% -7% 7% 16% -3%
Other 5 -15% 0% -7% 11% 0% -5%
Offshore only 13 -25% 0% -9% 11% 25% -15%
Both onshore and offshore 31 -20% -8% -7% 7% 25% 0%
Wind energy markets 29 -31% -12% -9% 9% 25% -5%
Systems level 31 -25% -3% -7% 11% 25% -4%
Subsystem level 16 -17% -4% -8% 4% 25% 0%
North American 27 -20% -2% -9% 7% 25% -7%
Europe 31 -15% 0% -5% 9% 25% -3%
Asia 9 -15% -7% 0% 10% 25% 0%
Latin America 4 -4% -6% 0% 3% 0% 10%
Middle East and Africa 2 -22% -10% -6% 22% 8% 8%
All
Floating Offshore wind (LCOE component values in 2030 relative to expert-specific 2014 baseline)
By type of
expertise
By familiarity
with region
Number of
respondents
Median scenario for typical LCOE
By Lead /
Larger group
By type of
organization
By applications
evaluated
Respondent Group
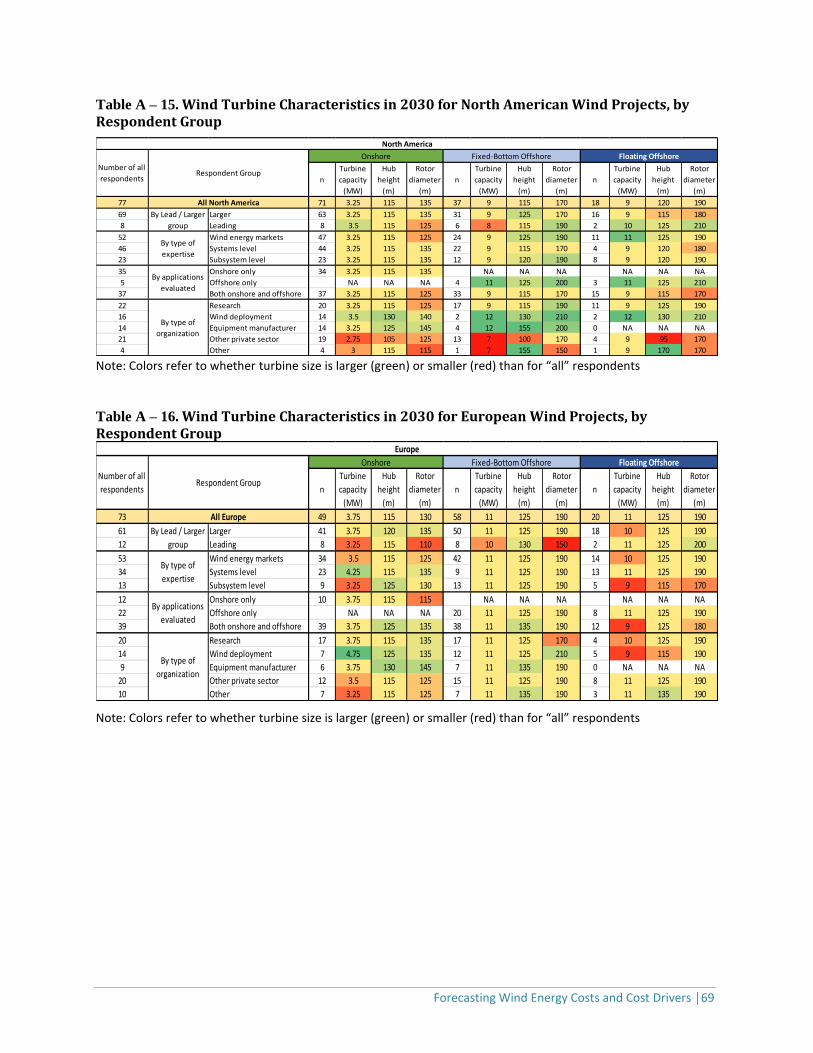
Forecasting Wind Energy Costs and Cost Drivers │69
Table A – 15. Wind Turbine Characteristics in 2030 for North American Wind Projects, by Respondent Group
Note: Colors refer to whether turbine size is larger (green) or smaller (red) than for “all” respondents
Table A – 16. Wind Turbine Characteristics in 2030 for European Wind Projects, by Respondent Group
Note: Colors refer to whether turbine size is larger (green) or smaller (red) than for “all” respondents
n
Turbine
capacity
(MW)
Hub
height
(m)
Rotor
diameter
(m)
n
Turbine
capacity
(MW)
Hub
height
(m)
Rotor
diameter
(m)
n
Turbine
capacity
(MW)
Hub
height
(m)
Rotor
diameter
(m)
77 71 3.25 115 135 37 9 115 170 18 9 120 190
69 Larger 63 3.25 115 135 31 9 125 170 16 9 115 180
8 Leading 8 3.5 115 125 6 8 115 190 2 10 125 210
52 Wind energy markets 47 3.25 115 125 24 9 125 190 11 11 125 190
46 Systems level 44 3.25 115 135 22 9 115 170 4 9 120 180
23 Subsystem level 23 3.25 115 135 12 9 120 190 8 9 120 190
35 Onshore only 34 3.25 115 135 NA NA NA NA NA NA
5 Offshore only NA NA NA 4 11 125 200 3 11 125 210
37 Both onshore and offshore 37 3.25 115 125 33 9 115 170 15 9 115 170
22 Research 20 3.25 115 125 17 9 115 190 11 9 125 190
16 Wind deployment 14 3.5 130 140 2 12 130 210 2 12 130 210
14 Equipment manufacturer 14 3.25 125 145 4 12 155 200 0 NA NA NA
21 Other private sector 19 2.75 105 125 13 7 100 170 4 9 95 170
4 Other 4 3 115 115 1 7 155 150 1 9 170 170
North America
Number of all
respondentsRespondent Group
All North America
By Lead / Larger
group
By type of
expertise
By applications
evaluated
By type of
organization
Onshore Fixed-Bottom Offshore Floating Offshore
n
Turbine
capacity
(MW)
Hub
height
(m)
Rotor
diameter
(m)
n
Turbine
capacity
(MW)
Hub
height
(m)
Rotor
diameter
(m)
n
Turbine
capacity
(MW)
Hub
height
(m)
Rotor
diameter
(m)
73 49 3.75 115 130 58 11 125 190 20 11 125 190
61 Larger 41 3.75 120 135 50 11 125 190 18 10 125 190
12 Leading 8 3.25 115 110 8 10 130 150 2 11 125 200
53 Wind energy markets 34 3.5 115 125 42 11 125 190 14 10 125 190
34 Systems level 23 4.25 115 135 9 11 125 190 13 11 125 190
13 Subsystem level 9 3.25 125 130 13 11 125 190 5 9 115 170
12 Onshore only 10 3.75 115 115 NA NA NA NA NA NA
22 Offshore only NA NA NA 20 11 125 190 8 11 125 190
39 Both onshore and offshore 39 3.75 125 135 38 11 135 190 12 9 125 180
20 Research 17 3.75 115 135 17 11 125 170 4 10 125 190
14 Wind deployment 7 4.75 125 135 12 11 125 210 5 9 115 190
9 Equipment manufacturer 6 3.75 130 145 7 11 135 190 0 NA NA NA
20 Other private sector 12 3.5 115 125 15 11 125 190 8 11 125 190
10 Other 7 3.25 115 125 7 11 135 190 3 11 135 190
Respondent Group
By Lead / Larger
group
All Europe
By type of
expertise
By type of
organization
By applications
evaluated
Europe
Number of all
respondents
Onshore Fixed-Bottom Offshore Floating Offshore
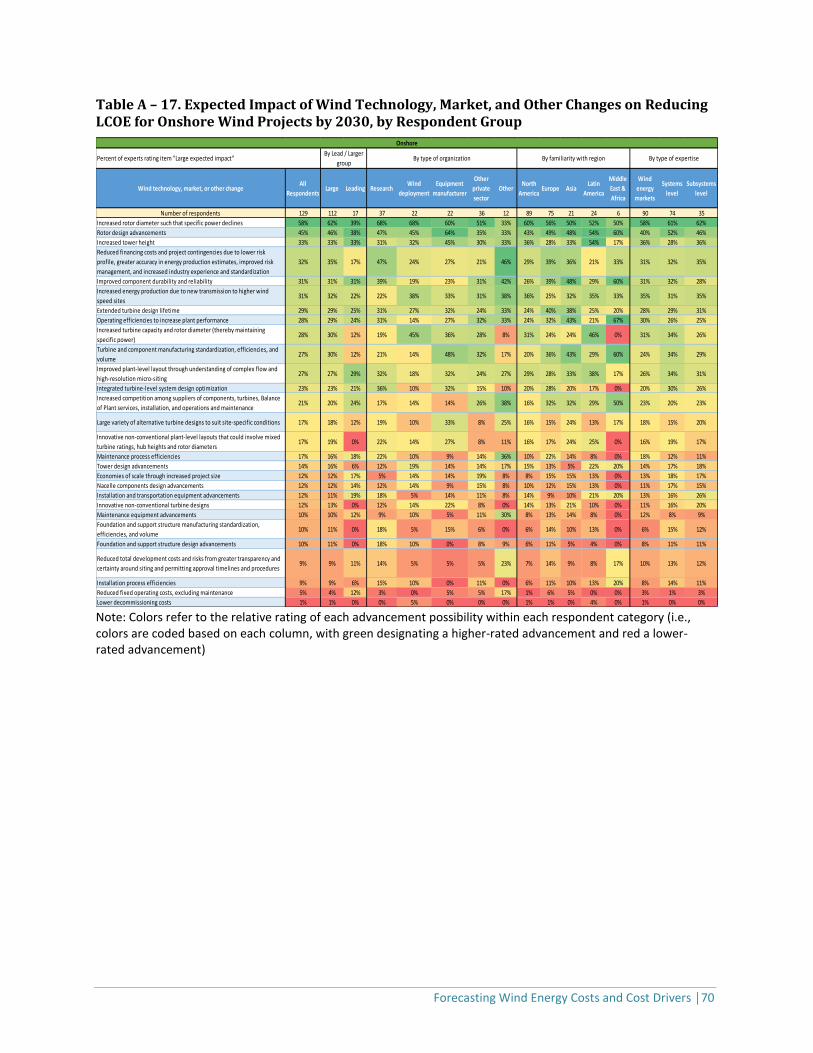
Forecasting Wind Energy Costs and Cost Drivers │70
Table A – 17. Expected Impact of Wind Technology, Market, and Other Changes on Reducing LCOE for Onshore Wind Projects by 2030, by Respondent Group
Note: Colors refer to the relative rating of each advancement possibility within each respondent category (i.e., colors are coded based on each column, with green designating a higher-rated advancement and red a lower-rated advancement)
Wind technology, market, or other changeAll
RespondentsLarge Leading Research
Wind
deployment
Equipment
manufacturer
Other
private
sector
OtherNorth
AmericaEurope Asia
Latin
America
Middle
East &
Africa
Wind
energy
markets
Systems
level
Subsystems
level
Number of respondents 129 112 17 37 22 22 36 12 89 75 21 24 6 90 74 35
Increased rotor diameter such that specific power declines 58% 62% 39% 68% 68% 60% 51% 33% 60% 56% 50% 52% 50% 58% 61% 62%
Rotor design advancements 45% 46% 38% 47% 45% 64% 35% 33% 43% 49% 48% 54% 60% 40% 52% 46%
Increased tower height 33% 33% 33% 31% 32% 45% 30% 33% 36% 28% 33% 54% 17% 36% 28% 36%
Reduced financing costs and project contingencies due to lower risk
profile, greater accuracy in energy production estimates, improved risk
management, and increased industry experience and standardization
32% 35% 17% 47% 24% 27% 21% 46% 29% 39% 36% 21% 33% 31% 32% 35%
Improved component durability and reliability 31% 31% 31% 39% 19% 23% 31% 42% 26% 39% 48% 29% 60% 31% 32% 28%
Increased energy production due to new transmission to higher wind
speed sites31% 32% 22% 22% 38% 33% 31% 38% 36% 25% 32% 35% 33% 35% 31% 35%
Extended turbine design lifetime 29% 29% 25% 31% 27% 32% 24% 33% 24% 40% 38% 25% 20% 28% 29% 31%
Operating efficiencies to increase plant performance 28% 29% 24% 31% 14% 27% 32% 33% 24% 32% 43% 21% 67% 30% 26% 25%
Increased turbine capacity and rotor diameter (thereby maintaining
specific power)28% 30% 12% 19% 45% 36% 28% 8% 31% 24% 24% 46% 0% 31% 34% 26%
Turbine and component manufacturing standardization, efficiencies, and
volume27% 30% 12% 21% 14% 48% 32% 17% 20% 36% 43% 29% 60% 24% 34% 29%
Improved plant-level layout through understanding of complex flow and
high-resolution micro-siting27% 27% 29% 32% 18% 32% 24% 27% 29% 28% 33% 38% 17% 26% 34% 31%
Integrated turbine-level system design optimization 23% 23% 21% 36% 10% 32% 15% 10% 20% 28% 20% 17% 0% 20% 30% 26%
Increased competition among suppliers of components, turbines, Balance
of Plant services, installation, and operations and maintenance21% 20% 24% 17% 14% 14% 26% 38% 16% 32% 32% 29% 50% 23% 20% 23%
Large variety of alternative turbine designs to suit site-specific conditions 17% 18% 12% 19% 10% 33% 8% 25% 16% 15% 24% 13% 17% 18% 15% 20%
Innovative non-conventional plant-level layouts that could involve mixed
turbine ratings, hub heights and rotor diameters17% 19% 0% 22% 14% 27% 8% 11% 16% 17% 24% 25% 0% 16% 19% 17%
Maintenance process efficiencies 17% 16% 18% 22% 10% 9% 14% 36% 10% 22% 14% 8% 0% 18% 12% 11%
Tower design advancements 14% 16% 6% 12% 19% 14% 14% 17% 15% 13% 5% 22% 20% 14% 17% 18%
Economies of scale through increased project size 12% 12% 17% 5% 14% 14% 19% 8% 8% 15% 15% 13% 0% 13% 18% 17%
Nacelle components design advancements 12% 12% 14% 12% 14% 9% 15% 8% 10% 12% 15% 13% 0% 11% 17% 15%
Installation and transportation equipment advancements 12% 11% 19% 18% 5% 14% 11% 8% 14% 9% 10% 21% 20% 13% 16% 26%
Innovative non-conventional turbine designs 12% 13% 0% 12% 14% 22% 8% 0% 14% 13% 21% 10% 0% 11% 16% 20%
Maintenance equipment advancements 10% 10% 12% 9% 10% 5% 11% 30% 8% 13% 14% 8% 0% 12% 8% 9%
Foundation and support structure manufacturing standardization,
efficiencies, and volume10% 11% 0% 18% 5% 15% 6% 0% 6% 14% 10% 13% 0% 6% 15% 12%
Foundation and support structure design advancements 10% 11% 0% 18% 10% 0% 8% 9% 6% 11% 5% 4% 0% 8% 11% 11%
Reduced total development costs and risks from greater transparency and
certainty around siting and permitting approval timelines and procedures9% 9% 11% 14% 5% 5% 5% 23% 7% 14% 9% 8% 17% 10% 13% 12%
Installation process efficiencies 9% 9% 6% 15% 10% 0% 11% 0% 6% 11% 10% 13% 20% 8% 14% 11%
Reduced fixed operating costs, excluding maintenance 5% 4% 12% 3% 0% 5% 5% 17% 1% 6% 5% 0% 0% 3% 1% 3%
Lower decommissioning costs 1% 1% 0% 0% 5% 0% 0% 0% 1% 1% 0% 4% 0% 1% 0% 0%
Onshore
Percent of experts rating item "Large expected impact"By Lead / Larger
groupBy type of organization By familiarity with region By type of expertise
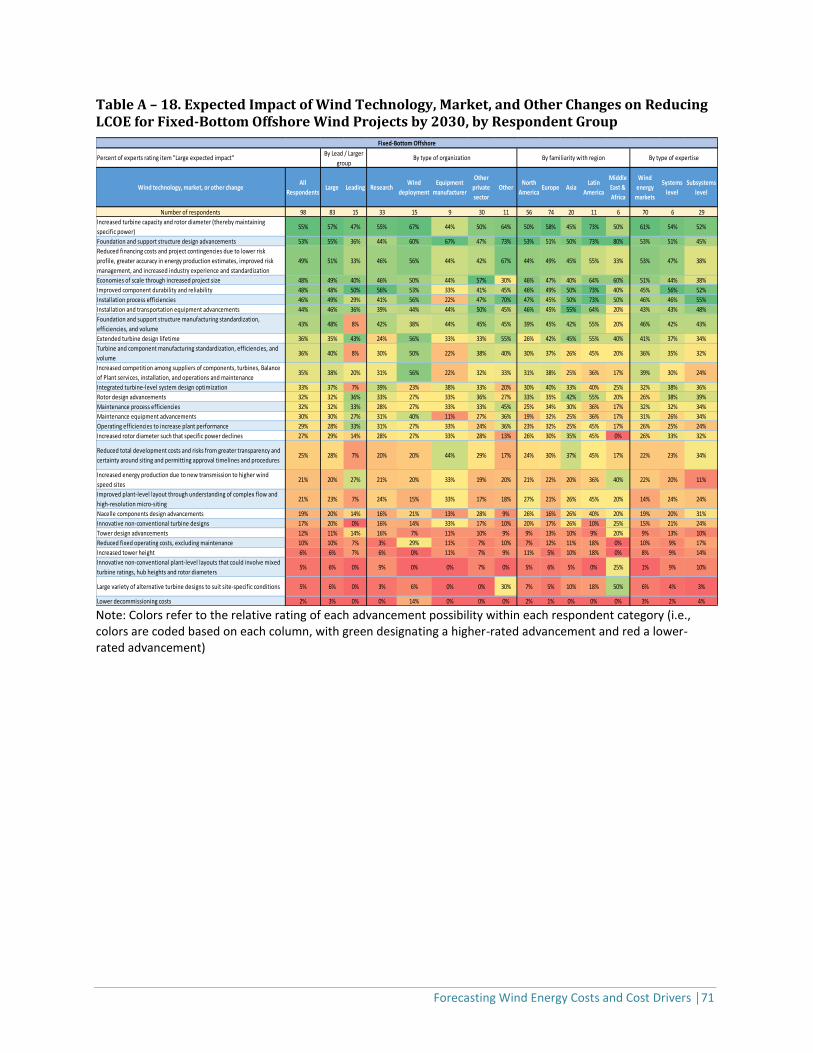
Forecasting Wind Energy Costs and Cost Drivers │71
Table A – 18. Expected Impact of Wind Technology, Market, and Other Changes on Reducing LCOE for Fixed-Bottom Offshore Wind Projects by 2030, by Respondent Group
Note: Colors refer to the relative rating of each advancement possibility within each respondent category (i.e., colors are coded based on each column, with green designating a higher-rated advancement and red a lower-rated advancement)
Wind technology, market, or other changeAll
RespondentsLarge Leading Research
Wind
deployment
Equipment
manufacturer
Other
private
sector
OtherNorth
AmericaEurope Asia
Latin
America
Middle
East &
Africa
Wind
energy
markets
Systems
level
Subsystems
level
Number of respondents 98 83 15 33 15 9 30 11 56 74 20 11 6 70 6 29
Increased turbine capacity and rotor diameter (thereby maintaining
specific power)55% 57% 47% 55% 67% 44% 50% 64% 50% 58% 45% 73% 50% 61% 54% 52%
Foundation and support structure design advancements 53% 55% 36% 44% 60% 67% 47% 73% 53% 51% 50% 73% 80% 53% 51% 45%
Reduced financing costs and project contingencies due to lower risk
profile, greater accuracy in energy production estimates, improved risk
management, and increased industry experience and standardization
49% 51% 33% 46% 56% 44% 42% 67% 44% 49% 45% 55% 33% 53% 47% 38%
Economies of scale through increased project size 48% 49% 40% 46% 50% 44% 57% 30% 46% 47% 40% 64% 60% 51% 44% 38%
Improved component durability and reliability 48% 48% 50% 56% 53% 33% 41% 45% 46% 49% 50% 73% 40% 45% 56% 52%
Installation process efficiencies 46% 49% 29% 41% 56% 22% 47% 70% 47% 45% 50% 73% 50% 46% 46% 55%
Installation and transportation equipment advancements 44% 46% 36% 39% 44% 44% 50% 45% 46% 45% 55% 64% 20% 43% 43% 48%
Foundation and support structure manufacturing standardization,
efficiencies, and volume43% 48% 8% 42% 38% 44% 45% 45% 39% 45% 42% 55% 20% 46% 42% 43%
Extended turbine design lifetime 36% 35% 43% 24% 56% 33% 33% 55% 26% 42% 45% 55% 40% 41% 37% 34%
Turbine and component manufacturing standardization, efficiencies, and
volume36% 40% 8% 30% 50% 22% 38% 40% 30% 37% 26% 45% 20% 36% 35% 32%
Increased competition among suppliers of components, turbines, Balance
of Plant services, installation, and operations and maintenance35% 38% 20% 31% 56% 22% 32% 33% 31% 38% 25% 36% 17% 39% 30% 24%
Integrated turbine-level system design optimization 33% 37% 7% 39% 23% 38% 33% 20% 30% 40% 33% 40% 25% 32% 38% 36%
Rotor design advancements 32% 32% 36% 33% 27% 33% 36% 27% 33% 35% 42% 55% 20% 26% 38% 39%
Maintenance process efficiencies 32% 32% 33% 28% 27% 33% 33% 45% 25% 34% 30% 36% 17% 32% 32% 34%
Maintenance equipment advancements 30% 30% 27% 31% 40% 11% 27% 36% 19% 32% 25% 36% 17% 31% 26% 34%
Operating efficiencies to increase plant performance 29% 28% 33% 31% 27% 33% 24% 36% 23% 32% 25% 45% 17% 26% 25% 24%
Increased rotor diameter such that specific power declines 27% 29% 14% 28% 27% 33% 28% 13% 26% 30% 35% 45% 0% 26% 33% 32%
Reduced total development costs and risks from greater transparency and
certainty around siting and permitting approval timelines and procedures25% 28% 7% 20% 20% 44% 29% 17% 24% 30% 37% 45% 17% 22% 23% 34%
Increased energy production due to new transmission to higher wind
speed sites21% 20% 27% 21% 20% 33% 19% 20% 21% 22% 20% 36% 40% 22% 20% 11%
Improved plant-level layout through understanding of complex flow and
high-resolution micro-siting21% 23% 7% 24% 15% 33% 17% 18% 27% 21% 26% 45% 20% 14% 24% 24%
Nacelle components design advancements 19% 20% 14% 16% 21% 13% 28% 9% 26% 16% 26% 40% 20% 19% 20% 31%
Innovative non-conventional turbine designs 17% 20% 0% 16% 14% 33% 17% 10% 20% 17% 26% 10% 25% 15% 21% 24%
Tower design advancements 12% 11% 14% 16% 7% 11% 10% 9% 9% 13% 10% 9% 20% 9% 13% 10%
Reduced fixed operating costs, excluding maintenance 10% 10% 7% 3% 29% 11% 7% 10% 7% 12% 11% 18% 0% 10% 9% 17%
Increased tower height 6% 6% 7% 6% 0% 11% 7% 9% 11% 5% 10% 18% 0% 8% 9% 14%
Innovative non-conventional plant-level layouts that could involve mixed
turbine ratings, hub heights and rotor diameters5% 6% 0% 9% 0% 0% 7% 0% 5% 6% 5% 0% 25% 1% 9% 10%
Large variety of alternative turbine designs to suit site-specific conditions 5% 6% 0% 3% 6% 0% 0% 30% 7% 5% 10% 18% 50% 6% 4% 3%
Lower decommissioning costs 2% 3% 0% 0% 14% 0% 0% 0% 2% 1% 0% 0% 0% 3% 2% 4%
By type of expertise
Fixed-Bottom Offshore
Percent of experts rating item "Large expected impact"By Lead / Larger
groupBy type of organization By familiarity with region
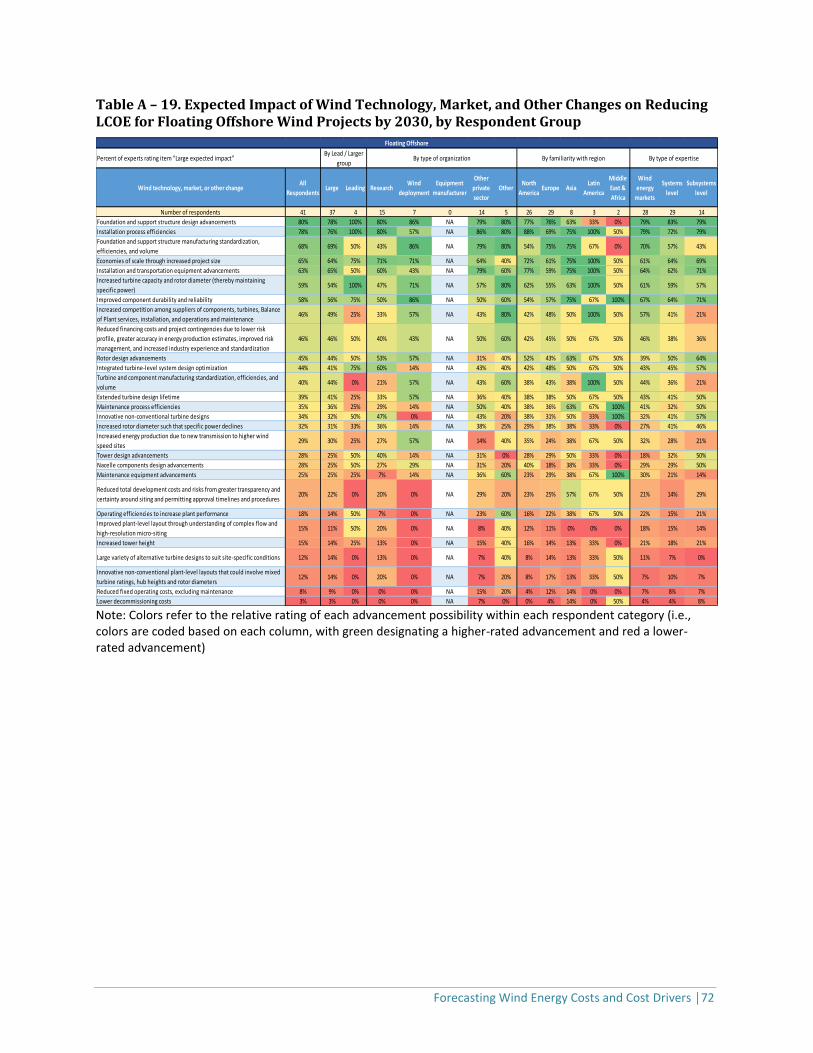
Forecasting Wind Energy Costs and Cost Drivers │72
Table A – 19. Expected Impact of Wind Technology, Market, and Other Changes on Reducing LCOE for Floating Offshore Wind Projects by 2030, by Respondent Group
Note: Colors refer to the relative rating of each advancement possibility within each respondent category (i.e., colors are coded based on each column, with green designating a higher-rated advancement and red a lower-rated advancement)
Wind technology, market, or other changeAll
RespondentsLarge Leading Research
Wind
deployment
Equipment
manufacturer
Other
private
sector
OtherNorth
AmericaEurope Asia
Latin
America
Middle
East &
Africa
Wind
energy
markets
Systems
level
Subsystems
level
Number of respondents 41 37 4 15 7 0 14 5 26 29 8 3 2 28 29 14
Foundation and support structure design advancements 80% 78% 100% 80% 86% NA 79% 80% 77% 76% 63% 33% 0% 79% 83% 79%
Installation process efficiencies 78% 76% 100% 80% 57% NA 86% 80% 88% 69% 75% 100% 50% 79% 72% 79%
Foundation and support structure manufacturing standardization,
efficiencies, and volume68% 69% 50% 43% 86% NA 79% 80% 54% 75% 75% 67% 0% 70% 57% 43%
Economies of scale through increased project size 65% 64% 75% 71% 71% NA 64% 40% 72% 61% 75% 100% 50% 61% 64% 69%
Installation and transportation equipment advancements 63% 65% 50% 60% 43% NA 79% 60% 77% 59% 75% 100% 50% 64% 62% 71%
Increased turbine capacity and rotor diameter (thereby maintaining
specific power)59% 54% 100% 47% 71% NA 57% 80% 62% 55% 63% 100% 50% 61% 59% 57%
Improved component durability and reliability 58% 56% 75% 50% 86% NA 50% 60% 54% 57% 75% 67% 100% 67% 64% 71%
Increased competition among suppliers of components, turbines, Balance
of Plant services, installation, and operations and maintenance46% 49% 25% 33% 57% NA 43% 80% 42% 48% 50% 100% 50% 57% 41% 21%
Reduced financing costs and project contingencies due to lower risk
profile, greater accuracy in energy production estimates, improved risk
management, and increased industry experience and standardization
46% 46% 50% 40% 43% NA 50% 60% 42% 45% 50% 67% 50% 46% 38% 36%
Rotor design advancements 45% 44% 50% 53% 57% NA 31% 40% 52% 43% 63% 67% 50% 39% 50% 64%
Integrated turbine-level system design optimization 44% 41% 75% 60% 14% NA 43% 40% 42% 48% 50% 67% 50% 43% 45% 57%
Turbine and component manufacturing standardization, efficiencies, and
volume40% 44% 0% 21% 57% NA 43% 60% 38% 43% 38% 100% 50% 44% 36% 21%
Extended turbine design lifetime 39% 41% 25% 33% 57% NA 36% 40% 38% 38% 50% 67% 50% 43% 41% 50%
Maintenance process efficiencies 35% 36% 25% 29% 14% NA 50% 40% 38% 36% 63% 67% 100% 41% 32% 50%
Innovative non-conventional turbine designs 34% 32% 50% 47% 0% NA 43% 20% 38% 31% 50% 33% 100% 32% 41% 57%
Increased rotor diameter such that specific power declines 32% 31% 33% 36% 14% NA 38% 25% 29% 38% 38% 33% 0% 27% 41% 46%
Increased energy production due to new transmission to higher wind
speed sites29% 30% 25% 27% 57% NA 14% 40% 35% 24% 38% 67% 50% 32% 28% 21%
Tower design advancements 28% 25% 50% 40% 14% NA 31% 0% 28% 29% 50% 33% 0% 18% 32% 50%
Nacelle components design advancements 28% 25% 50% 27% 29% NA 31% 20% 40% 18% 38% 33% 0% 29% 29% 50%
Maintenance equipment advancements 25% 25% 25% 7% 14% NA 36% 60% 23% 29% 38% 67% 100% 30% 21% 14%
Reduced total development costs and risks from greater transparency and
certainty around siting and permitting approval timelines and procedures20% 22% 0% 20% 0% NA 29% 20% 23% 25% 57% 67% 50% 21% 14% 29%
Operating efficiencies to increase plant performance 18% 14% 50% 7% 0% NA 23% 60% 16% 22% 38% 67% 50% 22% 15% 21%
Improved plant-level layout through understanding of complex flow and
high-resolution micro-siting15% 11% 50% 20% 0% NA 8% 40% 12% 11% 0% 0% 0% 18% 15% 14%
Increased tower height 15% 14% 25% 13% 0% NA 15% 40% 16% 14% 13% 33% 0% 21% 18% 21%
Large variety of alternative turbine designs to suit site-specific conditions 12% 14% 0% 13% 0% NA 7% 40% 8% 14% 13% 33% 50% 11% 7% 0%
Innovative non-conventional plant-level layouts that could involve mixed
turbine ratings, hub heights and rotor diameters12% 14% 0% 20% 0% NA 7% 20% 8% 17% 13% 33% 50% 7% 10% 7%
Reduced fixed operating costs, excluding maintenance 8% 9% 0% 0% 0% NA 15% 20% 4% 12% 14% 0% 0% 7% 8% 7%
Lower decommissioning costs 3% 3% 0% 0% 0% NA 7% 0% 0% 4% 14% 0% 50% 4% 4% 8%
By Lead / Larger
groupPercent of experts rating item "Large expected impact"
Floating Offshore
By type of organization By familiarity with region By type of expertise
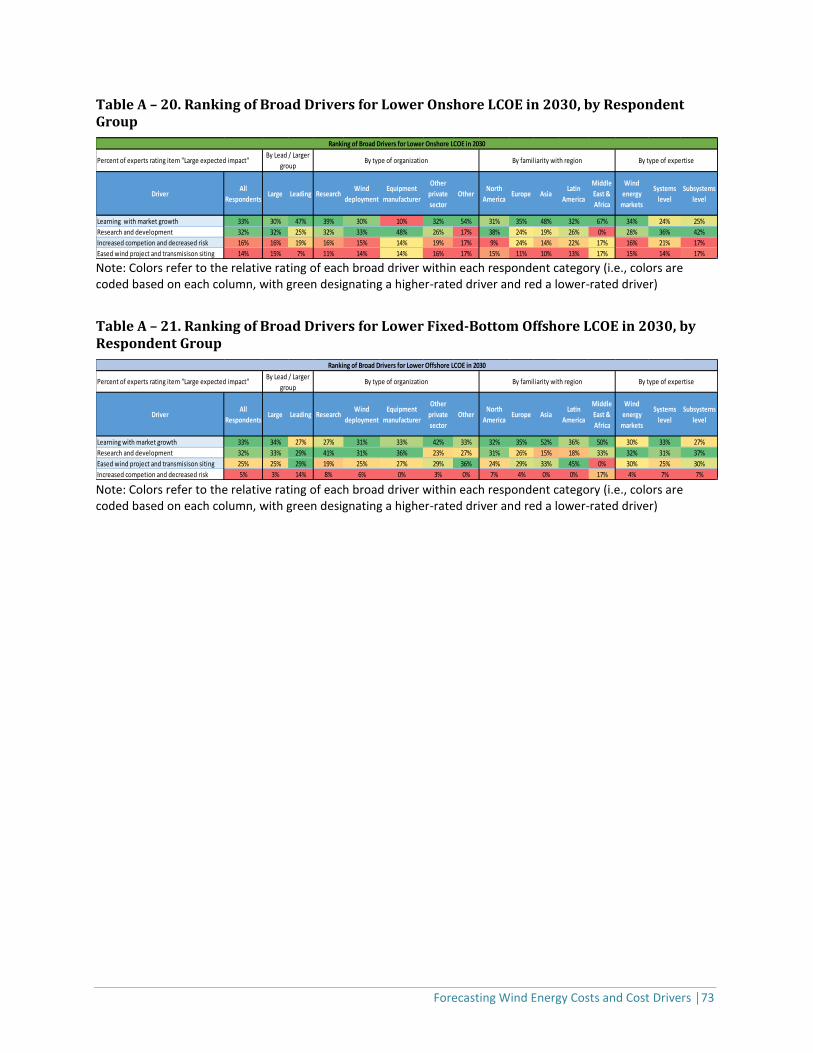
Forecasting Wind Energy Costs and Cost Drivers │73
Table A – 20. Ranking of Broad Drivers for Lower Onshore LCOE in 2030, by Respondent Group
Note: Colors refer to the relative rating of each broad driver within each respondent category (i.e., colors are coded based on each column, with green designating a higher-rated driver and red a lower-rated driver)
Table A – 21. Ranking of Broad Drivers for Lower Fixed-Bottom Offshore LCOE in 2030, by Respondent Group
Note: Colors refer to the relative rating of each broad driver within each respondent category (i.e., colors are coded based on each column, with green designating a higher-rated driver and red a lower-rated driver)
DriverAll
RespondentsLarge Leading Research
Wind
deployment
Equipment
manufacturer
Other
private
sector
OtherNorth
AmericaEurope Asia
Latin
America
Middle
East &
Africa
Wind
energy
markets
Systems
level
Subsystems
level
Learning with market growth 33% 30% 47% 39% 30% 10% 32% 54% 31% 35% 48% 32% 67% 34% 24% 25%
Research and development 32% 32% 25% 32% 33% 48% 26% 17% 38% 24% 19% 26% 0% 28% 36% 42%
Increased competion and decreased risk 16% 16% 19% 16% 15% 14% 19% 17% 9% 24% 14% 22% 17% 16% 21% 17%
Eased wind project and transmisison siting 14% 15% 7% 11% 14% 14% 16% 17% 15% 11% 10% 13% 17% 15% 14% 17%
Ranking of Broad Drivers for Lower Onshore LCOE in 2030
By type of organization By familiarity with region By type of expertisePercent of experts rating item "Large expected impact"By Lead / Larger
group
DriverAll
RespondentsLarge Leading Research
Wind
deployment
Equipment
manufacturer
Other
private
sector
OtherNorth
AmericaEurope Asia
Latin
America
Middle
East &
Africa
Wind
energy
markets
Systems
level
Subsystems
level
Learning with market growth 33% 34% 27% 27% 31% 33% 42% 33% 32% 35% 52% 36% 50% 30% 33% 27%
Research and development 32% 33% 29% 41% 31% 36% 23% 27% 31% 26% 15% 18% 33% 32% 31% 37%
Eased wind project and transmisison siting 25% 25% 29% 19% 25% 27% 29% 36% 24% 29% 33% 45% 0% 30% 25% 30%
Increased competion and decreased risk 5% 3% 14% 8% 6% 0% 3% 0% 7% 4% 0% 0% 17% 4% 7% 7%
By type of organization By familiarity with region By type of expertisePercent of experts rating item "Large expected impact"By Lead / Larger
group
Ranking of Broad Drivers for Lower Offshore LCOE in 2030
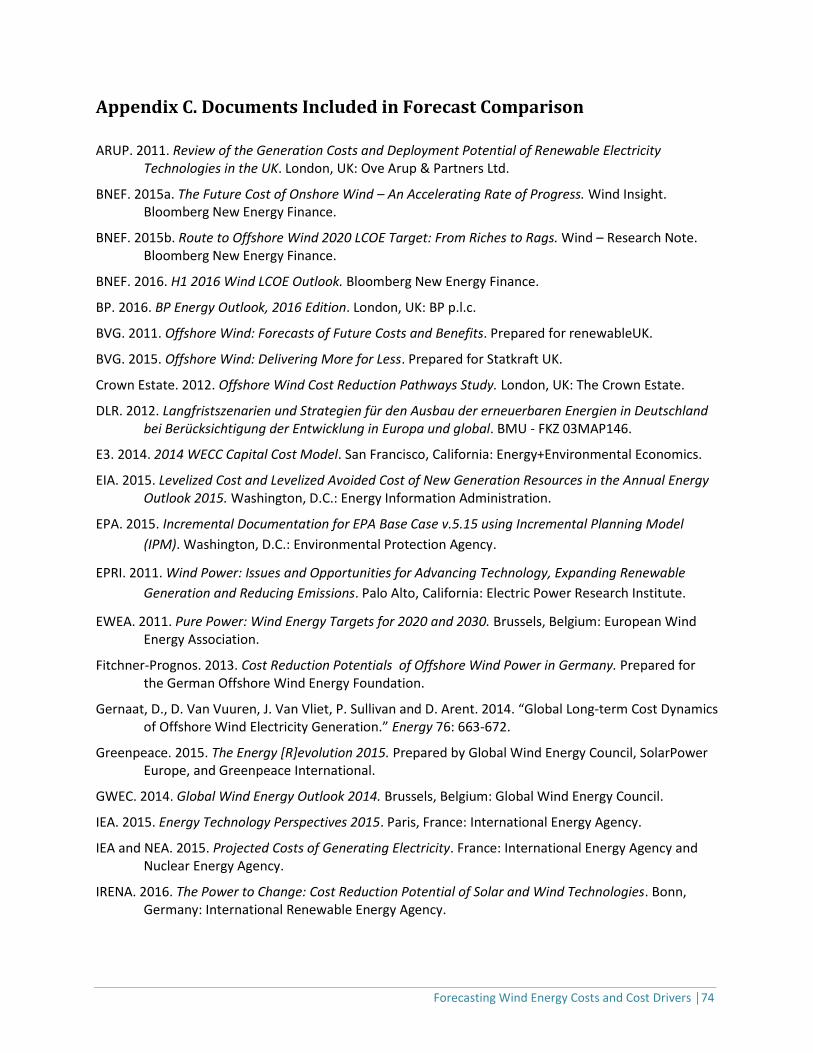
Forecasting Wind Energy Costs and Cost Drivers │74
Appendix C. Documents Included in Forecast Comparison
ARUP. 2011. Review of the Generation Costs and Deployment Potential of Renewable Electricity Technologies in the UK. London, UK: Ove Arup & Partners Ltd.
BNEF. 2015a. The Future Cost of Onshore Wind – An Accelerating Rate of Progress. Wind Insight. Bloomberg New Energy Finance.
BNEF. 2015b. Route to Offshore Wind 2020 LCOE Target: From Riches to Rags. Wind – Research Note. Bloomberg New Energy Finance.
BNEF. 2016. H1 2016 Wind LCOE Outlook. Bloomberg New Energy Finance.
BP. 2016. BP Energy Outlook, 2016 Edition. London, UK: BP p.l.c.
BVG. 2011. Offshore Wind: Forecasts of Future Costs and Benefits. Prepared for renewableUK.
BVG. 2015. Offshore Wind: Delivering More for Less. Prepared for Statkraft UK.
Crown Estate. 2012. Offshore Wind Cost Reduction Pathways Study. London, UK: The Crown Estate.
DLR. 2012. Langfristszenarien und Strategien für den Ausbau der erneuerbaren Energien in Deutschland bei Berücksichtigung der Entwicklung in Europa und global. BMU - FKZ 03MAP146.
E3. 2014. 2014 WECC Capital Cost Model. San Francisco, California: Energy+Environmental Economics.
EIA. 2015. Levelized Cost and Levelized Avoided Cost of New Generation Resources in the Annual Energy Outlook 2015. Washington, D.C.: Energy Information Administration.
EPA. 2015. Incremental Documentation for EPA Base Case v.5.15 using Incremental Planning Model
(IPM). Washington, D.C.: Environmental Protection Agency.
EPRI. 2011. Wind Power: Issues and Opportunities for Advancing Technology, Expanding Renewable
Generation and Reducing Emissions. Palo Alto, California: Electric Power Research Institute.
EWEA. 2011. Pure Power: Wind Energy Targets for 2020 and 2030. Brussels, Belgium: European Wind Energy Association.
Fitchner-Prognos. 2013. Cost Reduction Potentials of Offshore Wind Power in Germany. Prepared for the German Offshore Wind Energy Foundation.
Gernaat, D., D. Van Vuuren, J. Van Vliet, P. Sullivan and D. Arent. 2014. “Global Long-term Cost Dynamics of Offshore Wind Electricity Generation.” Energy 76: 663-672.
Greenpeace. 2015. The Energy [R]evolution 2015. Prepared by Global Wind Energy Council, SolarPower Europe, and Greenpeace International.
GWEC. 2014. Global Wind Energy Outlook 2014. Brussels, Belgium: Global Wind Energy Council.
IEA. 2015. Energy Technology Perspectives 2015. Paris, France: International Energy Agency.
IEA and NEA. 2015. Projected Costs of Generating Electricity. France: International Energy Agency and Nuclear Energy Agency.
IRENA. 2016. The Power to Change: Cost Reduction Potential of Solar and Wind Technologies. Bonn, Germany: International Renewable Energy Agency.

Forecasting Wind Energy Costs and Cost Drivers │75
Kempton, W., S. McClellan and D. Ozkan. 2016. Massachusetts Offshore Wind Future Cost Study. University of Delaware Special Initiative on Offshore Wind.
MAKE. 2015. Global Wind Turbine Trends 2015. Chicago, Illinois: MAKE Consulting.
Navigant. 2013. U.S. Offshore Wind Manufacturing and Supply Chain Development. Burlington, Massachusetts: Navigant Consulting.
NREL. 2012. Renewable Electricity Futures Study. Golden, Colorado: National Renewable Energy Laboratory.
NREL. 2016. 2016 Annual Technology Baseline – Discussion Draft. Golden, Colorado: National Renewable Energy Laboratory.
TKI Wind op Zee. 2015. Cost Reduction Options for Offshore Wind in the Netherlands FID 2010-2020. Prepared for TKI Wind op Zee.
Valpy, B. and P. English. 2014a. Future Renewable Energy Costs: Offshore Wind. BVG Associates and KIC InnoEnergy.
Valpy, B. and P. English. 2014b. Future Renewable Energy Costs: Onshore Wind. BVG Associates and KIC InnoEnergy.
Weiss, J., M. Sarro and M. Berkman. 2013. A Learning Investment-based Analysis of the Economic Potential for Offshore Wind: The Case of the United States. Prepared by The Brattle Group.
Willow, C. and B. Valpy. 2015. Approaches to Cost-Reduction in Offshore Wind. A report to the Committee on Climate Change.