drivers in global fertilizer markets - european...
TRANSCRIPT

Drivers in Global Fertilizer Markets
Charlotte Hebebrand Director General, IFA
2024 prospects for EU agricultural markets Brussels, 5 December 2014
Drivers in Global Fertilizer Markets
• Fertilizers at a glance
• Overview of IFA
• Yield developments & grain quality
• Fertilizer Consumption
• Link to feedstocks

… To feed the world,
one must first feed
the crops…
NORMAN BORLAUG
… a few billion people
would have to die if we
hadn't come up with
fertilizer…
BILL GATES

Fertilizers represent an essential ingredient
in the drive towards world food security
… Fertilizers: world’s most
important humanitarian
product”…
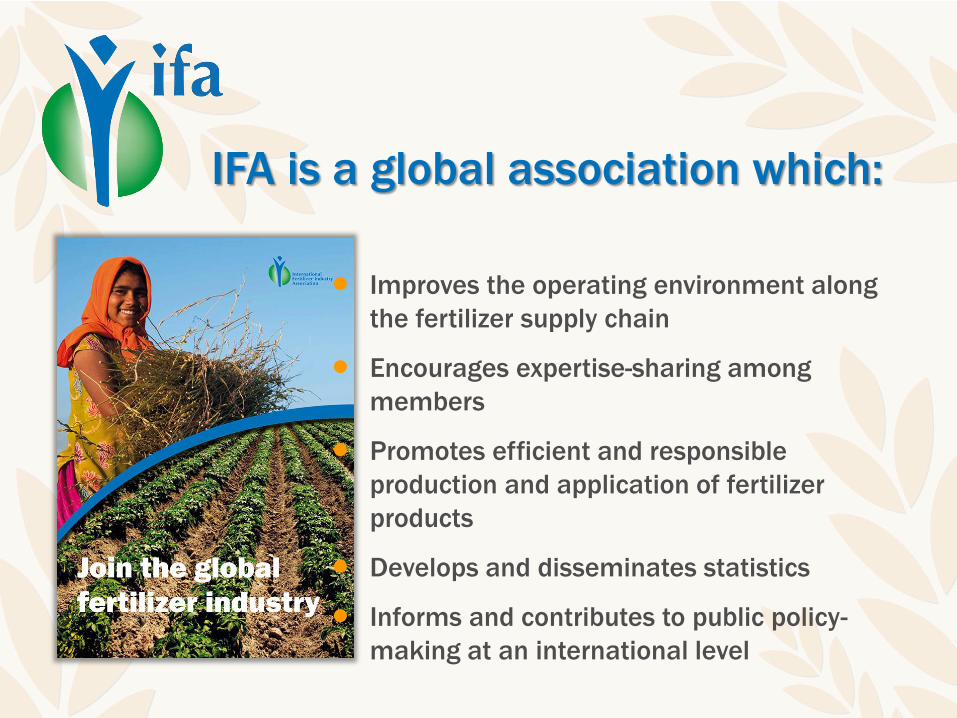
IFA is a global association which:
Improves the operating environment along
the fertilizer supply chain
Encourages expertise-sharing among
members
Promotes efficient and responsible
production and application of fertilizer
products
Develops and disseminates statistics
Informs and contributes to public policy-
making at an international level


Drivers in Global Fertilizer Markets
Fertilizer use, cereal production and food security
| Source: FAO and IFA

Drivers in Global Fertilizer Markets
Wheat response (yield and protein content) to N fertilizer applications
| Source: Grant and Bruulsema
Drivers in Global Fertilizer Markets
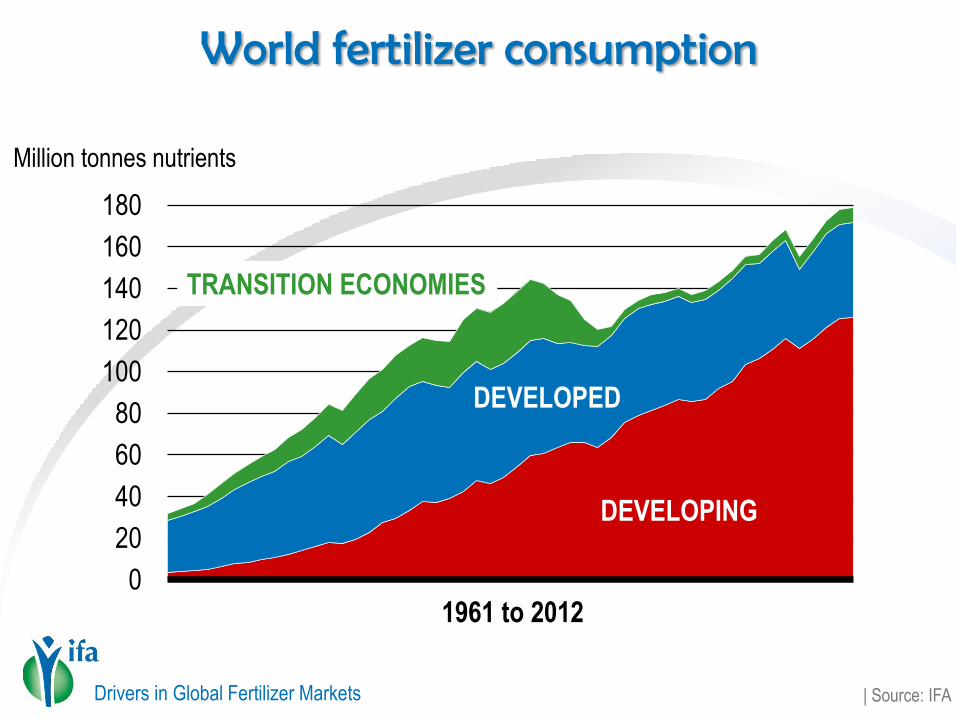
World fertilizer consumption
| Source: IFA
Million tonnes nutrients
0
20
40
60
80
100
120
140
160
180
DEVELOPING
DEVELOPED
TRANSITION ECONOMIES
1961 to 2012
Drivers in Global Fertilizer Markets
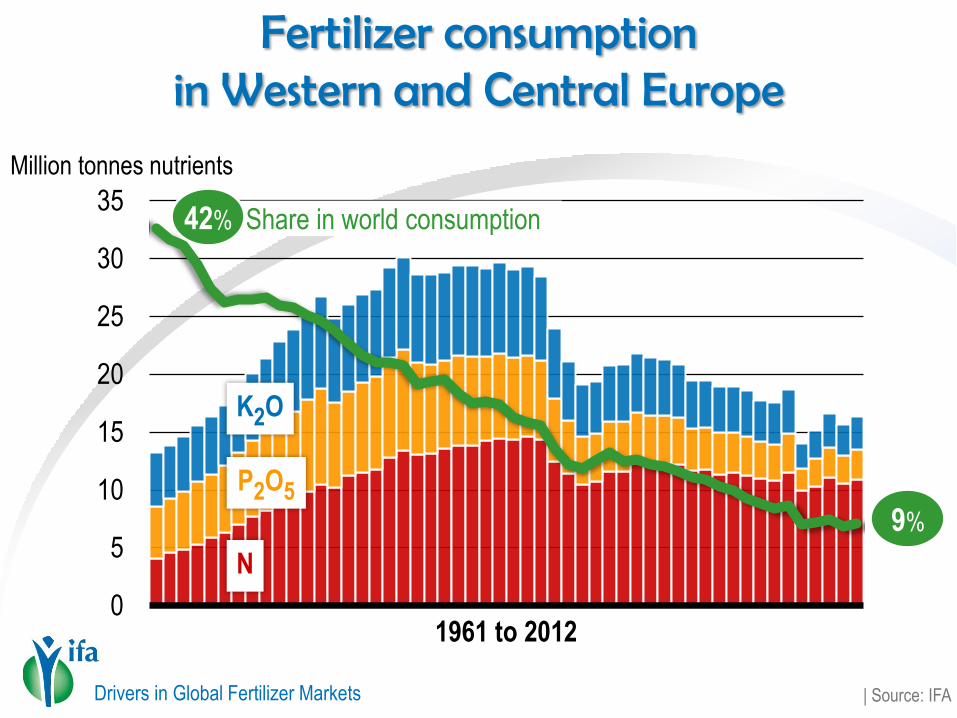
Fertilizer consumption in Western and Central Europe
| Source: IFA
Million tonnes nutrients
1961 to 2012 0
5
10
15
20
25
30
35
K2O
P2O5
N
9%
Share in world consumption 42%

Drivers in Global Fertilizer Markets
Evolution of cereals + rapeseed production relative to fertilizer-N deliveries in France
(100 = 1990)
| Source: SSP and UNIFA
100 = 1990
50
100
130
110
90
70
Development of
agricultural production
Integrated fertilization
120
60
80
140
Cereals production + rapeseed (est. 09/13)
Fertilizer-N deliveries

Drivers in Global Fertilizer Markets
Consumption by product in Western and Central Europe
43%
| Source: IFADATA
33%
82%
60%
Drivers in Global Fertilizer Markets
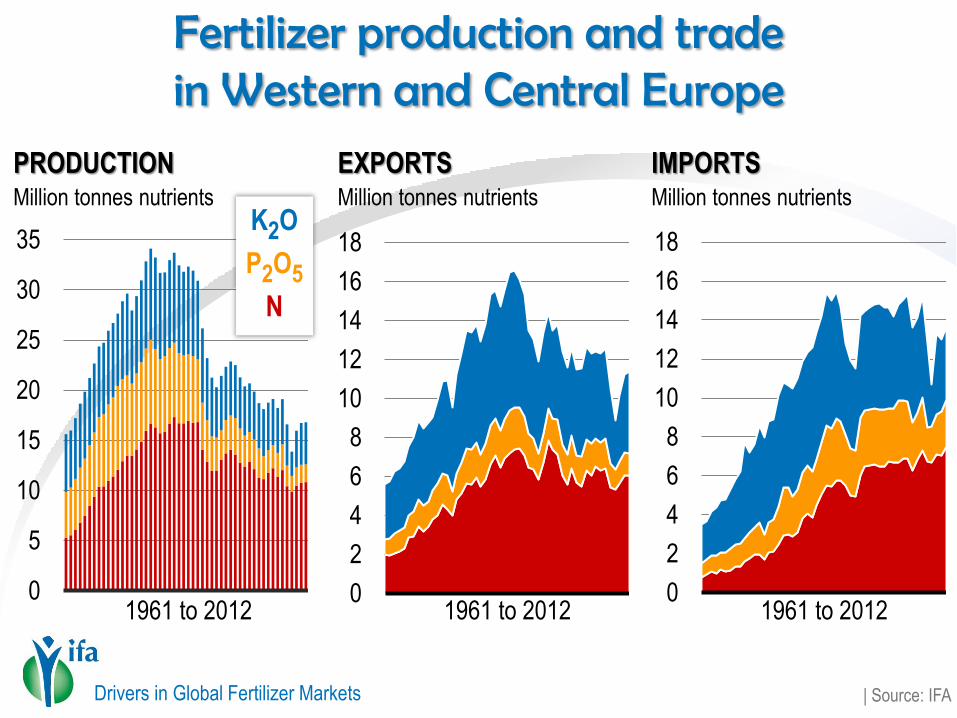
Fertilizer production and trade in Western and Central Europe
| Source: IFA
Million tonnes nutrients
0
5
10
15
20
25
30
35
0
2
4
6
8
10
12
14
16
18
1961 to 2012
Million tonnes nutrients
PRODUCTION EXPORTS
0
2
4
6
8
10
12
14
16
18
Million tonnes nutrients
IMPORTS
1961 to 2012 1961 to 2012
K2O
P2O5
N
Drivers in Global Fertilizer Markets
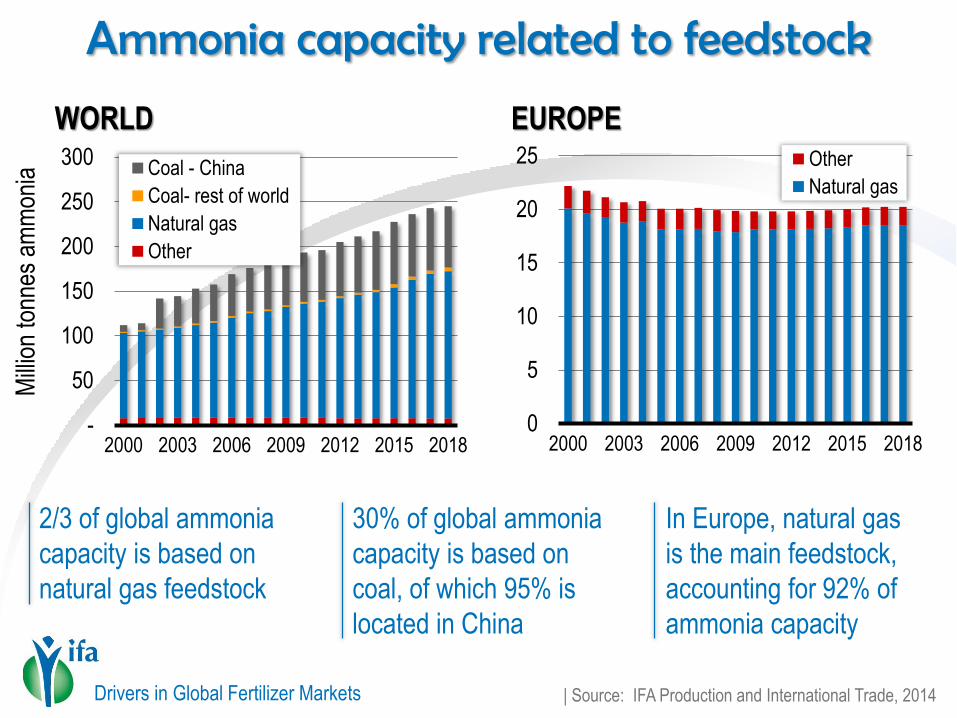
Ammonia capacity related to feedstock
0
5
10
15
20
25
2000 2003 2006 2009 2012 2015 2018
Other
Natural gas
WORLD EUROPE
| Source: IFA Production and International Trade, 2014
Mill
ion
tonn
es a
mm
onia
-
50
100
150
200
250
300
2000 2003 2006 2009 2012 2015 2018
Coal - China
Coal- rest of world
Natural gas
Other
2/3 of global ammonia
capacity is based on
natural gas feedstock
30% of global ammonia
capacity is based on
coal, of which 95% is
located in China
In Europe, natural gas
is the main feedstock,
accounting for 92% of
ammonia capacity

Drivers in Global Fertilizer Markets
Urea cash costs Influence of natural gas prices
0
50
100
150
200
250
300
350
400
450
5 6 7 8 9 10 11 12 13 14 15
other
natural gas cost
Ammonia and urea cash
costs are closely correlated to
feedstock prices.
The cost of natural gas
accounts for 87-95% of the
cash cost of ammonia
production;
and between 78% and 91%
of the cast costs of urea
production.
US$/MMBtu
US$/tonne
| Source: http://www.yara.com/tools/cashcost.htm

Drivers in Global Fertilizer Markets
Natural gas Regional wholesales prices 2013
| Source: IGU, 2014
US$/MMBtu
Comparative wholesales prices of natural gas show
significant disparities between regions.
0
2
4
6
8
10
12
14
16
NE Asia Europe Asia EECA SouthAsia
America WA Africa

Drivers in Global Fertilizer Markets
Urea cash costs vs natural gas prices Trend 2014 to 2015e
| Source: US EIA, Azotecon, CICCC, Argus, Yara cost model
US$/tonne
0
100
200
300
400
500 2014 2015
US Russia China WE_
Zeebrugge
Ukraine
West Asia
Africa

Drivers in Global Fertilizer Markets
Nitrogen supply/demand balances Europe 2011 - 2018
| Source: IFA Production and International Trade, 2014
Million tonnes nitrogen
-
4
8
12
16
20
2011 2012 2013 2014 2015 2016 2017 2018
Supply Demand

Drivers in Global Fertilizer Markets
Nitrogen fertilizer imports into Europe: 2013
| Source: IFA Production and International Trade, 2014
Mill
ion
tonn
es p
rodu
cts
0
1
2
3
4
5
6
7AN
CAN
Urea
Europe Belarus
Russia Ukraine
West Asia Americas
Africa Other
NITROGEN FERTILIZER IMPORTS
UREA IMPORTS
Europe
44%
Africa
27%
EECA
22%
West Asia
7%

Drivers in Global Fertilizer Markets
Regional urea capacity developments 2013 - 2018
| Source: IFA Production and International Trade, 2014
Africa
Europe
Russia USA
West Asia
Million tonnes urea
0
5
10
15
20
25
30
2010 2011 2012 2013 2014 2015 2016 2017 2018 2019
www.fertilizer.org
For more information…

0
2
4
6
8
10
12
14
2001 2002 2003 2004 2005 2006 2007 2008 2009 2010 2011 2012 2013 2014
US$/MMBtu
Source : US Energy Information Agency
USA: Natural gas industrial prices

Indigeneous production
34%
Russia 24%
Norway 23%
Algeria 9%
Qatar 6%
Other 4%
Europe: Natural gas supplies 2012
Total
5060 TWh
http://www.eurogas.org/uploads/media/Eurogas_Statistical_Report_2013.pdf