forest cover change analysis based on remote sensing & gis
TRANSCRIPT

See discussions, stats, and author profiles for this publication at: https://www.researchgate.net/publication/327050613
Forest Cover Change Analysis Based on Remote Sensing & GIS of West Singbhum
District, Jharkhand
Article · May 2018
CITATIONS
0READS
661
3 authors, including:
Some of the authors of this publication are also working on these related projects:
Forest Cover Change using RS GIS View project
Mangrove species Identification and biophysical parameters estimation. View project
Surajit Bera
CSIR-CIMFR
11 PUBLICATIONS 11 CITATIONS
SEE PROFILE
Aniket Prakash
Wildlife Institute of India
7 PUBLICATIONS 1 CITATION
SEE PROFILE
All content following this page was uploaded by Aniket Prakash on 16 August 2018.
The user has requested enhancement of the downloaded file.

International Journal for Research in Applied Science & Engineering Technology (IJRASET) ISSN: 2321-9653; IC Value: 45.98; SJ Impact Factor: 6.887
Volume 6 Issue V, May 2018- Available at www.ijraset.com
1039 ©IJRASET: All Rights are Reserved
Forest Cover Change Analysis Based on Remote Sensing & GIS of West Singbhum District,
Jharkhand Surajit Bera1, Mobin Ahmad2, Aniket Prakash3
1,2CSIR-Central Institute of Mining & Fuel Research, Dhanbad-826015 3Central University of Jharkhand, Ranchi- 835205
Abstract: Forest is a part of the land surface of the earth, with lots of plants and animals, they are need forests to live and survive. The major objective of this study is to detect the magnitude of forest cover change in the duration of the last 20 years (1997 to 2017) in West Singhbhum district of Jharkhand, India. The spectral information of the satellite image is more important to generate forest cover change model using LULC, NDVI and SAVI. The data included a series of topographical sheets, open series maps and satellite imageries from Landsat-5 TM (1997) and Landsat-8 OLI (2017) to recognize forest cover changes during the chosen period. A very useful method used to complete the study, which are generation of Land Use/Land Cover (LULC), Normalized Difference Vegetation Index (NDVI) and Soil Adjusted Vegetation Index (SAVI) model of the study area. The LULC employing the maximum likelihood supervised classification (MLC) algorithm mainly focused on forest cover and other parameters. On the classified map, accuracy assessment is performed, which produced error matrices and overall accuracy, the calculated overall accuracy found 87.18% in 1997 and 86.11% by 2017. The change detection analysis revealed that the area has remarkable changes specifically, the forest covers land reduced 2017.037 km2 (26.17%) of the total study area of 5,364.789 km2 in between 20 years, 5079.723 km2 (65.58%) in 1997 to 3062.686 km2 (40.41%) in the year 2017. Key words:LU/LC, NDVI, Remote Sensing (RS), Geographic Information System (GIS), Change Detection, Image Differencing, Accuracy Assessment, Error Matrix.
I. INTRODUCTION Forest cover change mapping LULC serves as a crucial parameter in current strategies and policies for natural forest resource management. Currently, the world is witnessing the importance of LULC changes in world-wide environmental modifications that can lead to adverse effects (Iqbal and Khan, 2014). Changes in LULC signify environmental changes brought about by natural or anthropogenic consequences (Rawat and Kumar, 2015; Sinha et al, 2015). The vegetation or forest cover plays a very significant role in shaping the land surface of the Earth. Information about the vegetation cover is an indirect indicator of land-use and is highly relevant for environmental studies. Changes in land cover induced by human activity have profound implications on climate (Dickinson et al., 1986; Lean &Warilow, 1989). Mapping techniques from the remote sensing domain are superior to conventional ground based methods of vegetation mapping (Defries& Townshend, 1994). Supervised and object-based classification; out of which the most commonly used classification technique is the supervised classification technique (Enderle and Weih, 2005); however, object-based classification has shown better accuracy (Blaschke, 2010). On the other hand, vegetation indices, like Normalized Difference Vegetation Index (NDVI) and Soil Adjusted Vegetation Index (SAVI) can be used as an alternative for the vegetation change modelling (Faris and Reddy, 2010). With the advent of new climate agreements like REDD (Reducing Emissions from Deforestation and Degradation), there has been an ever-increasing demand for accurate forest monitoring methods (Sharma et al., 2013; van Leeuwen et al., 2011). The potential of remote sensing and GIS in the field of forestry becomes established over many years through the use of aerial photos and satellite imagery interpretations in forest cover change detection analysis, for the generation of the coverage map and inventory analysis (Sajjad et al,. 2015).
II. STUDY AREA West Singhbhum District forms the Southern part of the newly created Jharkhand State and is the largest district in the State. The district bounded by 210 58' & 230 36' North latitude and 850 0' & 86054' East Longitude (Figure 1). The district is situated at a height of 244 Meter above the mean sea level and has an area of 7629.679 Sq. Kilometers. The district is full of hills alternating with valleys, steep mountains and deep forests on the mountain slopes. The Karo&Koina is the main perennial river and other rivers are

International Journal for Research in Applied Science & Engineering Technology (IJRASET) ISSN: 2321-9653; IC Value: 45.98; SJ Impact Factor: 6.887
Volume 6 Issue V, May 2018- Available at www.ijraset.com
1040 ©IJRASET: All Rights are Reserved
Koel, kuju, Kharkai, Sanjai, Roro, Deo, and Baitarini. The majority of the population of West Singhbhum district is tribal population.
Figure 1: Location Map of the Study Area
III. MATERIAL AND METHODS A. Datasets Satellite image of the study area Landsat-5 TM of 23rd May, 1997 and Landsat-8 OLI of 14th May, 2017 download from USGS (<https://glovis.usgs.gov/>). The toposheets also used for classifying the land use/land cover along with the satellite image using ERDAS & Arc GIS software.
B. Methodology Advance, remote sensing and GIS technique used to detect the forest cover change area of the west singbhum district in between 20 years. The details of the methodology are shown in (Figure 2).
Figure 2: Methodological Flowchart

International Journal for Research in Applied Science & Engineering Technology (IJRASET) ISSN: 2321-9653; IC Value: 45.98; SJ Impact Factor: 6.887
Volume 6 Issue V, May 2018- Available at www.ijraset.com
1041 ©IJRASET: All Rights are Reserved
1) Image Interpretation for LULC:Land use / land cover classes are classically chartered sense of digital remote sensing data concluded the process of a supervised image classification (Furtado et al, 2010). The overall image classification is to automatically classify all pixels in the image into land cover / land use classes (Rawat et al, 2013). The spectral signatures for different land use and land cover types were established and False-Colour Composite (FCC) was interpreted based on image elements. The image was processed for classification of the different features on the ground. For supervised classification using maximum likelihood supervised classification (MLC) algorithm, training sets were selected in the FCC imagery based on the collected sample points for respective LULC classes (Sinha et al., 2011a, b). Training sites for LULC classification were selected based on knowledge developed through an extensive ground survey and detailed field study of the area; the study area was taken into account along with the topographical sheets, Landsat-5 TM and Landsat-8 OLI image. The training sites were proportionately selected comprising of pure pixels. 100 random points were generated as sample points that were cross-checked using GPS in the field.
2) Accuracy Assessment: Image analysis and accuracy assessment have corrected contract amongst a standard assumed to be correct and a classified image of unknown class. A classification image accuracy assessment is performed using ERDAS IMAGINE which produced error matrices from which overall accuracy is calculated. The overall accuracy of the classified image compares how each of the pixels is classified versus the actual land cover conditions obtained from their corresponding ground truth data (Sophia S et al, 2017)
3) Land Use / Land Cover Change Detection: The net change in the different classes of the LU/LC of the study area is obtained by performing the post-classification change detection technique. There are several ways to quantify the land cover change results. The simple and the basic one are chosen here that is to tabulate the total of each Land Use/Land Cover type and examine the trend in between the 20 years
4) NDVI: The Normalized Difference Vegetation Index (NDVI) is a numerical indicator that uses the visible and near-infrared bands of the electromagnetic spectrum and are adopted to analyze remote sensing measurements and assess whether the target being observed contains live green vegetation or not (Shahkooeei et al, 2014).
NDVI = {(IR - R) / (IR + R)} This index outputs values between -1.0 and 1.0, mostly representing greenness, where any negative values are mainly generated from clouds, water, and snow, and values near zero are mainly generated from rock and bare soil 5) SAVI :Soil-adjusted Vegetation Index plays a great role in the areas where vegetative cover is low (i.e., < 40%) and the soil
surface is exposed, the reflectance of light in the red and near-infrared spectra can influence vegetation index values. The soil-adjusted vegetation index was developed as a modification of the Normalized Difference Vegetation Index to correct for the influence of soil brightness when vegetative cover is low.
SAVI = {(IR - R) /(IR + R + L)} * (1+L) The output of SAVI is a new image layer with values ranging from -1 to 1. The lower the value, the lower the amount/cover of green vegetation (Rawat et al, 2013).
IV. RESULTS AND DISCUSSION A. LULC Feature Interpretation The LU/LC features classified namely forest, vegetation, settlement, barren land, agriculture land, agricultural fallow land, river, surface water (Fig 3 & 4). The percentage of area covered by the different LU/LC class is represented (Table 1). 1) LULC of 1997:The spatial extent of 1997 LU/LC classificationthe vegetation covers found4364.874 km2
,the highest percentage (56.97%) with scattered distributed approximately throughout the study area (Figure-3). The next to LU/LC class with the highest area coverage is the agricultural fallow land 1494.435km2 near about (19.59%), which is scattered distributed around the North-East, South-East and Western parts of the study area with well drainage network. Agriculture land covers 601.038km2, about 7.88%, presence around the North-East and Eastern part of the study area. Forest covers 732.849km2about (9.61%), found in mainly South-West part of the study area. The Barren land covers 76.638km2about (1.00%) found in western and South-East part with small patches scattered across the study area. River and Surface water covers 64.097km2about (0.84%) and 13.557km2about (0.18%) presence in Western and Eastern part with scattered distributed across the WestSingbhum district. The settlement area covers 14.126km2 about (0.19%) mainly concentrated in the North-East and Eastern part of the study area.
2) LULC of 2017:The spatial extent of LU/LC classification of 2017 (Figure 4), vegetation covers 2851.376 km2 about (37.37%) which are mainly presence in Western and Eastern part of the study area. Agricultural fallow land covers an area of 2289.478

International Journal for Research in Applied Science & Engineering Technology (IJRASET) ISSN: 2321-9653; IC Value: 45.98; SJ Impact Factor: 6.887
Volume 6 Issue V, May 2018- Available at www.ijraset.com
1042 ©IJRASET: All Rights are Reserved
km2, (30.01%) which is scattered distributed approximately all around the study area. Barren land occupies 2162.041 km2 (28.34%) which is found in entire the districts. Forest can be found mainly South-West part of the study area covered with 211km2 (2.77%). Agriculture land covers 53.770 km2 (0.70%) found in the North-East, Eastern and Western part. Water bodies consisting river and surface water, cover an area of 28.175.87km2 (0.38%) in the West and East most ends and 11.400 km2 (0.15%) found in all over the study area. The settlement area covers 16.925km2 (0.22%) mainly centered within the North-East and the Eastern part of the west singbhum district.
Figure 3: LULC map of 1997 Figure 4: LULC map of 2017
Table 1: Land Use / land Cover Area of 1997 & 2017
Class Name
1997 2017 Changed
Area
Area (sq.km)
(%) of Area
in Total Area
Area (sq.km)
(%) of Area
in Total Area
Area (sq.km)
Settlement 14.126 0.19 16.925 0.22 2.80
Agriculture Land
601.038 7.88 53.770 0.70 -547.27
Barren Land 76.638 1.00 2162.041 28.34 2085.40 Agricultural Fallow Land 1494.435 19.59 2289.478 30.01 795.04
River 64.097 0.84 28.715 0.38 -35.38
Vegetation 4832.943 63.34 2855.779 37.43 -
2041.62 Surface Waterbody 13.557 0.18 11.400 0.15 -2.16
Forest 532.846 6.98 211.565 2.77 -321.28 Total Area 7629.68 100 7629.6722 100.00

International Journal for Research in Applied Science & Engineering Technology (IJRASET) ISSN: 2321-9653; IC Value: 45.98; SJ Impact Factor: 6.887
Volume 6 Issue V, May 2018- Available at www.ijraset.com
1043 ©IJRASET: All Rights are Reserved
3) Accuracy Assessment: A classification accuracy assessment is performed on the classified map of 1997 & 2017 using an error matrix algorithm. The LULC map indicates overall accuracy 87.18% of 1997 and 86.11% of the 2017 (Table 2 & 3).
B. NDVI Interpretation The NDVI is the most commonly used index for forest vegetation biomass monitoring. The range of the NDVI is from -1 to 1, but the absolute value of NDVI for vegetation change analysis is between 0 and 1. Healthy vegetation yields high positive NDVI values because they have are latively high reflectance in the NIR and low in visible wavelength and the negative values are mainly due to the barren lands, cloud covers etc. 1) NDVI Map of 1997:The NDVI map of West Singhbhum district in the year 1997 illustrates that vegetation of different health
conditions and various other features like barren land settlement, river, water bodies etc. (Figure 5). The image indicates high to low values,the values vary between 0.628205 to -0.40545. The positive values (0 to 0.628205) show healthy vegetation cover of the study area and the negative values (0 to -0.40545) indicates presence of other features in the study area
2) NDVI Map of 2017:The NDVI map of West Singhbhum district in the year 2017 illustrates that different health conditionof vegetation covers and other features like barren land settlement, river, water bodies etc. (Figure 6). The image indicates high to low values varies between 0.54677 -0.24464 the positive values (0 to 0.54677) shows presenceof healthy vegetation cover in the study area and the negative values (0 to -0.24464) shows other features in the study area.
Figure 5: NDVI Map of 1997 Figure 6: NDVI Map of 2017
Table 2: Accuracy Assessment of 1997 LULC image
Class Surface
Waterbody
Rive
r Settlement
Barren
Land Forest Vegetatio
n Agricultur
e Land Agricultural fallow
Row Total
Surface Waterbody
2583 400 0 0 0 0 0 0 2983
River 610 1131 0 0 0 4 1 1 1747
Settlement 1 54 722 158 84 34 22 82 1157
Barren Land 0 0 40 4588 0 0 0 142 4770
Forest 0 0 0 0 2158 179 0 0 2337
Vegetation 0 17 23 0 116 3214 191 26 3587
Agriculture Land
0 6 76 0 0 149 598 358 1187
Agricultural fallow 0 0 1 240 0 5 278 7440 7964
Column Total 10194 1398 632 1676 1252 1285 537 7989 Overall Accuracy = 87.18327374
International Journal for Research in Applied Science & Engineering Technology (IJRASET) ISSN: 2321-9653; IC Value: 45.98; SJ Impact Factor: 6.887
Volume 6 Issue V, May 2018- Available at www.ijraset.com
1044 ©IJRASET: All Rights are Reserved
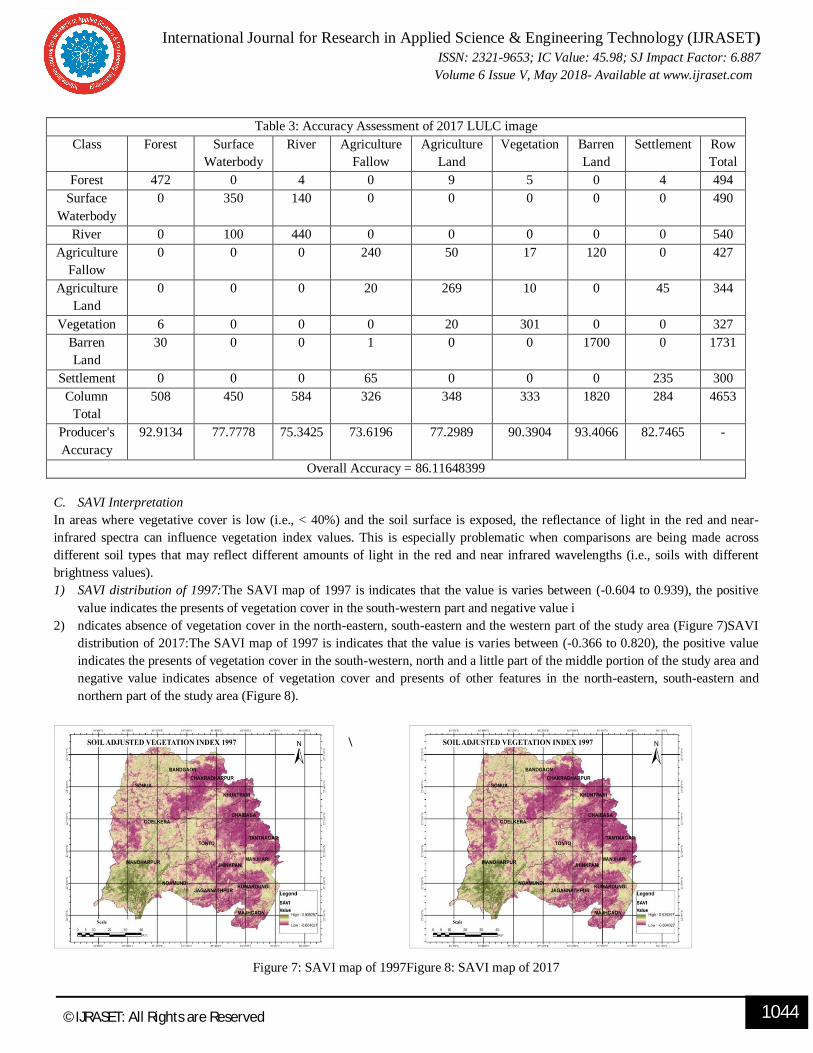
C. SAVI Interpretation In areas where vegetative cover is low (i.e., < 40%) and the soil surface is exposed, the reflectance of light in the red and near-infrared spectra can influence vegetation index values. This is especially problematic when comparisons are being made across different soil types that may reflect different amounts of light in the red and near infrared wavelengths (i.e., soils with different brightness values). 1) SAVI distribution of 1997:The SAVI map of 1997 is indicates that the value is varies between (-0.604 to 0.939), the positive
value indicates the presents of vegetation cover in the south-western part and negative value i 2) ndicates absence of vegetation cover in the north-eastern, south-eastern and the western part of the study area (Figure 7)SAVI
distribution of 2017:The SAVI map of 1997 is indicates that the value is varies between (-0.366 to 0.820), the positive value indicates the presents of vegetation cover in the south-western, north and a little part of the middle portion of the study area and negative value indicates absence of vegetation cover and presents of other features in the north-eastern, south-eastern and northern part of the study area (Figure 8).
\
Figure 7: SAVI map of 1997Figure 8: SAVI map of 2017
Table 3: Accuracy Assessment of 2017 LULC image Class Forest Surface
Waterbody River Agriculture
Fallow Agriculture
Land Vegetation Barren
Land Settlement Row
Total Forest 472 0 4 0 9 5 0 4 494
Surface Waterbody
0 350 140 0 0 0 0 0 490
River 0 100 440 0 0 0 0 0 540 Agriculture
Fallow 0 0 0 240 50 17 120 0 427
Agriculture Land
0 0 0 20 269 10 0 45 344
Vegetation 6 0 0 0 20 301 0 0 327 Barren Land
30 0 0 1 0 0 1700 0 1731
Settlement 0 0 0 65 0 0 0 235 300 Column
Total 508 450 584 326 348 333 1820 284 4653
Producer's Accuracy
92.9134 77.7778 75.3425 73.6196 77.2989 90.3904 93.4066 82.7465 -
Overall Accuracy = 86.11648399

International Journal for Research in Applied Science & Engineering Technology (IJRASET) ISSN: 2321-9653; IC Value: 45.98; SJ Impact Factor: 6.887
Volume 6 Issue V, May 2018- Available at www.ijraset.com
1045 ©IJRASET: All Rights are Reserved
D. Spatial Distribution of the Forest & Vegetation Cover: 1) Distribution of forest and vegetation in 1997:Using Landsat-5 TM satellite image after the classification the spatial distribution
forest and vegetation map illustrate that forest area covers 5079.723 km2,about 65.58 % of the total study area (Figure 9) 2) Distribution of forest and vegetation in 2017:Using Landsat-8 OLI satellite image after the classification the spatial distribution
of forest and vegetation map illustrate that forest area covers 3062.686 km2 about40.41 % of the total study area (Figure 10).
Figure 9: Distribution of Forest and Vegetation in 1997 Figure 10: Distribution of Forest and Vegetation in 2017 E. Change Detection Interpretation: 1) NDVI Change Detection:The comparing NDVI map of two different years (1997 & 2017), itindicates thatthe NDVI value
range are decreased on the year 2017 interval of 20 years. The decreases positive value of NDVI indicates the change of healthy forest and vegetation. On the other hand, the increase negative values of NDVI indicate increased the non-vegetated areas (Figure 11). The NDVI change map found four different changed zones, namely increase, some increase, some decrease and decrease. NDVI image differencing cannot provide detailed change information, particularly in the study area because it does not have NDVI values in different features. It can only give overall information about the healthiness of vegetation cover area of the earth surface.The negative threshold indicates a lossof vegetation and positive threshold indicates the area of increased restoration or healthy vegetation.The Red colour shows the decreased NDVI value, it indicates the reduced forest & vegetation cover. The blue colour shows increased NDVI value with large extent, it indicates the increased forest & vegetation cover.Whereas areas during Yellow and Green colour represent some decrease and some increase NDVI values which indicates light changes in forest and vegetation covers in the study area
2) SAVI Change Detection:The comparing SAVI map of two different years (1997 & 2017),the SAVI value decreased on the year 2017 interval of 20 years. The decreases positive value of SAVI indicates the change of healthy and dense vegetation. On the other hand, the increase negative values of SAVI indicate increased the non-vegetated areas (Figure 12). The SAVI change map found four different changed zones, namely increase, some increase, some decrease and decrease. SAVI image differencing cannot provide detailed change information, particularly in the study area because it does not have SAVI value in different features. It can only give overall information about the healthiness of vegetation covers in the study are based on SAVI value. The negative threshold indicates a lossof vegetation covers and positive threshold indicates the area of increased restoration or healthy vegetation. The Red colour shows the decrease SAVI value it indicates the reduced forest & vegetation cover. The blue colour shows increased SAVI value with large extend it indicates the increased forest & vegetation cover. Whereas areas during Yellow and Green colour represents some decrease and some increase in SAVI values which indicates light changes in forest and vegetation in the study area.

International Journal for Research in Applied Science & Engineering Technology (IJRASET) ISSN: 2321-9653; IC Value: 45.98; SJ Impact Factor: 6.887
Volume 6 Issue V, May 2018- Available at www.ijraset.com
1046 ©IJRASET: All Rights are Reserved
Figure 11: Changed NDVI in Between the year 1997 to 2017 Figure 12: Changed SAVI in Between 1997 to 2017
3) Forest Cover Change Detection:The net forest cover change in the study area is obtained by performing the post-classification change detection technique. There are several ways to quantify the land cover change results. The simple and the basic one are chosen here that is to tabulate the total of each Land Use/Land Cover type and examine the trend in between the 20 years. In totality, there are eight different classes of Land Use / Land Cover but according to the requirement of the aim of the study, the main consideration is given to the change in the forest cover that includes the total change in the amount of the forest and the vegetation.
4) Changed Vegetation Cover between (1997 – 2017):The study of forest and vegetation cover change using different satellite images of different year in between 20 years (1997-2017). The forest &vegetation covers changed map (Fig-13, 14) has been classified in three different classes, namely Increased (green color), unchanged (light brown color) and decreased (red color). The final result finds that the block wise change in forest and vegetation cover is in this manner (Table 4 & 5). Tonto block has decreased in the vegetation of 198.438 km2 (27.4%) and 52.222 km2 (7.2%) in forest. Jhinkpani is associated with the decrease in vegetation of 181.796 km2 (62.0%) and 11.525 km2 (3.9%) in forest. Block Jagannathpur has shown a 29.7 % decrease, making 96.675 km2 of area in vegetation and 3.6%, making 11.855 km2 of area in the forest zone. In Tantnagar total observed change in vegetation area is 133.469 km2 (62.5%) and in the forest change area is about 9.790 km2 (4.6%). Goelkera block has a total area of change 87.778 km2 (10.8%) in vegetation and 60.582 km2 (7.4%) in forest. There is an increase in the vegetation cover by 60.837 km2 (8.1%) and decrease in forest by 50.316 km2 (6.7%) in the Sonua block. Normandy block has the same fashion of the change as it is in Sanaa, with an increase in vegetation cover by 27.525 km2 (4.1%) and decrease in forest by 52.348 km2 (7.9%). Manoharpur being the largest block of study has shown the decrease in both vegetation and forest, 110.403 km2 (8.9%) in vegetation and 86.935 km2 (7.0%) in forest. Similarly the Manjhari block has 159.308 km2 (47.8%) reduction in vegetation and 18.062 km2 (5.4%) in forest area. Chakradharpur has reflected the decrease of 156.648 km2 (39.2%) in vegetation and 28.332 km2 (7.1%) of area in forest. Majhgaon block has decreased in the vegetation of 37.554 km2 (13.1%) and 14.499 km2 (5.0%) in forest. Chaibasa is associated with the decrease in vegetation of 96.338 km2 (42.6%) and insignificant change in forest. Block Kumardungi has shown a 31.1 % decrease, making 131.273 km2 of area in vegetation and 4.0%, making 16.680 km2 of area in the forest zone. In Bandgaon total observed change in vegetation area is 5.120 km2 (1.0%) and in the forest change area is about 81.460 km2 (16.5%). Khuntpani block has a total area of change 189.059 km2 (42.7%) in vegetation and 26.928 km2 (6.1%) in forest.
Fig-13: Map showing change in the Dense vegetation cover of 1997 to 2017 Figure 14: Map showing change in Light vegetation cover of 1997 to 2017

International Journal for Research in Applied Science & Engineering Technology (IJRASET) ISSN: 2321-9653; IC Value: 45.98; SJ Impact Factor: 6.887
Volume 6 Issue V, May 2018- Available at www.ijraset.com
1047 ©IJRASET: All Rights are Reserved
Table 4: Variation in the forest in between 1997 and 2017 Forest cover area
Block Details 1997 2017 Block Name Area (sq km) Area (sq km) (%) of Area Area (sq km) (%) of Area
Tonto 723.121 53.71193 7.43 1.49 0.21 Jhinkpani 293.304 11.53458 3.93 0.01 0.00 Jagannathpur 325.736 12.03125 3.69 0.176 0.05 Tantnagar 213.599 9.9598 4.66 0.17 0.08 Goelkera 813.647 63.22815 7.77 2.646 0.33 Sonua 752.491 51.28643 6.82 0.97 0.13 Noamundi 666.797 95.2749 14.29 42.927 6.44 Manoharpur 1236.411 247.88618 20.05 160.951 13.02 Manjhari 333.590 18.20598 5.46 0.144 0.04 Chakradharpur 399.765 28.4454 7.12 0.113 0.03 Majhgaon 287.232 15.0867 5.25 0.588 0.20 Chaibasa 226.185 0.012 0.01 0.007 0.00 Kumardungi 421.900 17.16725 4.07 0.487 0.12 Bandgaon 493.359 81.98498 16.62 0.525 0.11 Khuntpani 442.538 27.03398 6.11 0.106 0.02 Total Area 7629.676 732.850 - 211.31 -
Table 5: Variation in the Vegetation in between 1997 and 2017
Vegetation Cover Area Block Details 1997 2017
Block Name Area (sq km) Area (sq km) (%) of Area Area (sq km) (%) of Area Tonto 723.121 498.5542 68.94 300.116 41.50 Jhinkpani 293.304 205.1168 69.93 23.321 7.95 Jagannathpur 325.736 187.8879 57.68 91.213 28.00 Tantnagar 213.599 139.2349 65.19 5.766 2.70 Goelkera 813.647 485.6604 59.69 397.882 48.90 Sonua 752.491 294.8683 39.19 355.705 47.27 Noamundi 666.797 284.3034 42.64 311.828 46.77 Manoharpur 1236.411 729.0327 58.96 618.63 50.03 Manjhari 333.590 269.7563 80.86 110.448 33.11 Chakradharpur 399.765 226.655 56.70 70.007 17.51 Majhgaon 287.232 114.748 39.95 77.194 26.88 Chaibasa 226.185 98.3945 43.50 2.057 0.91 Kumardungi 421.900 267.522 63.41 136.249 32.29 Bandgaon 493.359 276.6113 56.07 271.491 55.03 Khuntpani 442.538 268.528 60.68 79.469 17.96 Total Area 7629.676 4346.874 - 2851.376 -

International Journal for Research in Applied Science & Engineering Technology (IJRASET) ISSN: 2321-9653; IC Value: 45.98; SJ Impact Factor: 6.887
Volume 6 Issue V, May 2018- Available at www.ijraset.com
1048 ©IJRASET: All Rights are Reserved
F. Forest & Vegetation Cover trends 1997 to 2017: The forest and vegetation cover trend analysis of West Singhbhum district, between 20 years (1997 to 2017). Two different types of data are observed in (Table 6)& diagrams are shows in (Figure 15 & 16). The positive values describe the reduction of the forest and vegetation cover and the negative values depict the increment in the forest and vegetation cover. The final and overall forest and vegetation cover change is represented in (Table 7).
Table 6: Block Wise Net change in forest and vegetation cover of West Singhbhum district in between 1997 to 2017
Forest &Vegetation Cover Area Changed
Block Details Vegetation Forest Block Name Area (sq km) Area (sq km) (%) of Area Area (sq km) (%) of Area
Tonto 723.121 198.4382 27.44 52.22193 7.22 Jhinkpani 293.304 181.7958 61.98 11.52458 3.93 Jagannathpur 325.736 96.6749 29.68 11.85525 3.64 Tantnagar 213.599 133.4689 62.49 9.7898 4.58 Goelkera 813.647 87.7784 10.79 60.58215 7.45 Sonua 752.491 -60.8367 -8.08 50.31643 6.69 Noamundi 666.797 -27.5246 -4.13 52.3479 7.85 Manoharpur 1236.411 110.4027 8.93 86.93518 7.03 Manjhari 333.590 159.3083 47.76 18.06198 5.41 Chakradharpur 399.765 156.648 39.19 28.3324 7.09 Majhgaon 287.232 37.554 13.07 14.4987 5.05 Chaibasa 226.185 96.3375 42.59 0.005 0.00 Kumardungi 421.900 131.273 31.11 16.68025 3.95 Bandgaon 493.359 5.1203 1.04 81.45998 16.51 Khuntpani 442.538 189.059 42.72 26.92798 6.08 Total Area 7629.676 1495.498 - 521.53951 -
Figure 15: Block wise change in light vegetation Figure 16: Block wise chang in dense vegetation

International Journal for Research in Applied Science & Engineering Technology (IJRASET) ISSN: 2321-9653; IC Value: 45.98; SJ Impact Factor: 6.887
Volume 6 Issue V, May 2018- Available at www.ijraset.com
1049 ©IJRASET: All Rights are Reserved
The above (Table 7) represented an overall change in forest and vegetation cover in the study area, the change variation divide into two components vegetation cover and forest cover. As per the study findings, change in forest cover in between 20 years 2017.032 sq.km and the rate of forest cover change 100.85 km2 / year within 20 years. Hence, with the help of the data from (Table 8) it can be accounted that about 5079.723 km2 (65.58%) of the study area was covered with forest resources in the year 1997. Meanwhile, in the year 2017 the forest cover land of the district is accounting 3062.686 km2 (40.41%), approximately 26.17% forest area decreased from the total study area. The total changed forest area converted to vegetation, barren land and agriculture land.
Table 8: Net change in forest and vegetation cover of West Singhbhum
V. CONCLUSION The study significantly focuses on integrated techniques of GIS and remote sensing for forest cover change mapping. The several methods and procedures used to find the forest cover change area in between 20 years. In order to explain forest cover change NDVI, SAVI and Land Use/Land Cover classification techniques are used. The post-classification technique used to classify the different year's satellite image to get the quantitatively changed area of West Singhbhum district. The NDVI and SAVI map does not represent different features of the earth's surface, it only shows forest and vegetation covers with chlorophyll content. The NDVI and SAVI map shows that forest & vegetation cover highly reduced from 1997 to 2017, in the South-West and northeast part of the study area. The LU/LC classifies results conclude that the forest cover (both forest and vegetation) has been changed 2017.037 km2, about 26.17% between the year 1997 and 2017 on the study area. The forest cover area changed 100.85 km2/ year in the period of 20 years. The total changed forest area converted to vegetation, barren landand agriculture land.
REFERENCES [1] Blaschke, T., 2010. Object based image analysis for remote sensing. ISPRS J. Photogramm. Remote Sens. 65, 2–16. [2] Defries R. S., Townshend J. R. G., 1994. Global land cover: Comparison of ground based data sets to classifications with AVHRR data, Environmental remote
sensing from region to global scales. John Wiley and Sons. 84−110. [3] Dickinson R.E., Henderson S. A., Kennedy P.J., Wilson M.F. 1986. Biosphere–atmosphere transfer scheme (BATS) for the NCAR community climate model.
NCAR Technical Note NCAR/TN-275. [4] Enderle D., Weih Jr., R.C., 2005. Integrating supervised and unsupervised classification methods to develop a more accurate land cover classification. J. Ark.
Acad. Sci. 59, 65–73. [5] Faris, A.A., Reddy, Y.S., 2010. Estimation of urban heat island using Landsat ETM+ imagery at Chennai city – a case study. Int. J. Earth Sci. Eng. 3, 332–340. [6] Furtado J.J., Cai Z., Xiaobo L., 2010. Digital Image Processing: Supervised Classification Using Genetic Algorithm in, 2(6), 53–61. [7] Iqbal, M.F., Khan, I.A., 2014. Spatiotemporal land use land cover change analysis and erosion risk mapping of Azad Jammu and Kashmir, Pakistan. Egypt. J.
Remote Sens. Space Sci. 17, 209–229. [8] Rawat J.S., Biswas V., Kumar M., 2013. Changes in land use/cover using geospatial techniques: A case study of Ramnagar town area, district Nainital,
Uttarakhand, India. Egyptian Journal of Remote Sensing and Space Science, 16(1), 111–117. [9] Rawat, J.S., Kumar, M., 2015. Monitoring land use/cover change using remote sensing and GIS techniques: a case study of Hawalbagh block, district Almora,
Uttarakhand, India. Egypt. J. Remote Sens. Space Sci. 18, 77–84.
Table 7: Quantified change in the vegetation cover Year Vegetation Forest
Area in km2 Area in % Area in km2 Area in % 1997 4364.874 56.97 532.846 9.61 2017 2851.376 37.37 211.565 2.77
Difference 1977.764 25.91 321.281 4.21
Year Area of forest and vegetation cover
in km2
Area of forest and vegetation cover in %
1997 5079.723 65.58 2017 3062.686 40.41
Net change in forest and vegetation cover 2017.037 26.17

International Journal for Research in Applied Science & Engineering Technology (IJRASET) ISSN: 2321-9653; IC Value: 45.98; SJ Impact Factor: 6.887
Volume 6 Issue V, May 2018- Available at www.ijraset.com
1050 ©IJRASET: All Rights are Reserved
[10] Sajjad A., Hussain A., Adnan S., Ali S., Ahmad Z., Ali A., 2015. Application of Remote Sensing and GIS in Forest Cover Change in Tehsil Barawal, District Dir, Pakistan. American Journal of Plant Sciences. 6(9). 7.
[11] Shahkooeei E., Arekhi S., Kani A N., 2014. Remote sensing and GIS for mapping and monitoring land cover and land use changes using support vector machine algorithm -Case study: Ilam dam watershed. 8(4), 464–473.
[12] Sharma, L.K., Nathawat, M.S., Sinha, S., 2013. Top-down and bottom-up inventory approach for above ground forest biomass and carbon monitoring in REDD framework using multi-resolution satellite data. Environ. Monit. Assess. 185, 8621–8637.
[13] Sinha S., Sharma L.K., Nathawat M.S., 2015. Improved Land-use/Land-cover classification of semi-arid deciduous forest landscape using thermal remote sensing. Egypt. J. Remote Sens. Space Sci. 18, 217-233.
[14] Sinha, S., Sharma, L.K., Nathawat, M.S., 2011a. Retrieving tiger habitats: conserving wildlife geospatially. Appl. Remote Sens. J. 2, 1–5. [15] Sinha, S., Sharma, L.K., Pandey, P.C., Nathawat, M.S., Kanga, S., 2011b. Impact of human intrusion on tiger habitat and conservation using integrated
geospatial techniques. Int. J. Earth Sci. Eng. 4, 39–45. [16] Sophia S. Rwanga J M., Ndambuki., 2017. Accuracy Assessment of Land Use/Land Cover Classification Using Remote Sensing and GIS. International Journal
of Geosciences, 8, 611-622. [17] Van Leeuwen, T.T., Frank, A.J., Jin, Y., Smyth, P., Goulden, M.L., van der Werf, G.R., Randerson, J.T., 2011. Optimal use of land surface temperature data to
detect changes in tropical forest cover. J. Geophys. Res. 116, G02002. http://dx.doi.org/10.1029/ 2010JG001488.
View publication statsView publication stats