fortis metals monthly - stainless steel · fortis metals monthly april 2007 merchant banking gold,...
TRANSCRIPT
Fortis metals monthlyApril 2007
Merchant Banking
Gold, silver, platinum, palladium, aluminium, copper, nickel, lead & zinc, tin, plastics.
Virtual Metals Research and Consulting
Tom ButlerMike CassellJessica CrossClare HayterTravis HoughGary MeadMatthew Turner
Tel. +44 20 7487 [email protected]
Fortis/Virtual Metals April 2007 | Fortis metals monthly | 1
Contents
Metals and plastics � Strategic view 3
Analysis 5
Focus 7
Gold 10
Silver 11
Platinum 12
Palladium 13
Aluminium 14
Copper 15
Nickel 16
Lead and zinc 17
Tin 18
Plastics 19
Indices 20
Prices 21
Disclaimer and copyright 23
About Virtual Metals 24
Fortis commodities contact list 25
Fortis Metals Monthly is an exclusive precious and base metals research joint venture between Fortis Bank SA/NV and Virtual Metals Research and Consulting.

Fortis/Virtual Metals April 2007 | Fortis metals monthly | 3
Metals and plastics � Strategic view Introduction Base metals� prices rose higher in March as strong demand signals revived investor confidence. Poor USA housing data February � new home sales fell 3.9% in February, their lowest in almost seven years, while prices for homes fell in January compared to the same month in 2006, the first such fall in more than a decade � clouded the horizon. That plus the dollar falling to a two-year low against the euro gave rise to speculation that USA interest rates may be cut as early as Q3 2007.
Gold Tension between the UK/USA and Iran plus a growing sense that the USA might begin cutting interest rates in Q3 2007 helped gold recover ground lost since February. An assault on $700/oz is again looking possible.
Silver Silver�s fortunes largely tracked those of gold in March with little fundamental news driving it. A recovery to beyond $14/oz is looking feasible as investors stay faithful.
Platinum Little news in March but investor confidence remains strong on probable continued strong demand outlook.
Palladium Palladium traded sideways in March and there is little on the horizon to alter that in the short-term.
Aluminium Growing signs of a global market in moderate surplus in 2007, plus unquenchable primary metal production capacity growth in China will help restrain aluminium prices.
Copper Remarkable turn-around in January and February in China�s refined copper imports, but this level of demand is unlikely to be sustainable. Copper might be in for a period of volatility at or above $6,000/t.
Nickel Fresh price records on strong stainless steel production and growing unease over new project start-up delays.
Lead and zinc Fresh supply disruptions in Australian mines helped lead stay strong in March; growing Chinese production of refined lead and slackening seasonal demand should see prices trimmed in Q3 2007. There was not much to prop up zinc prices above $3,000/t, except the probability that this year�s global refined zinc surplus may be relatively small � leaving room for the unexpected.
Tin Prospects for a 30,000t global deficit of refined metal in 2007 underpin strong prices.
Plastics Small volumes traded on the LME, prices tread water. A rise in crude oil may see producers try to push through higher prices in Q2.
Analysts Gary Mead Tel: +44 20 7487 3600 Email: [email protected]
Jessica Cross Tel: +44 20 7487 3600 Email: [email protected]

4 | Fortis metals monthly | April 2007 Fortis/Virtual Metals
Forecasts
Price forecasts
End-March 1-month 2-month 3-month 12-month
Gold $ per oz 661.75 630-680 >700 >700 650Silver $ per oz 13.35 12.80-13.80 >14 14 13Platinum $ per oz 1,244 1,200-1,270 1,300 1,300 1,400Palladium $ per oz 351.75 340-355 350 350 380Aluminium (3-month) $ per tonne 2804 2,680-2,780 2,500 2,500 2,500Copper (3-month) $ per tonne 6,860.50 6,300-7,500 7,000 7,000 6,000Nickel (3-month) $ per tonne 43,800 40,000-50,000 >50,000 >50,000 30,000Lead (3-month) $ per tonne 1,926 1,800-2,000 1,700 1,700 1,300Zinc (3-month) $ per tonne 3,290 2,800-3,200 2,900 2,800 2,700Tin (3-month) $ per tonne 13,700 13,000-15,000 <13,000 <14,000 12,000Plastic: LL (September) $ per tonne 1,150 <1,160 1,200 1,300 1,300Plastic: PP (September) $ per tonne 1,170 <1,180 1,200 1,300 1,300
2-years 3-years 4-years 5-years 6-years
Gold $ per oz 550 490 450 450 400Silver c per oz 12 11 10 10 10Platinum $ per oz 1,400 1,400 1,300 1,200 1,200Palladium $ per oz 280 280 250 230 230Aluminium (3-month) $ per tonne 2,000 2,000 2,000 1,900 1,900Copper (3-month) $ per tonne 5,000 5,000 4,000 4,000 4,000Nickel (3-month) $ per tonne 25,000 25,000 15,000 14,000 13,000Lead (3-month) $ per tonne 1,000 1,000 900 900 800Zinc (3-month) $ per tonne 2,500 2,000 2,000 1,900 1,900Tin (3-month) $ per tonne 11,000 10,000 9,000 9,000 8,000Plastic: LL (September) $ per tonne 1,300 1,300 1,200 1,200 1,100Plastic: PP (September) $ per tonne 1,300 1,300 1,200 1,200 1,200
Source: Virtual Metals
Fortis/Virtual Metals April 2007 | Fortis metals monthly | 5
Analysis Nickel producers get worried There�s no pleasing some people � no sooner does the price of nickel threaten to break through $50,000/t (more than double last year�s average of $23,228/t � LME 3-month settlement price) than leading nickel producers start to get worried. �If nickel prices continue to go considerably higher then we�re possibly going to get demand destruction in the stainless steel sector going forward, which will hit consumption,� said Xstrata Nickel�s CEO, Ian Pearce, towards the end of March. He may have particular reason to worry of course, having seen Xstrata pick up the nickel producer LionOre for a chunky $4bn a few days� previously. Of course it is not only miners who have an unerring instinct for buying at the top of a market and selling at the bottom. Pearce very wisely declined to give any prediction about future nickel prices. Another nickel producer, Norilsk, expressed concern in March at high prices. David Humphreys, Norilsk�s chief economist, told Dow Jones that �these kinds of prices are creating incentives for people to look for alternatives to stainless steel and that�s not in our interest�. Norilsk, the world�s biggest nickel producer, has more reason than most to fear a collapse in stainless steel or a switch to low-grade stainless, using less nickel. It produced 241,540 tonnes of the metal in 2005, when the LME�s 3-month price averaged $14,582/t � meaning a possible income in the region of $3.5bn if all the metal was sold at that average price. Last year�s production, of some 244,000t, might have fetched $5.6bn; better that than shortfall of almost $2bn/year if nickel prices were to plummet all the way back down to 2005�s average. What nickel producers are anxious about of course is not high prices, per se, so much as very high prices.
With good reason? There are very contradictory indicators flying around concerning the likely trend for nickel prices. On the one hand the pips are beginning to squeak very vociferously. Mark Lim, chairman of the Malaysian Iron & Steel Industry Federation, said in March that best-quality grade 304 stainless steel (with 8% nickel) was now trading in Asia at more than double the end-2005 price of $2,000/t. He blamed nickel, neatly side-stepping the fact that stainless steel demand shows no sign of slackening. Lim said that there is a lot of substitution already going on, with Indian stainless steel mills especially shifting more to production of grade 200, which has just 4% nickel content. More intriguingly, he told Reuters that about 20% of the grade 304 market had already been lost to grade 200 � in which case the only logical response is to ask what nickel prices might already be by now, if that had not happened? Nickel producers are more alarmed by the prospect of stainless producers moving more towards output of grade 400, which contains no nickel at all. Yet there are serious issues of quality, durability, and heat-resistance with grade 400; most agree that for any application requiring safety-critical strength guarantees, grade 400 does not cut the mustard.
New supply endlessly deferred With a global refined nickel deficit last year of perhaps 40,000t, it�s evident that � barring a complete collapse in the demand for nickel for stainless steel � there is an urgent need for new mine supply. The cavalry is on its way to the rescue, but it might take a bit longer to arrive than originally hoped. Heading the charge (in terms of scale) but bringing up the rear (in terms of delay) is CVRD Inco�s Goro project in New Caledonia. This 60,000t/year project � already very delayed and with a 40% cost overrun, to $3bn (and counting) is now due to start-up in 2009, but there is a growing belief that in fact it will not begin churning out nickel before 2011 � and could then take another three years to reach full capacity. Goro has been plagued by local environmental activist protests, which have occasionally turned violent. These protests have simmered down recently but they have not gone away, despite a placatory visit by Roger Agnelli, CVRD�s CEO, at the end of February. The local opposition seems to have been
Analysts Gary Mead Tel: +44 20 7487 3600 Email: [email protected]
Jessica Cross Tel: +44 20 7487 3600 Email: [email protected]
6 | Fortis metals monthly | April 2007 Fortis/Virtual Metals
less than placated � it now plans to start building a kind of squatter camp near a waste disposal site of the project. If this happens it will provide the perfect focus for yet more clashes. There are three other big projects in the offing. They are Xstrata�s 60,000t/year Koniambo project, also in New Caledonia; BHP Billiton�s Ravensthorpe scheme, in western Australia, which is due to reach a capacity of 50,000t/year; and CVRD�s Onca Puma project in Brazil, which promises output of 55,000t/year. But the earliest Koniambo will start production is now 2010, while Ravensthorpe may not be in full production before next year. Onca Puma is scheduled to begin production in 1H 2008. These three projects will eventually � if they all come to pass (and there must be serious doubts about Goro) � bring an additional 225,000t of refined nickel to market. This is widely assessed to be sufficient only to keep pace with the likely growth in demand. One Chinese assessment suggested in March that China�s demand for nickel may rise 20% this year, with its nickel consumption in 2007 topping 300,000t. China, now the world�s biggest producer of stainless steel, may produce 7.2 Mt of stainless steel in 2007, against perhaps 5.3 Mt last year. Given this backdrop, and even allowing for the drive to substitution and lower-grade stainless, it is our view that we are more likely to see nickel at $60,000/t before it falls back to $30,000/t. When either price is reached is a matter of guesswork � but right now very few traders or speculators are interested in going short of this metal.
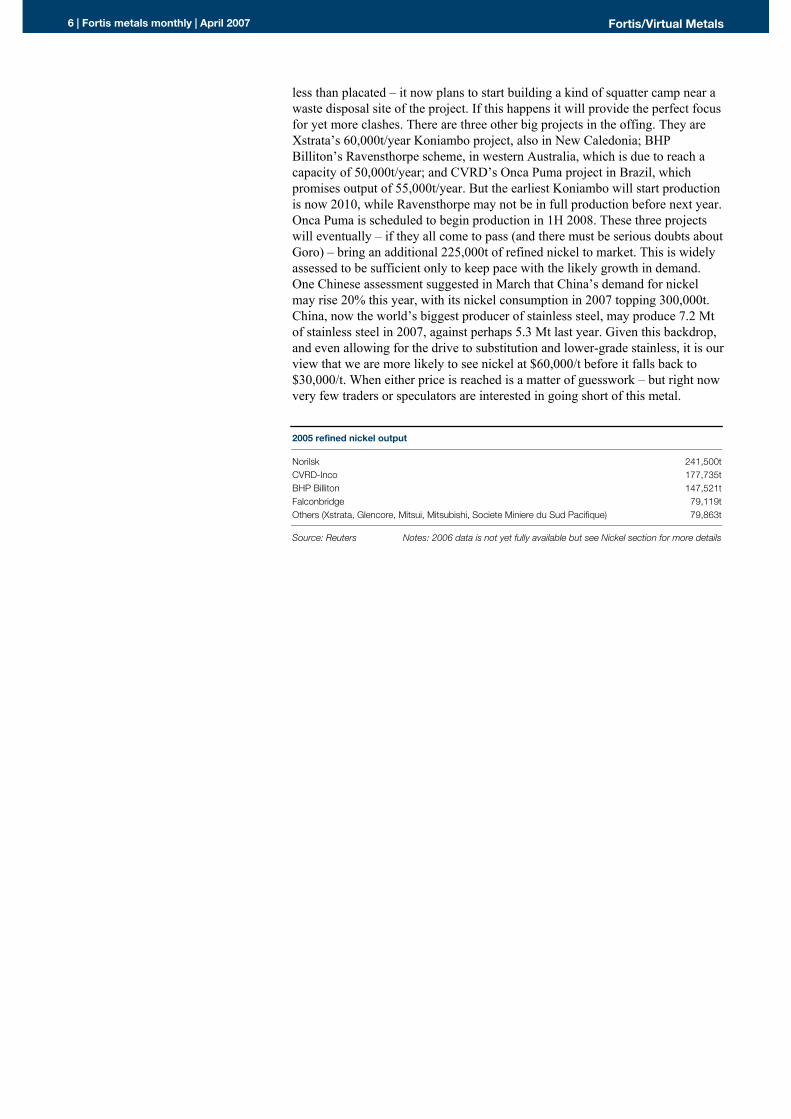
2005 refined nickel output
Norilsk 241,500tCVRD-Inco 177,735tBHP Billiton 147,521tFalconbridge 79,119tOthers (Xstrata, Glencore, Mitsui, Mitsubishi, Societe Miniere du Sud Pacifique) 79,863t
Source: Reuters Notes: 2006 data is not yet fully available but see Nickel section for more details

Fortis/Virtual Metals April 2007 | Fortis metals monthly | 7
Focus Resource nationalism rears up Higher commodity prices have sparked a renewal of interest by national governments in securing a higher take of mineral exploration profits. We take a look at some of the recent developments affecting metals.
Higher metals prices have all kinds of unforeseen consequences; one of the more subterranean right now making itself felt in a variety of different ways is the resurgence of resource nationalism, the entirely explicable way in which national governments assert (or try to) state authority over what is claimed to be a natural resource that should benefit the nation as a whole, rather than just an individual company and its shareholders. Moves to enforce tighter state control (and a higher share of mining profits) can be seen everywhere across Africa, Asia and Latin America. One of the most extreme of these came in Mongolia in mid 2006. In July 2006 new mining laws in Mongolia gave the state the right to bargain for up to a 34% stake in mineral deposits deemed to be of �strategic� importance for the country � a vaguely-worded formula that was seen by foreign mining companies as simply adding to an already uncertain legislative framework. The definition of a strategic deposit is broad, but includes those deposits that, if exploited and productive, would generate annual mineral production equivalent to more than 5% of Mongolia�s GDP. Shortly before that Mongolia had also passed a windfall tax on mining profits, permitting the state to take up 68% of profits on production from gold mining if the price rose above $500/oz and on copper at a price of above $2,600/t. The Canadian-based Fraser Institute, an independent research organisation, published a survey at the start of April which showed that in 2006 Mongolia had dropped from its previous 33rd position to 62nd (out of a total of 65) mining regions in terms of its attractiveness to mining companies. The only countries less favoured by miners for new project development were Bolivia, Venezuela and Zimbabwe respectively. Another central Asian republic, Kyrgyzstan, said in March that it is considering nationalising the country�s gold production, including the Kumtor deposit, currently being developed by Centerra Gold, an exploration company in which Canada�s Cameco holds 53%.
At the same time, higher minerals� prices and fears of scarcity are inducing cash-rich but resource-poor nations to splurge funds on trying to secure long-term reliable supplies. South Korea is a good example; a country with very few natural resources of its own, this year its overseas investment in resources development is expected by the government to rise by more than 80%, year-on-year, to the equivalent of $3.78bn. Most of this will go to seeking crude oil and natural gas resources but a hefty $577m will be devoted to investments in metals. South Korea will also this year spend 54% more than in 2006 on buying raw materials (mostly non-ferrous metals) for its reserve stockpiles, the equivalent of more than $532m.
Indonesia�s plan for miners As the cash-rich go hunting, some of the reserves-rich seem poised to become less interested in taking their money. In March this year a long-awaited new mining law in Indonesia, home to some of the world�s potentially biggest copper, gold and other metal reserves, appeared to take a step closer to becoming enacted. Simon Sembiring, director general of the country�s ministry of energy and mineral resources, said he was �very optimistic� that a new law would be passed by the country�s legislators in June. This will radically alter the conditions under which foreign companies mine in Indonesia. Statutory and regulatory management of Indonesia�s mineral resources is rooted in Article 33 of the country�s 1945 Constitution, which says: �all natural resources in the soil and the waters of the country are under the jurisdiction of the State and shall be used for the greatest benefit and welfare of the People.� Beyond that, the current legal framework requires foreign mining companies to sign a �contract of work� with the federal authorities in Jakarta, but these contracts can take years to
Analyst Gary Mead Tel: +44 20 7487 3600 Email: [email protected]
8 | Fortis metals monthly | April 2007 Fortis/Virtual Metals
obtain � no contract of work agreement has been signed by the government in almost a decade � to the frustration of mining companies keen to exploit the country�s large resources. This contract of work sets out the terms under which the mining company holds the land, and what level and frequency of taxes and royalties must be paid. The draft legislation will instead grant regional governments direct control over their resources. Regional governments will in future (if the law is passed as it stands) be able to set their own investment regulations and effectively veto new projects. From the standpoint of Indonesia�s central government, the proposed new law simply ensures that mining companies, and the local communities in which they function, will work together better. But aspects of the new legislation have already irritated mining companies, not least the proposal that ore mined in Indonesia must also be smelted and refined in Indonesia. Mining executives have largely already dismissed the new law as if not unworkable then certainly creating a substantial disincentive to consider new projects in the country. In 2006, the mining sector contributed $2.3bn to government revenue in Indonesia. Some estimate that, given a less bureaucratic and more sympathetic legislative environment, this figure could easily be five or six times higher.
Latin America � a good place to do business? But it is in Latin America, thanks to the resurgence of a new breed of populist-nationalist political leaders, that the context for metals� mining has become most uncertain in the past two years, and it is uncertainty that miners care most about.
Ecuador�s deputy mining minister, Jorge Jurado, said the country will soon undertake legal reforms of its mining sector. These reforms would be aimed at bringing greater benefits (i.e. money) to the state and local communities. Ecuador has large deposits of gold, silver and copper but less than 20% of mining concessions granted in recent years are actually operating, according to Jurado�s ministry. On the other hand the Ecuadorean Chamber of Mines argues that since 2002 private mining company investment has been some $600m, largely spent on exploration activity; the implication is that it takes years for a project to come to fruition. In Brazil, the National Department of Mining Production was reported in March as contemplating a review of tax payments for mining concessions with the possibility of increasing royalty payments. In Bolivia, President Evo Morales � who last year forcibly nationalised the country�s energy sector � in February this year abruptly took back into state control the Vinto smelter, which annually refines some 12,000t of tin, and which was owned and operated through a local subsidiary by the Swiss-based company Glencore. Glencore argues that its ownership of the smelter is protected by a bilateral Swiss-Bolivian treaty from 1991. Bolivia has also substantially raised the tax rates on mining company profits, but it is the uncertainty which surrounds the intention of the Morales government, rather than the increased tax burdens, which are the biggest deterrent to future private sector investment in the country�s mineral resources. Miners want clarity.
Yet what they are sometimes subjected to in today�s Latin America is confusion. Back in September 2005, Venezuela�s President Hugo Chavez, like Morales a left-wing populist nationalist, dropped a bombshell by announcing in front of a mass audience outside the presidential palace plans to revoke mining concessions granted to private companies, as part of a general review of the country�s mining sector. Chavez then said: �We�ve decided to revoke a group of mining concessions given by previous governments, including our own government. No more concessions. We�ve decided to create a new Venezuelan mining company that operates through cooperatives.� Yet in March this year � much to everyone�s surprise � Venezuela granted permits to build one of Venezuela�s largest gold mines to the USA miner Gold Reserve. The Brisas project, a gold-and-copper deposit in southeastern Venezuela � which will be the first operating mine in Gold Reserve�s portfolio � has been under development by Gold Reserve for nearly 15 years. According to Gold Reserve�s estimates, the open-pit mine will produce approximately 10.4 Moz of gold over 20 years. Doug

Fortis/Virtual Metals April 2007 | Fortis metals monthly | 9
Belanger, company president, said he found Venezuela�s business climate to be fair: �We�ve been in Venezuela 15 years, eight of it with the Chavez administration, and we�ve accomplished more under Chavez.� Sometimes the confusion has nothing to do with mining per se, but is simply a consequence of a local political environment where the rule of law often seems patchy. Barrick Gold has been caught up in a mess in one of Argentina�s poorest provinces, La Rioja, once governed by ex-President Carlos Menem. While Argentina�s national government has passed legislation designed to encourage greater mining development in the country, provincial governments such as those of Chubut, La Rioja and Mendoza, where anti-mining lobbyists have risen to the ascendancy, have managed to ban open-pit mining, such as Barrick�s planned Famatina gold mine project in La Rioja. Rather than embroil itself in a dispute over which it has no control, Barrick has now suspended all work at the project. This type of chaos threatens to damage Argentina�s prospects as an attractive home for foreign mining investment, which last year rose 56% to $1.27bn, providing much-needed employment in often quite poor provinces.
In one way we might be witnessing a repetition of history. In the 1970s Zambia�s copper production peaked at around 700,000t/year. State interference in the country�s copper sector created a climate of uncertainty and mismanagement and helped reduce that production peak rate by more than half by the 1990s. Zambia then sold the country�s key copper mines to the private sector in 2000, and by 2006 its copper production had recovered to around 500,000t/year. Miners can accommodate themselves to new and more demanding tax and royalty payment regimes, although they might complain along the way; the accommodation being painfully reached between South Africa�s miners and the post-apartheid government is perhaps the best example of this. All too often, new governments can spell an abrupt change of direction which, given that it can take a decade to get a new mine up and running, acts as a strong disincentive to invest in countries of perceived high political risk. At the start of April, for example, the recently-installed new government in the Democratic Republic of Congo suspended all negotiations on future mining deals while it undertakes a review of existing contracts. What miners yearn for, besides profitability, is a clear long-term perspective, without whimsical, abrupt legislative change. What they are getting more of today is bureaucratic muddle and politicians all too frequently shooting from the lip.
10 | Fortis metals monthly | April 2007 Fortis/Virtual Metals
Gold News � Apr 2nd: Peru�s gold output slipped 22.5% in January, to 14t, compared with
the same month in 2006, and a further 25.2% in February (vs. February 2006) to 12.5t.
� Mar 15th: Gold production in Ghana rose more than 10% (year-on-year) to almost 70t in 2006, despite chronic power shortages which have forced most mining companies to bring in their own power generating capacity, according to the country�s Chamber of Mines.
� Mar 9th: Peru�s Buenaventura said it had cut its hedge book by 483,000 oz at a total cost of $145m, leaving 1.45 Moz outstanding.
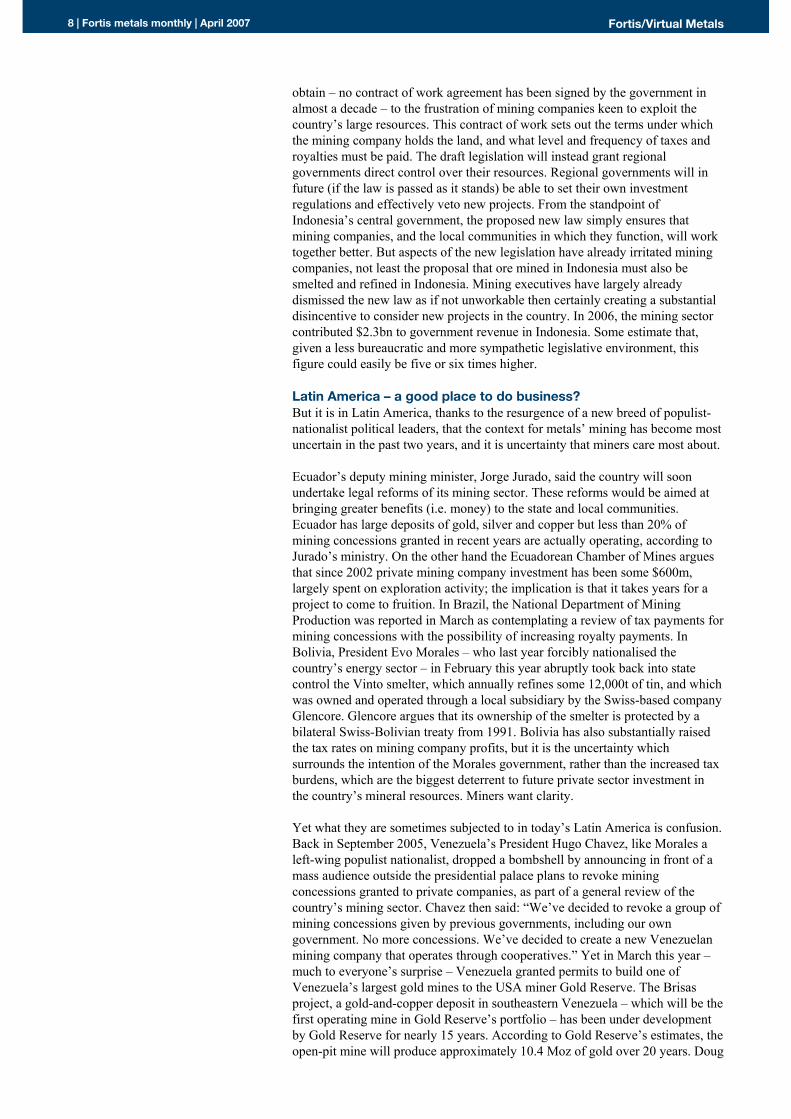
� Mar 7th: South Africa�s Chamber of Mines said the country�s gold output in 2006 was down by 7.5% year-on-year at just over 275t, the lowest since 1922, a year in which strikes saw production slump to 218t. Declining grades were blamed for the drop, which was 10% in Q4 alone (measured against the same period in 2005).
� Mar 5th: The Australian Bureau of Agricultural and Resource Economics (Abare) estimated that Australian gold output in the current fiscal year (end June) would rise 2% year-on-year to 255t. On current trends 2007 could see China outpace Australia�s gold production; China�s output this year could reach 260t.
Analysis � Middle East � mixed news There were mixed reports from the UAE in March on gold jewellery sales. Abu Dhabi�s gold sales fell 40% in February compared with the same month in 2006, according to Tushar Patni, chairman of the emirate�s Gold and Jewellery Group. He attributed the drop (which followed a 35% fall, year-on-year, in January) to continued high prices acting as a deterrent to buyers. Buying recovered in March however by 15% (compared to the same month in 2006) on relatively weaker prices. Meanwhile the chairman of Dubai�s Gold and Jewellery Group said gold sales rose 24% in February compared with the same month in 2006, following a 40% year-on-year rise in January, thanks partly to the Dubai Shopping Festival, which ended on 2nd February. Patni said at the start of April that Abu Dhabi�s overall sales could register a 25% drop in Q1 2007 (against the same period last year) but this could deteriorate further if the gold price rose higher.
Outlook Gold spiked higher at the end of March, pulled up by rising crude oil prices and a tense stand-off between the UK and Iran over the latter�s arrest of 15 British Royal Navy personnel in disputed waters in the Gulf. Much attention is currently focused on investment demand as a driver of the gold price but physical offtake remains crucial and that has shown a tendency to weaken the closer the price approaches $700/oz. Gold needs a period of relative stability to encourage physical buyers to believe that a new and higher floor above $600/oz is here for the long-term. London pm fix, short-term: $630/oz-$680/oz.
Market data (March unless stated)
Prices US$/oz Euro/oz Rand/kg ETF investment Ounces Lease rates 1m 3m 6m 12m Option volatility (end month, %)
Average 654 494 154,308 US 99,024 Average 0.11 0.15 0.18 0.17 1-month 15.10High 670 508 156,718 UK 56,907 High 0.12 0.17 0.20 0.22 3-month 15.90Low 637 486 151,543 Aus - Low 0.09 0.12 0.14 0.10 6-month 16.60 S. Africa - 12-month 17.00
Source: Prices: London Bullion Market Association, Others: Virtual Metals
Gold price ($/oz)
630
635
640
645
650
655
660
665
670
675
1-Mar 11-Mar 21-Mar
Source: London Bullion Market Association
Comex: Non-commercial net position (tonnes)
050
100150200250300350400450500550600650700750
Jan-05 Jun-05 Dec-05 May-06 Nov-06
Source: Virtual Metals
South Africa gold production, annual (tonnes)
200
300
400
500
600
700
800
900
1000
1100
1952 1962 1972 1982 1992 2002
Source: Virtual Metals
Fortis/Virtual Metals April 2007 | Fortis metals monthly | 11
Silver News � Apr 2nd: Peru�s silver production rose 7.5% to 266t in January compared to
the same month last year, and a further 3.4% in February (vs. February 2006) to 265t. Peru has now displaced Mexico as the world�s biggest silver miner, with output in 2006 above 111 Moz, against Mexico�s 75.5 Moz in the same year. Mexican silver production in January was more than 6.725 Moz.
� Mar 22nd: China�s imports of silver in February were more than 11 Moz, 87% higher than the same month in 2006; total imports for the first two months of the year were more than 21 Moz, more than 90% higher, year-on-year, according to official customs data. Silver exports for Jan-Feb 2007 were more than 27.2 Moz, a rise of more than 81% on the same period in 2006.
� Mar 21st: Endeavour Silver reported production from its Guanacevi operations in Durango, Mexico, rose 42% year-on-year to 1.35 Moz silver in 2006. Production is forecast by the company to double in 2007 to 2.57 Moz.
� Mar 21st: Mexico�s Industrias Peñoles, the world�s biggest silver refiner (it refined 91 Moz in 2006) said it plans to produce 52 Moz of silver in 2007 against 49 Moz last year, expanding output by a further 3%-4% in 2008 and 2009, then further increasing output by 10 Moz in 2010-2011 when its projects in the Fresnillo region of central Mexico come on-stream.
Analysis � Indian demand slips India�s demand for silver slipped in 2006. According to a report in India�s Financial Express (21st March) total legal imports in 2006 were 500t against 1,100t in 2005. The government agency MMTC sold about 800t of government silver in 2006, against 1,100t in 2005, while locally available scrap supply rose 40% to 700t. Total availability of silver in 2006 is estimated to have been 4,481t against 5,973t in 2005. Of particular note was a 33% fall in demand for silver jewellery, to around 400t, while total demand for all fabrication purposes fell 9% in 2006, to 3,260t. Bolivia will hold talks with the Japanese mining company Sumitomo to try to reassure it that planned higher taxes on mining operations will not threaten its investments in the country, according to President Evo Morales. Sumitomo has a 35% stake in San Cristobal, a large silver-zinc-lead project scheduled to start operations before the end of 2007. Apex Silver Mines holds the remaining 65%. �We have said that if metals (prices) go up, taxes will increase, and they (Sumitomo) understand that perfectly,� Morales said in March, after returning from a state visit to Japan.
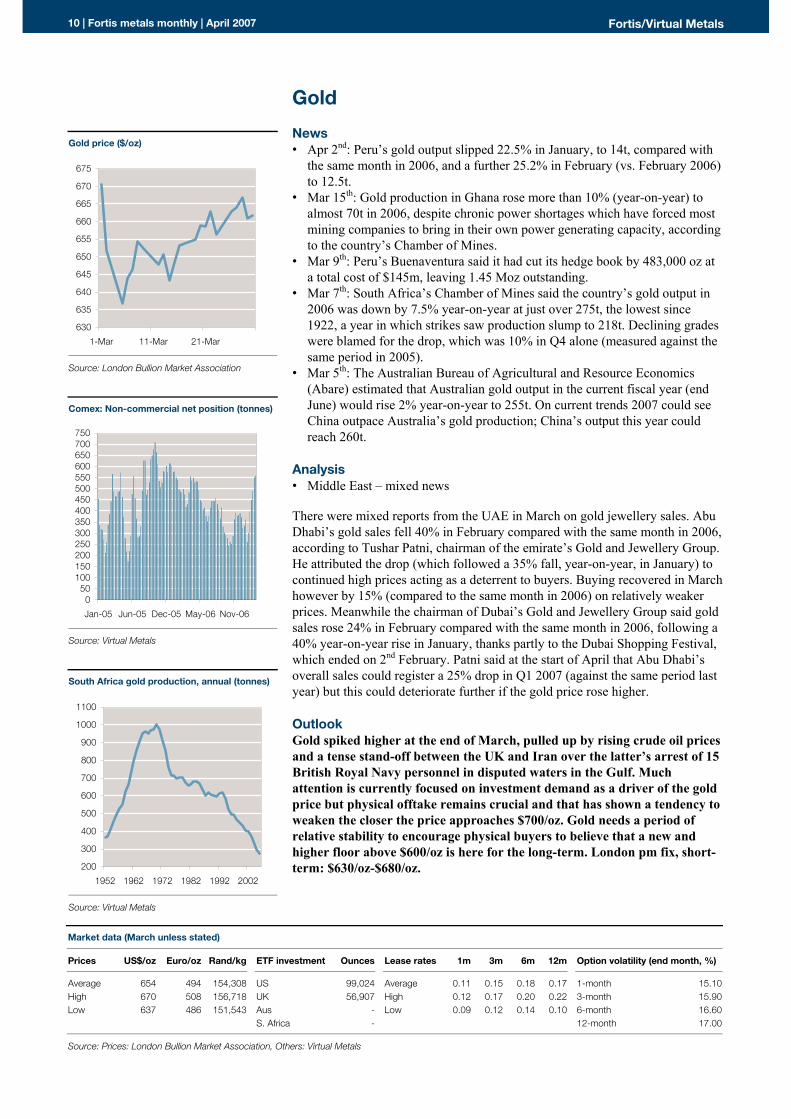
Outlook We remain convinced silver is significantly over-valued; reports from India suggest that this key physical market may be growing disenchanted with silver jewellery. Meanwhile new mine supply (from lead-zinc mine by-products as much as �pure� silver mining) is rapidly increasing. A weak dollar and investment marketing froth might keep silver threatening to challenge $15/oz in the short-term. Longer perspectives, however, suggest a retreat below $10/oz. London daily fix short-term: $12.80/oz-$13.80/oz.
Silver price (cents/oz)
1,200
1,250
1,300
1,350
1,400
1,450
1-Mar 11-Mar 21-Mar
Source: London Bullion Market Association
Comex: Non-commercial net position (tonnes)
0
2,000
4,000
6,000
8,000
10,000
12,000
14,000
Jan-05 Jun-05 Dec-05 May-06 Nov-06
Source: Comex
Rolling monthly silver ETF offtake (tonnes)
-200
0
200
400
600
800
1,000
1,200
1,400
1,600
May Jun Jul Aug Oct Nov Dec Jan Feb
Source: Virtual Metals from BGI
Market data (March unless stated)
Prices c/oz e/oz p/oz Imports kg Lease rates 1m 3m 6m 12m Option volatility (end month, %)
Average 1,316.8 994.6 676.7 USA (Jan) 467,955 Average 0.03 0.18 0.61 1.16 1-month 25.00High 1,429.0 1,083.9 729.6 Japan (Jan) 496,563 High 0.06 0.21 0.67 1.26 3-month 27.00Low 1,260.5 956.6 653.7 China (Feb) 343,168 Low 0.01 0.13 0.56 1.06 6-month 28.00 12-month 29.00
Source: Prices: London Bullion Market Association, Others: Virtual Metals

12 | Fortis metals monthly | April 2007 Fortis/Virtual Metals
Platinum News � Mar 28th: South Africa�s competition authority approved the acquisition of
Afplats by Implats; Impala offered $584m in February to acquire the whole company.
� Mar 22nd: China�s platinum imports in February fell 34% compared with the same month of 2006, to 44,786 oz, according to official customs data. Total imports for the first two months of the year were 112,463 oz, 14.2% up, year-on-year.
� Mar 13th: Lonmin said it aims to double output to 2 Moz, above its 2012 target of 1.4 Moz, by building new mines.
� Mar 5th: The USA�s Environmental Protection Agency (EPA) proposed new regulations to curtail toxic emissions from ships and trains. The new Clean Air Locomotive and Marine Diesel Rule aims to cut such emissions by 90%, with a further 80% per cent reduction of nitrogen oxide emissions by 2030. The regulations are likely to affect 21,000 trains as well as 40,000 boats and ships.
Analysis � Investor confidence firm New platinum exploration is proceeding rapidly in South Africa. The latest company to announce sizeable reserves was Wesizwe Platinum, which published findings of a feasibility study for a new mine, saying the project was a year ahead of schedule. The feasibility study said the mine could produce around 260,000 oz/year of platinum group metals and gold over 20 years. Wesizwe, which listed on the Johannesburg stock exchange in December 2005, expects to complete a bankable feasibility study in Q1 2008. The company is the investment vehicle for the Bakubung Ba-Ratheo Tribe, which owns a 33% share in Wesizwe. The Ledig Frischgewaagd development, in Pilansberg, would produce about 260,000 oz/year of platinum from mineral reserves estimated at 16.7 Mt, with a mine life of at least 20 years. Germany announced new laws intended to increase the number of older diesel vehicles retrofitted with emissions-control catalysts. Owners of older diesel vehicles will be given a tax rebate from 1st April if they exhaust particle filters. At the same time road tax on those vehicles which are not fitted with a filter and do not meet current EU standards will rise by an average of �25/year. The market analyst iSuppli said in March that it estimates that LCD panel shipments in 2007 will reach 75.2m, up from its previous forecast of 72.9m made in Q4 2006, as a consequence of price cuts by producers. The new figures are 42.7% higher than the amount of screens sold in 2006 and support the belief that the market will break through 100m units/year by the end of 2008.
Outlook Platinum prices eased slightly in early March but recovered and ended firmly at $1,244/oz; tightening emissions legislation in the EU and elsewhere will keep industrial demand growing strongly for the foreseeable future. London daily pm fix short term: $1,200/oz-$1,270/oz.
Platinum price ($/oz)
1100
1150
1200
1250
1300
1-Mar 11-Mar 21-Mar
Source: London Platinum & Palladium Market
Nymex: Non-commercial net position (ounces)
050,000
100,000150,000200,000250,000300,000350,000400,000450,000500,000550,000600,000
Jan-05 Jun-05 Dec-05 May-06 Nov-06
Source: Nymex
China platinum imports (oz) (ex. Hong Kong)
0
200,000
400,000
600,000
800,000
1,000,000
1,200,000
1,400,000
Jan-06 Jul-06 Jan-07
Source: Trade Stats
Market data (March unless stated)
Prices US$/oz Lease rates 1m 3m 6m 12m Trade (kg) Imports Exports Option volatility (end month, %)
Average 1,219 Average 2.0 2.7 3.1 3.5 USA (Jan) 5,611 4,212 1-month 21.30High 1,248 High 2.1 2.8 3.6 4.0 Japan (Jan) 5,262 933 3-month 23.80Low 1,165 Low 1.8 2.6 2.8 3.1 Hong Kong (Dec) 2,032 193 6-month 26.30 Switzerland (Feb) 3,276 2,532 12-month 28.50 China (Feb) 1,392 45
Source Price: London Platinum and Palladium Market, Others: Virtual Metals

Fortis/Virtual Metals April 2007 | Fortis metals monthly | 13
Palladium News � Mar 22nd: China�s palladium imports in February were almost 40,000 oz,
more than 33% higher than the same month in 2006; total imports for the first two months of the year were almost 73,000 oz, a rise of more than 90%, year-on-year.
� Mar 9th: USA palladium exports fell by more than 70% in January against December 2006, to slightly more than 99,899 oz; the figure was also 8% down when compared to January 2006, according to the Commerce Department. Imports were also down, by 29.2% (again, compared to December 2006), at almost 143,000 oz, and more than 67% lower than the figure for January 2006, of almost 438,452 oz.
Analysis � Sideways trading in dull March Frank McAllister, CEO of Stillwater, north America�s only big producer of pgms, gave an interesting interview to the Billings Gazette, Stillwater�s local newspaper in Montana, in March, in which he gave further background to the company�s reasons for its high-profile campaign to promote palladium jewellery. Part of the reason is the long-term price contracts Stillwater signed with Mitsubishi, Ford and General Motors in the 1990s for autocatalytic uses for the metal; the final of these contracts is due to expire in 2010. As McAllister put it: �We need the price of palladium up and the cost of production down so we can compete.� The current price gap between platinum and palladium is obviously favouring palladium jewellery demand, but this will be a crucial test year for both it and Stillwater � will Chinese demand continue growing or has it reached a plateau, and will palladium make any serious impact on jewellery markets elsewhere? European car sales in February fell 2.5% compared with the same month in 2006, according to data published by ACEA, the European Automobile Manufacturers Association. In total, 1,083,811 new cars were registered in February in the enlarged Europe (EU25 and EFTA). Cumulative figures for the first two months of 2007 for the enlarged Europe were flat, year-on-year. Apart from Italy (up 5.7%) the biggest EU markets saw declines in February 2007. German sales were down by 15.1% (due to a sales tax increase at the beginning of the year), while the UK market fell 3.2% before the March plate change. Results in other countries were mixed, with only five countries posting growth ranging from a rise of 4.1% in the Netherlands to one of 9.5% in Sweden. The Western European market as a whole declined by 1.2% over the first two months of the year: nine EU 15 countries performed better than in 2006, while six saw registrations decrease.
Outlook Palladium traded in a remarkably narrow $338/oz-$353/oz in March, drifting on almost flat investment movements on Nymex and Tocom. Fresh drivers to push the price higher are not immediately obvious. London daily pm fix short-term: $340/oz-$355/oz.
Palladium price ($/oz)
335
337
339
341
343
345
347
349
351
353
355
1-Mar 11-Mar 21-Mar
Source: London Platinum & Palladium Market
Nymex: Non-commercial net position (ounces)
0
200,000
400,000
600,000
800,000
1,000,000
1,200,000
1,400,000
Jan-05 Jun-05 Dec-05May-06Nov-06
Source: Nymex
China palladium imports (oz) (ex. Hong Kong)
0
5,000
10,000
15,000
20,000
25,000
30,000
35,000
40,000
45,000
Jan-06 Jul-06 Jan-07
Source: Trade Stats
Market data (March unless stated)
Prices US$/oz Lease rates 1m 3m 6m 12m Trades (kg) Imports Exports Option volatility (end month, %)
Average 350.0 Average 0.02 0.08 0.08 0.08 USA (Jan) 5,133 5,582 1-month 22.00High 354.0 High 0.07 0.11 0.14 0.43 Japan (Jan) 149 1,623 3-month 26.00Low 338.0 Low -0.08 0.05 0.01 -0.13 Hong Kong (Dec) 2,108 316 6-month 32.00 Switzerland (Feb) 1,997 1,850 12-month 34.50 China (Feb) 1,234 80 24-month 37.00
Source: London Platinum and Palladium Market, Others: Virtual Metals
14 | Fortis metals monthly | April 2007 Fortis/Virtual Metals
Aluminium News � Apr 2nd: Voters in the town of Hafnarfjordur in Iceland turned down plans by
Alcan to expand the capacity of its local smelter from 179,000t/year to 460,000t/year.
� Mar 27th: The planned merger between the two Russian aluminium producers Rusal and Sual, together with the aluminium assets of Glencore took effect; the new entity, to be called United Company Rusal (UCR), will have an annual production capacity of 4 Mt of aluminium and 11 Mt of alumina. UCR�s board said it planned to float the company within three years.
� Mar 23rd: Production by Venezuela�s state-owned primary aluminum producer, Alcasa, fell 5.23% to 13,833t in February vs. the same month in 2006.
� Mar 20th: Total global aluminium production in February was 1.87 Mt, against 1.823 Mt in February 2006 and 2.057 Mt in January this year, according to the International Aluminium Institute (IAI).
� Mar 16th: Ghana�s Valco aluminium smelter, which had been operating at 30% of capacity, shut down indefinitely due to power shortages. The 200,000t/year capacity smelter is jointly owned by Ghana�s government and Alcoa.
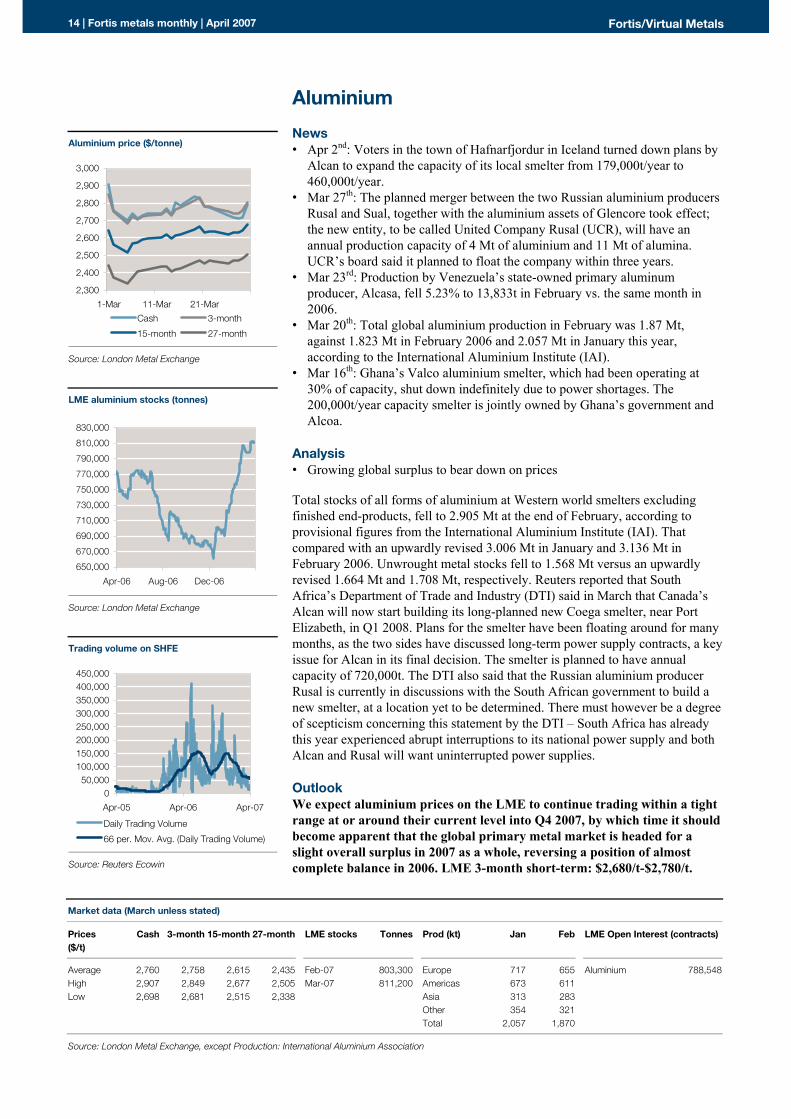
Analysis � Growing global surplus to bear down on prices Total stocks of all forms of aluminium at Western world smelters excluding finished end-products, fell to 2.905 Mt at the end of February, according to provisional figures from the International Aluminium Institute (IAI). That compared with an upwardly revised 3.006 Mt in January and 3.136 Mt in February 2006. Unwrought metal stocks fell to 1.568 Mt versus an upwardly revised 1.664 Mt and 1.708 Mt, respectively. Reuters reported that South Africa�s Department of Trade and Industry (DTI) said in March that Canada�s Alcan will now start building its long-planned new Coega smelter, near Port Elizabeth, in Q1 2008. Plans for the smelter have been floating around for many months, as the two sides have discussed long-term power supply contracts, a key issue for Alcan in its final decision. The smelter is planned to have annual capacity of 720,000t. The DTI also said that the Russian aluminium producer Rusal is currently in discussions with the South African government to build a new smelter, at a location yet to be determined. There must however be a degree of scepticism concerning this statement by the DTI � South Africa has already this year experienced abrupt interruptions to its national power supply and both Alcan and Rusal will want uninterrupted power supplies.
Outlook We expect aluminium prices on the LME to continue trading within a tight range at or around their current level into Q4 2007, by which time it should become apparent that the global primary metal market is headed for a slight overall surplus in 2007 as a whole, reversing a position of almost complete balance in 2006. LME 3-month short-term: $2,680/t-$2,780/t.
Aluminium price ($/tonne)
2,300
2,400
2,500
2,600
2,700
2,800
2,900
3,000
1-Mar 11-Mar 21-MarCash 3-month
15-month 27-month
Source: London Metal Exchange
LME aluminium stocks (tonnes)
650,000
670,000
690,000
710,000
730,000
750,000
770,000
790,000
810,000
830,000
Apr-06 Aug-06 Dec-06
Source: London Metal Exchange
Trading volume on SHFE
050,000
100,000150,000200,000250,000300,000350,000400,000450,000
Apr-05 Apr-06 Apr-07
Daily Trading Volume
66 per. Mov. Avg. (Daily Trading Volume)
Source: Reuters Ecowin
Market data (March unless stated)
Prices ($/t)
Cash 3-month 15-month 27-month LME stocks Tonnes Prod (kt) Jan Feb LME Open Interest (contracts)
Average 2,760 2,758 2,615 2,435 Feb-07 803,300 Europe 717 655 Aluminium 788,548High 2,907 2,849 2,677 2,505 Mar-07 811,200 Americas 673 611 Low 2,698 2,681 2,515 2,338 Asia 313 283 Other 354 321 Total 2,057 1,870
Source: London Metal Exchange, except Production: International Aluminium Association
Fortis/Virtual Metals April 2007 | Fortis metals monthly | 15
Copper News � Mar 28th: Brazil�s refined copper production should more than double to
368,000t by 2010, according to the country�s Copper Association, from 163,000t in 2006.
� Mar 25th: Xstrata said it expects its Tintaya mine, in Peru, will increase output by 5% in 2007 to 121,000t.
� Mar 25th: BHP Billiton said its Spence copper project in Chile will produce 180,000t of copper cathodes in 2007. The $1bn project started production in December 2006 and will produce 200,000t of copper cathodes per year after it hits design capacity in Q3 2007.
� Mar 22nd: Southern Copper Corporation, owned by Grupo Mexico, said its output would rise 15% in 2007 to about 696,000t.
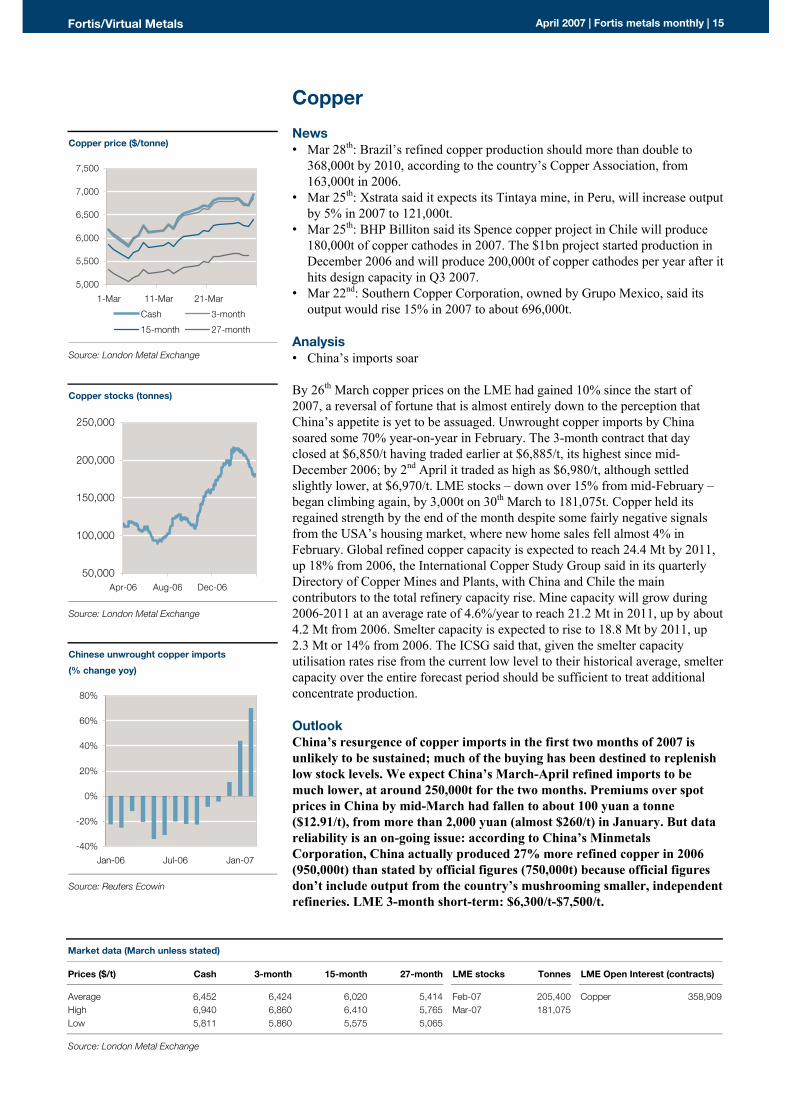
Analysis � China�s imports soar By 26th March copper prices on the LME had gained 10% since the start of 2007, a reversal of fortune that is almost entirely down to the perception that China�s appetite is yet to be assuaged. Unwrought copper imports by China soared some 70% year-on-year in February. The 3-month contract that day closed at $6,850/t having traded earlier at $6,885/t, its highest since mid-December 2006; by 2nd April it traded as high as $6,980/t, although settled slightly lower, at $6,970/t. LME stocks � down over 15% from mid-February � began climbing again, by 3,000t on 30th March to 181,075t. Copper held its regained strength by the end of the month despite some fairly negative signals from the USA�s housing market, where new home sales fell almost 4% in February. Global refined copper capacity is expected to reach 24.4 Mt by 2011, up 18% from 2006, the International Copper Study Group said in its quarterly Directory of Copper Mines and Plants, with China and Chile the main contributors to the total refinery capacity rise. Mine capacity will grow during 2006-2011 at an average rate of 4.6%/year to reach 21.2 Mt in 2011, up by about 4.2 Mt from 2006. Smelter capacity is expected to rise to 18.8 Mt by 2011, up 2.3 Mt or 14% from 2006. The ICSG said that, given the smelter capacity utilisation rates rise from the current low level to their historical average, smelter capacity over the entire forecast period should be sufficient to treat additional concentrate production.
Outlook China�s resurgence of copper imports in the first two months of 2007 is unlikely to be sustained; much of the buying has been destined to replenish low stock levels. We expect China�s March-April refined imports to be much lower, at around 250,000t for the two months. Premiums over spot prices in China by mid-March had fallen to about 100 yuan a tonne ($12.91/t), from more than 2,000 yuan (almost $260/t) in January. But data reliability is an on-going issue: according to China�s Minmetals Corporation, China actually produced 27% more refined copper in 2006 (950,000t) than stated by official figures (750,000t) because official figures don�t include output from the country�s mushrooming smaller, independent refineries. LME 3-month short-term: $6,300/t-$7,500/t.
Copper price ($/tonne)
5,000
5,500
6,000
6,500
7,000
7,500
1-Mar 11-Mar 21-Mar
Cash 3-month
15-month 27-month
Source: London Metal Exchange
Copper stocks (tonnes)
50,000
100,000
150,000
200,000
250,000
Apr-06 Aug-06 Dec-06
Source: London Metal Exchange
Chinese unwrought copper imports
(% change yoy)
-40%
-20%
0%
20%
40%
60%
80%
Jan-06 Jul-06 Jan-07
Source: Reuters Ecowin
Market data (March unless stated)
Prices ($/t) Cash 3-month 15-month 27-month LME stocks Tonnes LME Open Interest (contracts)
Average 6,452 6,424 6,020 5,414 Feb-07 205,400 Copper 358,909High 6,940 6,860 6,410 5,765 Mar-07 181,075 Low 5,811 5,860 5,575 5,065
Source: London Metal Exchange
16 | Fortis metals monthly | April 2007 Fortis/Virtual Metals
Nickel News � Mar 26th: Total world stainless steel production rose 16.7% year-on-year in
2006 to 28.4 Mt, said the International Stainless Steel Forum, with the biggest rise from China, whose output rose 68% to 5.3 Mt.
� Mar 26th: Xstrata made a friendly all-cash bid for LionOre valuing the company at $4bn.
� Mar 22nd: China�s refined nickel imports rose 85.6% in February (vs. February 2006) to 12,087t.
� Mar 8th: CVRD Inco�s Indonesian subsidiary, PT International Nickel Indonesia, said output in 2006 fell 6.24% year-on-year to 71,700t.
� Mar 2nd: Norilsk completed a deal (valued at $408m) to buy the nickel assets in Australia and Finland of the USA-based OM Group.
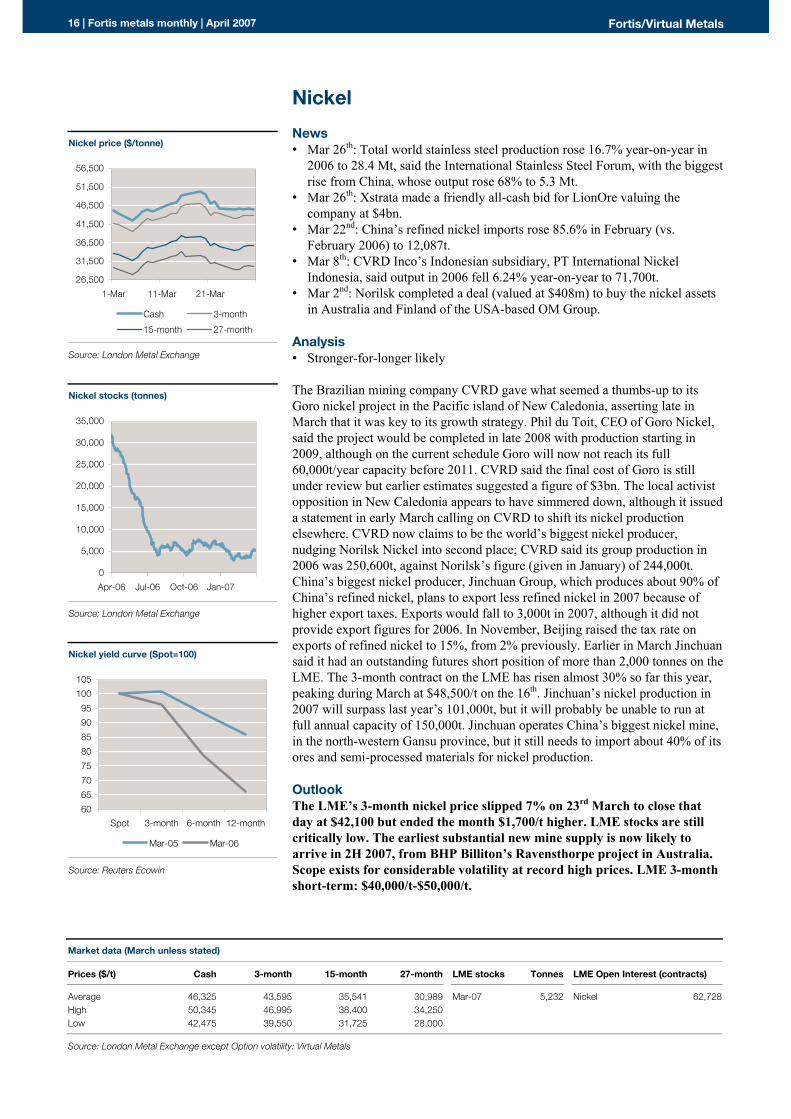
Analysis � Stronger-for-longer likely The Brazilian mining company CVRD gave what seemed a thumbs-up to its Goro nickel project in the Pacific island of New Caledonia, asserting late in March that it was key to its growth strategy. Phil du Toit, CEO of Goro Nickel, said the project would be completed in late 2008 with production starting in 2009, although on the current schedule Goro will now not reach its full 60,000t/year capacity before 2011. CVRD said the final cost of Goro is still under review but earlier estimates suggested a figure of $3bn. The local activist opposition in New Caledonia appears to have simmered down, although it issued a statement in early March calling on CVRD to shift its nickel production elsewhere. CVRD now claims to be the world�s biggest nickel producer, nudging Norilsk Nickel into second place; CVRD said its group production in 2006 was 250,600t, against Norilsk�s figure (given in January) of 244,000t. China�s biggest nickel producer, Jinchuan Group, which produces about 90% of China�s refined nickel, plans to export less refined nickel in 2007 because of higher export taxes. Exports would fall to 3,000t in 2007, although it did not provide export figures for 2006. In November, Beijing raised the tax rate on exports of refined nickel to 15%, from 2% previously. Earlier in March Jinchuan said it had an outstanding futures short position of more than 2,000 tonnes on the LME. The 3-month contract on the LME has risen almost 30% so far this year, peaking during March at $48,500/t on the 16th. Jinchuan�s nickel production in 2007 will surpass last year�s 101,000t, but it will probably be unable to run at full annual capacity of 150,000t. Jinchuan operates China�s biggest nickel mine, in the north-western Gansu province, but it still needs to import about 40% of its ores and semi-processed materials for nickel production.
Outlook The LME�s 3-month nickel price slipped 7% on 23rd March to close that day at $42,100 but ended the month $1,700/t higher. LME stocks are still critically low. The earliest substantial new mine supply is now likely to arrive in 2H 2007, from BHP Billiton�s Ravensthorpe project in Australia. Scope exists for considerable volatility at record high prices. LME 3-month short-term: $40,000/t-$50,000/t.
Nickel price ($/tonne)
26,500
31,500
36,500
41,500
46,500
51,500
56,500
1-Mar 11-Mar 21-Mar
Cash 3-month
15-month 27-month
Source: London Metal Exchange
Nickel stocks (tonnes)
0
5,000
10,000
15,000
20,000
25,000
30,000
35,000
Apr-06 Jul-06 Oct-06 Jan-07
Source: London Metal Exchange
Nickel yield curve (Spot=100)
6065707580859095
100105
Spot 3-month 6-month 12-month
Mar-05 Mar-06
Source: Reuters Ecowin
Market data (March unless stated)
Prices ($/t) Cash 3-month 15-month 27-month LME stocks Tonnes LME Open Interest (contracts)
Average 46,325 43,595 35,541 30,989 Mar-07 5,232 Nickel 62,728High 50,345 46,995 38,400 34,250 Low 42,475 39,550 31,725 28,000
Source: London Metal Exchange except Option volatility: Virtual Metals
Fortis/Virtual Metals April 2007 | Fortis metals monthly | 17
Lead and zinc News � Apr 2nd: Peru�s zinc production rose 18% in February (vs. February 2006) to
112,948t, according to the country�s National Statistics Institute, or INEI This followed a 35.7% rise in January to 98,800t compared to 72,800t in January 2006. Peru�s zinc output in 2007 could rise 4% against the figure of 1.2 Mt for 2006.
� Mar 29th: Perilya, the Australian lead and zinc producer, warned that Q1 2007 output from its Broken Hill operations in New South Wales will be much less than expected after a fatal accident in January. Operations are now back to normal but full-year production is now likely to be 100,000-105,000t of zinc and 60,000-65,000t of lead, as much as 31,000t of zinc and 16,000t of lead lower than 2006.
� Mar 21st: Mexico�s Industrias Peñoles plans to invest $200m to expand over the next eight years its zinc refining capacity at its Metmex plant from the current 240,000t/year to 320,000t/year.
� Mar 13th: Canada�s Ivernia said that operations were continuing at its Magellan lead mine in Australia, despite shipments being suspended earlier in the month following suspicious bird deaths at the site. The Magellan mine yielded 63,200t of lead metal in a concentrate in 2006, most of which was shipped to smelting firms in China. On 3rd April Ivernia declared force majeure on shipments at its Magellan mine.
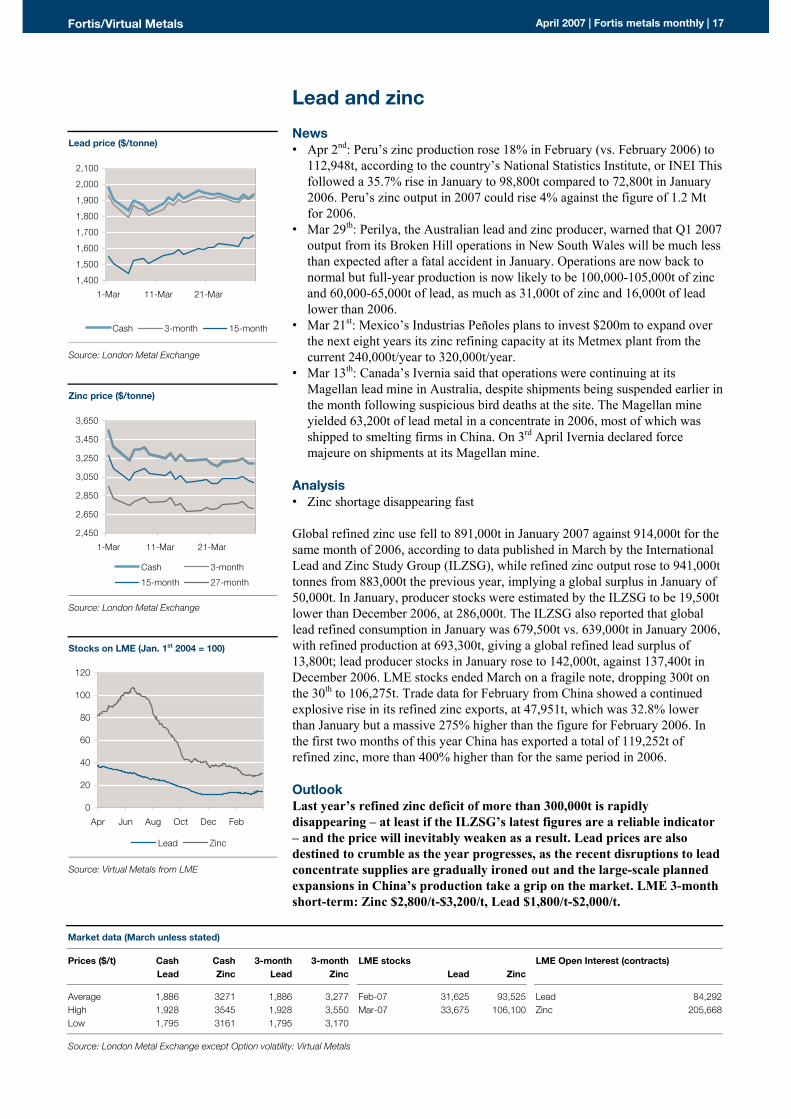
Analysis � Zinc shortage disappearing fast Global refined zinc use fell to 891,000t in January 2007 against 914,000t for the same month of 2006, according to data published in March by the International Lead and Zinc Study Group (ILZSG), while refined zinc output rose to 941,000t tonnes from 883,000t the previous year, implying a global surplus in January of 50,000t. In January, producer stocks were estimated by the ILZSG to be 19,500t lower than December 2006, at 286,000t. The ILZSG also reported that global lead refined consumption in January was 679,500t vs. 639,000t in January 2006, with refined production at 693,300t, giving a global refined lead surplus of 13,800t; lead producer stocks in January rose to 142,000t, against 137,400t in December 2006. LME stocks ended March on a fragile note, dropping 300t on the 30th to 106,275t. Trade data for February from China showed a continued explosive rise in its refined zinc exports, at 47,951t, which was 32.8% lower than January but a massive 275% higher than the figure for February 2006. In the first two months of this year China has exported a total of 119,252t of refined zinc, more than 400% higher than for the same period in 2006.
Outlook Last year�s refined zinc deficit of more than 300,000t is rapidly disappearing � at least if the ILZSG�s latest figures are a reliable indicator � and the price will inevitably weaken as a result. Lead prices are also destined to crumble as the year progresses, as the recent disruptions to lead concentrate supplies are gradually ironed out and the large-scale planned expansions in China�s production take a grip on the market. LME 3-month short-term: Zinc $2,800/t-$3,200/t, Lead $1,800/t-$2,000/t.
Lead price ($/tonne)
1,400
1,500
1,600
1,700
1,800
1,900
2,000
2,100
1-Mar 11-Mar 21-Mar
Cash 3-month 15-month
Source: London Metal Exchange
Zinc price ($/tonne)
2,450
2,650
2,850
3,050
3,250
3,450
3,650
1-Mar 11-Mar 21-Mar
Cash 3-month
15-month 27-month
Source: London Metal Exchange
Stocks on LME (Jan. 1st 2004 = 100)
0
20
40
60
80
100
120
Apr Jun Aug Oct Dec Feb
Lead Zinc
Source: Virtual Metals from LME
Market data (March unless stated)
Prices ($/t) Cash Cash 3-month 3-month LME stocks LME Open Interest (contracts) Lead Zinc Lead Zinc Lead Zinc
Average 1,886 3271 1,886 3,277 Feb-07 31,625 93,525 Lead 84,292High 1,928 3545 1,928 3,550 Mar-07 33,675 106,100 Zinc 205,668Low 1,795 3161 1,795 3,170
Source: London Metal Exchange except Option volatility: Virtual Metals
18 | Fortis metals monthly | April 2007 Fortis/Virtual Metals
Tin News � Mar 28th: Bolivia�s President, Evo Morales, appointed a new mining minister,
Luis Alberto Echazu, following the surprise resignation of Guillermo Dalence, a former leader of the country�s state-run mining trade union. The new minister said he ratified the President�s �drive to regain control over natural resources, and expand the mining sector.�
� Mar 20th: Peru�s tin production in January dropped 4.4%, to 2,900t, compared with January 2006.
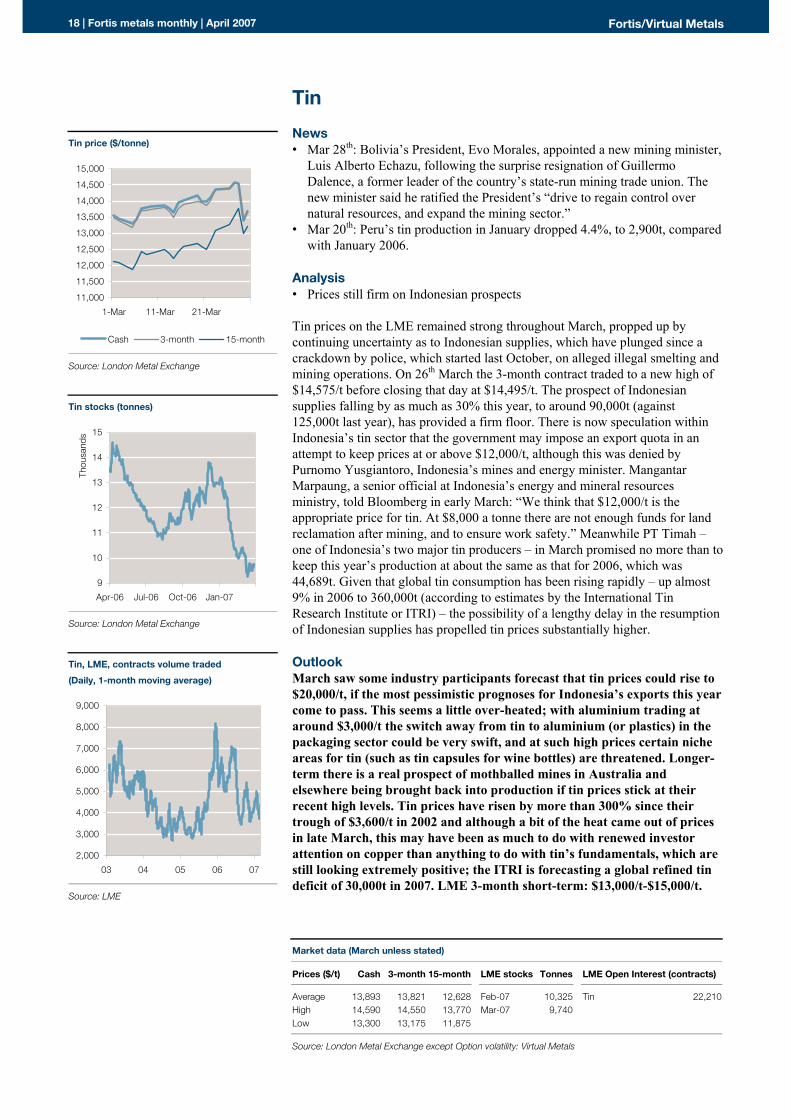
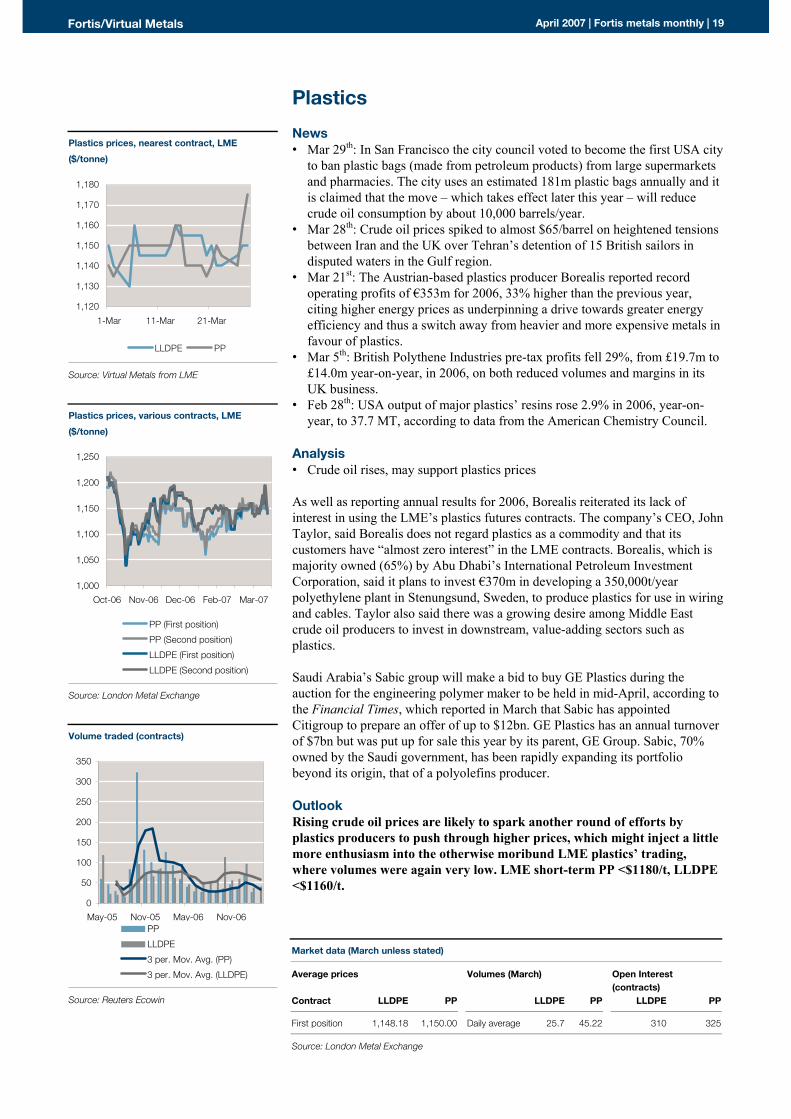
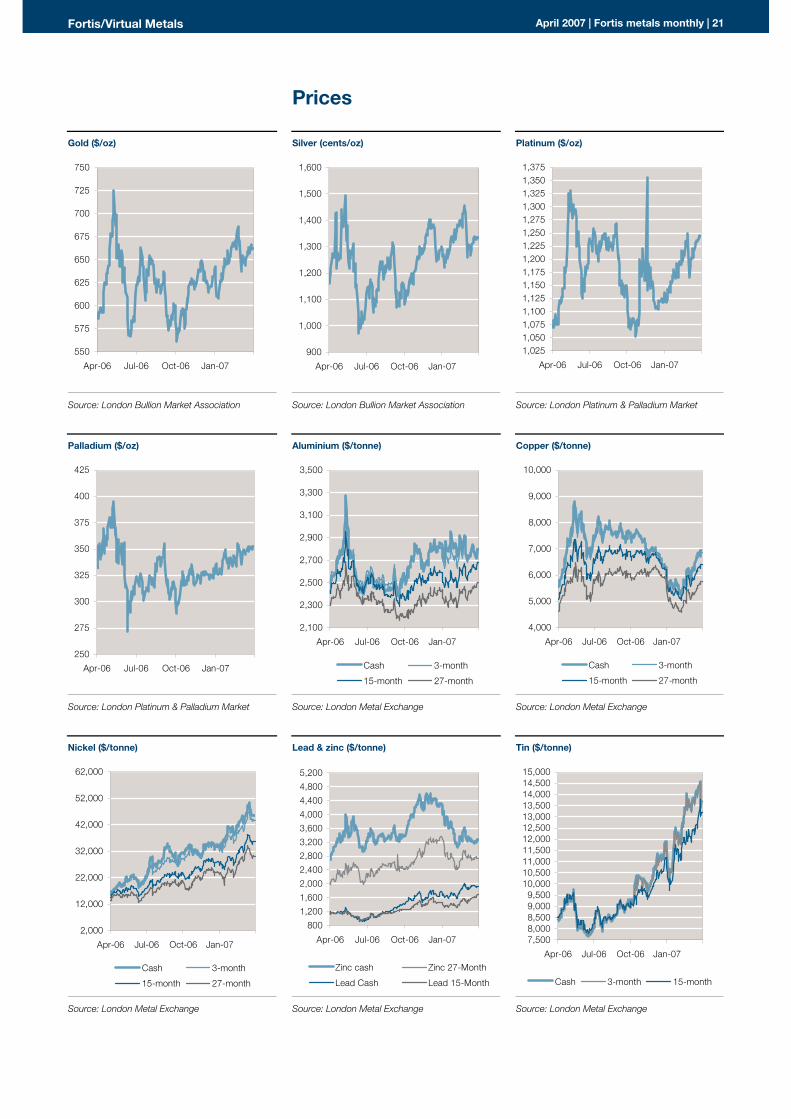
Analysis � Prices still firm on Indonesian prospects Tin prices on the LME remained strong throughout March, propped up by continuing uncertainty as to Indonesian supplies, which have plunged since a crackdown by police, which started last October, on alleged illegal smelting and mining operations. On 26th March the 3-month contract traded to a new high of $14,575/t before closing that day at $14,495/t. The prospect of Indonesian supplies falling by as much as 30% this year, to around 90,000t (against 125,000t last year), has provided a firm floor. There is now speculation within Indonesia�s tin sector that the government may impose an export quota in an attempt to keep prices at or above $12,000/t, although this was denied by Purnomo Yusgiantoro, Indonesia�s mines and energy minister. Mangantar Marpaung, a senior official at Indonesia�s energy and mineral resources ministry, told Bloomberg in early March: �We think that $12,000/t is the appropriate price for tin. At $8,000 a tonne there are not enough funds for land reclamation after mining, and to ensure work safety.� Meanwhile PT Timah � one of Indonesia�s two major tin producers � in March promised no more than to keep this year�s production at about the same as that for 2006, which was 44,689t. Given that global tin consumption has been rising rapidly � up almost 9% in 2006 to 360,000t (according to estimates by the International Tin Research Institute or ITRI) � the possibility of a lengthy delay in the resumption of Indonesian supplies has propelled tin prices substantially higher.
Outlook March saw some industry participants forecast that tin prices could rise to $20,000/t, if the most pessimistic prognoses for Indonesia�s exports this year come to pass. This seems a little over-heated; with aluminium trading at around $3,000/t the switch away from tin to aluminium (or plastics) in the packaging sector could be very swift, and at such high prices certain niche areas for tin (such as tin capsules for wine bottles) are threatened. Longer-term there is a real prospect of mothballed mines in Australia and elsewhere being brought back into production if tin prices stick at their recent high levels. Tin prices have risen by more than 300% since their trough of $3,600/t in 2002 and although a bit of the heat came out of prices in late March, this may have been as much to do with renewed investor attention on copper than anything to do with tin�s fundamentals, which are still looking extremely positive; the ITRI is forecasting a global refined tin deficit of 30,000t in 2007. LME 3-month short-term: $13,000/t-$15,000/t.
Tin price ($/tonne)
11,000
11,500
12,000
12,500
13,000
13,500
14,000
14,500
15,000
1-Mar 11-Mar 21-Mar
Cash 3-month 15-month
Source: London Metal Exchange
Tin stocks (tonnes)
9
10
11
12
13
14
15
Apr-06 Jul-06 Oct-06 Jan-07
Thou
sand
s
Source: London Metal Exchange
Tin, LME, contracts volume traded
(Daily, 1-month moving average)
2,000
3,000
4,000
5,000
6,000
7,000
8,000
9,000
03 04 05 06 07
Source: LME
Market data (March unless stated)
Prices ($/t) Cash 3-month 15-month LME stocks Tonnes LME Open Interest (contracts)
Average 13,893 13,821 12,628 Feb-07 10,325 Tin 22,210High 14,590 14,550 13,770 Mar-07 9,740 Low 13,300 13,175 11,875
Source: London Metal Exchange except Option volatility: Virtual Metals
Fortis/Virtual Metals April 2007 | Fortis metals monthly | 19
Plastics News � Mar 29th: In San Francisco the city council voted to become the first USA city
to ban plastic bags (made from petroleum products) from large supermarkets and pharmacies. The city uses an estimated 181m plastic bags annually and it is claimed that the move � which takes effect later this year � will reduce crude oil consumption by about 10,000 barrels/year.
� Mar 28th: Crude oil prices spiked to almost $65/barrel on heightened tensions between Iran and the UK over Tehran�s detention of 15 British sailors in disputed waters in the Gulf region.
� Mar 21st: The Austrian-based plastics producer Borealis reported record operating profits of �353m for 2006, 33% higher than the previous year, citing higher energy prices as underpinning a drive towards greater energy efficiency and thus a switch away from heavier and more expensive metals in favour of plastics.
� Mar 5th: British Polythene Industries pre-tax profits fell 29%, from £19.7m to £14.0m year-on-year, in 2006, on both reduced volumes and margins in its UK business.
� Feb 28th: USA output of major plastics� resins rose 2.9% in 2006, year-on-year, to 37.7 MT, according to data from the American Chemistry Council.
Analysis � Crude oil rises, may support plastics prices As well as reporting annual results for 2006, Borealis reiterated its lack of interest in using the LME�s plastics futures contracts. The company�s CEO, John Taylor, said Borealis does not regard plastics as a commodity and that its customers have �almost zero interest� in the LME contracts. Borealis, which is majority owned (65%) by Abu Dhabi�s International Petroleum Investment Corporation, said it plans to invest �370m in developing a 350,000t/year polyethylene plant in Stenungsund, Sweden, to produce plastics for use in wiring and cables. Taylor also said there was a growing desire among Middle East crude oil producers to invest in downstream, value-adding sectors such as plastics.
Saudi Arabia�s Sabic group will make a bid to buy GE Plastics during the auction for the engineering polymer maker to be held in mid-April, according to the Financial Times, which reported in March that Sabic has appointed Citigroup to prepare an offer of up to $12bn. GE Plastics has an annual turnover of $7bn but was put up for sale this year by its parent, GE Group. Sabic, 70% owned by the Saudi government, has been rapidly expanding its portfolio beyond its origin, that of a polyolefins producer.
Outlook Rising crude oil prices are likely to spark another round of efforts by plastics producers to push through higher prices, which might inject a little more enthusiasm into the otherwise moribund LME plastics� trading, where volumes were again very low. LME short-term PP <$1180/t, LLDPE <$1160/t.
Market data (March unless stated)
Average prices Volumes (March) Open Interest (contracts)
Contract LLDPE PP LLDPE PP LLDPE PP
First position 1,148.18 1,150.00 Daily average 25.7 45.22 310 325
Source: London Metal Exchange
Plastics prices, nearest contract, LME
($/tonne)
1,120
1,130
1,140
1,150
1,160
1,170
1,180
1-Mar 11-Mar 21-Mar
LLDPE PP
Source: Virtual Metals from LME
Plastics prices, various contracts, LME
($/tonne)
1,000
1,050
1,100
1,150
1,200
1,250
Oct-06 Nov-06 Dec-06 Feb-07 Mar-07
PP (First position)
PP (Second position)
LLDPE (First position)
LLDPE (Second position)
Source: London Metal Exchange
Volume traded (contracts)
0
50
100
150
200
250
300
350
May-05 Nov-05 May-06 Nov-06PP
LLDPE
3 per. Mov. Avg. (PP)
3 per. Mov. Avg. (LLDPE)
Source: Reuters Ecowin

20 | Fortis metals monthly | April 2007 Fortis/Virtual Metals
Indices
Precious and base metal prices
(1999 Avg.=base 100) Change from 30th March 2007 Current 1 M 1 Yr 5 Yr
Gold (spot) 237 0% 238 14% ! 209 125% ! 105Silver (spot) 256 -7% " 274 14% ! 225 195% ! 87Platinum (spot) 329 0% 327 16% ! 284 142% ! 136Palladium (spot) 97 2% ! 96 6% ! 92 -7% " 104 Aluminium (cash) 205 -3% " 212 11% ! 185 99% ! 103Aluminium (3m) 202 -1% " 204 11% ! 183 97% ! 102Aluminium (15m) 186 2% ! 183 9% ! 172 82% ! 102Aluminium (27m) 171 3% ! 166 7% ! 160 69% ! 101 Copper (cash) 441 16% ! 380 26% ! 351 332% ! 102Copper (3m) 428 13% ! 378 25% ! 341 321% ! 102Copper (15m) 382 11% ! 345 27% ! 301 280% ! 100Copper (27m) 336 10% ! 306 26% ! 267 236% ! 100 Nickel (cash) 756 2% ! 738 197% ! 255 596% ! 109Nickel (3m) 721 7% ! 673 184% ! 254 569% ! 108Nickel (15m) 603 7% ! 562 147% ! 244 445% ! 111Nickel (27m) 517 3% ! 503 126% ! 229 359% ! 112 Zinc (cash) 305 -5% " 322 22% ! 250 300% ! 76Zinc (3m) 301 -4% " 315 23% ! 245 292% ! 77Zinc (15m) 279 -4% " 290 29% ! 217 241% ! 82Zinc (27m) 249 -4% " 259 35% ! 185 195% ! 84 Lead (cash) 385 1% ! 380 60% ! 241 303% ! 96Lead (3m) 378 4% ! 364 59% ! 238 291% ! 97Lead (15m) 319 13% ! 283 43% ! 224 231% ! 96 Tin (cash) 253 1% ! 251 67% ! 151 256% ! 71Tin (3m) 253 2% ! 247 66% ! 152 253% ! 72Tin (15m) 244 9% ! 224 59% ! 154 230% ! 74
LME base metals stocks
(1999 Avg.=base 100) Change from 30th March 2007 Current 1 M 1 Yr 5 Yr
Aluminium 95 6% ! 89 5% ! 91 -13% " 109Copper 29 13% ! 25 125% ! 13 -75% " 113Lead 29 -4% " 30 -34% " 44 -71% " 99Nickel 6 -49% " 12 -91% " 68 -86% " 45Tin 120 -14% " 140 -31% " 173 -67% " 368Zinc 33 9% ! 31 -73% " 126 -79% " 159
USD exchange rates
(1999 Avg.=base 100) Change from 30th March 2007 Current 1 M 1 Yr 5 Yr
European euro 82 1% ! 81 -7% " 89 -32% " 121Canadian dollar 79 1% ! 78 3% ! 77 -26% " 108Great British pound 83 0% 83 -9% " 91 -27% " 113Japanese yen 106 1% ! 104 3% ! 103 -9% " 117South African rand 121 4% ! 117 19% ! 102 -36% " 190Australian dollar 84 2% ! 82 -2% " 86 -33% " 125
Source: Virtual Metals & London Metal Exchange
Fortis/Virtual Metals April 2007 | Fortis metals monthly | 21
Prices
Gold ($/oz)
Silver (cents/oz)
Platinum ($/oz)
550
575
600
625
650
675
700
725
750
Apr-06 Jul-06 Oct-06 Jan-07
900
1,000
1,100
1,200
1,300
1,400
1,500
1,600
Apr-06 Jul-06 Oct-06 Jan-07
1,0251,0501,0751,1001,1251,1501,1751,2001,2251,2501,2751,3001,3251,3501,375
Apr-06 Jul-06 Oct-06 Jan-07
Source: London Bullion Market Association Source: London Bullion Market Association Source: London Platinum & Palladium Market
Palladium ($/oz)
Aluminium ($/tonne)
Copper ($/tonne)
250
275
300
325
350
375
400
425
Apr-06 Jul-06 Oct-06 Jan-07
2,100
2,300
2,500
2,700
2,900
3,100
3,300
3,500
Apr-06 Jul-06 Oct-06 Jan-07
Cash 3-month
15-month 27-month
4,000
5,000
6,000
7,000
8,000
9,000
10,000
Apr-06 Jul-06 Oct-06 Jan-07
Cash 3-month
15-month 27-month
Source: London Platinum & Palladium Market Source: London Metal Exchange Source: London Metal Exchange
Nickel ($/tonne)
Lead & zinc ($/tonne)
Tin ($/tonne)
2,000
12,000
22,000
32,000
42,000
52,000
62,000
Apr-06 Jul-06 Oct-06 Jan-07
Cash 3-month
15-month 27-month
800
1,200
1,600
2,000
2,400
2,800
3,200
3,600
4,000
4,400
4,800
5,200
Apr-06 Jul-06 Oct-06 Jan-07
Zinc cash Zinc 27-Month
Lead Cash Lead 15-Month
7,5008,0008,5009,0009,500
10,00010,50011,00011,50012,00012,50013,00013,50014,00014,50015,000
Apr-06 Jul-06 Oct-06 Jan-07
Cash 3-month 15-month
Source: London Metal Exchange Source: London Metal Exchange Source: London Metal Exchange

22 | Fortis metals monthly | April 2007 Fortis/Virtual Metals
Notes
Fortis/Virtual Metals April 2007 | Fortis metals monthly | 23
Disclaimer and copyright The information and opinions in this report were prepared by Virtual Metals Research and Consulting (�Virtual Metals�). Virtual Metals has made all reasonable efforts to ensure that all information provided in this report is accurate and reliable at the time of inclusion (the 1st of this month otherwise stated), however, there may be inadvertent and occasional errors and lack of accuracy or correctness, for which Virtual Metals cannot be held responsible. Virtual Metals and its employees have no obligation to inform the reader when opinions and information contained in this report change.
Virtual Metals makes no representation or warranty, express or implicit, as to the accuracy or completeness of contents of this report. This report is not and cannot be construed as an offer to sell, buy or trade any securities, equities, commodities or related derivative products and the report in no way offers investment advice. Therefore Virtual Metals and its employees accept no liability for any direct, special, indirect, or consequential losses or damages, or any other losses or damages of whatsoever kind, resulting from whatever cause through the use of any information obtained either directly or indirectly from this report.
The contents of this report, all the information, opinions and conclusions contained is protected by copyright. This complete report may not be reproduced without the express consent of Virtual Metals. Short extracts may be reproduced but only with the full and appropriate citing of the original source.
24 | Fortis metals monthly | April 2007 Fortis/Virtual Metals
About Virtual Metals Virtual Metals Research & Consulting 85 Albany Street London NW1 4BT
Tel: +44 20 7487 3600 Fax: +44 (0)870 051 2261
Virtual Metals comprises a uniquely skilled team, with a collective 50 years� experience in the precious metals markets and all that this implies � a plethora of market contacts and personal networks of long-standing trust and wisdom. Our clients include world-class mining companies, for whom Virtual Metals specialises in proprietary research covering gold, silver and the platinum group metals.
Apart from the mining industry, Virtual Metals has as clients refiners, bullion banks, equity brokers, trading houses and other institutions. Clients in all segments of the mining and metals industries select Virtual Metals for independent outsourced value and experience without adding to corporate overhead.
The Virtual Metals team excels in macro-economic analysis, the generation of supply and demand scenarios, costs analysis, derivative research and price forecasting. Confidentiality, experience and independence are key elements of such advisory roles. Our aim is to assist those in need of external expertise, as well as those who wish to supplement their own in-house resources. With our extensive international contacts, we are able to broaden our services through links with experienced associates in related fields worldwide.
To see further how we can meet your research and consulting requirements, please email [email protected] or call or fax on the numbers above.

Fortis/Virtual Metals April 2007 | Fortis metals monthly | 25
Fortis commodities contact list Commodities Ian Downes (Head) +44 20 7444 8741John King (Head of Base & Precious Metals) +44 20 7444 8330Gerry Schubert (Director, Precious Metals) +44 20 7444 8600 Jonathan Parkman (Director, Agricommodities) +44 20 7444 8407 Global Commodities Group Piet-Hein Ingen Housz (Global Head of Metals) +31 10 401 67 93Rotterdam Silvan Doorenspleet +31 10 401 97 83London Michael Rolfe +44 20 7444 8450New York Edward Aldrich +1 203 705 57 25 Structured Commodity Finance Carl Shipman +44 20 7444 8785Singapore Ng Chuey Peng +65 65 394 923Hong Kong Lee Mei +852 28 47 94 20Shanghai Steven Jin +862 15 049 88 33
Johan Beckers +32 2 565 98 93(Global Head Sales & Marketing Group)
Paul Wagner (Head Investment Products Sales) +352 42 10 44 50 Kris De Zeure (European Head Sales Treasury) +32 2 565 60 81
Institutionals CorporateBelgium Marc Sollie +32 2 565 74 70 Matthias Locker (Head) +32 2 565 85 64The Netherlands Bert Veenstra +31 20 535 74 54 Belgium +32 2 565 72 05Luxembourg Paul Wagner +352 42 10 44 50 The Netherlands Alfonso Vera Evertman +31 20 535 71 66France François Girod +33 1 55 67 90 56 Luxembourg Manfred Hawelka +352 42 10 49 42Uk-Ireland Steven Harnie +32 2 565 86 35 France David Alfandari +33 1 55 67 90 05Italy Franco Mora +39 02 57 53 24 61 Italy Francesco Scotto +39 02 57 53 24 64Spain Jean-Louis Degand +34 91 436 56 27 Spain Louis Veldman +34 91 43 26 726
United Kingdom Tim Kirkham +44 20 73 98 93 53Retail and Private Banking Norway Bjorn Kaaber +47 23 11 49 60Belgium Alain Cadron +32 2 565 75 50The Netherlands Bert Veenstra +31 20 535 74 54 Financial InstitutionsLuxembourg André Wagner +352 42 10 49 07 Laurent Leveque (Head) +33 1 55 67 90 67
Belgium Alex Devroye +32 2 565 61 03Fiduciaries +32 2 565 72 60Institutionals & Banks +32 2 565 72 70
The Netherlands Ronald Riko +31 20 535 70 93Institutionals Luxembourg Dominique Chaumaz +352 42 10 47 00Johan van Megesen (Head) +32 2 565 96 22 Italy Francesco Scotto +39 02 57 53 24 64Belgium Alain Adam +32 2 565 76 50France Philippe Barroso +33 1 55 67 90 82 Mid-CapsLuxembourg André Wagner +352 42 10 49 07 Belgium Conrad Fieremans +32 2 565 19 77The Netherlands Nils Ten Berg +31 20 535 73 32 O/W Vlaanderen Gerrit Bauwens +32 2 565 78 57Spain (Domestic Sales) Manuel Torres +34 91 436 56 51 Sud Stéphane Christiaens +32 2 565 78 56Spain (International Sales) Luis Broto +34 91 436 56 52 Brussels/Public Filip Moens +32 2 565 70 40United Kingdom Nils Ten Berg +31 20 535 73 32 VL Brabant/Limburg Herwig Jaspers +32 2 565 73 10United States Francis Grevers +1 212 418 87 14 Antwerpen/Kempen Jef Van Camp +32 2 565 78 48
The Netherlands Bart Solleveld +31 20 535 71 84Luxembourg Thomas Kraemer +352 42 10 46 00
Germany Reinhold Beisler +49 22 11 61 12 25Austria Alfred Buder +43 181 10 43 81 58
Katherine Dior (Head) +32 2 565 63 08 Rest of Europe Geert Blancke +32 2 565 16 05Syndication Tom Thyssens (Head) +32 2 565 86 15 France Muriel Flasse +33 1 55 67 80 84Origination Corporate Olivier Tasnier (Head) +32 2 565 16 38 Spain Jose Bravo Galisteo +34 91 43 26 767Origination Financials Jacques Massin (Head) +32 2 565 62 37 Portugal Rui Lopes +35 12 13 13 93 03MTN Desk Jacques Massin (Head) +32 2 565 62 37 Italy Marco Toja +39 02 57 53 23 72Commercial Paper Marie-Jose Rodriguez (Head) Poland +48 225 66 99 04
+32 2 565 60 98 Hungary Attila Toth +36 14 83 81 09Czech Republic Tomas Blazejovsky +42 02 25 43 60 10Denmark Flemming Warhoi-Rasmussen
+45 32 71 19 09Sweden Mats Cardemo +46 732 02 08 59
Ludovic Plas (Head) +33 1 55 67 90 56 Greece Marinos Danalatos +30 210 9544 370Switzerland Patrick Schaerer +41 58 322 09 70
Interest Rate Derivatives +32 2 565 74 70 Turkey Bahar Bezmez +90 212 274 42 80Bernard Van Gils (Head) +32 2 565 87 61 United Kingdom Tim Kirkham +44 20 73 98 93 53
Forex Derivatives +32 2 565 76 30 Automated Trade and Service DeskJohann Barchéchath (Head) +32 2 565 12 27 Marc Vidts +32 2 565 71 10
ATS Desk +32 2 565 73 00Equity Derivatives +32 2 565 78 82 Service Desk +32 2 565 74 90Fabian de Prey (Head) +32 2 565 91 05 Netherlands Wim Verwaal +31 20 535 72 39
Credit Derivatives Structuring +32 2 565 77 20 Energy & Environmental MarketsFrédéric Monneret (Head) +33 1 55 67 90 58 Philippe Arickx (Head)
Energy Europe, Brussels +32 2 565 75 60Structured Product Services +352 42 42 49 65 Energy Europe, Amsterdam +31 20 535 73 67Emmanuel Grimée (Head) +352 42 42 49 25 Carbon Banking +31 20 535 72 02
Structured Products
Fixed Income/New Issues
Global Markets Sales Contacts
Investment Products Sales Sales Treasury Products
Equities Sales
Paul Gennart +32 2 565 60 45(Global Head Research & Strategy)
The Netherlands Marc Pauwels (Head) +31 20 527 13 55Guy Verberne (Head) +31 20 535 73 25Joost Beaumont +31 20 535 74 31 BeneluxPeter de Bruin +31 20 535 70 38 Michel Aupers (Head) +31 20 527 28 62Nick Kounis +31 20 535 71 06 Wim Lewi, CFA (Co-ordinator Belgium) +32 2 565 62 61Aline Schuiling +31 20 535 71 31 Felix Oberdorfer (Co-ordinator The Netherlands) +31 20 527 23 28
Paul Andriessen (Mid & Small Caps) +31 20 527 21 82Spain Maarten Bakker (Mid & Small Caps) +31 20 527 23 32Estefanía Ponte (Head) +34 91 436 55 37 Kenn Curt Daniël, Ph.D. (Biotech) +31 20 527 34 17Diego Fernández +34 91 436 55 00 Kurt De Baenst (Banks/Retail) +32 2 565 60 42
Justin De Meersman (Shipping) +32 2 565 12 45Mariska Douwens (Media) +31 20 527 23 23Mark Gevens (Industrials) +32 2 565 60 71
Françoise Bernard (Head) +32 2 565 83 02 Tim Heirwegh (Mid & Small Caps) +32 2 565 87 60Frédéric Atlan (Fixed Income) +33 1 55 67 72 81/+32 2 565 86 06 Bart Jooris, CFA (Telecom/Mid & Small Caps) +32 2 565 60 99Arnaud Bornet (Forex & Money Markets Quant) +32 2 565 63 27 Klaas Kruijer (Banks) +31 20 527 91 44Alexandre Dieudonné (Forex & Money Markets) +32 2 565 69 67 Geraldine O'Keeffe (Biotech) +31 20 527 91 50Philippe Gijsels (Equities) +32 2 565 16 37 Sebastiaan Schreijen (IT Software & Services) +31 20 527 22 30Sébastien Gilis (Fixed Income) +32 2 228 69 47 Teun Teeuwisse (Temporary Employment) +31 20 527 13 01Nancy Verret (Forex & Money Markets) +32 2 565 55 63 David Vagman (Holdings) +32 2 565 67 25Filiep Wyseur (Fixed Income) +32 2 565 82 31 René Verhoef (Mid & Small Caps) +31 20 527 91 45
Robert Jan Vos (Food Producers/Food Retail) +31 20 527 91 47
FranceFrançoise Bernard (Head) +32 2 565 83 02 Philippe Ezeghian (Head) +33 1 55 67 72 29Karel De Bie (Fixed Income/Forex/Commodities) +32 2 565 85 46 Séverine Blé (Food) +33 1 55 67 72 41
François Deliot (IT Services) +33 1 55 67 72 46Claire Deray (Transport/Consumer Goods/Retail) +33 1 55 67 72 43Marc Huberty (Industrials) +33 1 55 67 72 30
Peter Cauwels, Ph.D. (Head) +32 2 565 47 90 Bertrand Laport (IT Hardware) +33 1 55 67 72 31Philippe Brimmel +32 2 565 40 29 Olivier Macquet (Industrials & Services) +33 1 55 67 72 42Alain Cram +32 2 565 60 52 Olivier Moral (Media) +33 1 55 67 72 32Vincent Guffens, Ph.D. +32 2 565 90 91 Gilles Raffort (Leisure & Services) +33 1 55 67 72 45Pieter Pels, Ph.D. +32 2 228 78 20Dries Stragier +32 2 565 60 86 SpainHerman van der Sluis +31 20 535 72 98 Antonio López (Head/Utilities) +34 91 436 56 50Amjed Younis +32 2 565 31 00 Diego Barrón (Banks/Insurance) +34 91 436 56 29
Fernando Cordero (Mid & Small Caps/Technology/Media) +34 91 436 56 16Luis Padrón (Telecom/Media) +34 91 436 56 07Rafael Rico, CFA (Oil/Basic Materials/Mid & Small Caps) +34 91 436 56 84
Peter Cauwels, Ph.D. (Head) +32 2 565 47 90 Emilio Rotondo (Construction/Real Estate) +34 91 436 56 12Gerda Cabus +32 2 565 85 91 Francisco Ruiz (Mid & Small Caps/Retail) +34 91 436 56 76Yves Clarenne +32 2 565 35 60 Manuel Zayas (Mid & Small Caps) +34 91 436 55 41
USDavid Garrett (Biotech) +1 212 340 54 94
Credit Bonds Gregory Lewis, CFA (Oil Services & Shipping) +1 212 340 54 95Hélène Séré (Head/Utilities & Energy) +33 1 55 67 72 83/+32 2 565 75 87 Patrick Moriarty, Ph.D. (Biotech) +1 212 340 54 97Benoit Feliho (Banks) +33 1 55 67 72 95 Biju Perincheril (Energy) +1 212 340 54 76Christine Passieux (Banks) +33 1 55 67 72 87Karine Petitjean (Consumer Non-Cyclical) +33 1 55 67 72 88Bertrand Rocher (Automotive) +33 1 55 67 72 84Olga Zubkova (Building & Basics/Utilities & Energy) +33 1 55 67 72 80 Koen Van de Steene (Head/Healthcare) +32 2 565 86 14
Christel Bosch (Energy/Industrials/Utilities) +32 2 565 82 34ABS/CDO Bart Ingels (Basic Materials/Consumer Non-Cyclicals) +32 2 565 44 07Helmut Van Ginderen (Head) +32 2 565 60 10 Geert Ruysschaert (Co-ordinator Top-Down/Telecom/Sabrina Marchal +32 2 565 86 82 Media) +32 2 565 19 58
Alain Servais (Editor) +32 2 228 92 30Tom Vermeiren (Technology/Consumer Cyclicals) +32 2 565 44 05Kristof Wauters (Fixed Income/Forex) +32 2 565 51 35
Economic, Fixed Income, Forex & Money Markets Research Equity Researchwww.merchantbanking.fortis.com/forpro www.merchantbanking.fortis.com/forproBloomberg: FMRS Bloomberg: FINV
Please send an e-mail to [email protected] to request login/password for Bloomberg and/or website
Retail Banking and Private Banking Research
Global Markets Research Contacts
Credit Research
Economic Research
Modelling
Rating Advisory Services
Strategy
Equity Research
Technical Analysis
Fortis Bank S.A./N.V. Montagne du Parc 3 B-1000 Brussels Belgium Tel: +32 2 565 11 11
Fortis Bank Nederland N.V. Rokin 55 (visiting address) P.O. Box 243 1000 AE Amsterdam The Netherlands Tel: +31 20 527 91 11
Fortis Banque Luxembourg 50, avenue J.F. Kennedy L-2951 Luxembourg Luxembourg Tel: +352 42 421
Fortis Bank, Succursale en France 30, quai de Dion Bouton F-92824 Puteaux Cedex France Tel: +33 1 55 67 72 00
Fortis Bank Germany Christophstrasse 33-37 50670 Cologne Germany Tel: +49 221 161 13 30
Fortis Bank Hong Kong 27/F, Fortis Bank Tower 77-79 Gloucester Road Hong Kong Tel: +852 28 23 04 56
Fortis Bank Italy Via Cornaggia 10 I-20123 Milano Italy Tel: +39 02 57 53 24 61
Fortis Bank Norway Haakon VII's gate 10 0161 Oslo Norway Tel: +47 23 11 49 50
Fortis Bank Polska S.A. P.O. Box 15 02-676 Warszawa Poland Tel: +48 22 566 90 00
Fortis Bank Portugal Rua Alexandre Herculano 50-6 Andar 1250-011 Lisboa Portugal Tel: +351 213 13 93 16
Fortis Bank Singapore 63 Market Street #21-01 Singapore 048942 Tel: +65 65 38 03 90
Fortis Bank S.A., Sucursal en España Serrano 73 28006 Madrid Spain Tel: +34 91 436 56 00
Fortis Bank Turkey Yildiz Posta Caddesi No: 54 Gayrettepe 34353 Istanbul Turkey Tel: +90 212 274 42 80
Fortis Bank UK Camomile Court 23 Camomile Street London EC3A 7PP United Kingdom Tel: +44 207 247 80 00
Fortis Bank USA 520 Madison Avenue, 3rd Floor New York, NY 10022 United States Tel: +1 212 418 87 00
Fortis Securities LLC 520 Madison Avenue, 3rd Floor New York, NY 10022 United States Tel: +1 212 418 87 14
Each research analyst primarily responsible for the content of this research report certifies that with respect to each security or issuer that the analyst covered in this report: 1) all of the expressed views accurately reflect his or her personal views about those securities or issuers, and 2) no part of his or her compensation was, is, or will be, directly or indirectly, related to the specific recommendation or views contained in this report. Fortis Securities LLC is an affiliate of Fortis Bank S.A./N.V. Fortis Securities LLC is a member of the NASD. This publication has been prepared by Fortis Bank S.A./N.V. or by an affiliated company for and on behalf of Fortis Bank S.A./N.V. (Montagne du Parc 3, 1000 Brussels, Belgium) and its affiliated companies (together �Fortis�) solely for the information of professional clients of Fortis. It is not intended as an offer or solicitation for the purchase of any financial instrument. The information herein has been obtained from, and any opinions herein are based upon, sources believed reliable, but Fortis makes no representation as to its accuracy or completeness and it should not be relied upon as such. All opinions and estimates herein reflect the judgement of Fortis on the date of this report and are subject to change without notice. Fortis and any of its officers or employees may, to the extent permitted by law, have a position or otherwise be interested (including purchasing from or selling to its clients on a principal basis) in any transactions, in any investments (including derivatives) directly or indirectly the subject of this publication. Fortis may perform investment banking or other services (including acting as adviser, manager or lender) for, or solicit investment banking or other business from, any company mentioned in this publication. Neither Fortis nor any officer or employee of Fortis accepts any liability whatsoever for any direct or consequential loss arising from any use of this publication or its contents. Copyright and database rights protection exist in this publication and it may not be reproduced, distributed or published by any person for any purpose without the prior express consent of Fortis. All rights reserved. Any investments referred to herein may involve significant risks and are not necessarily available in all jurisdictions, may be illiquid and may not be suitable for all investors. The value of, or income from, any securities referred to herein may fluctuate and/or be affected by changes in exchange rates. Past performance is not indicative of future results. Investors are expected to make their own investment decisions without relying on this publication. Only investors with sufficient knowledge and experience in financial and business matters to evaluate the relevant merits and risks should consider an investment in any issuer or market discussed herein. The information contained in this publication is not available to a person who would be categorised as a private customer under the rules of the FSA. To the extent that any securities, or any broker-dealer, investment adviser or other services, are deemed to be offered herein for purposes of U.S. law, such securities or services are not being offered in the United States or to U.S. persons absent an exemption under applicable U.S. law. This report is not intended for distribution to, or use by, U.S. persons absent such an exemption. Any U.S. institution receiving this report pursuant to an exemption under applicable U.S. law that wishes to effect a transaction in any securities discussed herein must contact our U.S. affiliate, Fortis Securities LLC to execute such transaction. All such transactions must be booked and confirmed by Fortis Securities LLC.
Fortis
Fortis is an international financial services provider engaged in
banking and insurance. We offer our personal, business and
institutional customers a comprehensive package of products
and services through our own channels, in collaboration with
intermediaries and through other distribution partners.
Building on our leading position in the Benelux countries, we
offer an integrated network to internationally operating
companies throughout Europe and provide wealthy private
clients and business people with advanced services based on
a unique set of competencies. Our expertise in niche markets
such as shipping, commodity, export and project finance, and
fund administration has made us a regional or world leader in
those areas. We also successfully combine our banking and
insurance expertise in growth markets in Europe and Asia and
lead the bancassurance markets in Spain and Portugal.
With a market capitalisation of EUR 42 billion (30/09/2006),
Fortis ranks among the twenty largest financial institutions in
Europe. Our sound solvency position, our presence in 50
countries and our dedicated, professional workforce of 58,000
enable us to combine global strength with local flexibility and
provide our clients with optimum support.
Fortis
Merchant Banking
Montagne du Parc
Warandeberg 3
B-1000 Brussels
Belgium
www.merchantbanking.fortis.com