four season impact study of raob, poes, & goes … · in the eta data assimilation system by...
TRANSCRIPT
Four Season Impact Study of RAOB, POES, & GOES Data In the Eta Data Assimilation System
by
Tom H. Zapotocny 1
W. Paul Menzel 1,2
James A. Jung 1James P. Nelson III 1
1 Cooperative Institute for Meteorological Satellite Studies2 National Environmental Satellite, Data, and Information Service
Four Season Impact Study of RAOB, POES, & GOES Data In the Eta Data Assimilation System
OSE DescriptionSensitivity
Four season summarySeasonal impact changes
24 hr vs 48 hr forecast impactComparison of fcst impact at 00 vs 12 UTC
Summary

Four time periods were studied:24 Oct-08 Nov 2001, 15-31 Jan 2002, 12-27 Apr 2002, and 23 Jun-08 Jul 2002
EDAS was run at 32 km horizontal resolution and 60 levels vertically.
The data type being denied was unavailable to 3DVAR for the entire 15-day time period.(Control + 12 exp per season = 1560 total runs)
Diagnostics:Time-averaged distributions (00-hrs and 24-hrs)Geographical distributions (00-hrs and 24-hrs)Vertical distributions (24-hrs)
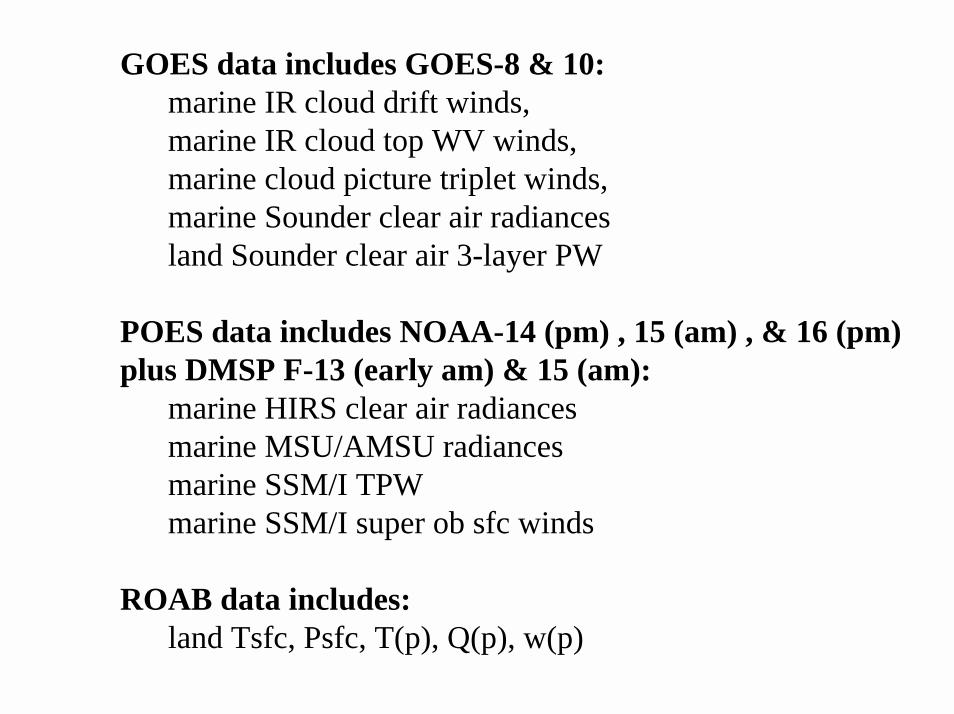
GOES data includes GOES-8 & 10:marine IR cloud drift winds, marine IR cloud top WV winds, marine cloud picture triplet winds, marine Sounder clear air radiancesland Sounder clear air 3-layer PW
POES data includes NOAA-14 (pm) , 15 (am) , & 16 (pm) plus DMSP F-13 (early am) & 15 (am):
marine HIRS clear air radiancesmarine MSU/AMSU radiancesmarine SSM/I TPWmarine SSM/I super ob sfc winds
ROAB data includes:land Tsfc, Psfc, T(p), Q(p), w(p)

where N is the total number of grid points in the evaluation, D is the denied run, C is the control run, and A is the validating analysis. Positive impact means the forecast was better with theparticular data included.
N
)AC(
N
)AD( pactIm Forecast
2ii
N
1i
2ii
N
1i−Σ
−−Σ
= ==
Evaluation criteria
N
)AC(
2ii
N
1i−Σ
− =
N
)CD(
2ii
N
1i−Σ
= = Sensitivity

Four Season Impact Study of RAOB, POES, & GOES Data In the Eta Data Assimilation System
OSE DescriptionSensitivity
Four season summarySeasonal impact changes
24 hr vs 48 hr forecast impactComparison of fcst impact at 00 vs 12 UTC
Summary
→

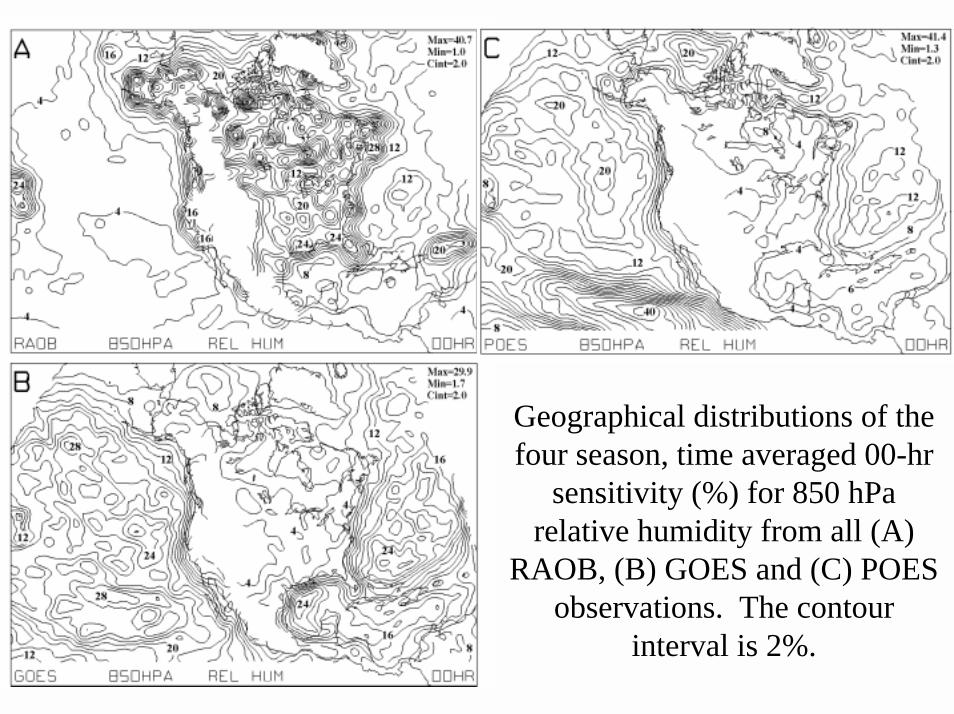
Geographical distributions of the four season, time averaged 00-hr
sensitivity (%) for 850 hParelative humidity from all (A)
RAOB, (B) GOES and (C) POES observations. The contour
interval is 2%.

00-HR Sensitivity (Four Season Summary)

Entire Domain
CONUS
00-HR Sensitivity (Four Season Summary)
=======================================================================================================================================

TEMP RH U-COMP
Baja(in POES max)
Gulf of Mexico
(in GOES max)
LakeWinnipeg
(in RAOB max)
Vertical profiles of 00-hr sensitivity from RAOB (thin solid), GOES (thick solid), and POES (dashed) denials.

Four Season Impact Study of RAOB, POES, & GOES Data In the Eta Data Assimilation System
OSE DescriptionSensitivity
Four season summarySeasonal impact changes
24 hr vs 48 hr forecast impactComparison of fcst impact at 00 vs 12 UTC
Summary
→
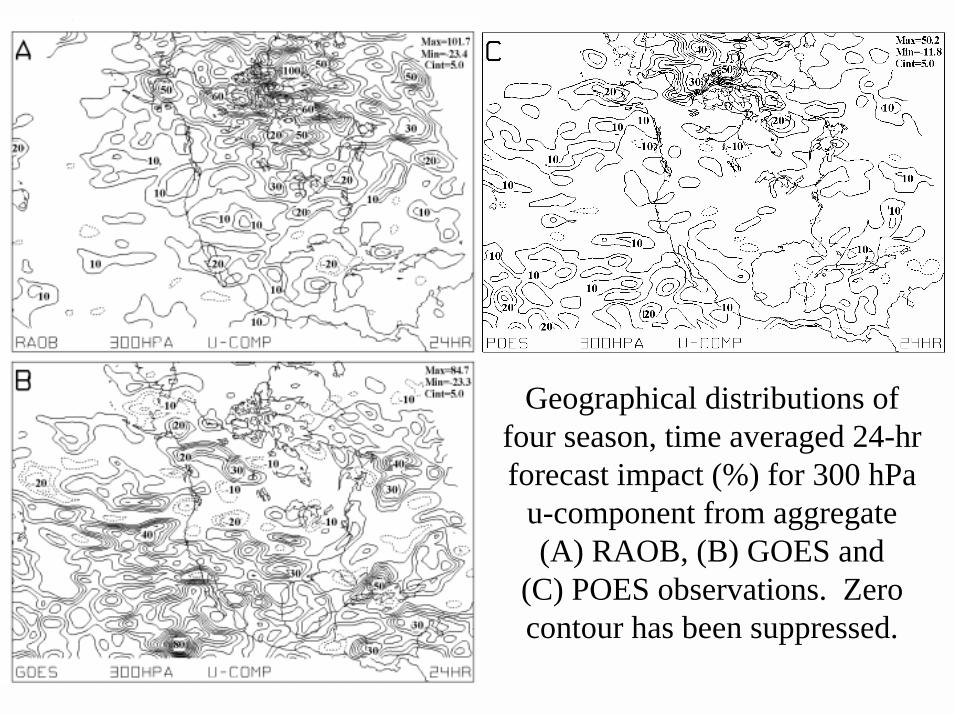
Geographical distributions of four season, time averaged 24-hr forecast impact (%) for 300 hPa
u-component from aggregate (A) RAOB, (B) GOES and
(C) POES observations. Zero contour has been suppressed.

RAOBMASS
RAOB WIND
Geographical distributions of four season time averaged 24-hr forecast impact (%) for 300 hPa u-comp from (A) RAOB mass and
(B) RAOB wind observations
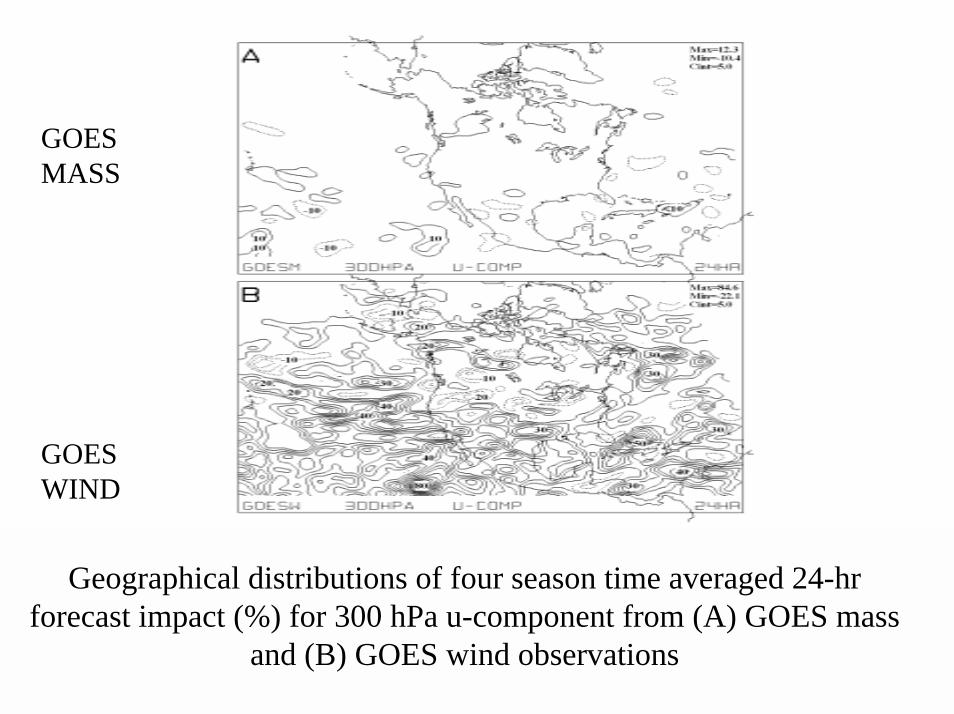
GOESMASS
GOESWIND
Geographical distributions of four season time averaged 24-hr forecast impact (%) for 300 hPa u-component from (A) GOES mass
and (B) GOES wind observations

HIRS
AMSU(A & B)
Geographical distributions of four season time averaged 24-hr forecast impact (%) for 300 hPa u-component from (A) HIRS and (B) AMSU
observations

4 Season average forecast impact (%) for T, u, v, RH fields after 24-hrs of Eta model integration
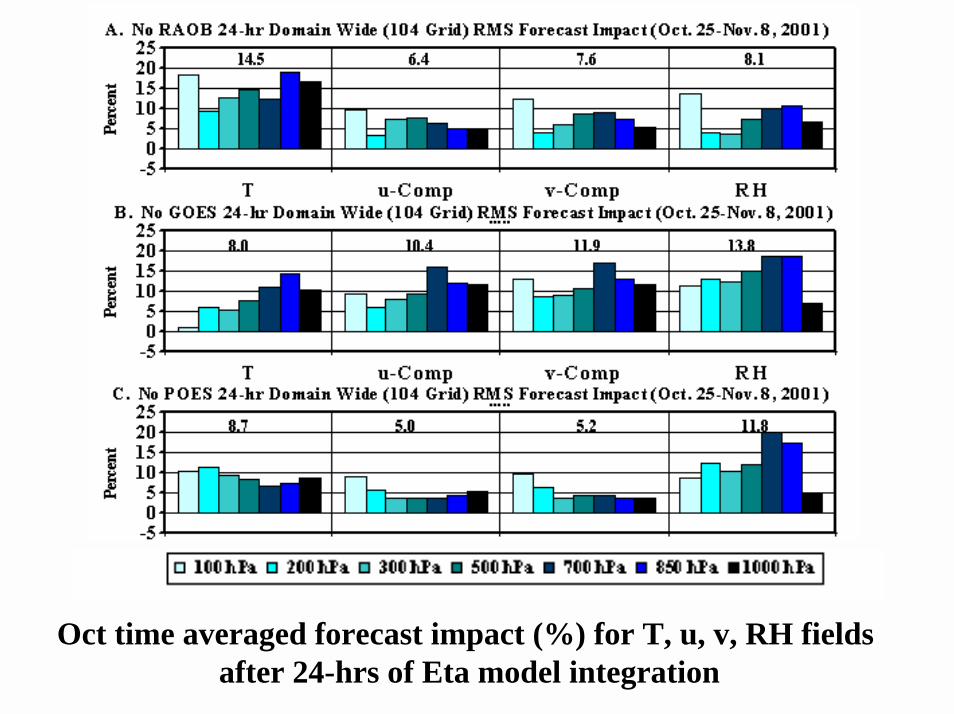
Oct time averaged forecast impact (%) for T, u, v, RH fields after 24-hrs of Eta model integration

Oct time averaged fcst impact (%) over CONUS for T, u, v, RH fields after 24-hrs of Eta model integration

Four Season Impact Study of RAOB, POES, & GOES Data In the Eta Data Assimilation System
OSE DescriptionSensitivity
Four season summarySeasonal impact changes
24 hr vs 48 hr forecast impactComparison of fcst impact at 00 vs 12 UTC
Summary
→

Jan time averaged forecast impact (%) for T, u, v, RH fields after 24-hrs of Eta model integration
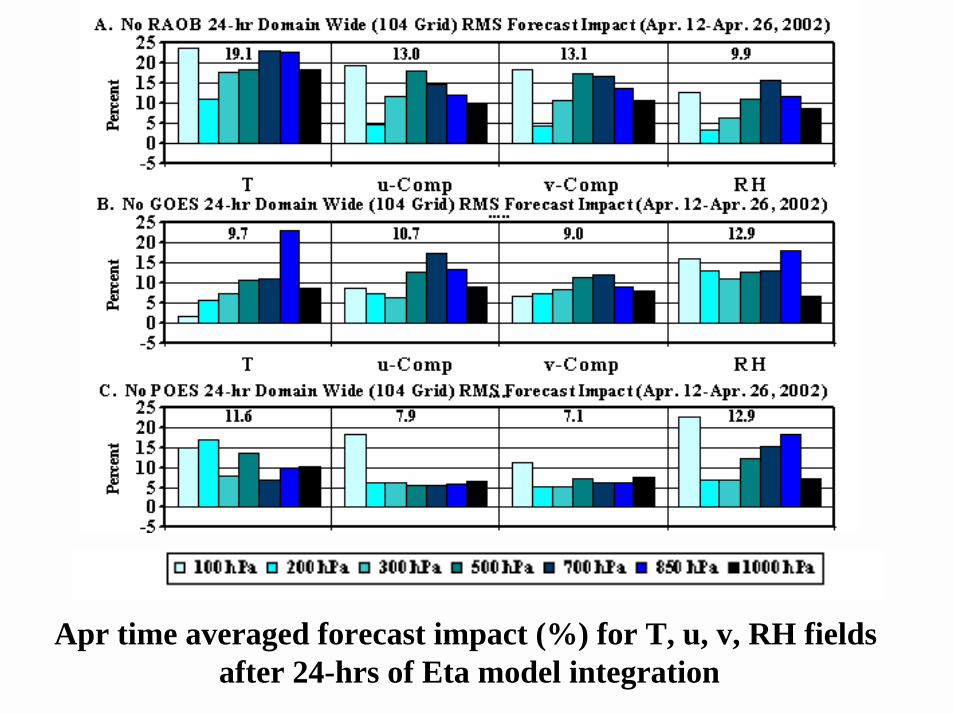
Apr time averaged forecast impact (%) for T, u, v, RH fields after 24-hrs of Eta model integration

Jun time averaged forecast impact (%) for T, u, v, RH fields after 24-hrs of Eta model integration

Oct time averaged forecast impact (%) for T, u, v, RH fields after 24-hrs of Eta model integration

Four Season Impact Study of RAOB, POES, & GOES Data In the Eta Data Assimilation System
OSE DescriptionSensitivity
Four season summarySeasonal impact changes
24 hr vs 48 hr forecast impactComparison of fcst impact at 00 vs 12 UTC
Summary
→

Oct time averaged forecast impact (%) for T, u, v, RH fields after 48-hrs of Eta model integration

Oct time averaged forecast impact (%) for T, u, v, RH fields after 24-hrs of Eta model integration

Four Season Impact Study of RAOB, POES, & GOES Data In the Eta Data Assimilation System
OSE DescriptionSensitivity
Four season summarySeasonal impact changes
24 hr vs 48 hr forecast impactComparison of fcst impact at 00 vs 12 UTC
Summary→
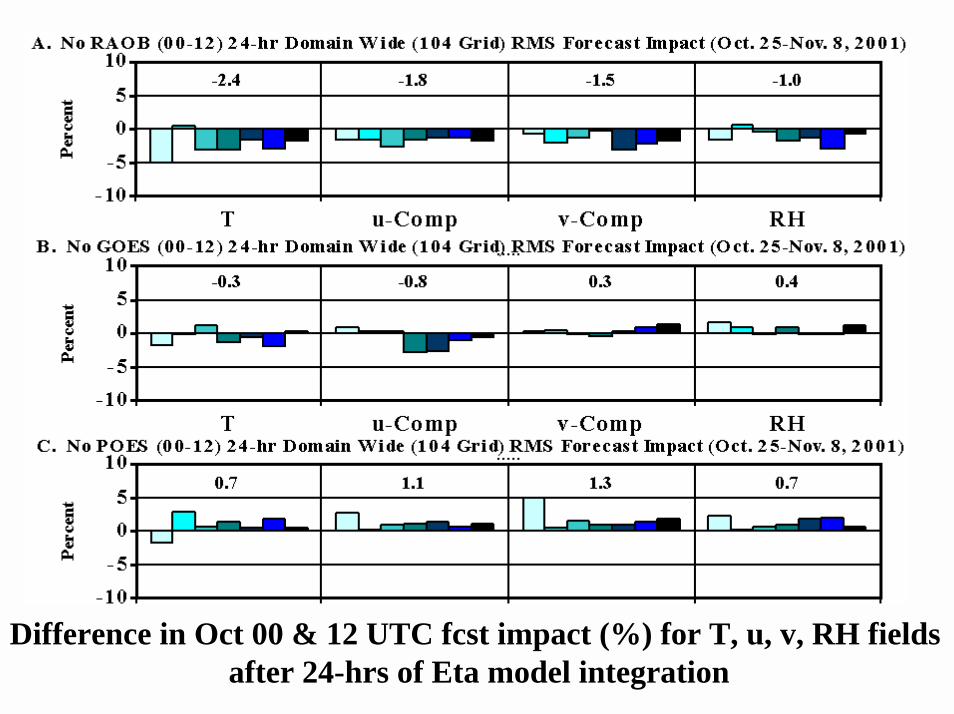
Difference in Oct 00 & 12 UTC fcst impact (%) for T, u, v, RH fields after 24-hrs of Eta model integration

Difference in Apr 00 & 12 UTC fcst impact (%) for T, u, v, RH fields after 24-hrs of Eta model integration

Four Season Impact Study of RAOB, POES, & GOES Data In the Eta Data Assimilation System
OSE DescriptionSensitivity
Four season summarySeasonal impact changes
24 hr vs 48 hr forecast impactComparison of fcst impact at 00 vs 12 UTC
Summary→

Scatter distributions of 100 hPa temp (A-C) and 850 hPa RH (D-F) from a 24-hr forecast starting 1200 UTC 7 November
2001. RAOB denials are in (A) and (D), GOES denials are in (B) and
(E), POES denials are in (C) and (F). Difference of control and analysis is
on x-axis, while the difference denied and analysis is on y-axis.
T(100 hPa) RH(850 hPa)
RAOB
GOES
POES

24-hr Domain Wide (104 Grid) RMS Mean SLP Forecast Impact (Four Season Summary)
1.81
6.38
3.68 3.91 3.92
0.23
-0.32
0.7
7.22
0.66
-0.32
2.04
-2
0
2
4
6
8
10
RA
OB
RA
OBM
RA
OBW
GO
ES
GO
ESM
GO
ESW
POES
HIR
S
AM
SU
MSU
SSM
/IW
SSM
/IPW
Perc
ent
24-hr Extended CONUS (212 Grid) RMS Mean SLP Forecast Impact (Four Season Summary)
2.18
5.92
3.95
0.27 -0.03 0.38
4.795.32
8.67
0.21
-0.05
2.88
-2
0
2
4
6
8
10
RA
OB
RA
OBM
RA
OBW
GO
ES
GO
ESM
GO
ESW
POES
HIR
S
AM
SU
MSU
SSM
/IW
SSM
/IPW
Perc
ent
24-HR SLP FCST IMPACT ENTIRE DOMAIN
24-HR SLP FCST IMPACT EXTENDED CONUS

A. 24-hr Domain Wide RMS Temperature Forecast Impact (Four Season Summary)
-5
05
10
1520
25
RAO B RAO BM RAO BW GO ES GO ESM GO ESW PO ES HIRS AMSU MSU SSM/IW SSM/IPW
Type
Perc
ent
B. 24-hr Domain Wide RMS u-Component Forecast Impact (Four Season Summary)
-5
0
5
10
15
20
25
RAO B RAO BM RAO BW GO ES GO ESM GO ESW PO ES HIRS AMSU MSU SSM/IW SSM/IPW
Type
Perc
ent
C. 24-hr Domain Wide RMS Rel. Hum. Forecast Impact (Four Season Summary)
-50
510
1520
25
RAO B RAO BW GO ESM PO ES AMSU SSM/IW
Type
Perc
ent
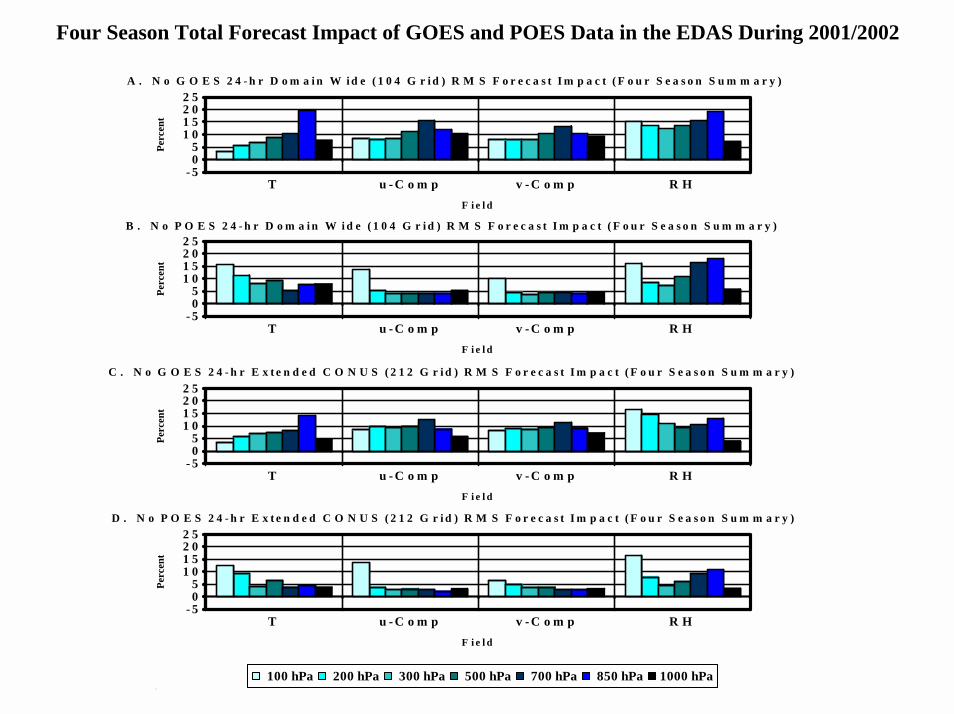
100 200 300 500 700 850 1000
TEMP
U-COMP
R. H.
T
- 505
1 01 52 02 5
Perc
ent
T u - C o m p v - C o m p R HF i e l d
A . N o G O E S 2 4 - h r D o m a i n W i d e ( 1 0 4 G r i d ) R M S F o r e c a s t I m p a c t ( F o u r S e a s o n S u m m a r y )
- 505
1 01 52 02 5
Perc
ent
T u - C o m p v - C o m p R HF i e l d
B . N o P O E S 2 4 - h r D o m a i n W i d e ( 1 0 4 G r i d ) R M S F o r e c a s t I m p a c t ( F o u r S e a s o n S u m m a r y )
- 505
1 01 52 02 5
Perc
ent
T u - C o m p v - C o m p R HF i e l d
C . N o G O E S 2 4 - h r E x t e n d e d C O N U S ( 2 1 2 G r i d ) R M S F o r e c a s t I m p a c t ( F o u r S e a s o n S u m m a r y )
- 505
1 01 52 02 5
Perc
ent
T u - C o m p v - C o m p R HF i e l d
D . N o P O E S 2 4 - h r E x t e n d e d C O N U S ( 2 1 2 G r i d ) R M S F o r e c a s t I m p a c t ( F o u r S e a s o n S u m m a r y )
Four Season Total Forecast Impact of GOES and POES Data in the EDAS During 2001/2002
00.51
100 hPa 200 hPa 300 hPa 500 hPa 700 hPa 850 hPa 1000 hPa

CONCLUSIONS
!All data types provide some positive forecast impact in the four season summary and each individual season.
!Largest forecast impact is seen at 100 hPa. It is especially noticeable from RAOB and POES observations.
!GOES and POES impact is as large as RAOB to RH in four season summary.
!GOES and RAOB provide nearly equal impact to wind, with POES being somewhat less.
!RAOB and GOES wind observations are more important than mass observations.
Geographical distributions of the four season, time averaged 00-hr
sensitivity (%) for 850 hParelative humidity from all (A)
RAOB, (B) GOES and (C) POES observations. The contour
interval is 2%.

Geographical distributions of the four season, time
averaged 00-hr sensitivity (%) for 850 hPa relative
humidity from RAOB (A) mass and (B) wind
observations. The contour interval is 2%.

Geographical distributions of the four season, time
averaged 00-hr sensitivity (%) for 850 hPa relative
humidity from (A) GOES mass and (B) GOES wind observations. The contour
interval is 2%.

Geographical distributions of the four season, time averaged 00-hr
sensitivity (%) for 850 hParelative humidity from (A) HIRS,
(B) AMSU and (C) MSU observations. The contour
interval is 2%.
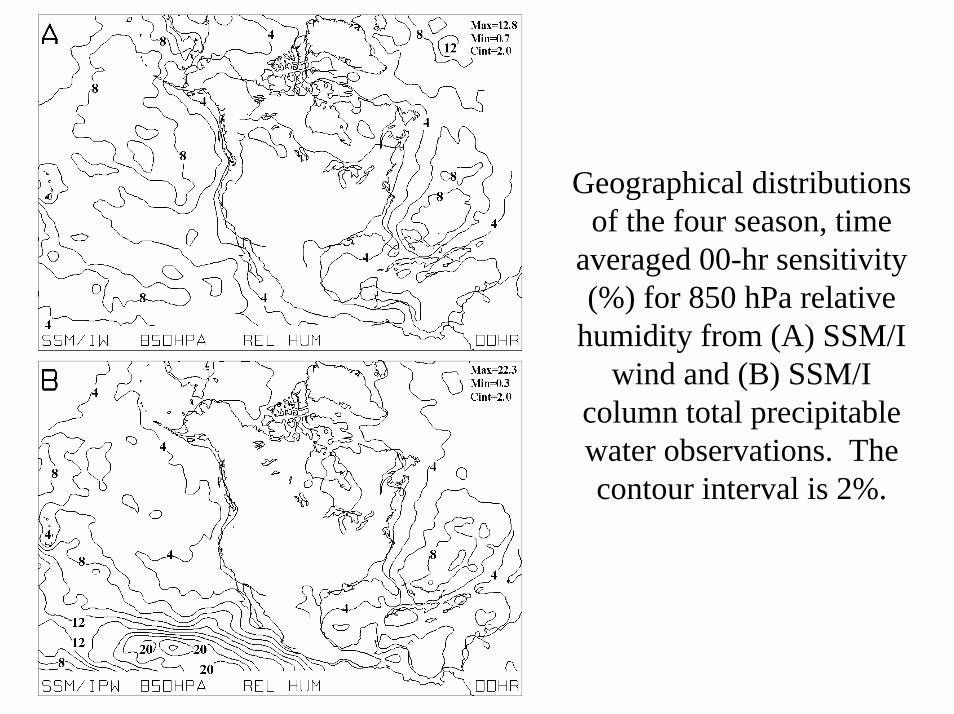
Geographical distributions of the four season, time
averaged 00-hr sensitivity (%) for 850 hPa relative
humidity from (A) SSM/I wind and (B) SSM/I
column total precipitablewater observations. The contour interval is 2%.

Profiles of 00-hr sensitivity from the aggregate RAOB
(thin solid), GOES (thick solid) and POES (dashed)
denials. Temp (K) in (A, D and G), RH (%) in (B, E and H) and u-comp (m/s) in (C, F and I). Top is near, middle in the
Gulf of Mexico, and bottom in the Baja
Peninsula.

Geographical distributions of four season, time averaged 24-hr forecast impact (%) for 300 hPa
u-component from aggregate (A) RAOB, (B) GOES and
(C) POES observations. Zero contour has been suppressed.

Geographical distributions of the four season, time
averaged 24-hr forecast impact (%) for 300 hPa u-
component from (A) RAOB mass and (B) RAOB wind
observations. The zero contour has been suppressed.
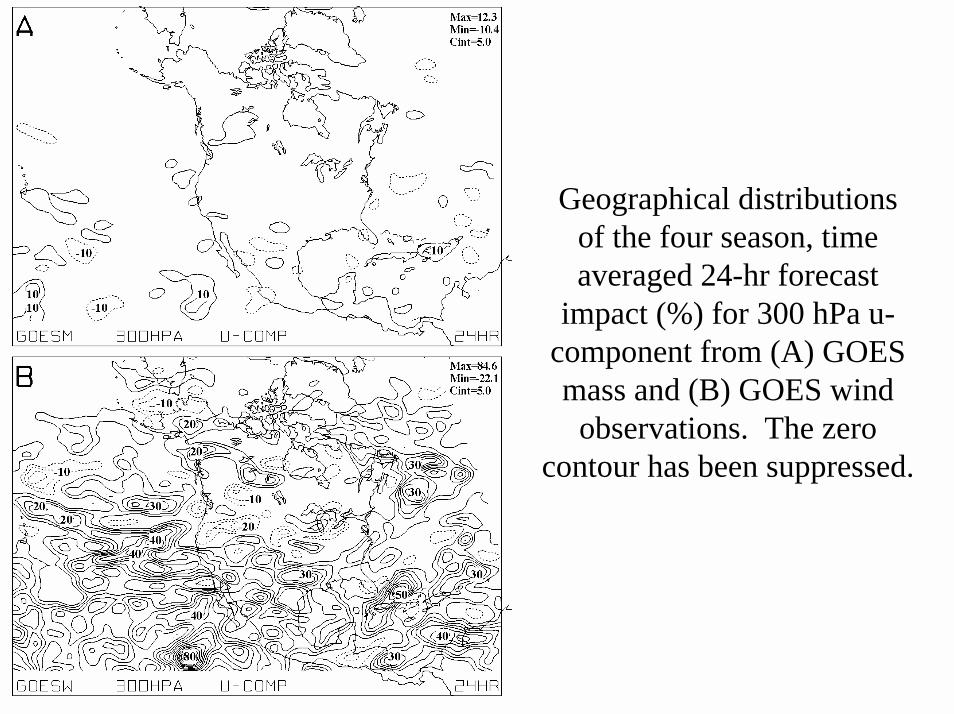
Geographical distributions of the four season, time averaged 24-hr forecast
impact (%) for 300 hPa u-component from (A) GOES mass and (B) GOES wind
observations. The zero contour has been suppressed.
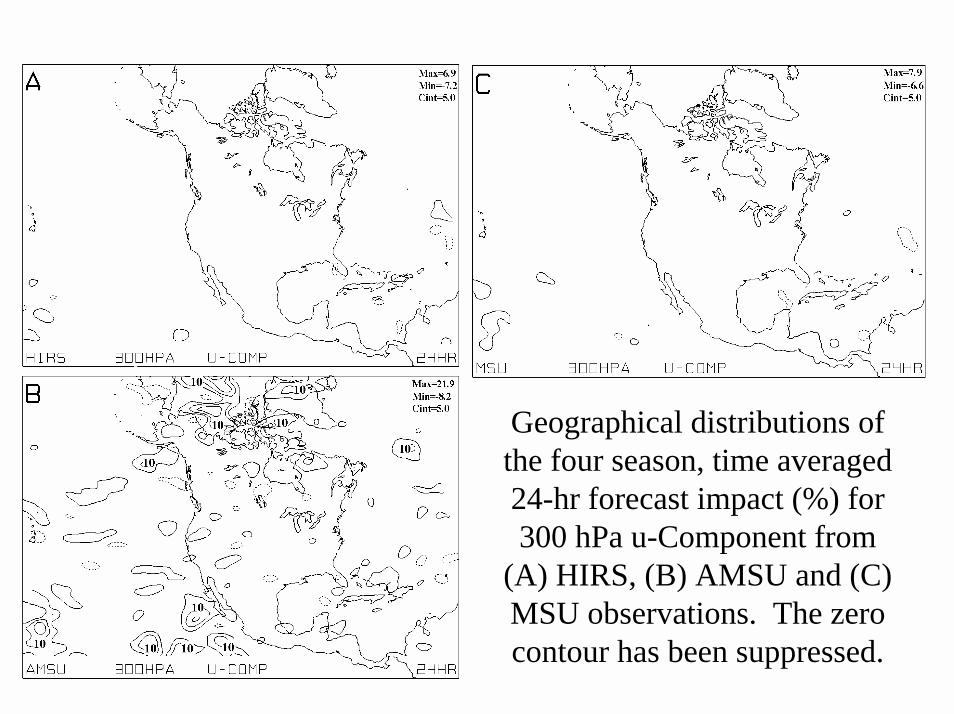
Geographical distributions of the four season, time averaged 24-hr forecast impact (%) for 300 hPa u-Component from
(A) HIRS, (B) AMSU and (C) MSU observations. The zero contour has been suppressed.

Geographical distributions of the four season, time averaged 24-hr forecast impact (%) for 300 hPa u-component from
(A) SSM/I wind and (B) SSM/I total columnprecipitable water
observations. The zero contour has been suppressed.