fourth paradigm
TRANSCRIPT

SHREE GANESH VANDANA

CHUKLAM BARATHARAM VISHNUM

SHASHI VARNAM CHATURBHUJAM

PRASANNA VADANAM DHYAYET

SARVA VIGHNOPA SHANTAYE

AGAJANANA PADMARGAM GAJANANA

MAHIRSHAM ANEKA DANTAM BHAKTANAM

EKA DANTAM UPASMAHE

Do We need to rejuvenate our self in Statistics to herald the 21st Century research?
Dr. N.B. VenkateswarluVisiting Fellow, School of Computer Studies, Univ. of Leeds, UK,1992-1995ISTE Visiting Fellow, 2010-11Former Faculty Member of BITS, PilaniCurrently at: AITAM, [email protected]/nbv

Fourth Paradigm
Dr. N.B. VenkateswarluVisiting Fellow, School of Computer Studies, Univ. of Leeds, UK,1992-1995ISTE Visiting Fellow, 2010-11Former Faculty Member of BITS, PilaniCurrently at: AITAM, [email protected]/nbv

My itinerary:• Some of my observations on Indian
Research.• Simple recap of USA identified
Grand Challenges of 21st Century.• Predictions for 21st Century.• 16 Massive Scientific Facilities at the
Cutting Edge of Research.• IOT (Internet of Things), a new
dimension for scientific research.• Dawn of Data Science research.• Essential Statistics to prepare us for
21st century.

May be, my talk is both critique and progressive.• విమర్శ కులు (Critique)• వికటకవి( తెనాలిరామలి0 గము వలెనే)
In politics, even if you loose, yet you can get cabinet post!! May be, Sonia example.

Let me first have a simple recap of my 29 years of frustration (of course enjoyed it ) as an Engineering Teacher/researcher. •సి0హావలోకన0

Success stories in 20th CenturyIn the century just ended, engineering recorded its grandest accomplishments. The widespread development and distribution of electricity and clean water, automobiles and airplanes, radio and television, spacecraft and lasers, antibiotics and medical imaging, and computers and the Internet are just some of the highlights from a century in which engineering revolutionized and improved virtually every aspect of human life.

My observations on Indian research in 20th Century. I am lucky as I belong to both 20th and 21st Century academics.May be 20 years back, Indian research was experimental. Because of the availability of Computers, majority of current research works are around computer simulation, modeling.

Indian Research with my eyes- observations are independent of engineering branch.
• Optimization• Fuzzy• Neural• Expert Systems• Data Mining• Evolutionary algorithms • Machine learning

I feel, again, research will be shifting towards experimental oriented because of the developments of Sensors, IOT.

My observations.• During my time, statistics is in
Inter. The same is moved to high school. Some how, it is not taught properly or left in choice.
• Now, it is covered under the course “Probability and Statistics” during Bachelors. Unfortunately, emphasis is not given to it. Practical flavor is not delivered.

My observations: Research Methodologies course• Research methodologies course is
supposed to be completed by every Ph.D student in majority of Universities, where we are exposed to statistics, analysis, experimentation, etc. Unfortunately, in India, it became a course on paper only.
My Thanks• Late. Dr. M. N. Reddy garu, my
friend at IIT, Kanpur. He has inculcated my interest in Statistics.

My observations: Passing knowledge downwards (knowledge infiltration] is not taking place in India. I mean, knowledge and research outcomes are introduced at higher degree, some contents to be pushed downwards.

My observations: Knowledge infiltration• See, in US, Engineering is started
now at School level itself.• I remember, in some news article,
that first duty of a commission on Nano-technology formed by Taiwan government is to identify 6 experiments to be taught at school level.

My observations: Knowledge infiltration


Leadership in innovation is essential for any country which depends on a wide array of factors, one of which is leadership in engineering research, education, and practice.

Open Innovation – recent mantra• Companies are no longer look just
within themselves for innovation, nor do they just purchase it by acquiring small companies. Today they obtain innovation wherever it is found—in other companies, in other countries, or even through arrangements with competitors. Working in this evolving context requires a nimble new kind of engineer and engineering organization.

Today, Word smart is too ubiquous!!• Smart devices• Smart phones• Smart cars• Smart houses• Smart offices• Smart cities• Smart countries• Smart world
Are you the ultimate Smart Person?

In the recent past, Scientific research is becoming moredata-driven. Developments in Sensors (MEMS, Nano-sensors), IOT are adding add-on flavor for it. In fact, I shall be pointing more about this in the coming slides. This is the objective of my talk.

USA has Identified Fourteen Grand challenges for next century. They are:
● Make Solar Energy Economical● Provide Energy from Fusion● Develop Carbon Sequestration Methods● Manage the Nitrogen Cycle● Provide Access to Clean Water● Secure Cyberspace● Engineer Better Medicines● Advance Health Informatics● Prevent Nuclear Terror● Restore and Improve Urban Infrastructure● Reverse Engineer the Brain● Enhance Virtual Reality● Advance Personalized Learning● Engineer the Tools of Scientific Discovery
Solar Energy: Storing is great challenge• Better battery technology• One intelligent attempt in USA,
during day time using solar energy pump the water to a reservoir at height and when needed run turbines and generate power!!!
• To mimic the biological capture of sunshine by photosynthesis. Sunlight to electrolysis of water, resulting H2 to power fuel cells, electricity generating units.
Provide Energy from fusion: To mimic Sun• Main problem is controlling fusion

Artificial Sun in China. Sun’s temperature is 15million degrees. China achieved 50 million degrees and aspiring for 100 million degrees.

Solar Energy – Artificial Sun through fusion!!!

A reactor that is used in the creation of an artificial: ITER-US, EU, Japan, Russia, China, south Korea, and India.

I don’t deny our achievement as a whole.

This one can go into active volcanoes and even into Sun!!

CO2 Challenge

Problems• CO2 sequestration (storing)• How do you capture CO2?• How do you store?-Old oil fields?• Inside earth by closing fissures,
faults and monitoring them continuously?
• In Ocean?


Managing Nitrogen cycle.• Artificial pesticides are increasing
the availability of Nitrogen in atmosphere.
• Also planting legumes, including soya beans, alfalfa. In addition, burning of fuel.
• Greenhouse effect, damaging ozone layer, increasing earth temperature. Also, respiratory illness, cancer, cardiac disease.

Managing nitrogen cycle• Denitrification• Recycling food waste• Monitoring regularly farm areas• Monitoring industrial leaks
continuously.

Personalized MedicationOne goal of biomedical engineering today is fulfilling the promise of personalized medicine. Doctors have long recognized that individuals differ in their susceptibility to disease and their response to treatments, but medical technologies have generally been offered as “one size fits all.” Recent cataloging of the human genetic endowment, and deeper understanding of the body’s complement of proteins and their biochemical interactions, offer the prospect of identifying the specific factors that determine sickness and wellness in any individual. An important way of exploiting such information would be the development of methods that allow doctors to forecast the benefits and side effects of potential treatments or cures.


Health InformaticsThe acquisition, management, and use of information in health — can greatly enhance the quality and efficiency of medical care and the response to widespread public health emergencies. Health and biomedical informatics encompass issues from the personal to global, ranging from thorough medical records for individual patients to sharing data about disease outbreaks among governments and international health organizations. Maintaining a healthy population in the 21st century will require systems engineering approaches to redesign care practices and integrate local, regional, national, and global health informatics networks.
WIMSSuch devices are emerging from advances in microelectronic mechanical systems for health care delivery as wireless integrated micro systems, or WIMS. Tiny sensors containing wireless transmitter-receivers could provide constant monitoring of patients in hospitals or even at home. If standardized to be interoperable with electronic health records, WIMS could alert health professionals when a patient needs attention, or even trigger automatic release of drugs into the body when necessary. In effect, every hospital room could be turned into an ICU. Seamlessly integrating the input from such devices into a health informatics system raises the networking challenge to a new level.

Electronic Information Carried (EIC)

Health bands Sugar LevelsEEGECGBP

EMG(Electromyography)

EMG EMG is a sensor system concerned with measuring the electrical activity of your body about your skeletal muscles, i.e.. the ones you need for locomotion. Your motor neurons electrically stimulate muscle clusters - the more intense the signal, the more of these clusters are involved in the activity and, so, the harder you're getting your body to work.While endurance sport is more cardiovascular-based, anyone looking to build up their bodies in certain ways or get the most our of their time at the gym really needs to know that they're exercising the correct muscle groups as they do so. EMG heat maps and readings can offer that.Companies like Athos and Myontech have already created clothing with EMG sensors embedded to keep you training in the zone that's right for you. For Athos, it's all about the gym to give you live feedback on your muscle effort and your building/toning targets.

How to ready against biological, chemical attacks? – Artificial Nose!!!Providing data to feed an informatics system in preparation for bio and chemical terror involves engineering challenges in three main categories. One is surveillance and detection — monitoring the air, water, soil, and food for early signs of an attack. Next is rapid diagnosis, requiring a system that can analyze and identify the agent of harm as well as track its location and spread within the population. Finally come countermeasures, powered by nimble operations that can quickly develop and mass-produce antidotes, vaccines, or other treatments to keep the effects of an attack as small as possible and track how effective the countermeasures are.

Ready against pandemic?A major goal of pandemic preparedness is a good early warning system, relying on worldwide surveillance to detect the onset of a spreading infectious disease. Some such systems are now in place, monitoring data on hospital visits and orders for drugs or lab tests. Sudden increases in these events can signal the initial stages of an outbreak.

Ready against Pandemic.But certain events can mask trends in these statistics, requiring more sophisticated monitoring strategies. These can include tracking the volume of public Web site hits to explain acute symptoms and link them to geo-codes, such as zip codes. Having an integrated national information technology infrastructure would help greatly. Closures of schools or businesses and quarantines may actually reduce hospital use in some cases, and people may even deliberately stay away from hospitals for fear of getting infected. On the other hand, rumors of disease may send many healthy people to hospitals for preventive treatments. In either case the numbers being analyzed for pandemic trends could be skewed.

Ready against Pandemic.New approaches to analyzing the math can help — especially when the math describes the network of relationships among measures of health care use. In other words, monitoring not just individual streams of data, but relationships such as the ratio of one measurement to another, can provide a more sensitive measure of what’s going on. Those kinds of analyses can help make sure that a surge in health care use in a given city because of a temporary population influx (say, for the Olympics) is not mistaken for the beginning of an epidemic.

Ready against pandemic
Understanding the mathematics of networks to estimate the spread.
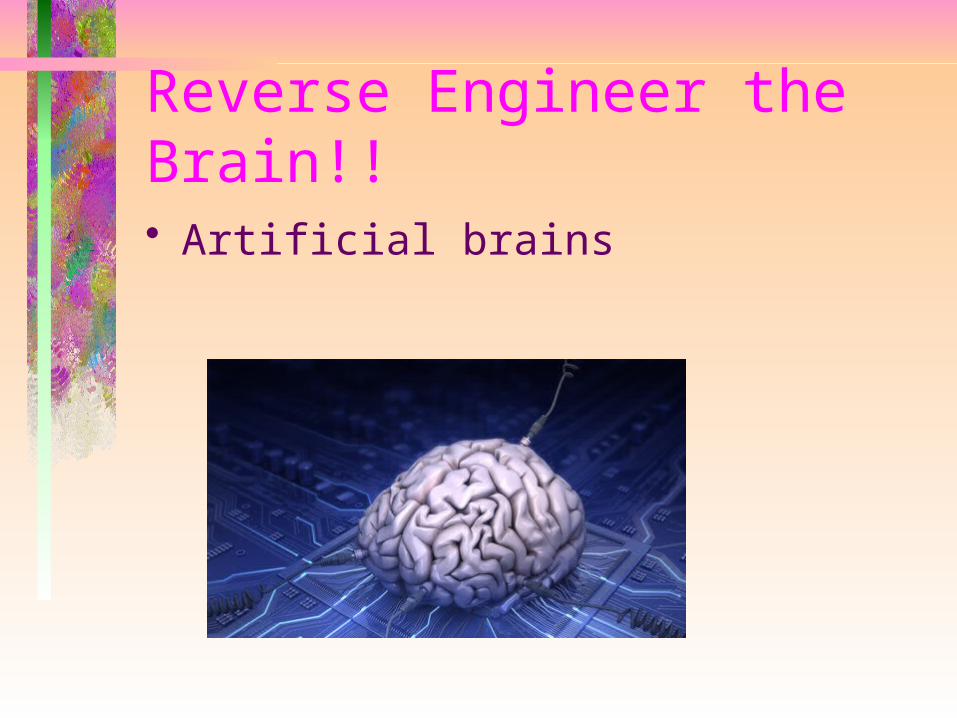
Reverse Engineer the Brain!!• Artificial brains
Reverse Engineer the brain• To understand brain disorders• To understand how drugs works• To understand neural implants
works• To understand more about how
brain works• To understand how learning takes
place

Cyber Security• Psychology of computer users can
be monitored

Mobiles that uses our Iris as login.

Virtual Reality• Correct certain phobias• Correcting social phobias such as
public speaking, • Treating post-traumatic stress
disorders• Research, education, training• Surgeons virtual operations

Virtual Reality: current challenges• Display technologies• Reproducing sensations of sound,
touch, and motion

Windowless War Vehicles Will Show the Outside World Via Virtual Reality

DARPA's Ground X-Vehicle• DARPA's Ground X-Vehicle
Technologies (GXV-T) program is an effort to combine new technologies to improve survivability, agility, and mobility for the next generation of military ground vehicles. GXV-T was first announced in 2014, but now Honeywell has signed on and is proposing a virtual reality instrument panel concept, which the company says could provide drivers with an enhanced 360-degree view outside the vehicle.

Challenge• As the operator moves his head around, he
sees the high resolution inset where his eyes would focus as they scanned around the cockpit,
• Even so, a camera is not a human eye, which raises a few interesting challenges. A man can naturally move his head but stay focused on same object using what's called the vestibular ocular reflex (the fastest human reflex). But replicating this virtually, using the near-to-eye inset, can cause nausea or motion sickness. Honeywell thinks it can compensate, but it will also have to reduce latency in the display, which must have very high refresh rate.

Engineer the tools

Next Century Robotics

మాయాజ0 గాలు (Robot Army]

MARS Curiosity 2012

Robots as colleagues instead of work tools
Ergonomic relief for the older staff member. Highly incriminating and physical tough jobs reducing new tasks and the need for qualifications (programming?)Robots as training partner? Or as gateway to inferior jobs
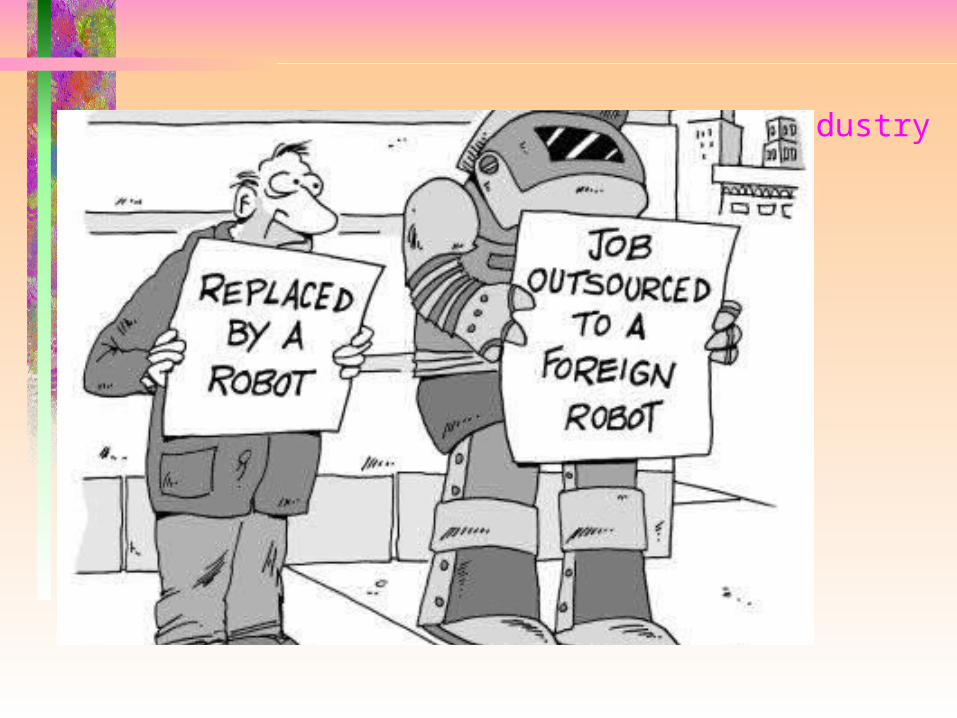
Transformation of the automotive industry
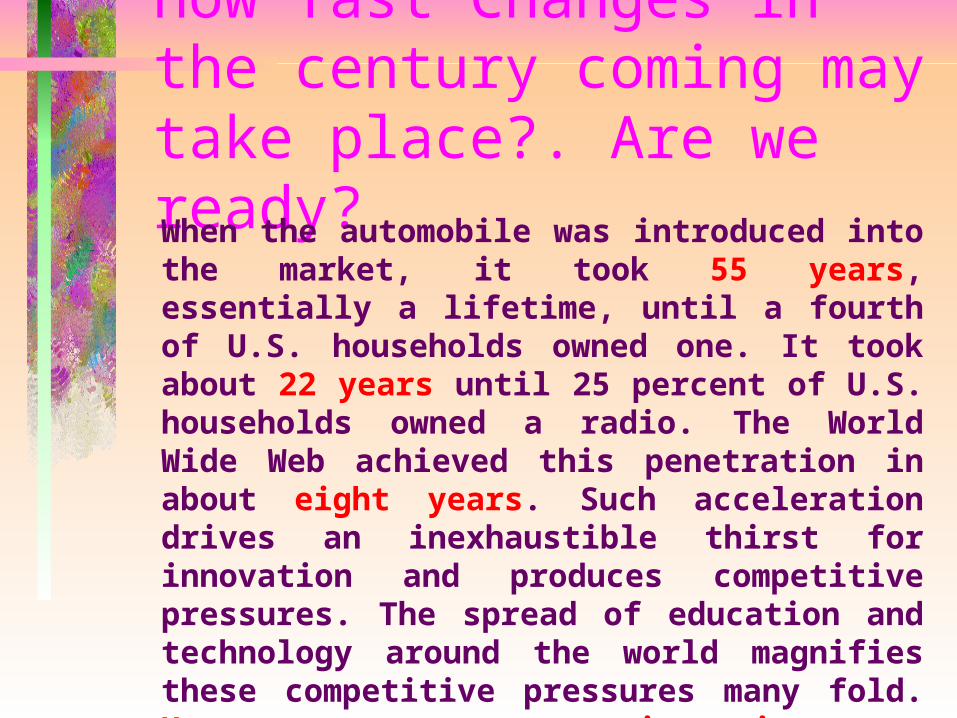
How fast Changes in the century coming may take place?. Are we ready?When the automobile was introduced into the market, it took 55 years, essentially a lifetime, until a fourth of U.S. households owned one. It took about 22 years until 25 percent of U.S. households owned a radio. The World Wide Web achieved this penetration in about eight years. Such acceleration drives an inexhaustible thirst for innovation and produces competitive pressures. The spread of education and technology around the world magnifies these competitive pressures many fold. However, next century inventions are going to take very less time to reach household.

Do you remember weather forecast of any day in ETV news? Accurate or vague? Why?
Small Joke on our self: Do take it in light manner.

UK Experience/Predictions• Since 1838• One rain gauge for one mile• So total data:• 180x242495x365x24x24• Higher order Bernoulli Equation
solver• Micro Climate monitoring – an
outcome of Sensor networks

Precision, resolution• Increasing the grid size• India – Famous for cooked up data. • No re-producability of experiments• How to write a paper? Some one
has to reproduce with the given information by you.

Quality Control: Usually after manufacturing the product.• A bolt example:• Is it suits to space craft?• Is it suits to aero plane?• Is it suits in BMW?• Is it suits to you a local car?• Does it fits to a motor bike?• Does it suits to a cycle?• If not, recycle it.

Let me share with you the predications of technological innovations in the coming years.

What we have achieved as of now?• We are able to transmit messages• We are able to exchange voices• We are able to exchange photos,
videos• We are able to transmit smell• We are able to sense smell around
us• Of course, we do need to achieve
teleportation• I understand some Israel Scientist
developed means to transfer our kiss!!!

Li-Fi

369TB Memory – 5D Technology- Then no Virtual Memory concept?

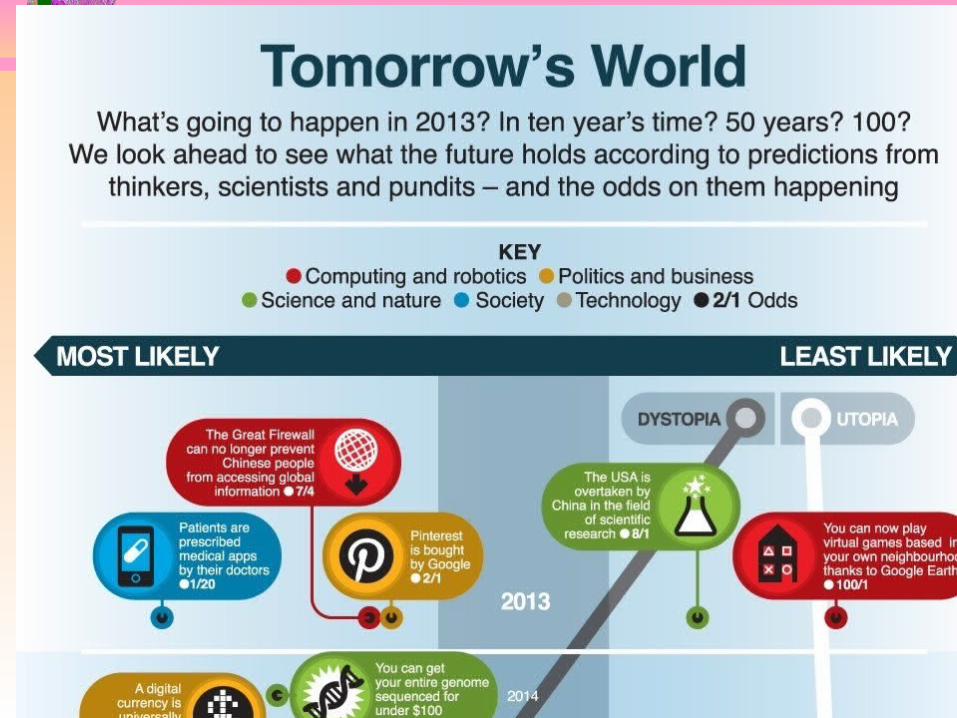
http://www.bbc.com/future/story/20130102-tomorrows-world• predictions.html
Cognitive Sciences• In 1990 Congress and President George
H. W. Bush proclaimed the beginning of the “Decade of the Brain,” intended “to enhance public awareness of the benefits to be derived from brain research.”
• Last year the Obama administration announced the Brain Research through Advancing Innovative Neuro technologies (BRAIN) Initiative, with a funding level of more than $100 million in 2014. It joins the Human Brain Project, a $1.6-billion, 10-year effort funded by the European Union.

https://www.washington.edu/alumni/columns/june98/technology.html

• In future, perhaps many of our appliances may be powered by the metabolism of our own bodies.
• It reminds me some telugu cinema, where Bakta vama deva makes his body as baking owen(stove) to prepare rotis.

• As a result of a new understandings of how our bodies work, the better nutrition and a complete mapping of the human genome, those that are born near the 22nd century can expect lifetimes of perhaps several hundred years.

• Preventive medicine will begin in the womb with gene therapy. We can expect organ replacement and repairing of fractured DNA to be commonplace.

• Sensors and computers will be implanted within our bodies and embedded within the very fabric of what we wear, in the walls of our home and in our places of business.

Money will not be needed• ... just our physical characteristics
act as a "fingerprint" to signal our identity with electronic processing of transactions that automatically adjusts our instantaneous net worth.

No need of physical prisons!!• Since we will be able to track the
identity of everybody with sensors within our environment, the nature of crime will change ... indeed, prisons as we know them will become obsolete as we will use new therapies to rehabilitate.

Do we need to move in future at all?• Synthesized 3-D spaces.• Our transportation systems will
become more efficient, and less polluting.
Transportation• 2075-2100: Faster-than-light travel is
developed. Scientists have selected fusion power and zero-point energy as the most probable technologies that could enable spaceships to break the light-speed barrier.
• For example, a 2070s hyper-drive vessel or 2080s warp-speed ship might reach Alpha Centauri (four light-years away) in just 30 days, or make the six-month trip to Mars in three hours. Officials at NASA’s Glenn Research Center have explored other options to travel faster than light-speeds and believe that, in a distant future, humans may even harness wormholes, enabling instant access to vast distances in space.

• At present, millions of medical devices are implanted in humans each year. These include pacemakers, blood vessel replacements, hip joints, eye lens implants, drainage tubes, heart valves and cochlear implants. The devices save lives and improve the quality of life. But they never work as well as the original part being replaced. Basically, the body views most of the materials we now use as "foreign objects" and simply walls them off. Thus, we get aberrant healing and poor mechanical and electrical communication between the implant and the body. The path to the future of medical implants demands that the body recognize these devices as "natural" and heal them in a facile manner.
• Envision prosthetic limbs that heal into the skin for a bacterial seal, the bone for mechanical support and the nerves for control. An artificial heart that functions about as well as a healthy natural heart would--extending hundreds of thousands of lives. A robust artificial pancreas could improve the quality of life for millions, as could an electronics-electrode array artificial eye for the vision impaired. Finally, can "dip-stick" diagnostic devices be built that offer early home detection of cancers and other life-threatening conditions? The potential now exists to engineer synthetic surfaces so that they control biological reactions with precision. Thus, we can imagine creating a new generation of biomaterials that might revolutionize health care and diagnostics.--UW Engineered Biomaterials Director Buddy D. Ratner

• By 2050, bold pioneers begin replacing their biology with non-biological muscles, bones, organs, and brains. Non-bio bodies automatically self-repair when damaged. In fatal accidents (or acts of violence), consciousness and memories can be transferred into a new body, and victims simply continue life in their new body. Death is now considered no more disruptive than a brief mental lapse. Most patients are not even aware they had died. Built labor-free with nanofactories, non-bio body parts are easily affordable.

Sorry Einstein: Biology Replaces Physics as Science's Top Dog • Physics, long the dominant determinant of thought and ideas in science, has been displaced by the biological sciences which display the extraordinary complexity that defies or belies many of the ideas promoted by physicists and chemists through which much of our ideas in the present century have been promoted. Hence I predict new modalities of thought in which systems analysis or concepts involving organized networks of cellular processes will come to the forefront of the biological sciences. Of course, early in the next century, much of the so-called Human Genome Project will have been completed with the promised "encyclopedia of genetic information". However, along with that will be the evidence that knowledge of the genome and its constituent genes does not give knowledge of how the living cell or organism is constructed and the multiple types of physiological processes are regulated. Hopefully the next century will see a more appropriate and detailed construction of the probabilistic schemes or networks of the living process rather than the simplistic and absolutist ways of current thinking.

http://www.popularmechanics.com/technology/a3120/110-predictions-for-the-next-110-years/

http://www.popularmechanics.com/technology/a3120/110-predictions-for-the-next-110-years/• Digital "ants" will protect the U.S.
power grid from cyber attacks. Programmed to wander networks in search of threats, the high-tech sleuths in this software, developed by Wake Forest University security expert Errin Fulp, leave behind a digital trail modeled after the scent streams of their real-life cousins. When a digital ant designed to perform a task spots a problem, others rush to the location to do their own analysis. If operators see a swarm, they know there's trouble.

Your genome will be sequenced before you are born• Researchers led by Jay Shendure of the
University of Washington recently reconstructed the genome of a fetus using saliva from the father and a blood sample from the mother (which yielded free-floating DNA from the child). Blood from the umbilical cord later confirmed that the sequencing was 98 percent accurate. Once the price declines, this procedure will allow us to do noninvasive prenatal testing.
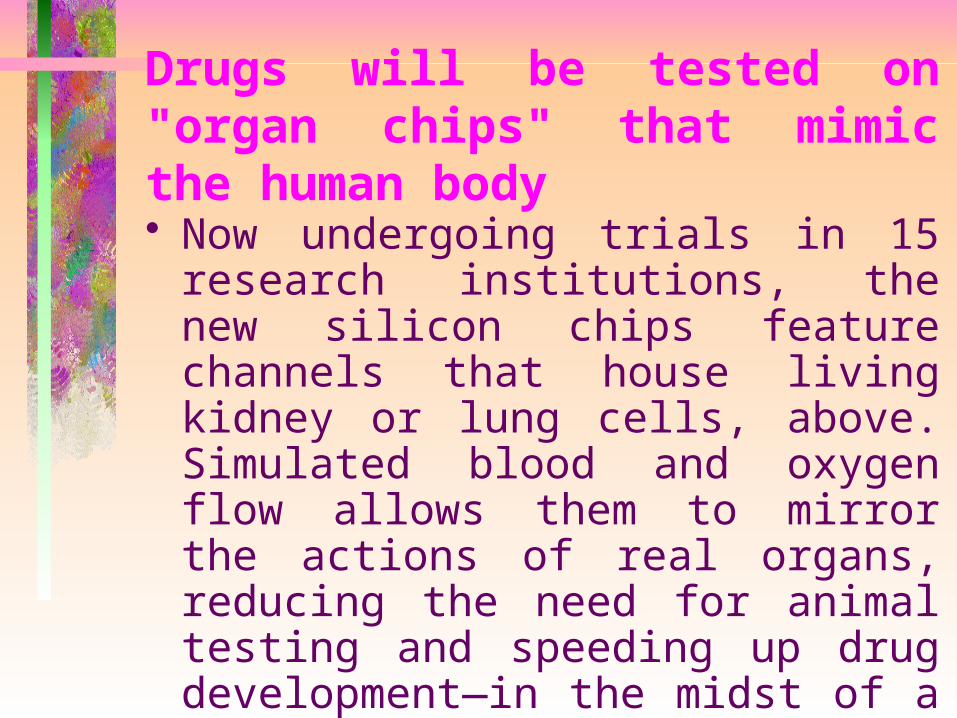
Drugs will be tested on "organ chips" that mimic the human body• Now undergoing trials in 15
research institutions, the new silicon chips feature channels that house living kidney or lung cells, above. Simulated blood and oxygen flow allows them to mirror the actions of real organs, reducing the need for animal testing and speeding up drug development—in the midst of a pandemic, that would be crucial.

Fusion of People and Machines

Mind uploading


Supercomputers will be the size of sugar cubes.• The trick is to redesign the
computer chip. Instead of the standard side-by-side model in use today, IBM researchers believe they can stack and link tomorrow's chips via droplets of nano-particle infused liquid. This would eliminate wires and draw away heat. What it won't do is help you remember where you left your tiny computer before you went to bed.

Tall Buildings – Sensors are the ultimate security means.

Burj Khalifa, Dubai- 828m

Jeddah Tower- 1KM originally planned for 1.6KM height. Saudi Arabia, ready by 2019.

Floating Cities in the oceans.

Femtoengineering is going to lead.

http://www.futuretimeline.net/22ndcentury/2100-2149.htm#femtoengineering• Technology on the scale of quadrillionths of a
metre (10-15) has recently emerged.* This is three orders of magnitude smaller than pico-technology and six orders of magnitude smaller than nanotechnology.
• Engineering at this scale involves working directly with the finest known structures of matter – such as quarks and strings – to manipulate the properties of atoms. This development is a further step towards macro-scale teleportation, i.e. transportation of objects visible to the naked eye. Significant breakthroughs in anti-gravity and force field generation will also result from this.

http://www.futuretimeline.net/22ndcentury/2100-2149.htm#femtoengineering• Another area that will see major progress is in materials technology. For example, metals will be produced which are capable of withstanding truly enormous pressures and tensile forces. The applications for this will be endless, but perhaps one of the most exciting areas will be in the exploration of hostile environments – such as probes capable of travelling within the Sun itself, and tunnelling machines that can penetrate the Earth's crust into the layers of magma beneath. Longer term, this development will pave the way for interstellar ships and the massive forces involved in light speed travel.
• Other more exotic materials are becoming possible – including wholly transparent metals, highly luminous metals, frictionless surfaces, and ultra dense but extremely lightweight structures. As with many areas of science, femtoengineering is being guided by advanced AI, which is now trillions of times more powerful than unaided human intelligence.

Earthquakes and Tsunamis will be made in human hand!

• By now, geophysicists have mapped the entirety of the Earth's crust and its faults, extending some 50 km (30 mi) below the surface. Computer simulations can forecast exactly when and where an earthquake will occur and its precise magnitude. With a "scheduling" system now in place, comprehensive preventative measures can be taken against these disasters.
• For instance, people know when to stay out of the weakest buildings, away from the bridges most likely to collapse and otherwise away from anything that might harm them. Rescue and repair workers can be on duty, with vacations cancelled and extra workers brought in from other areas. Workers can be geared up with extra equipment ordered in advance to fix key structures that may fail in an earthquake. Freeways can be emptied. Dangerous chemical freight can be prevented from passing through populated areas during the quake. Aircraft can be stopped from approaching a potentially damaged runway. Weak water reservoirs can have their water levels lowered in advance. Tourists can be made to stay away. All of these measures can substantially reduce casualties and economic disruption.

• However, some nations are going one step further and creating additional systems, in the form of gigantic engineering projects. To protect the most earthquake-prone regions, a network of "lubrication wells" is being established. These man-made channels penetrate deep underground, to the very edge of the mantle. They work by injecting nanotechnology-based fluid or gel into fault lines, making it easier for rock layers to slide past each other. Explosive charges can also be dropped at strategic points, in zones where the lubrication might be less effective. Instead of sudden, huge earthquakes, the network induces a series of much smaller earthquakes. Using this method, an earthquake of magnitude 8.0 can be buffered down to magnitude 4.0 or lower, causing little or no damage to structures on the surface. In coastal locations, tsunamis can also be prevented.
• This is a carefully controlled process – requiring heavy use of AI – and is by no means perfect. There are complex legal and liability issues in the event of accidents. For instance, damage from human-induced earthquakes cannot be excused as an "act of God."

Super Computing- Tianhe-2 (33.86Peta Flops)• Trinity and Hazel-Hen of Cray

http://www.hpcwire.com/2015/10/05/the-revolution-in-the-lab-is-overwhelming-it/

• An excellent, though admittedly high-end, example of the growing complexity of computational tools being contemplated and developed in life science research is presented by the European Union Human Brain Project[ii] (HBP). Among its lofty goals are creation of six information and communications technology (ICT) platforms intended to enable “large-scale collaboration and data sharing, reconstruction of the brain at different biological scales, federated analysis of clinical data to map diseases of the brain, and development of brain-inspired computing systems.”

• The elements of the planned HPC platform include[iii]:
• Neuroinformatics: a data repository, including brain atlases.
• Brain Simulation: building ICT models and simulations of brains and brain components.
• Medical Informatics: bringing together information on brain diseases.
• Neuromorphic Computing: ICT that mimics the functioning of the brain.
• Neurorobotics: testing brain models and simulations in virtual environments.
• HPC Infrastructure: hardware and software to support the other Platforms.

16 Massive Scientific Facilities at the Cutting Edge of Research http://www.popularmechanics.com/science/g2475/16-massive-scientific-facilities-at-the-cutting-edge-of-research/?mag=pop&list=nl_pnl_news&src=nl&date=022316

Super-Kamiokande-Neutrons no mass

Super-Kamiokande
• The Super-Kamiokande is a giant neutrino detector, where thousands of cylinders of water wait for an incredibly rare event: the annihilation of a weakly interacting neutrino when it strongly interacts with regular matter and creates proton decay. The facility won a Nobel in 2015 for the discovery that neutrinos had mass, one more step in understanding how these hard-to-detect particles affect the universe on larger scales.
• Kamioka Observatory, ICRR, University of Tokyo

Very Large Array- frozen water on Mercury

Very Large Array• Since 1980, the National Radio
Astronomy Observatory's Very Large Array has tuned in to distant galaxies, hunted for alien radio signals, and even discovered things in our solar system, like frozen water on Mercury. Each of the 27 radio telescope dishes are on a track such that they can be moved. That means they can be grouped together tightly into a 2000-square foot area or spread as far apart as 13 miles across.

Large Hadron Collider

Large Hadron Collider
• CERN's Large Hadron Collider discovered the missing particle that gives matter its mass. And that was just the beginning. The 17 miles of tunnel are operating at higher power than ever, hunting for particles never before even theorized, attempting to solve supersymmetry and maybe, just maybe, finding evidence of parallel universes.

LIGO
LIGO• In case you missed it, physicists
discovered gravitational waves, finally solving Einstein's theories and paving the way for brand new understandings of physics. To do that, two near-identical observatories in Washington and Louisiana have two 2.5 mile vacuum tubes, which fire five laser interferometers each. If those lasers are disturbed by gravitational waves, LIGO detects a positive match. And that's exactly how it caught the whispers of a black hole merger from 1.5 billion years ago.

Tevatron- Large Hadron Collider
Tevatron• The Large Hadron Collider is the
most powerful particle accelerator in the world. Fermilab's Tevatron, located in suburban Chicago, is the the second most powerful. Operating from 1971 to 2011, the lab was able to verify CERN's results regarding the Higgs-Boson, and made countless particle physics discoveries in its decades of operation

Arecibo Observatory –Hunt for Aliens

Arecibo Observatory
• Arecibo is the largest single aperture radio telescope in the world at about 1000 feet wide, located in the forests of Puerto Rico. The facility tunes in to pulsars, galaxies, and other cosmic phenomena, while occasionally hunting for aliens. Pictured here is the steering mechanism and antenna assembly at the top of the dish.

Aperture Spherical Radio Telescope – for glimpses of Heavens

Aperture Spherical Radio Telescope• China is building a 1,650 foot
telescope in the hills of Guizho, a remote province. Around 10,000 people are being relocated to give the radio dish a "quiet zone." The $184 million program is meant to dwarf Arecibo in size, and provide the country incredible glimpses of the heavens—and maybe help them hunt for technologically advanced aliens.

https://youtu.be/ob5IYlPX89w
High Voltage Marx and Tesla Generators Research Facility

High Voltage Marx and Tesla Generators Research Facility• Russia's premier weapons testing
facility has been in use since the 1970s. This drone video from last year shows the tall, tall Tesla towers in all their monstrous glory. The towers produce intense amounts of energy to ensure the durability of insulative materials on aircraft, vehicles, and weapons.

HAARP - ionosphere observations. Some claim artificial aircraft accidents..
HAARP• In 2014, the Air Force, Navy, and DARPA
pulled out of the High Frequency Active Auroral Research Program, transferring it over to the University of Alaska Fairbanks. For 21 years, it had been making ionospheric observations in the Alaskan wilderness. At least, that was the official government line. A cursory Google search will yield mostly conspiracy theories ranging from weather to mind control.
• The facility itself is huge: 180 antennas spread across 33 acres. All that to either monitor the ionosphere and test communications capability, or to enslave us all and cause aircraft accidents on purpose.
IceCube – Neutrino detector

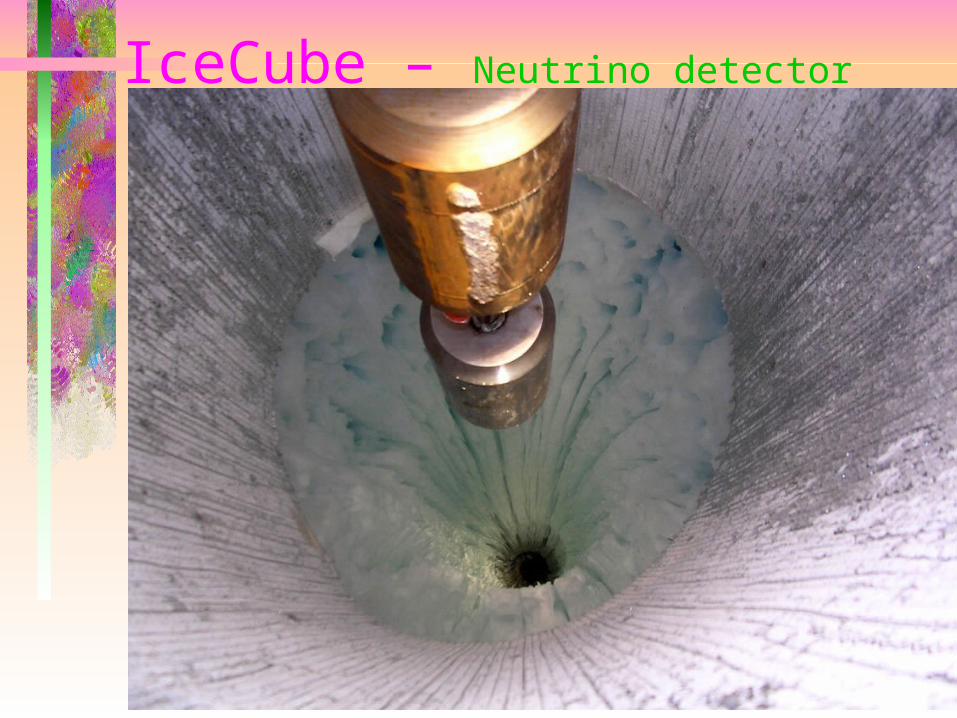
IceCube• In Antarctica, the IceCube Neutrino
Observatory waits for the passage of neutrinos. Already, it's found dozens, some from outside our solar system. 86 holes just like this one were dug, each about 1.5 miles deep. Neutrino detectors were placed at the bottom of each hole—the detectors need to be buried that deep to prevent interference from other particles passing through. Operating since 2010 after five years of construction that could only happen during the Antarctic summer, the facility has already expanded our understanding of the ghostly neutrino particles.

Atacama Large Millimeter Array

Atacama Large Millimeter Array• A total of 66 radio telescope dishes
sit high up in the mountainous deserts of Chile, far away from most civilization, allowing it to be one of the most precise radio astronomy observatories in the world. Operating since 2013, the observatory has provided stunning glimpses into our universe's past, studied comets, and made amazing observations of planetary formation.

National Ignition Facility-Fusion

National Ignition Facility• The Lawrence Livermore National
Laboratory is California is home to this 10 story chamber where 192 different lasers focus in on particles of hydrogen, attempting to compress them until a fusion reaction occurs. 500 trillion watts of energy are aimed toward the small target in the midst of it all, with the hope being we could someday get more energy back out then we put in—the holy grail of fusion.

Facility for Advanced Accelerator Experimental Tests (FACET) and Test Beam Facilities

Facility for Advanced Accelerator Experimental Tests (FACET) and Test Beam Facilities• At the SLAC National Accelerator
Lab, FACET explores the cutting edge of plasma research and provides ultra-hot particle beams for particle accelerator research. It's got a lot of punch packed into a facility the size of a large living room. At peak power, it can produce 10 trillion watts of power, or 2.5 billion 9 volt batteries firing off all at once.

Tianhe-2

Tianhe-2
• Tianhe-2 is the most powerful supercomputer in the world. There are a total of 16,000 nodes in the supercomputer, which are used to crunch numbers for the Chinese government and aid in national security.

Bruce Nuclear Generating Station

Bruce Nuclear Generating Station
• Ontario is home to the second largest nuclear reactor in the world and the largest currently online, the Bruce Nuclear Generating Station. This is the vault, the part of the nuclear generating station where fission occurs. The plant produces 30 percent of Ontario's energy output.

Aquarius Reef Base

Aquarius Reef Base
• NASA doesn't just send astronauts high above the ocean. It also sends them to this base at the bottom of the coral reef off the coast of the Florida Keys, where they can learn to work in tight spaces and extreme environments. Though NASA utilizes it, Florida International University currently owns the base.

Let us have a glance of developments in MEMS, Nanotechnology, IOT.

Microelectromechanical Systems (MEMS)
What is MEMS ?• Imagine a machine so small that it is imperceptible to the human eye.
• Imagine working machines with gears no bigger than a grain of pollen.
• Imagine these machines being batch fabricated tens of thousands at a time, at a cost of only a few pennies each.
• Imagine a realm where the world of design is turned upside down, and the seemingly impossible suddenly becomes easy – a place where gravity and inertia are no longer important, but the effects of atomic forces and surface science dominate.
Source: Sandia National Laboratories, Intelligent Micromachine Initiative (www.mdl.sandia.gov/mcormachine)
154

MEMS THE ENGINE OF INNOVATION AND NEW ECONOMIES
• “These micromachines have the potential to revolutionize the world the way integrated circuits did”.
Linton Salmon, National Science Foundation
• “Micromachining technology has the potential to change the world in some very important ways, many of which are not possible to foresee at this time, in the same way that standard IC technology has so revolutionized our lives and economies”.
Ray Stata, Chairman and CEO, Analog Devices, Inc.
155

MEMS TECHNOLOGY• Creates Integrated Electromechanical Systems that merge
computing with sensing and actuation.• Mechanical components have dimensions in microns and
numbers in millions.• Uses materials and processes of semiconductor electronics.• Wide applications in commercial, industrial and medical
systems : Automobiles Wearable Sensors to Monitor Vital Biological
Functions Cell Phones Printers GPS/Navigation Systems etc., Key Characteristics: Miniaturization (small size
and weight), Multiplicity (batch processing), Microelectronics, Small Cost, High Reliability.
156

APPLICATIONS OF MEMSInertial Measurement: Automotive Safety Aircraft Navigation Platform Stabilization Personal/Vehicle NavigationDistributed Sensing and Control: Condition-Based Maintenance Situational Awareness Miniature Analytic Instruments Environmental Monitoring Biomedical Devices Active StructuresInformation Technology: Mass Data Storage & Displays
157

APPLICATIONS OF MEMS
Automotive: Industrial:
Yaw Sensors Factory Automation
Gyroscopes Office Automation
Accelerometers Process Control
Airbag Sensors
Telecommunications : Medical:
Antenna Stabilization Blood Analysis
GPS/Navigation DNA Analysis
Wireless Communication Virtual Reality
158

NANOTECHNOLOGY The NNI defines Nanotechnology as consisting
of all of the following:
• Research & technology development at the 1-to-100nm range.
• Creating & using structures that have novel properties because of their small size.
• Ability to control/manipulate at atomic scale.
Reference: Nanotechnology for Dummies by Richard Booker and Earl Boysen, Wiley Publishing, Inc. 159

NANOTECHNOLOGY (Continued)
KEY Elements of Nanotechnology:• Buckyball- A soccer-ball shaped molecule made of 60 carbon atoms.
Applications: Composite reinforcement, drug delivery.
• Carbon Nanotube: A sheet of graphite rolled into a tube. Applications: Composite reinforcement, conductive wire, fuel cells, high-resolution displays.
• Quantum Dot: A semiconductor nanocrystal whose electrons show discrete energy levels, much like an atom. Applications: Medical imaging, energy-efficient light bulbs.
• Nanoshell: A nanoparticle composed of a silica core surrounded by a gold coating. Applications: Medical imaging, cancer therapy.
Reference: Nanotechnology for Dummies by Richard Booker and Earl Boysen, Wiley Publishing, Inc.
160

161
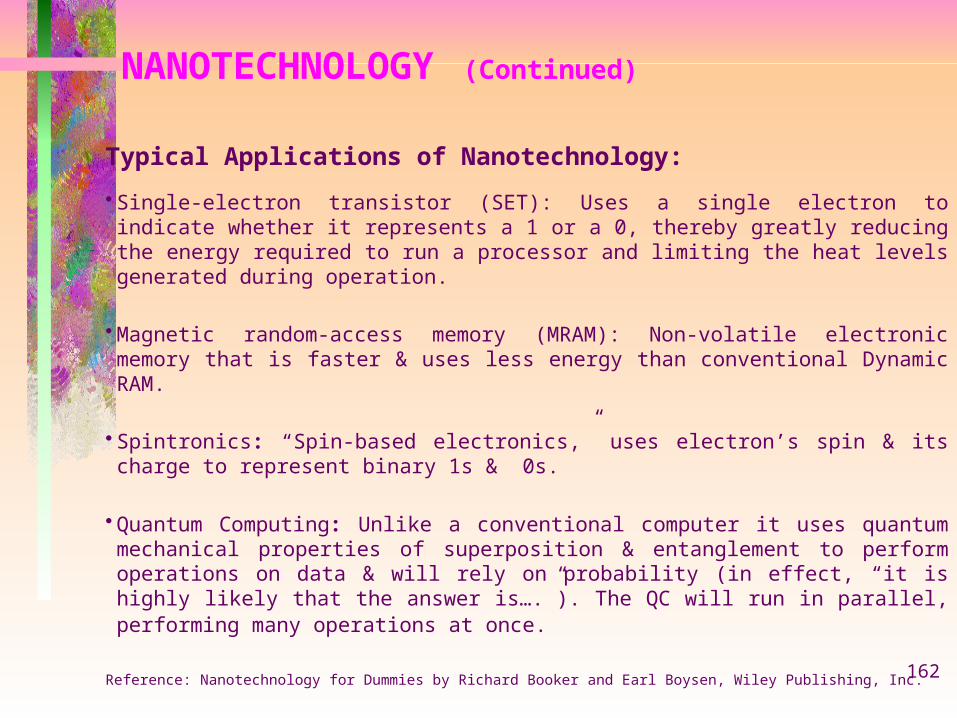
NANOTECHNOLOGY (Continued)
Typical Applications of Nanotechnology:• Single-electron transistor (SET): Uses a single electron to indicate whether
it represents a 1 or a 0, thereby greatly reducing the energy required to run a processor and limiting the heat levels generated during operation.
• Magnetic random-access memory (MRAM): Non-volatile electronic memory that is faster & uses less energy than conventional Dynamic RAM.
• Spintronics: “Spin-based electronics,” uses electron’s spin & its charge to represent binary 1s & 0s.
• Quantum Computing: Unlike a conventional computer it uses quantum mechanical properties of superposition & entanglement to perform operations on data & will rely on probability (in effect, “it is highly likely that the answer is….”). The QC will run in parallel, performing many operations at once.
Reference: Nanotechnology for Dummies by Richard Booker and Earl Boysen, Wiley Publishing, Inc.162
NANOTECHNOLOGY (Continued)
Typical Applications of Nanotechnology (contd)
• Quantum cryptography: Based on traditional key-based crypt., using unique properties of quantum mechanics to provide a secure key exchange.
• Photonic crystals: Nano crystals that guide photons according to structural properties (optical router for Internet info. exchange).
• Other: Cell phones with longer battery life, smaller & more accurate GPS, faster & smaller computers, smaller & more efficient memory, smart materials, fast & accurate DNA fingerprinting, medical diagnostics & drug delivery, etc.
Reference: Nanotechnology for Dummies by Richard Booker and Earl Boysen, Wiley Publishing, Inc. 163
• Improved (Nano-engineered cementitious?) Materials with increased strength, energy efficiency, environmentally friendly…

IOT

Modern Mobile with number of Sensors.
167
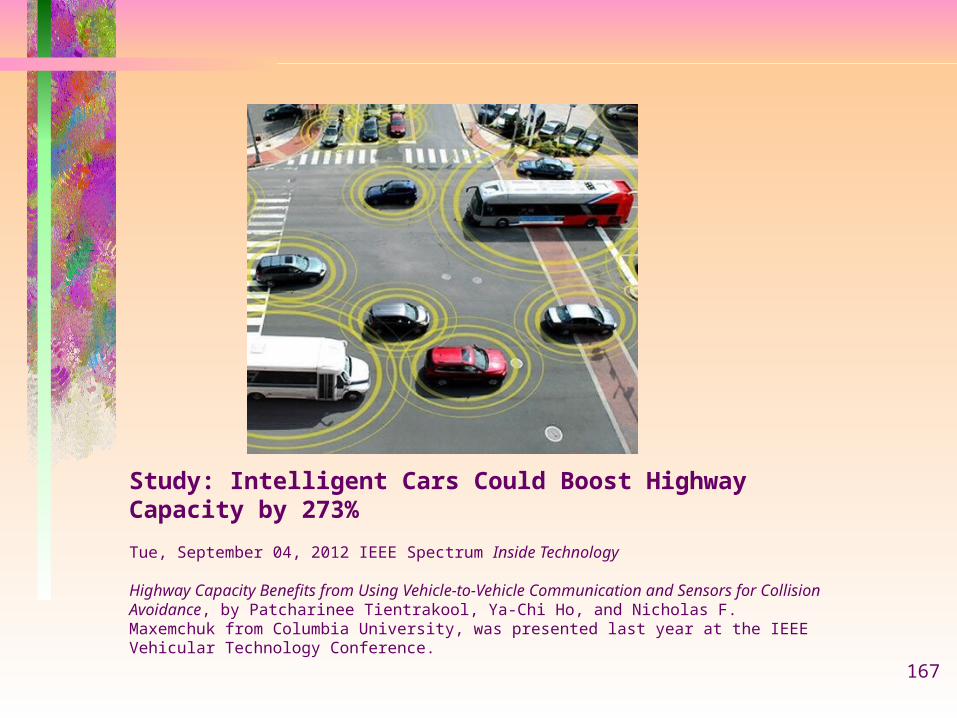
Study: Intelligent Cars Could Boost Highway Capacity by 273% Tue, September 04, 2012 IEEE Spectrum Inside Technology
Highway Capacity Benefits from Using Vehicle-to-Vehicle Communication and Sensors for Collision Avoidance, by Patcharinee Tientrakool, Ya-Chi Ho, and Nicholas F. Maxemchuk from Columbia University, was presented last year at the IEEE Vehicular Technology Conference.

Automation steps of the vehicle
168

Combining vehicle networking with global infrastructure
169

A Self-Driving, Hybrid Flying Car TF-X Is (Supposedly) Almost Ready To Take Flight

Experimental verification of novel formulations, with 21st centurylaboratory facilities, modern sensor technology.Design wireless sensor networks for in-situ structural healthmonitoring and warning systems (Minneapolis Bridge Collapse)

Improve understanding of damage/deterioration of structures based on novel structural mechanics formulations for large deformation and nonlinear behavior With modern high-performance computational hardware, can a 3D solid mechanics based framework provide more insights into failure dynamics than a structural element based framework?

https://www.youtube.com/embed/KeTizNY0zDA https://youtu.be/gSdQyVNUvTc
Car crash testing
Sensor Developments helps further.

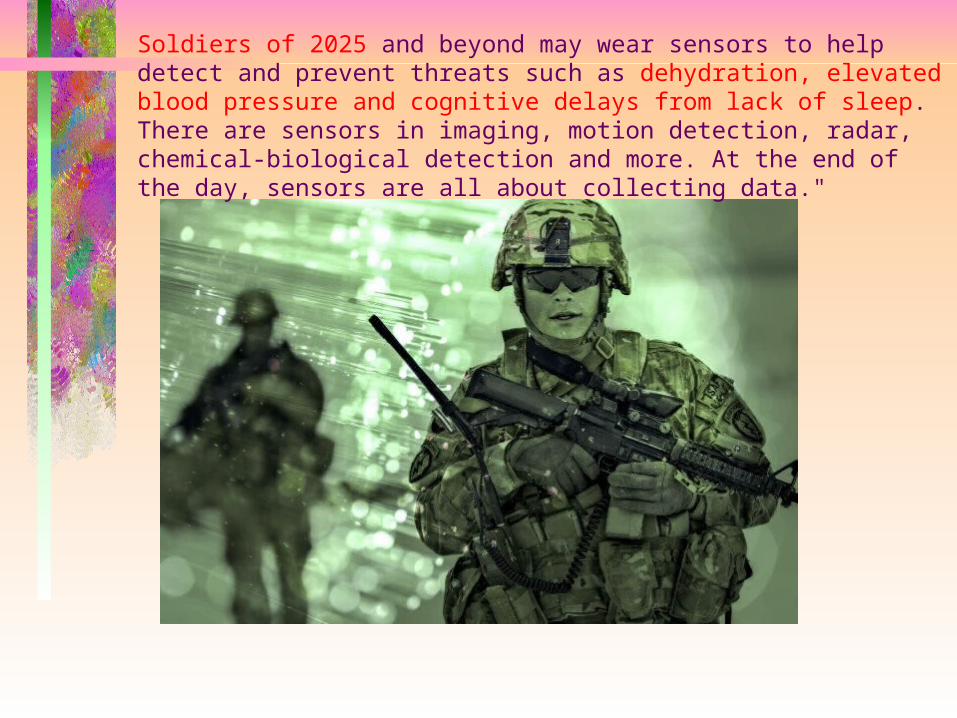
Soldiers of 2025 and beyond may wear sensors to help detect and prevent threats such as dehydration, elevated blood pressure and cognitive delays from lack of sleep. There are sensors in imaging, motion detection, radar, chemical-biological detection and more. At the end of the day, sensors are all about collecting data."

DVE(Degraded Visual Environments)One critical area of research is enhancing air operations in degraded visual environments, known as DVE. At the Aviation and Missile Research, Development and Engineering Center at Redstone Arsenal, Alabama, Army engineers are advancing and implementing new technologies. One research program fuses images of multiple sensor technologies such as radar, infrared, and laser detection and ranging, also known as lidar. Each of these sensor technologies provide unique advantages for operating in various types of DVE conditions.


Modern Sensors
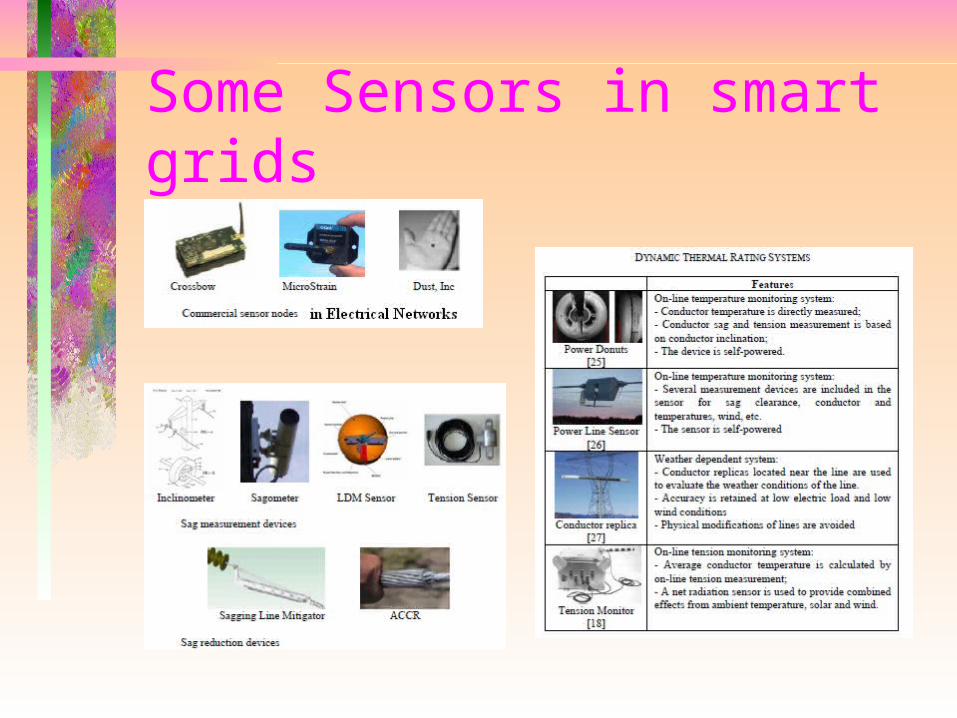
Some Sensors in smart grids

3-D Capture in Mobile using Stereo Vision?

Wisonsin Introduction toEngineering Course on Society’s Engineering Grand Challenges
Focus on the following themes, ordered by scale:1) Engineering challenges that impact our lives on a personal scale, 2) Engineering for the developing world, 3)Engineering the megacity, 4) Global engineering challenges, and 5) Engineering challenges beyond Planet Earth.

MIT Online Course On Computational Thinking and Data Science• Topics covered include:• -Random walks• -Probability, Distributions• -Monte Carlo simulations• -Curve fitting• -Knapsack problem, Graphs and graph optimization• -Machine learning basics, Clustering algorithms• -Statistical fallacies

IOT The “Internet of Things” (or “Internet
of Everything”), which is expected to connect a trillion devices in our homes, buildings, cars, and even bodies to monitor our health, our environment, and our resources, presents major challenges: Current devices and systems consume too much power; a trillion devices cannot all be battery-powered; how do we design and manufacture millions of different things; a trillion devices form a large “attack surface.”
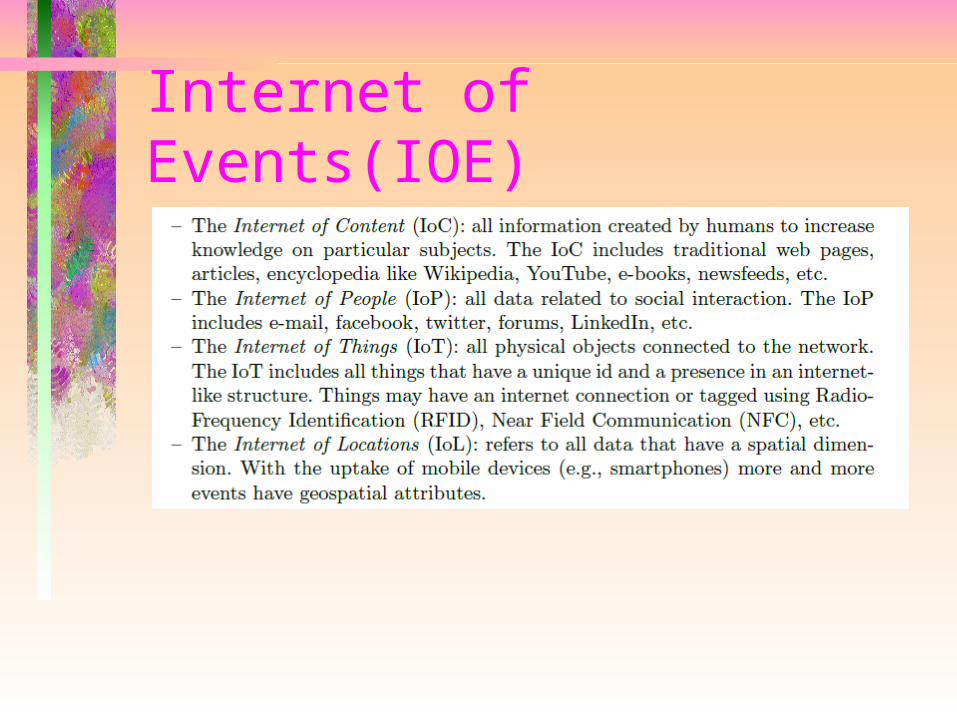
Internet of Events(IOE)
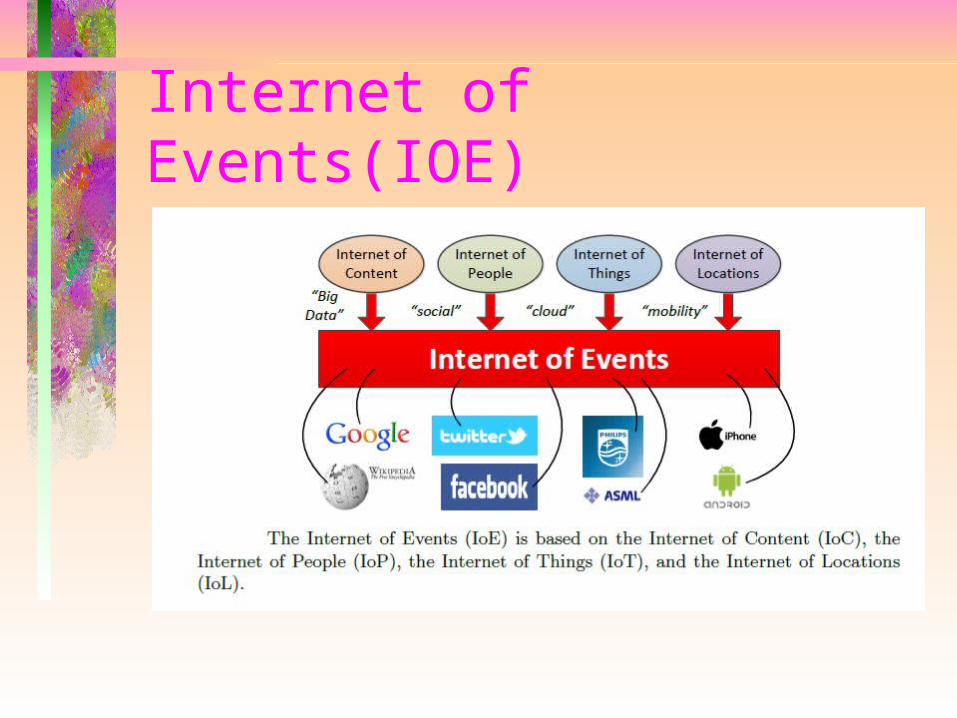
Internet of Events(IOE)

Data science aims to use the different data sources described above to answer questions grouped into the following four categories:
• Reporting: What happened?• Diagnosis: Why did it happen?• Prediction: What will happen?• Recommendation: What is the
best that can happen?

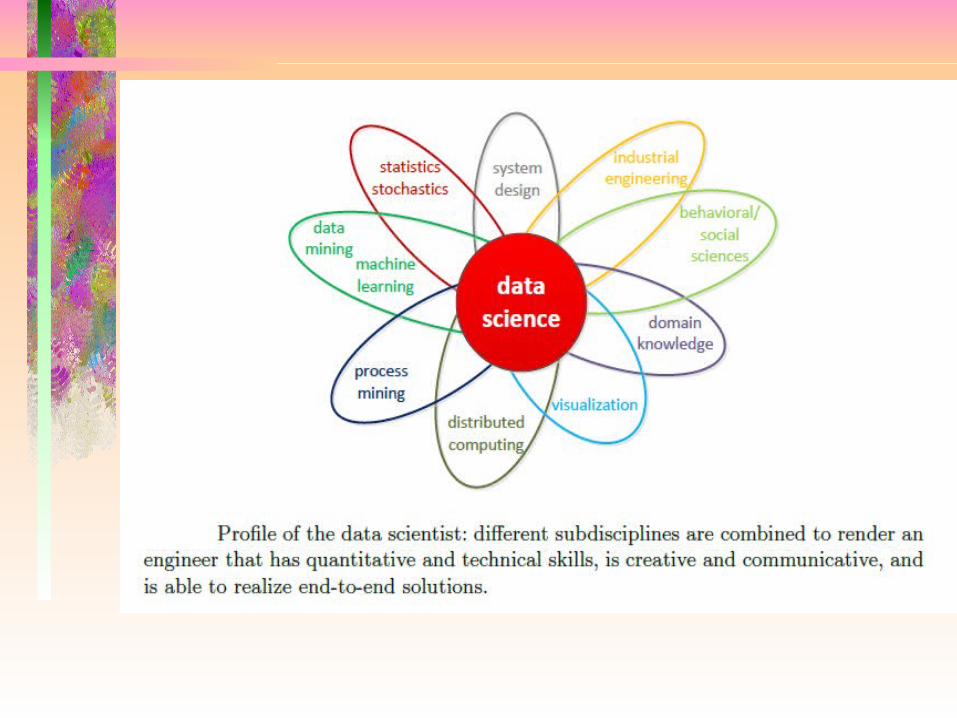
Wikipedia definition of Data ScienceData science incorporates varying elements and builds on techniques and theories from many fields, including mathematics, statistics, data engineering, pattern recognition and learning, advanced computing, visualization, uncertainty modeling, data warehousing, and high performance computing with the goal of extracting meaning from data and creating data products.
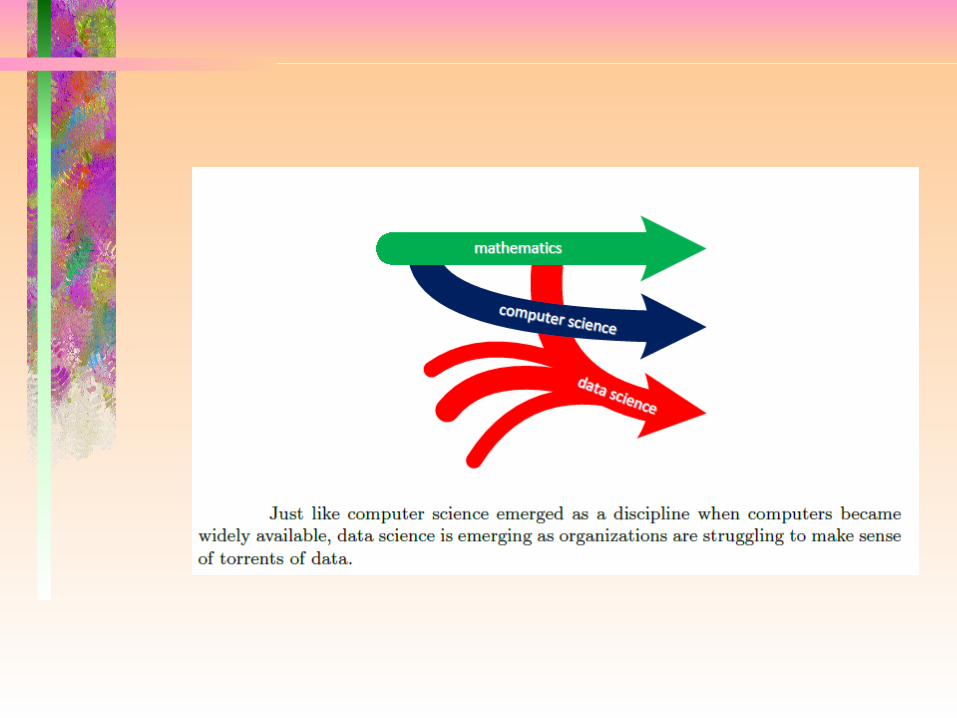
The Dawn of Data Science discipline.Just like computer science emerged as a new discipline from mathematics when computers became abundantly available, we now see the birth of data science as a new discipline driven by the torrents of data available today. We believe that the data scientist will be the engineer of the future.

Data Growth• Stone age to 2003- 5 Exa-bytes• In 2011, every two days 5 Exa-
bytes• In 2013, every ten minutes 5 Exa-
bytes


Data Science is to give value to data.“If you're not paying for the product, you are the product!" is used to make internet users aware of the value of information. Organizations like Google, Facebook, and Twitter are spending enormous amounts of money on maintaining an infrastructure. Yet, end-users are not directly paying for it. Instead they are providing content and are subjected to advertisements. This means that other organizations are paying for the costs of maintaining the infrastructure in exchange for end-user data. The internet is enabling new business models relying on data science.

Select Your Favorite Heroine. Send SMS to 56556/57!!!• Kajal Agarwal• Samantha• Sruthi Hasan• Rasi Khanna• Milky beauty Tamanna

Data ScientistsData scientists are the people who understand how to fish out answers to important business questions from today's tsunami of unstructured information
Data mining is defined as the analysis of (often large) data sets tofind unsuspected relationships and to summarize the data in novel ways that are both understandable and useful to the data owner. The input data is typically given as a table and the output may be rules, clusters, tree structures, graphs, equations, patterns, etc.

Visualization

Data Scientist-The sexiest job of 21st Century.

Birds view of Statistics – I am afraid, I am trying to wake up a beast (statistics) with a small stick.
Do not take it like:కొ0 డను త్రవ్వి�
ఎలుకను పట్టి�నటు�అనుకోవదు�

Statistical Research Methods • Distributions • Preparing graphs• Hypothesis testing• Regression- simple, multiple• Multivariate Statistics• Exploratory Data Analysis• Sampling• Stochastic analysis• Time series analysis• Spatial Statistics

How IOT, Sensor Networks, New Sensors are opening doors for research?• Use of sensors increases in
Engineering Research which necessitates more or extensive (detailed) data analysis.
• For example, we need to compare sensitivity of two or more sensors from two different companies. We carry measurements with both and statistically analyze whether they are same or different.

Feature Extraction/Selection• We often required to analyze depe
ndence of measurements which may allow us to reduce redundancy in number of sensors, type of sensors.
• We often encounter need to compare measurements of a set of sensors with another set of sensors (which may be spatially located else where or chronologically].

Soft Sensors• Soft sensor is a common name for software
where several measurements are processed together. There may be dozens or even hundreds of measurements. The interaction of the signals can be used for calculating new quantities that can not be measured.
• Soft sensors or inferential calculators are operators’ virtual eyes. Soft sensors create windows to a process where physical equivalents are unrealistic or even impossible.
• Sensor output can be a control signal, advisory information for operators, predictions of product quality, information on process faults or outliers in data.

E-Nose and E-Tongue• The e-tongue uses a range of sensors
that respond to salts, acids, sugars, bitter compounds, etc. and sends signals to a computer for interpretation. The interpretation of the complex data sets from e-nose and e-tongue signals is accomplished by use of multivariate statistics including principal component analyses such as (PCA), linear discriminant analysis (LDA), discriminant function analysis (DFA), hierarchical cluster analysis (HCA), soft independent modeling of class analogy (SIMCA) and partial least squares (PLS).
Comparing measurements of a sensory networks in time (Chronologically)
Comparing measurements of a sensory system with other one elsewhere.

Identifying patterns in the behavior of collection of sensors.

Studying behavior of sensors under extreme conditions.

Sensor Fusion

• Non-Destructive testing• Condition monitoring

Intelligent buildings – Sensors for prediction of earth quakes in advance using nano-sensors.


If your experiment needs statistics, you ought to have done a better experiment.
Ernest Rutherford (1871-1937)
“To call in the statistician after the experiment is done may be no more than asking him to performa postmortem examination: he may be able to say what the experiment died of.”
Ronald Aylmer Fisher (1890 - 1962)
“He uses statistics as a drunken man uses lamp posts -- for support rather than illumination.”
Andrew Lang (1844-1912)
Frequent problems which people encounter while analyzing their observations?• Scaling• Graphing• Interpretation

Histogram of Music Experiment Data
5 10 15 20
Performance Score
0
2
4
6
Control Training
5 10 15 20
Performance Score
The data from our experiment are represented here in histogramsNotice here that the bins are simply a proportion of the total range – in this case 1/11This proportion can be varied when compiling a histogram and can make a big difference to the appearance of the data
Because the data represented on the x axis are continuous, the actual number of and size of the bins can be varied infinitely, though not
all combinations produce sensible graphs
Histogram of Music Experiment Data
5 10 15 20
Performance Score
0
2
4
6
Control Training
5 10 15 20
Performance Score
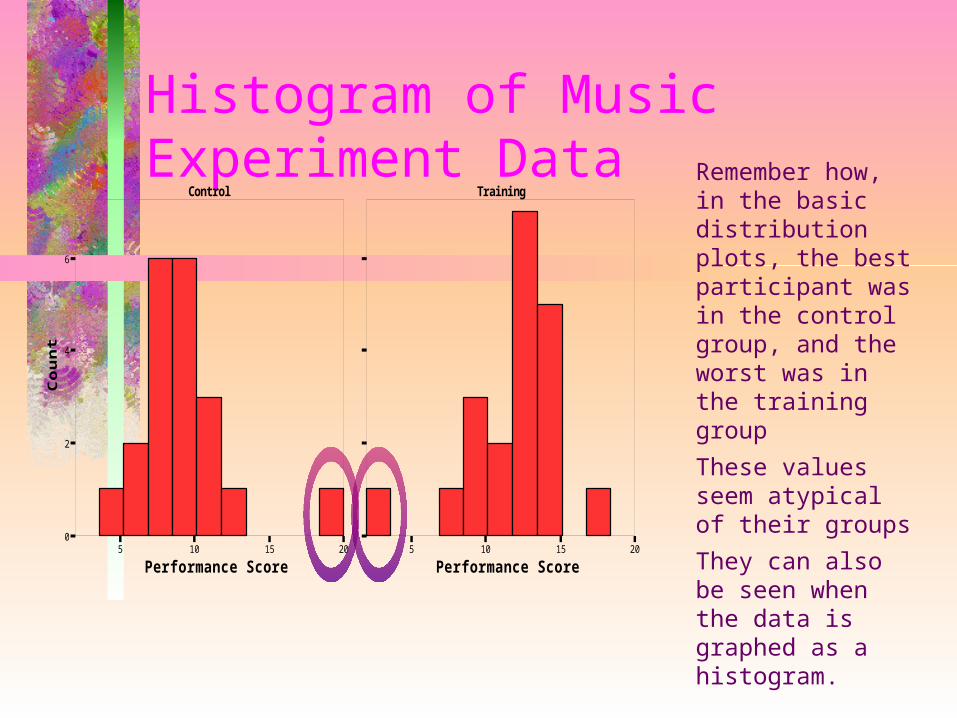
Remember how, in the basic distribution plots, the best participant was in the control group, and the worst was in the training groupThese values seem atypical of their groupsThey can also be seen when the data is graphed as a histogram.
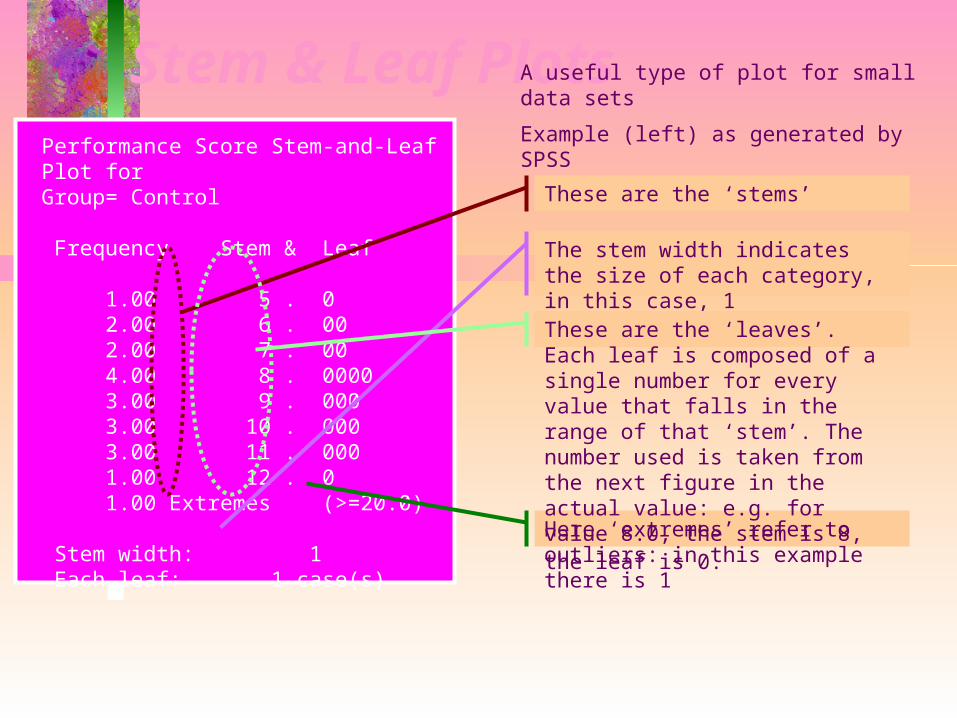
Stem & Leaf PlotsPerformance Score Stem-and-Leaf Plot forGroup= Control
Frequency Stem & Leaf
1.00 5 . 0 2.00 6 . 00 2.00 7 . 00 4.00 8 . 0000 3.00 9 . 000 3.00 10 . 000 3.00 11 . 000 1.00 12 . 0 1.00 Extremes (>=20.0)
Stem width: 1 Each leaf: 1 case(s)
These are the ‘stems’
The stem width indicates the size of each category, in this case, 1
Here ‘extremes’ refer to outliers: in this example there is 1
These are the ‘leaves’. Each leaf is composed of a single number for every value that falls in the range of that ‘stem’. The number used is taken from the next figure in the actual value: e.g. for value 8.0, the stem is 8, the leaf is 0.
A useful type of plot for small data sets
Example (left) as generated by SPSS

221
Stem-and-Leaf Diagram

222
Stem-and-Leaf Diagram

223
Histograms
An important variation of the histogram is the Pareto chart. This chart is widely used in quality and process improvement studies where the data usually represent different types of defects, failure modes, or other categories of interest to the analyst. The categories are ordered so that the category with the largest number of frequencies is on the left, followed by the category with the second largest number of frequencies, and so forth.

224
Histograms
225
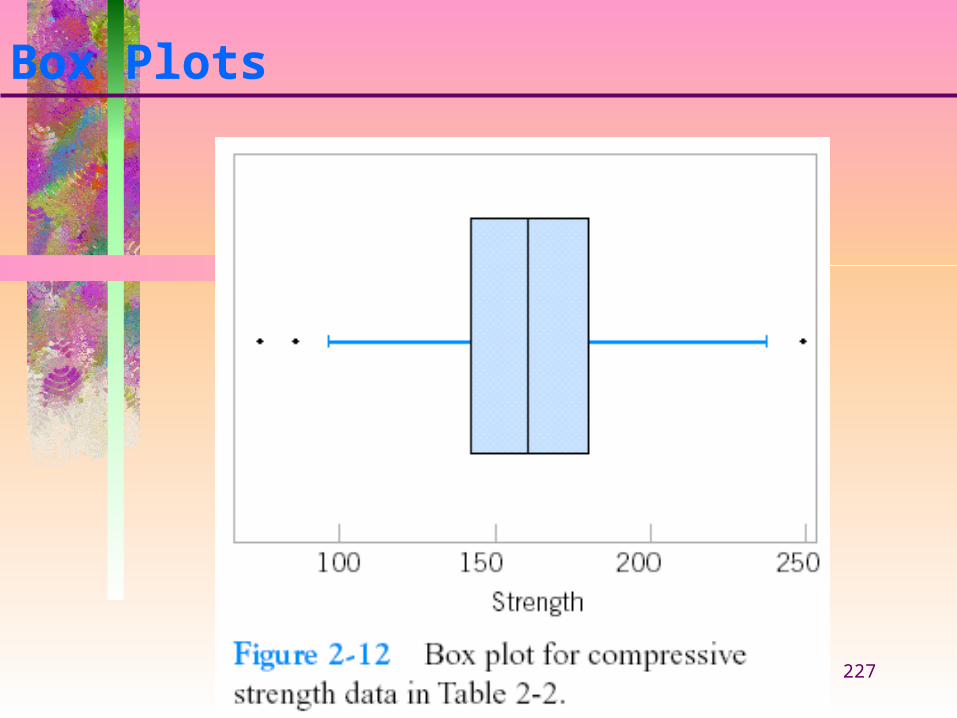
Box Plots
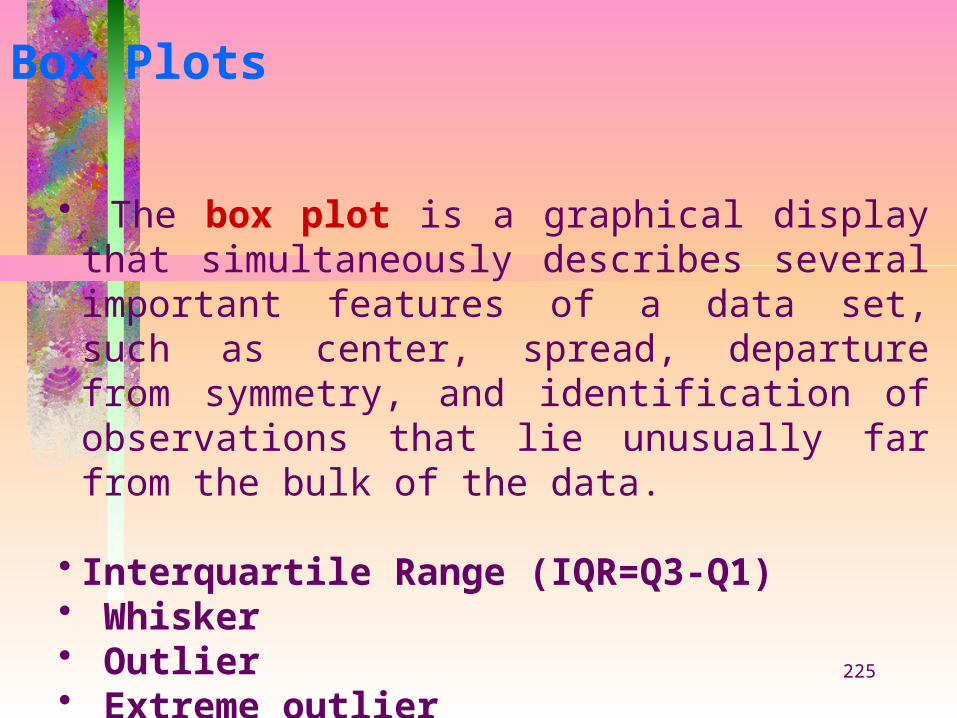
• The box plot is a graphical display that simultaneously describes several important features of a data set, such as center, spread, departure from symmetry, and identification of observations that lie unusually far from the bulk of the data.
• Interquartile Range (IQR=Q3-Q1)• Whisker• Outlier• Extreme outlier

226
Box Plots—five point summary
227
Box Plots

228
Box Plots

The mean as the mathematical ‘balance point’
•• • •
• • • • •• • • • • • •0 1 2 3 4 5 6
X = 3
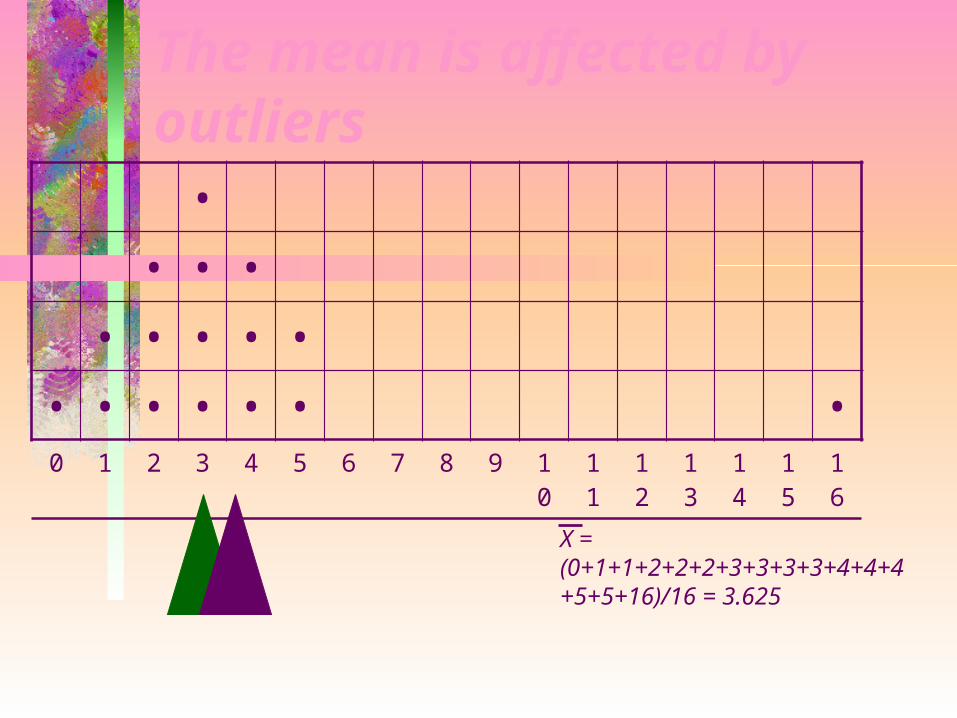
The mean is affected by outliers
•• • •
• • • • •• • • • • • •0 1 2 3 4 5 6 7 8 9 1
011
12
13
14
15
16
X = (0+1+1+2+2+2+3+3+3+3+4+4+4+5+5+16)/16 = 3.625

Variance
2 XX
1
2
2
n
XXS
Squared sum of deviations
Squared sum of deviations divided by number of observations (minus 1)
= 40
= 40/15 = 2.67
The variance is calculated by calculating an average from the squared sum of deviations
Variance = 2.67
Variance
2 XX
1
2
2
n
XXS
Squared sum of deviations
Squared sum of deviations divided by number of observations (minus 1)
= 40
= 40/15 = 2.67
The variance is calculated by calculating an average from the squared sum of deviations
Variance = 2.67
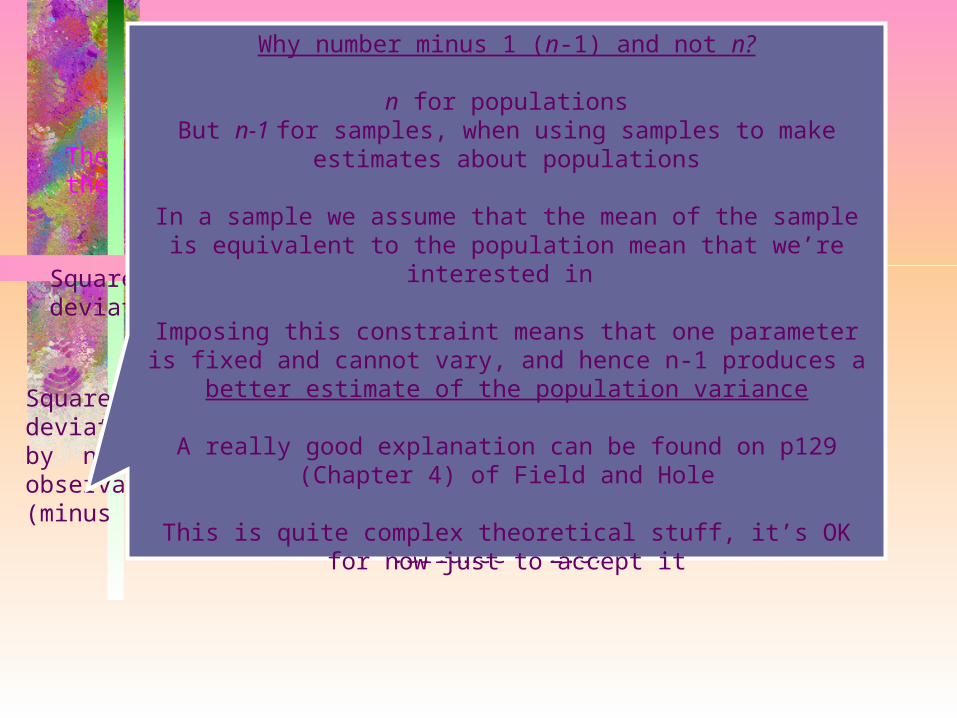
Why number minus 1 (n-1) and not n?
n for populationsBut n-1 for samples, when using samples to make estimates about
populations
In a sample we assume that the mean of the sample is equivalent to the population mean that we’re interested in
Imposing this constraint means that one parameter is fixed and cannot vary, and hence n-1 produces a better estimate of the
population variance
A really good explanation can be found on p129 (Chapter 4) of Field and Hole
This is quite complex theoretical stuff, it’s OK for now just to accept it

Calculating the variance• Sample Data: from ‘control
condition’– First, calculate the mean
nX
X = 202012111111101010999888877665
= 9.25

Calculating the variance– Then, calculate the deviations from the
mean for each valueValue Mean Calculatio
nDeviation
5 9.25 5-9.25 = -4.256 9.25 6-9.25 = -3.256 9.25 6-9.25 = -3.257 9.25 7-9.25 = -2.257 9.25 7-9.25 = -2.258 9.25 8-9.25 = -1.25.. .. .. .... .. .. ..12 9.25 12-9.25 = 2.7520 9.25 20-9.25 = 10.75
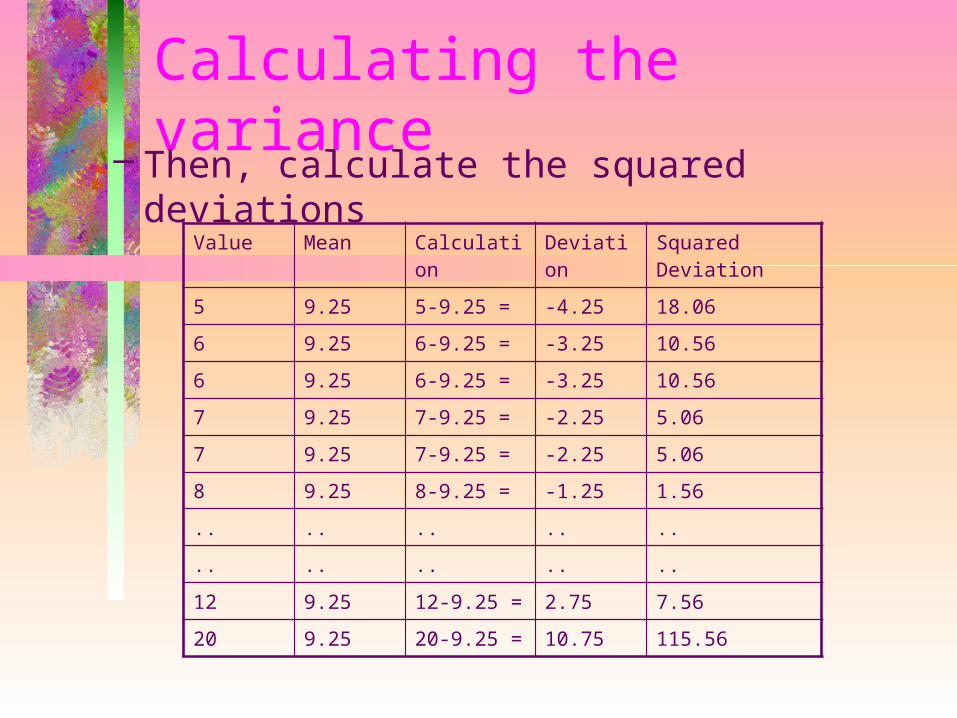
Calculating the variance– Then, calculate the squared deviations
Value Mean Calculation
Deviation
Squared Deviation
5 9.25 5-9.25 = -4.25 18.066 9.25 6-9.25 = -3.25 10.566 9.25 6-9.25 = -3.25 10.567 9.25 7-9.25 = -2.25 5.067 9.25 7-9.25 = -2.25 5.068 9.25 8-9.25 = -1.25 1.56.. .. .. .. .... .. .. .. ..12 9.25 12-9.25 = 2.75 7.5620 9.25 20-9.25 = 10.75 115.56
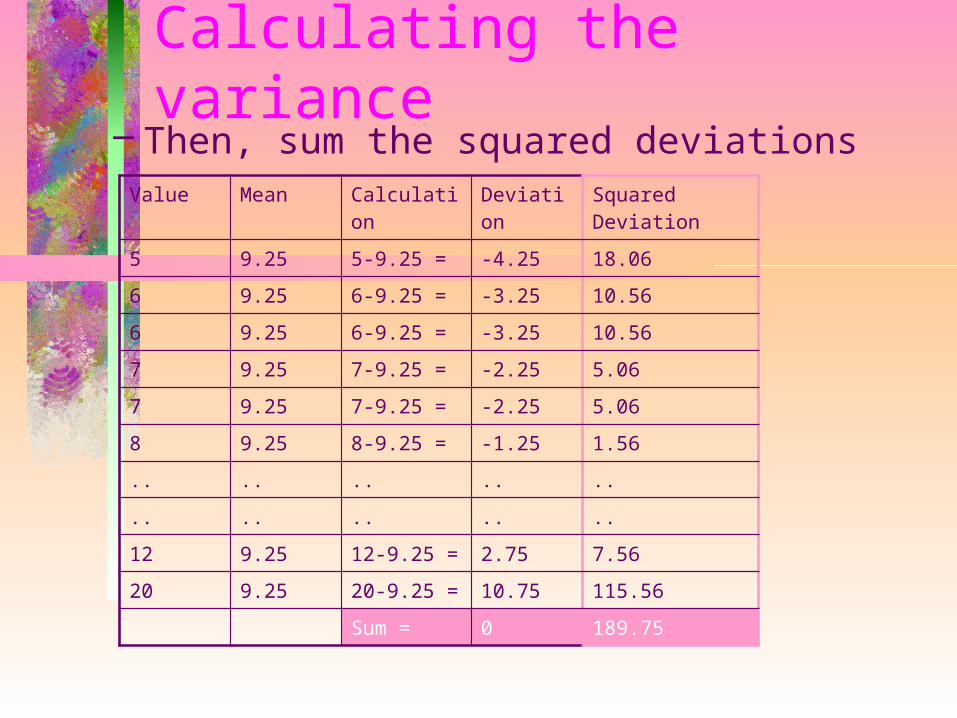
Calculating the variance– Then, sum the squared deviations
Value Mean Calculation
Deviation
Squared Deviation
5 9.25 5-9.25 = -4.25 18.066 9.25 6-9.25 = -3.25 10.566 9.25 6-9.25 = -3.25 10.567 9.25 7-9.25 = -2.25 5.067 9.25 7-9.25 = -2.25 5.068 9.25 8-9.25 = -1.25 1.56.. .. .. .. .... .. .. .. ..12 9.25 12-9.25 = 2.75 7.5620 9.25 20-9.25 = 10.75 115.56
Sum = 0 189.75

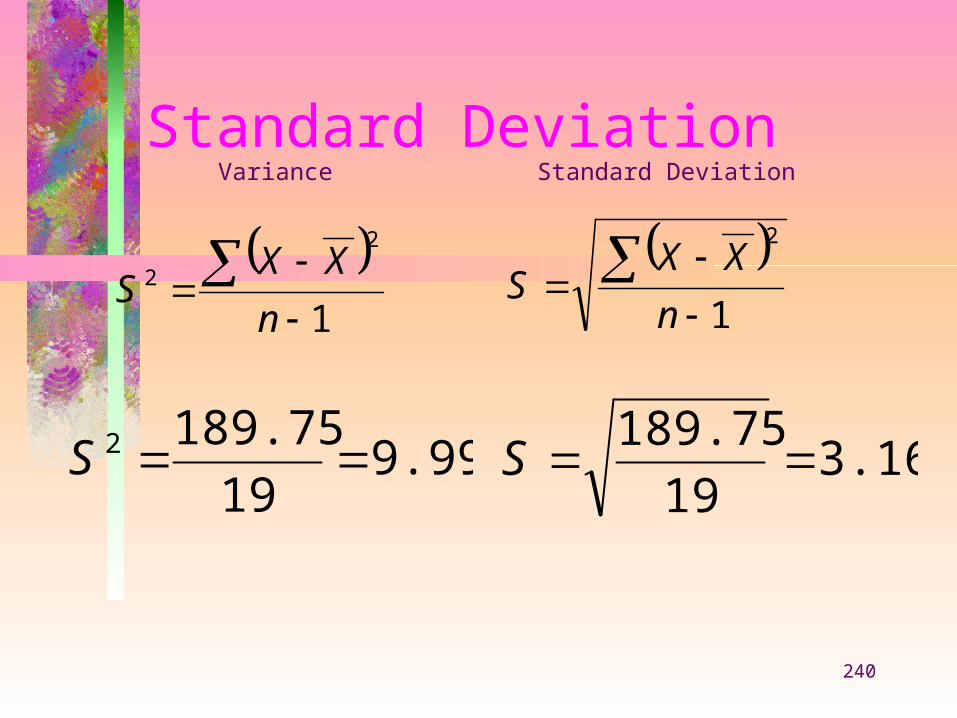
Calculating the variance– Finally, divide the sum of the squared
deviations by n-1 (i.e. the number of observations -1)
9.9919
189.752 S
1
2
2
n
XXS
Sum of squared deviations

238
Standard Deviation• The simple range statistic has the
merit of being in the same units as the raw data.
• The variance, since it is based on the squares of the deviations, is in squared units and is therefore difficult to interpret, it doesn’t make much intuitive sense.
• If you take the (positive) square root of the variance, you have the standard deviation, which is in the original units of measurement.

239
Standard Deviation• The simple range statistic has the
merit of being in the same units as the raw data.
• The variance, since it is based on the squares of the deviations, is in squared units and is therefore difficult to interpret.
• If you take the (positive) square root of the variance, you have the standard deviation, which is in the original units of measurement.
Remember that the deviations were squared to remove the problem of them summing to 0
240
Standard Deviation
1
2
n
XXS
1
2
2
n
XXS
Variance Standard Deviation
9.9919
189.752 S 3.1619
189.75S

Standard Deviation• The square root operation
translates the spread described by the variance back to the original units of measurement.
• It may be helpful to think of the standard deviation as an ‘average of the deviations from the average’– for the reasons described previously
this is not entirely accurate mathematically – it is not the mean of mean deviations

Standard DeviationGoing back to these examples:
control group: s.d. = 2.534And for training: s.d. = 0.795
The s.d. for the control group is much greater than that for the training group, indicating much more spread
6 8 10 12 14
Performance Score
0
4
8
12
Cou
nt
Control Training
6 8 10 12 14
Performance Score

Standard DeviationS.D. is based on all the values in a data set, and hence a much more accurate measure.It is still influenced by outliers, but it is far less influenced by extreme maxima or minima than the range. As in the case of the original music study dataControl s.d. = 3.16 Training s.d. = 3.28Without outliers:Control s.d. =1.95 Training s.d. =2.36
5 10 15 20
Performance Score
0
2
4
6
Control Training
5 10 15 20
Performance Score

What is the physical interpretation of standard deviation?

Important features of the Student’s t distribution• Use of the t statistic assumes that
the parent distribution is Gaussian• The degree to which the t
distribution approximates a Gaussian distribution depends on N (the degrees of freedom)
• As N gets larger (above 30 or so), the differences between t and z become negligible

Application of Student’s t distribution to a sample mean• The Student’s t statistic can also
be used to analyze differences between the sample mean and the population mean:
Ns
xt )(

Comparison of Student’s t and Gaussian distributions• Note that, for a sufficiently large N
(>30), t can be replaced with z, and a Gaussian distribution can be assumed

Exercise• The mean age of the 20
participants in one workshop is 27 years, with a standard deviation of 4 years. Next door, another workshop has 16 participants with a mean age of 29 years and standard deviation of 6 years.
• Is the second workshop attracting older technologists?

Preliminary analysis• Is the population Gaussian?• Can we use a Gaussian distribution
for our sample?• What statistic should we calculate?

SolutionFirst, calculate the t statistic for
the two means:
19.1
164
206
)2729(
)()(
22
2
22
1
21
21
2
2
1
1
21
Ns
Ns
xx
Ns
Ns
xxt

Solution, cont.
Next, determine the degrees of freedom:N N Ndf
1 2 216 20 234

Statistical Tables
df t0.050 t0.025 t0.010
- - - -
34 1.645 1.960 2.326
- - - -
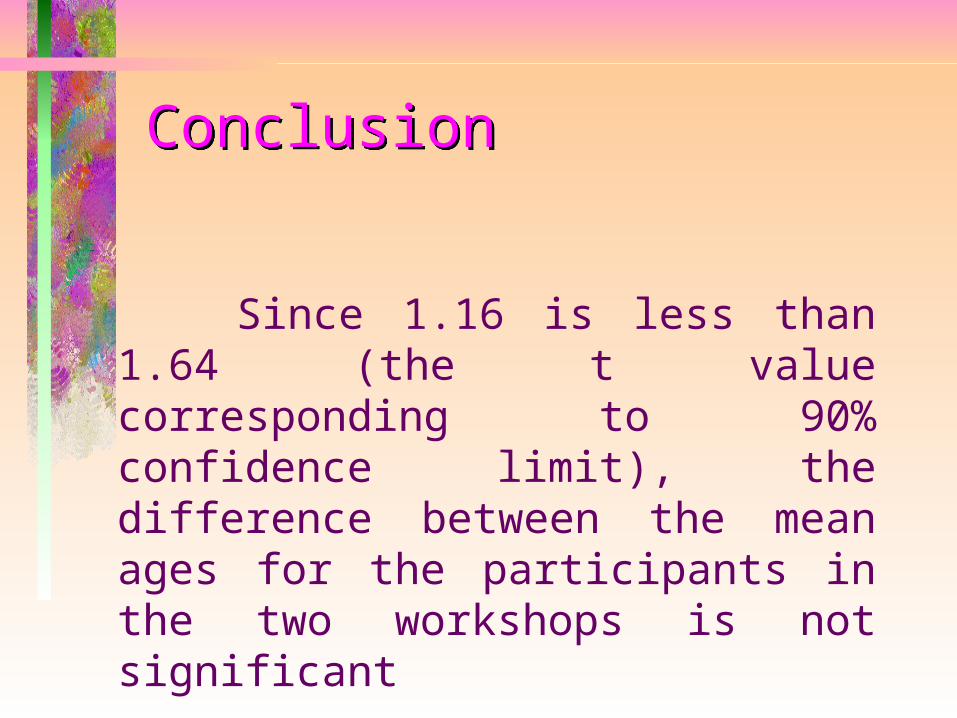
Conclusion
Since 1.16 is less than 1.64 (the t value corresponding to 90% confidence limit), the difference between the mean ages for the participants in the two workshops is not significant

The Paired t Test
Suppose we are comparing two sets of data in which each value in one set has a corresponding value in the other. Instead of calculating the difference between the means of the two sets, we can calculate the mean difference between data pairs.

Instead of:
we use:
to calculate t:
( )x x1 2
N
iii xx
Nxx
12121 )(1)(
t x xsNd
( )1 2
2

Advantage of the Paired t• If the type of data permit paired
analysis, the paired t test is much more sensitive than the unpaired t.
• Why?

Applications of the Paired t• Method correlation• Comparison of therapies
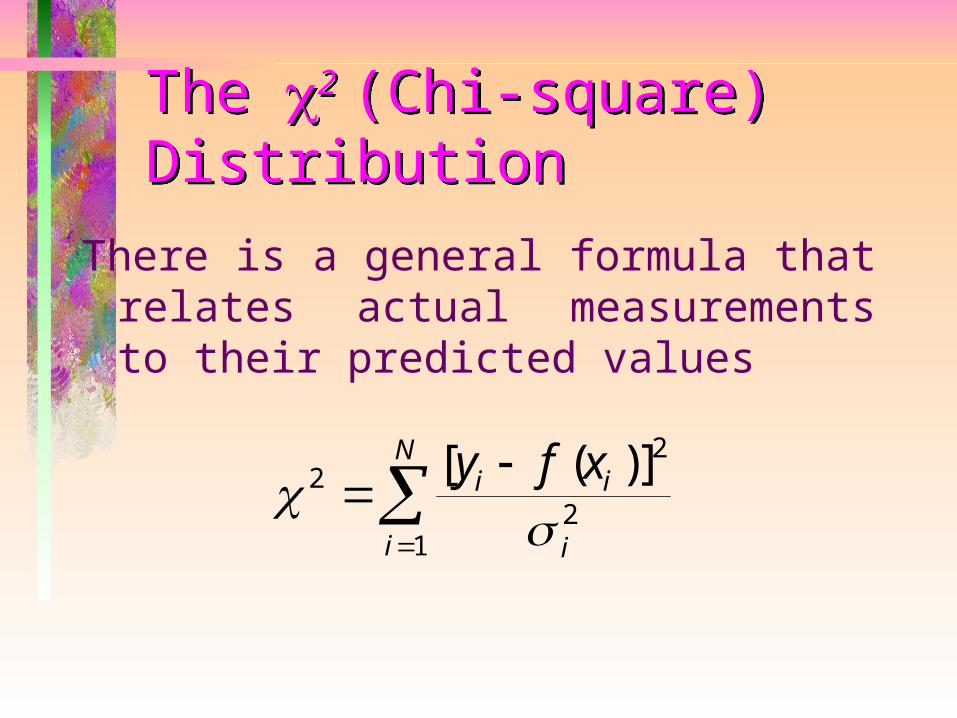
The 2 (Chi-square) Distribution
There is a general formula that relates actual measurements to their predicted values
22
21
[ ( )]y f xi i
ii
N

The 2 (Chi-square) Distribution
A special (and very useful) application of the 2 distribution is to frequency data
22
1
( )n f
fi i
ii
N

Exercise• In your hospital, you have had 83
cases of iatrogenic strep infection in your last 725 patients. St. Elsewhere, across town, reports 35 cases of strep in their last 416 patients.
• Do you need to review your infection control policies?

Analysis If your infection control policy is
roughly as effective as St. Elsewhere’s, we would expect that the rates of strep infection for the two hospitals would be similar. The expected frequency, then would be the average 83 35
725 4161181141
01034
.

Calculating 2
First, calculate the expected frequencies at your hospital (f1) and St. Elsewhere (f2)
f casesf cases
1
2
725 01034 75416 01034 43
..
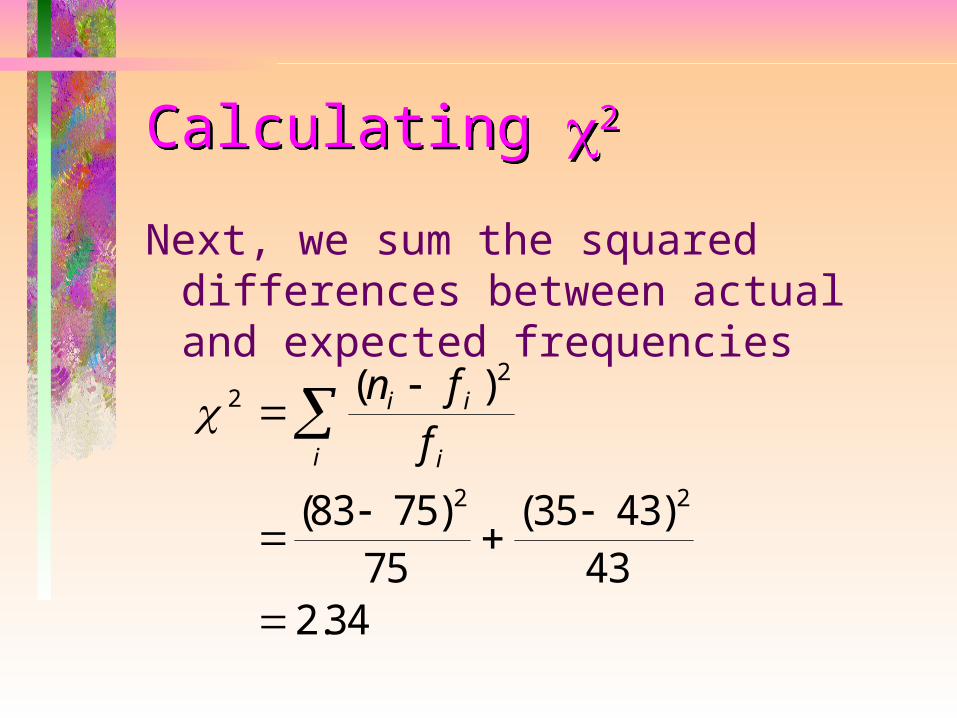
Calculating 2
Next, we sum the squared differences between actual and expected frequencies 2
2
2 283 7575
35 4343
2 34
( )
( ) ( )
.
n ff
i i
ii
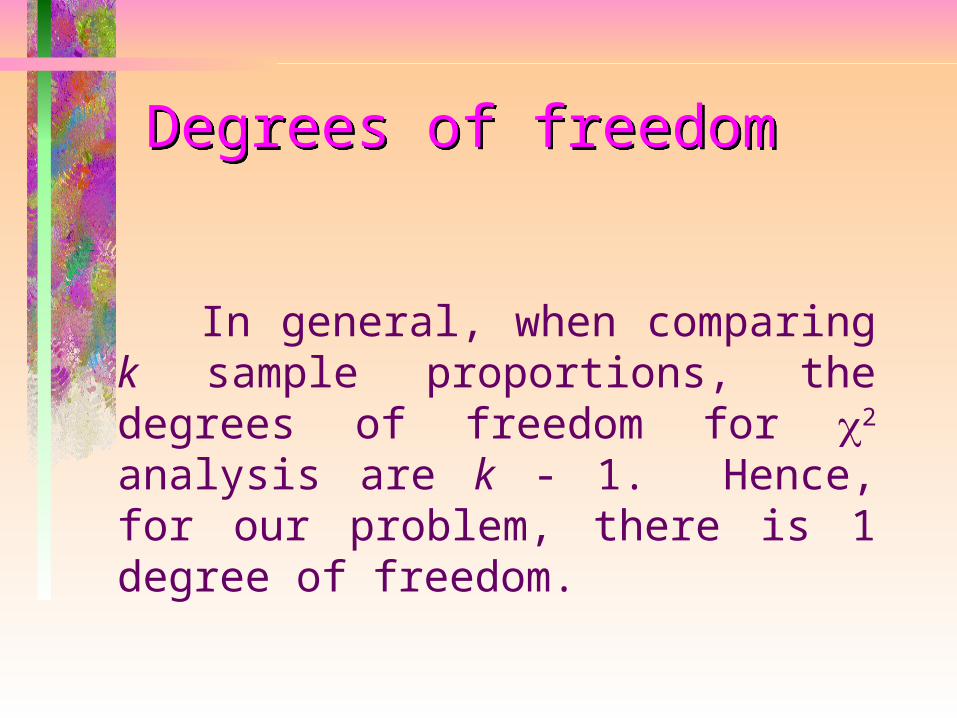
Degrees of freedom
In general, when comparing k sample proportions, the degrees of freedom for 2 analysis are k - 1. Hence, for our problem, there is 1 degree of freedom.

Conclusion• A table of 2 values lists 3.841 as
the 2 corresponding to a probability of 0.05.
• So the variation (2=2.34)between strep infection rates at the two hospitals is within statistically-predicted limits, and therefore is not significant.

The F distribution• The F distribution predicts the
expected differences between the variances of two samples
• This distribution has also been called Snedecor’s F distribution, Fisher distribution, and variance ratio distribution
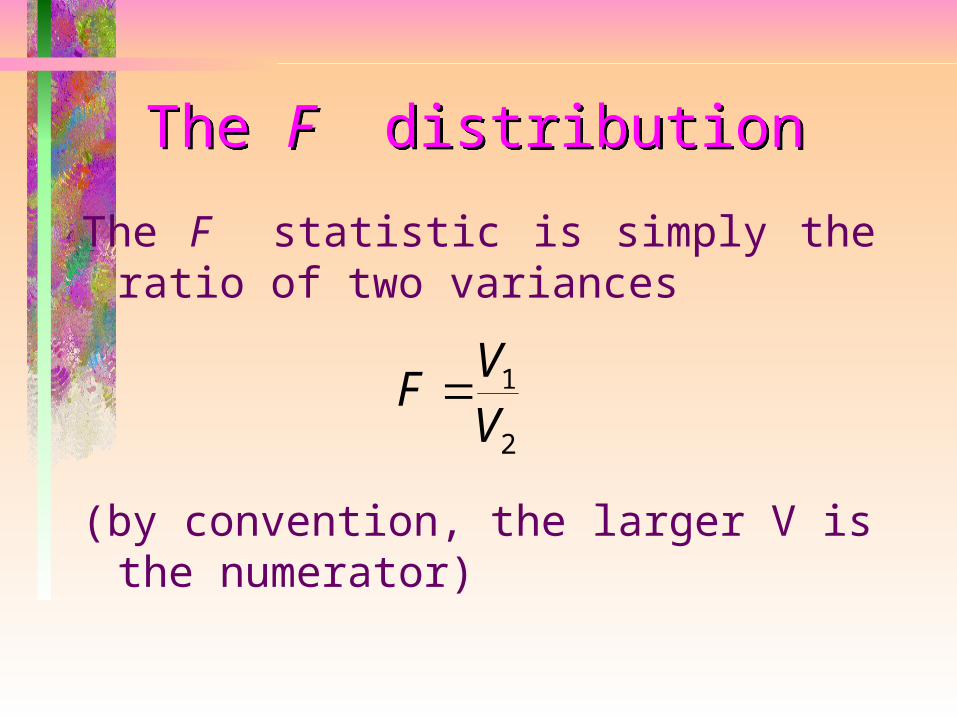
The F distributionThe F statistic is simply the ratio of
two variances
(by convention, the larger V is the numerator)
F VV
1
2

Applications of the F distribution
There are several ways the F distribution can be used. Applications of the F statistic are part of a more general type of statistical analysis called analysis of variance (ANOVA). We’ll see more about ANOVA later.

Example• You’re asked to do a “quick and
dirty” correlation between three whole blood glucose analyzers. You prick your finger and measure your blood glucose four times on each of the analyzers.
• Are the results equivalent?

DataAnalyzer 1 Analyzer 2 Analyzer 3
71 90 72
75 80 77
65 86 76
69 84 79
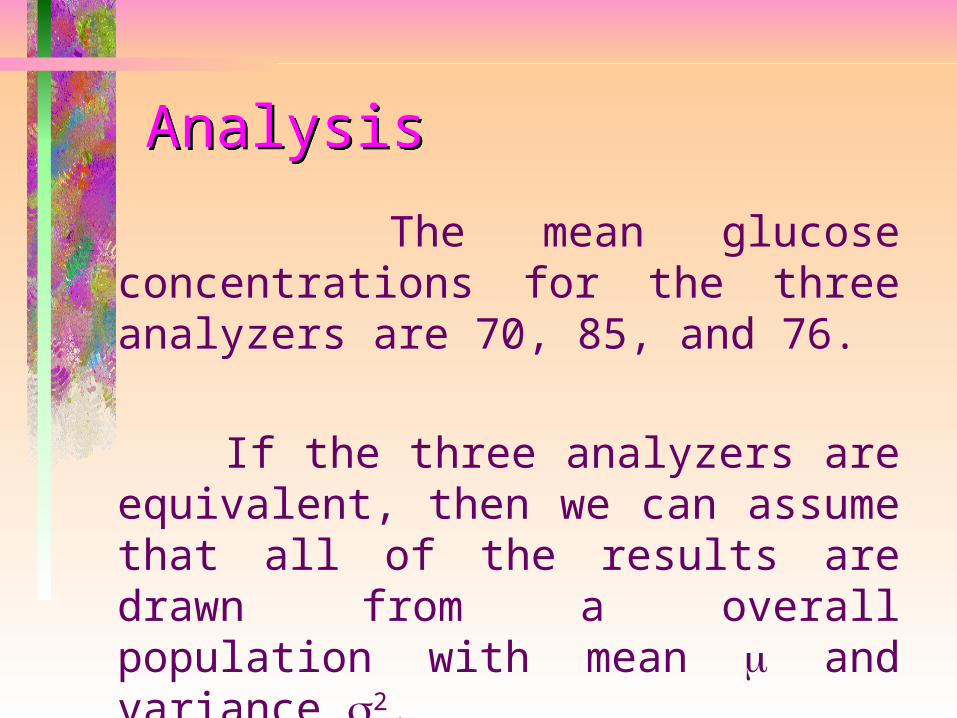
Analysis The mean glucose concentrations
for the three analyzers are 70, 85, and 76.
If the three analyzers are equivalent, then we can assume that all of the results are drawn from a overall population with mean and variance 2.
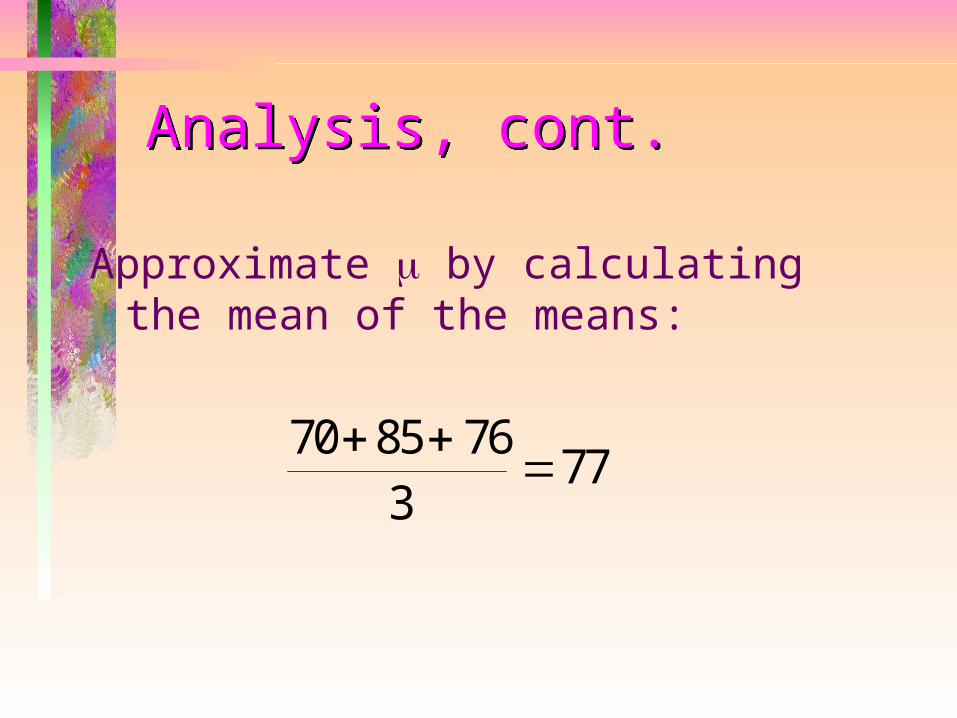
Analysis, cont.
Approximate by calculating the mean of the means:
70 85 763
77
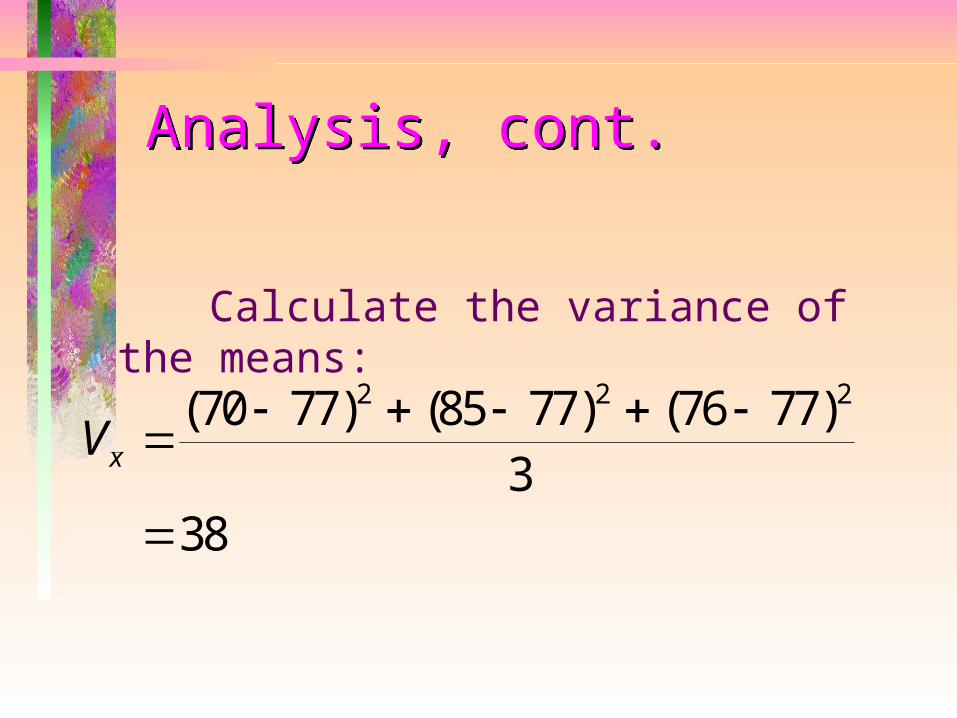
Analysis, cont.
Calculate the variance of the means:Vx
( ) ( ) ( )70 77 85 77 76 773
38
2 2 2
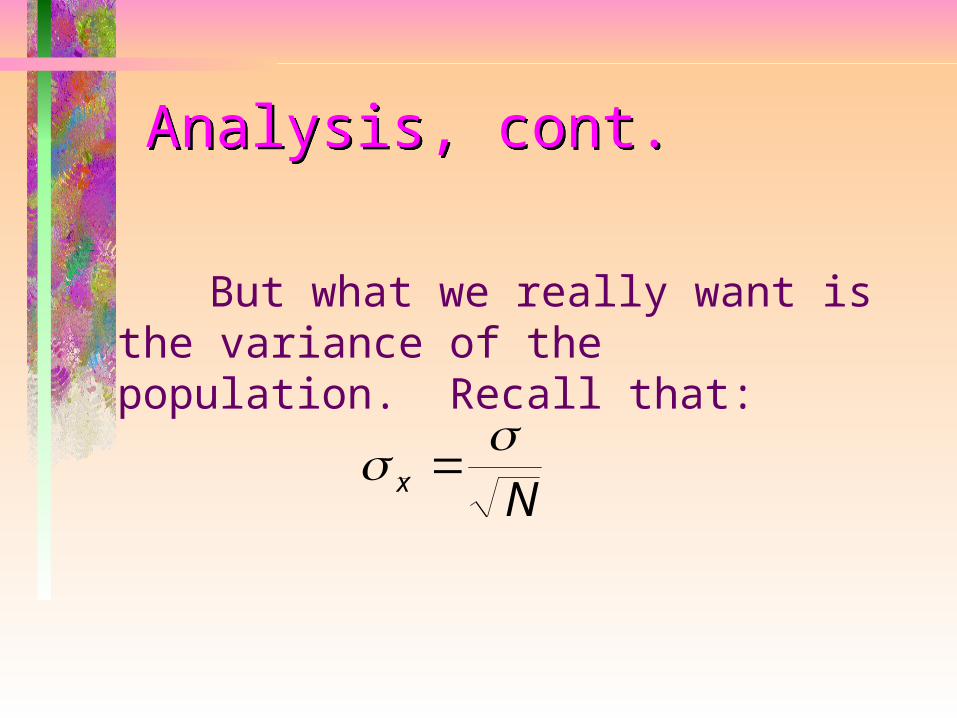
Analysis, cont.
But what we really want is the variance of the population. Recall that:
x N

Analysis, cont.Since we just calculated
we can solve for
Vx x 2 38
VN N
N
x x
x
22 2
2 2 4 38 152

Analysis, cont.• So we now have an estimate of the
population variance, which we’d like to compare to the real variance to see whether they differ. But what is the real variance?
• We don’t know, but we can calculate the variance based on our individual measurements.

Analysis, cont. If all the data were drawn from a
larger population, we can assume that the variances are the same, and we can simply average the variances for the three data sets.
V V V1 2 3
314 4
.
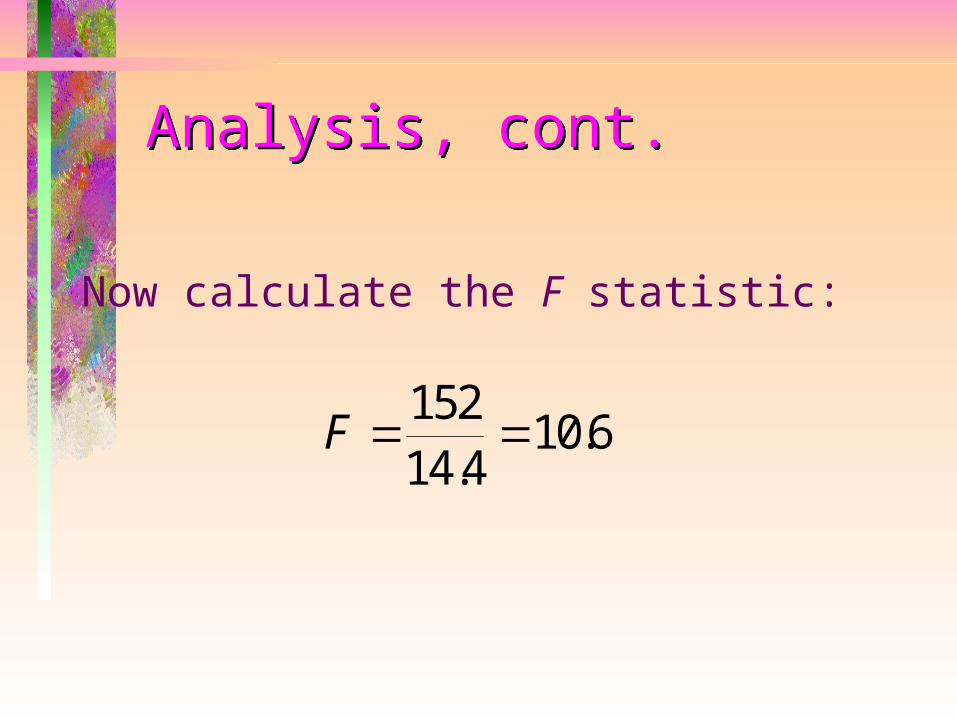
Analysis, cont.
Now calculate the F statistic:
F 15214 4
10 6.
.

Conclusion A table of F values indicates that
4.26 is the limit for the F statistic at a 95% confidence level (when the appropriate degrees of freedom are selected). Our value of 10.6 exceeds that, so we conclude that there is significant variation between the analyzers.

Analysis of paired data• For certain types of laboratory
studies, the data we gather is paired
• We typically want to know how closely the paired data agree
• We need quantitative measures of the extent to which the data agree or disagree?

Examples of paired data
• Method of correlation

Correlation
0 5 10 15 20 25 30 35 40 45 500
5
10
15
20
25
30
35
40
45
50

Linear regression (least squares)
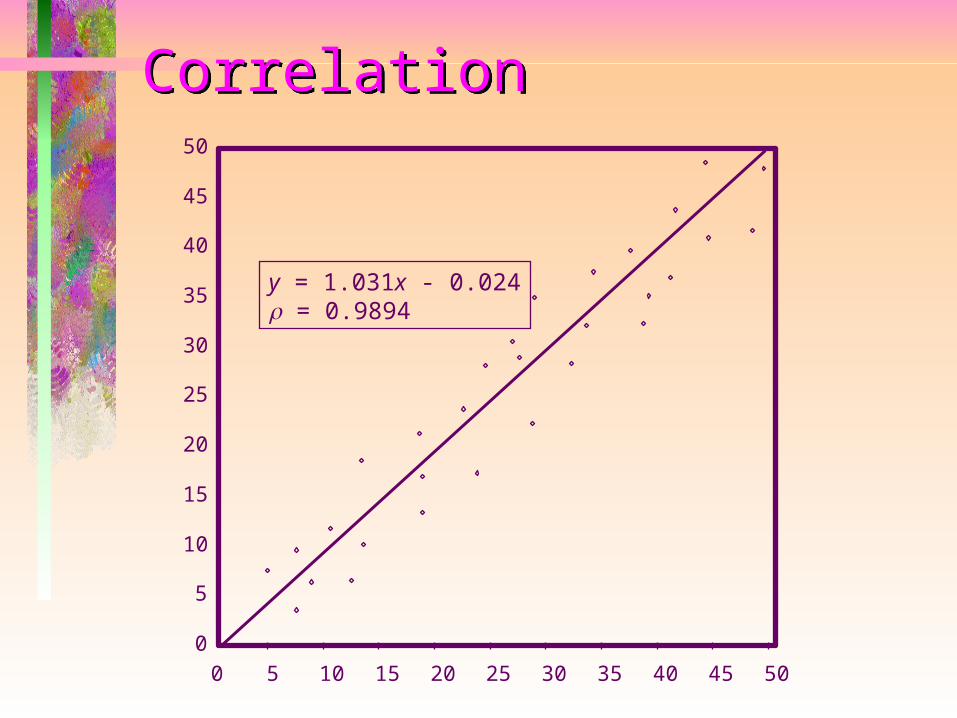
Linear regression analysis generates an equation for a straight line
y = mx + bwhere m is the slope of the line and b is the value of y when x = 0 (the y-intercept).
The calculated equation minimizes the differences between actual y values and the linear regression line.

Correlation
0 5 10 15 20 25 30 35 40 45 500
5
10
15
20
25
30
35
40
45
50
y = 1.031x - 0.024

Covariance
Do x and y values vary in concert, or randomly?
cov( , ) ( )( )x yN
y y x xi ii
1
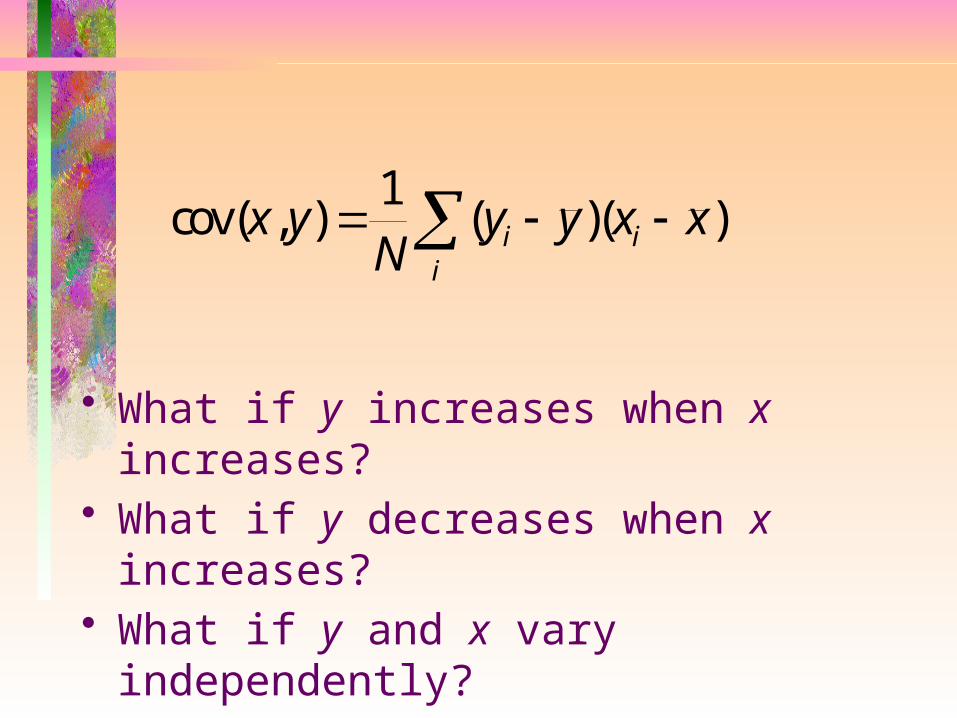
• What if y increases when x increases?
• What if y decreases when x increases?
• What if y and x vary independently?
cov( , ) ( )( )x yN
y y x xi ii
1
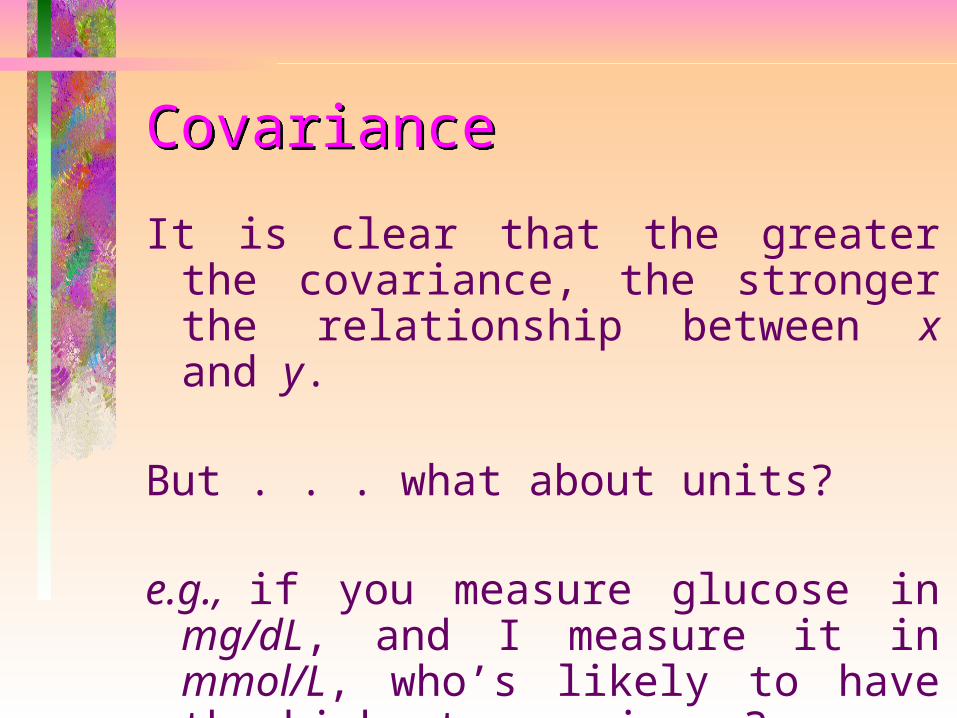
CovarianceIt is clear that the greater the
covariance, the stronger the relationship between x and y.
But . . . what about units?
e.g., if you measure glucose in mg/dL, and I measure it in mmol/L, who’s likely to have the highest covariance?
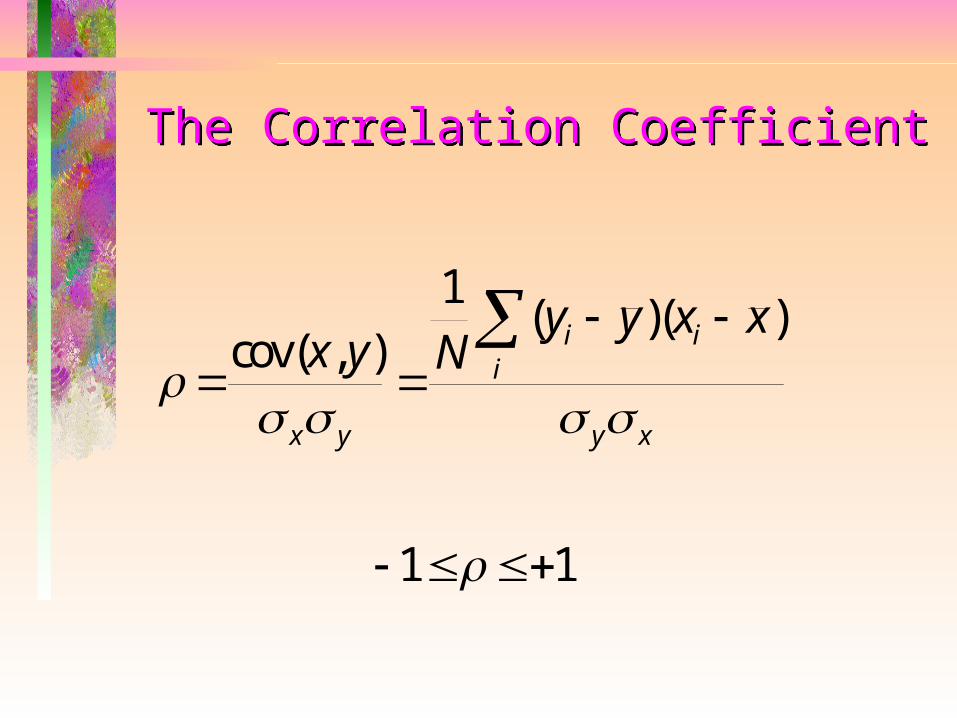
The Correlation Coefficient
cov( , )( )( )
x y Ny y x x
x y
i ii
y x
1
1 1
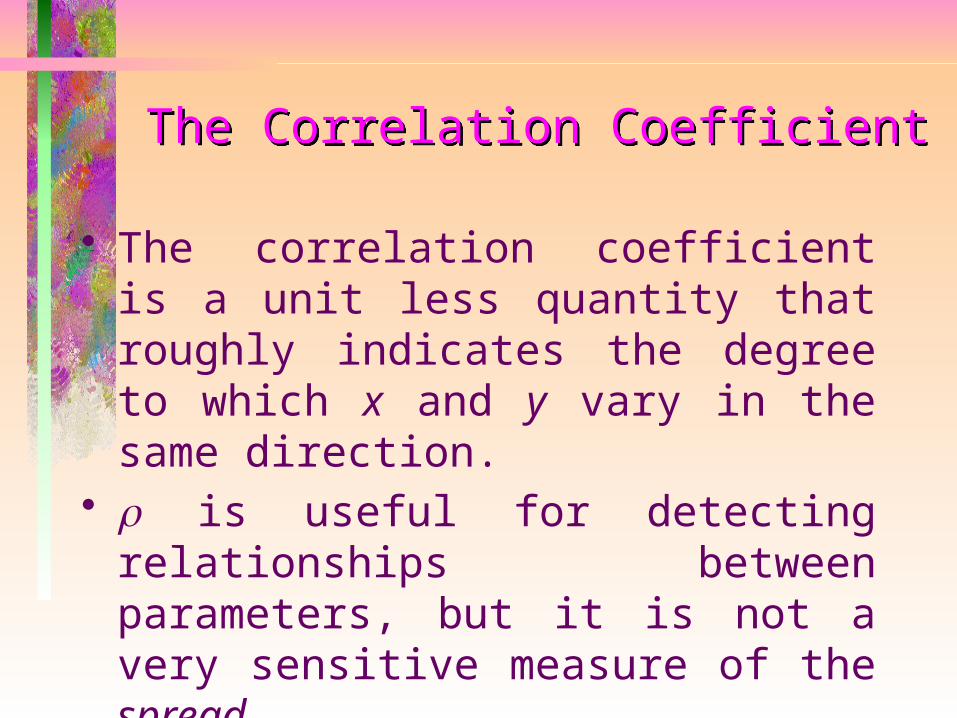
The Correlation Coefficient• The correlation coefficient is a unit
less quantity that roughly indicates the degree to which x and y vary in the same direction.
• is useful for detecting relationships between parameters, but it is not a very sensitive measure of the spread.

Correlation
0 5 10 15 20 25 30 35 40 45 500
5
10
15
20
25
30
35
40
45
50
y = 1.031x - 0.024 = 0.9986
Correlation
0 5 10 15 20 25 30 35 40 45 500
5
10
15
20
25
30
35
40
45
50
y = 1.031x - 0.024 = 0.9894
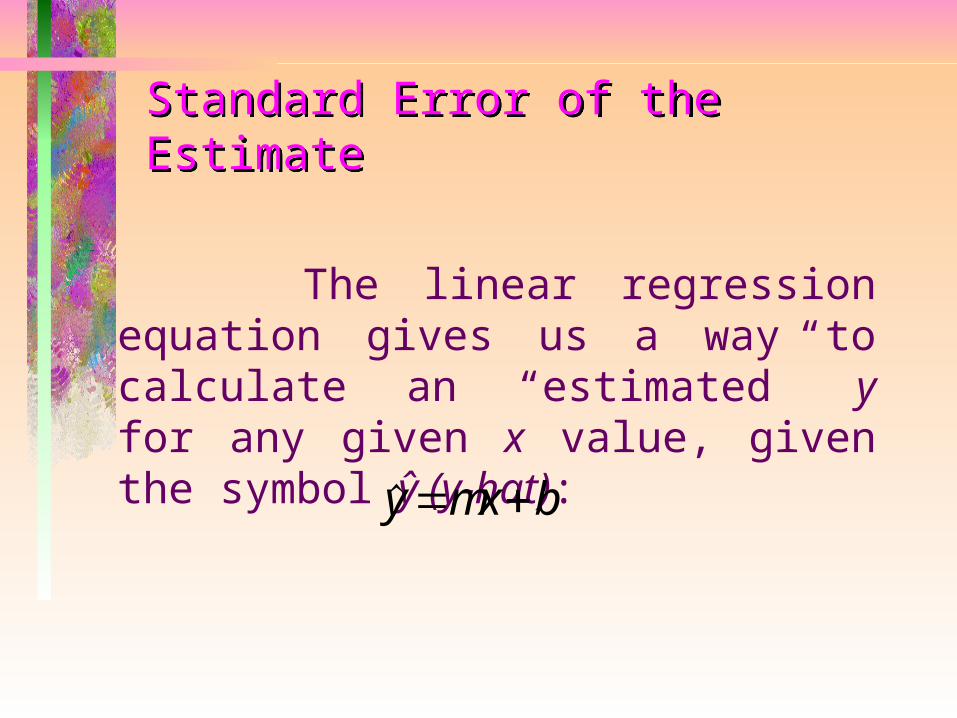
Standard Error of the Estimate
The linear regression equation gives us a way to calculate an “estimated” y for any given x value, given the symbol ŷ (y-hat):
y mx b
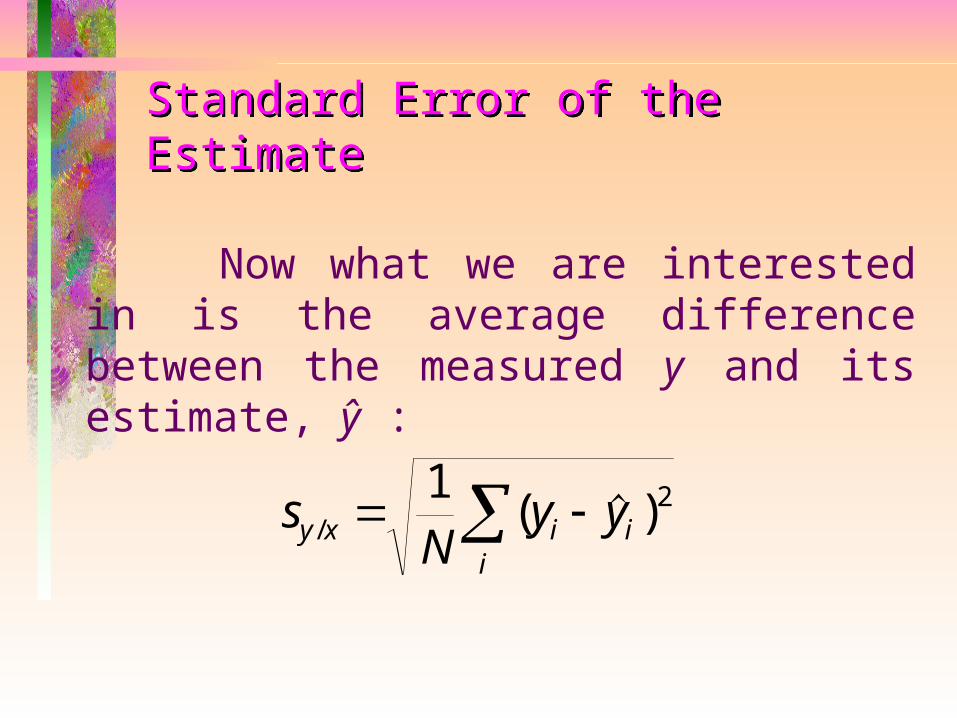
Standard Error of the Estimate
Now what we are interested in is the average difference between the measured y and its estimate, ŷ :
sN
y yy x i ii
/ ( ) 1 2

Correlation
0 5 10 15 20 25 30 35 40 45 500
5
10
15
20
25
30
35
40
45
50
y = 1.031x - 0.024 = 0.9986sy/x=1.83

Correlation
0 5 10 15 20 25 30 35 40 45 500
5
10
15
20
25
30
35
40
45
50
y = 1.031x - 0.024 = 0.9894sy/x = 5.32

Standard Error of the Estimate
If we assume that the errors in the y measurements are Gaussian (is that a safe assumption?), then the standard error of the estimate gives us the boundaries within which 67% of the y values will fall.
2sy/x defines the 95% boundaries..
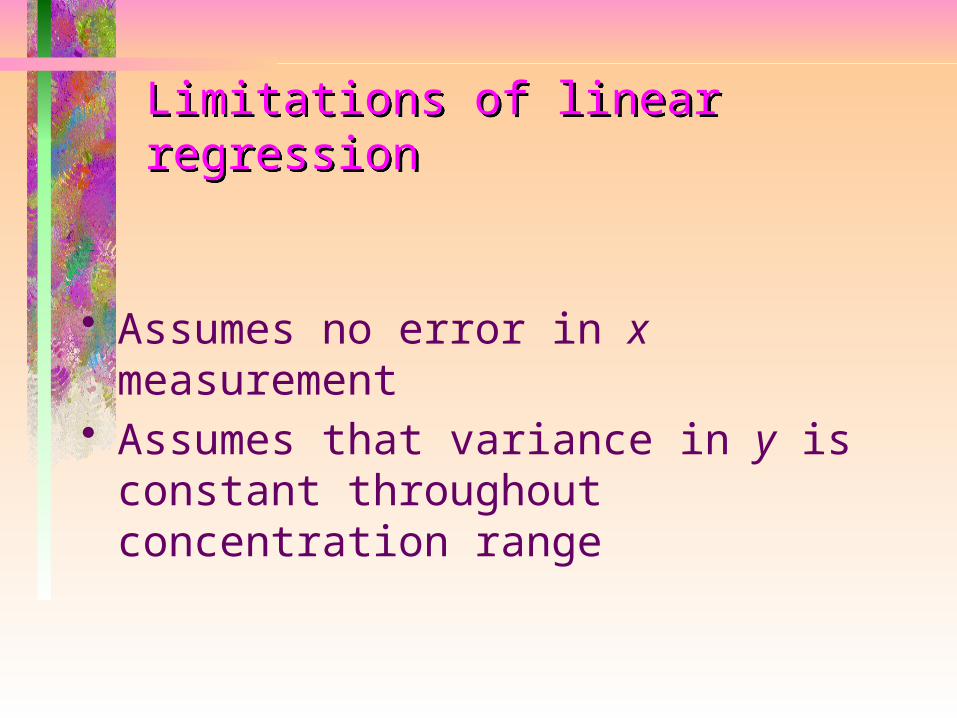
Limitations of linear regression
• Assumes no error in x measurement
• Assumes that variance in y is constant throughout concentration range
Alternative approaches• Weighted linear regression
analysis can compensate for non-constant variance among y measurements
• Deming regression analysis takes into account variance in the x measurements
• Weighted Deming regression analysis allows for both
Evaluating method performance
• Precision• Sensitivity• Linearity

Limitation of linear regression method
If the analytical method has a high variance (CV), it is likely that small deviations from linearity will not be detected due to the high standard error of the estimate
Ways to evaluate linearity• Visual/linear regression• Quadratic regression

Quadratic regressionRecall that, for linear data, the
relationship between x and y can be expressed as
y = f(x) = a + bx
Quadratic regressionA curve is described by the
quadratic equation:
y = f(x) = a + bx + cx2
which is identical to the linear equation except for the addition of the cx2 term.

Quadratic regression
It should be clear that the smaller the x2 coefficient, c, the closer the data are to linear (since the equation reduces to the linear form when c approaches 0).
What is the drawback to this approach?

Ways to evaluate linearity• Visual/linear regression• Quadratic regression• Lack-of-fit analysis
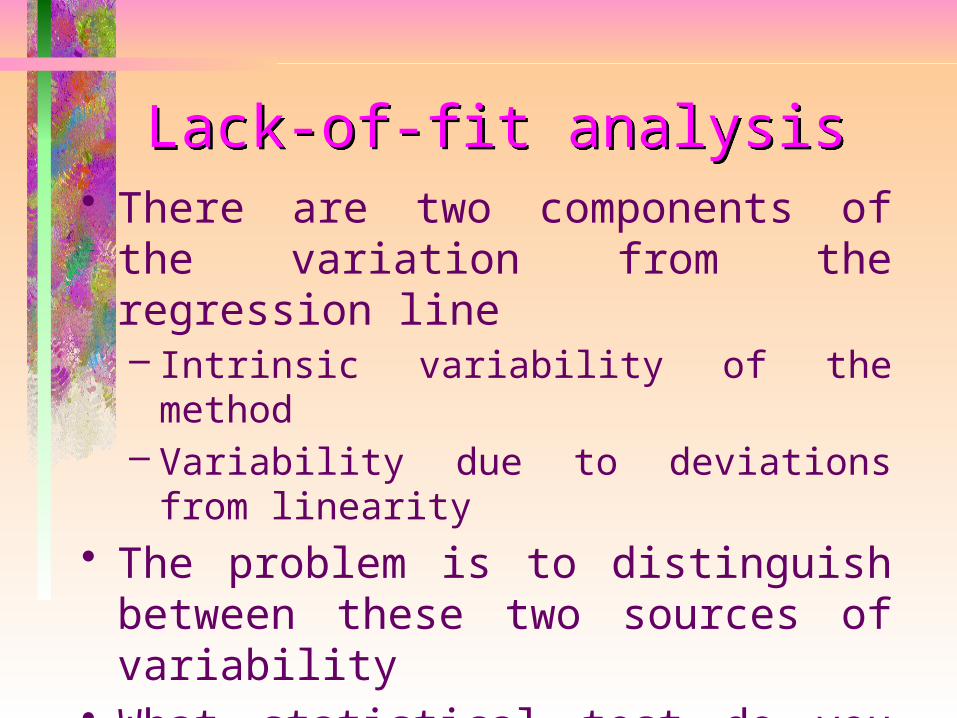
Lack-of-fit analysis• There are two components of the
variation from the regression line– Intrinsic variability of the method– Variability due to deviations from
linearity• The problem is to distinguish
between these two sources of variability
• What statistical test do you think is appropriate?
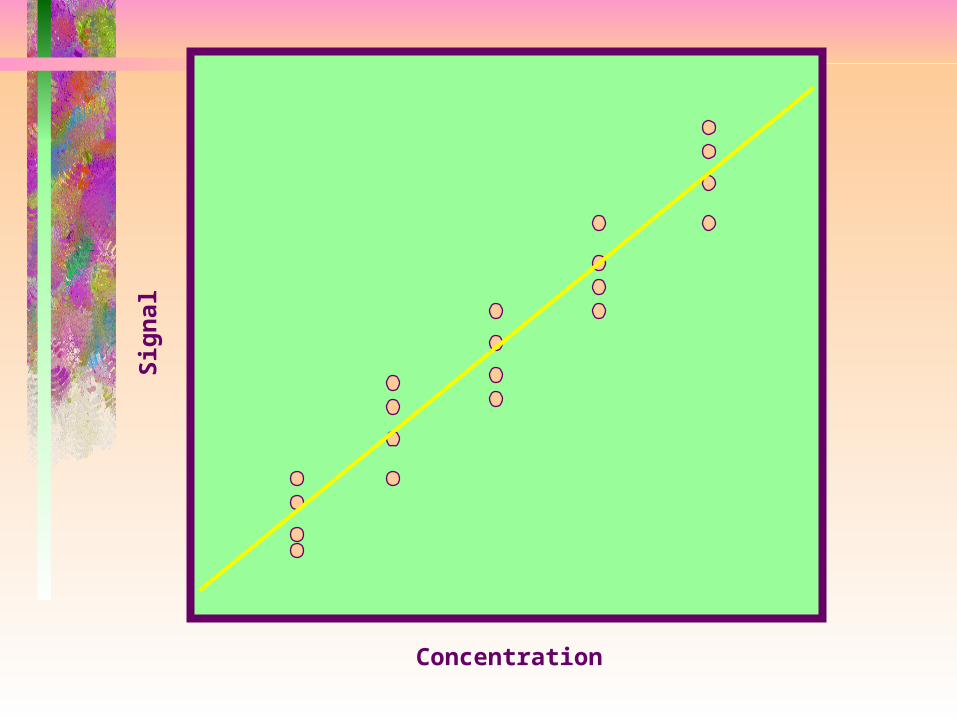
Sign
al
Concentration

Lack-of-fit analysis
The ANOVA technique requires that method variance is constant at all concentrations. Cochran’s test is used to test whether this is the case.
VV
pL
ii
0 5981 0 05. ( . )

Lack-of-fit method calculations• Total sum of the squares: the variance
calculated from all of the y values• Linear regression sum of the squares:
the variance of y values from the regression line
• Residual sum of the squares: difference between TSS and LSS
• Lack of fit sum of the squares: the RSS minus the pure error (sum of variances)
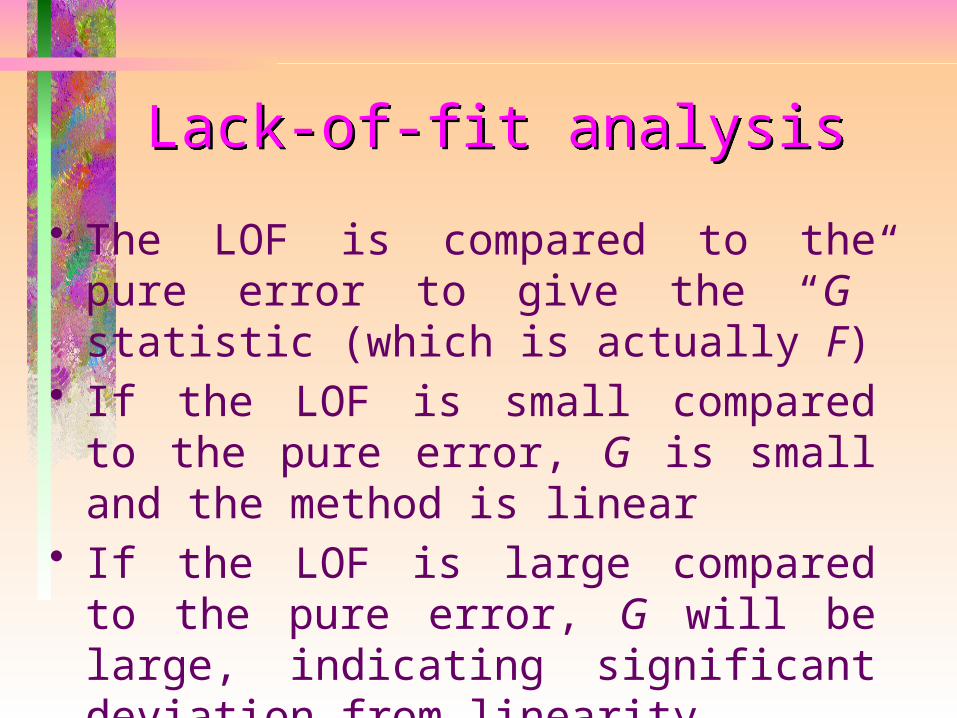
Lack-of-fit analysis• The LOF is compared to the pure
error to give the “G” statistic (which is actually F)
• If the LOF is small compared to the pure error, G is small and the method is linear
• If the LOF is large compared to the pure error, G will be large, indicating significant deviation from linearity

Significance limits for G
• 90% confidence = 2.49• 95% confidence = 3.29• 99% confidence = 5.42

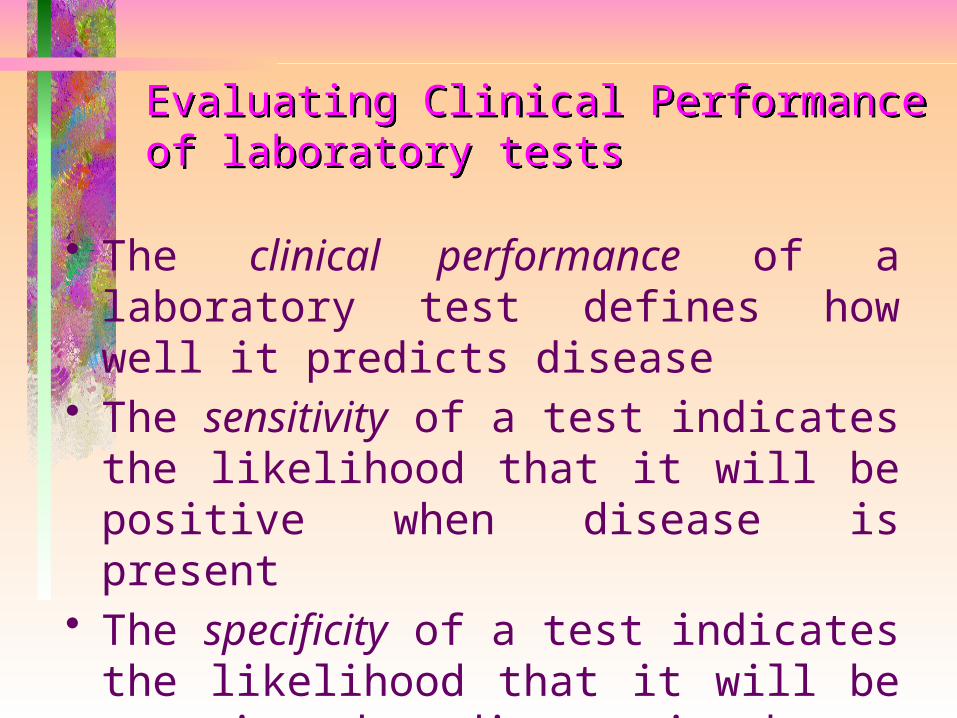
Evaluating Clinical Performance of laboratory tests
• The clinical performance of a laboratory test defines how well it predicts disease
• The sensitivity of a test indicates the likelihood that it will be positive when disease is present

Clinical Sensitivity
If TP as the number of “true positives”, and FN is the number of “false negatives”, the sensitivity is defined as:
Sensitivity TPTP FN
100

Example Of 25 admitted cocaine abusers,
23 tested positive for urinary benzoylecgonine and 2 tested negative. What is the sensitivity of the urine screen?
2323 2
100 92%
Evaluating Clinical Performance of laboratory tests
• The clinical performance of a laboratory test defines how well it predicts disease
• The sensitivity of a test indicates the likelihood that it will be positive when disease is present
• The specificity of a test indicates the likelihood that it will be negative when disease is absent

Clinical Specificity
If TN is the number of “true negative” results, and FP is the number of falsely positive results, the specificity is defined as:
Specificity TNTN FP
100

Example
What would you guess is the specificity of any particular clinical laboratory test? (Choose any one you want)

Answer Since reference ranges are
customarily set to include the central 95% of values in healthy subjects, we expect 5% of values from healthy people to be “abnormal”--this is the false positive rate.
Hence, the specificity of most clinical tests is no better than 95%.

Sensitivity vs. Specificity• Sensitivity and specificity are
inversely related.

Sensitivity vs. Specificity• Sensitivity and specificity are
inversely related.• How do we determine the best
compromise between sensitivity and specificity?
Evaluating Clinical Performance of laboratory tests
• The sensitivity of a test indicates the likelihood that it will be positive when disease is present
• The specificity of a test indicates the likelihood that it will be negative when disease is absent
• The predictive value of a test indicates the probability that the test result correctly classifies a patient
Predictive Value The predictive value of a clinical
laboratory test takes into account the prevalence of a certain disease, to quantify the probability that a positive test is associated with the disease in a randomly-selected individual, or alternatively, that a negative test is associated with health.

Illustration• Suppose you have invented a new
screening test for Addison disease.• The test correctly identified 98 of 100
patients with confirmed Addison disease (What is the sensitivity?)
• The test was positive in only 2 of 1000 patients with no evidence of Addison disease (What is the specificity?)

Test performance
• The sensitivity is 98.0%• The specificity is 99.8%• But Addison disease is a rare
disorder--incidence = 1:10,000• What happens if we screen 1
million people?

Analysis• In 1 million people, there will be 100
cases of Addison disease.• Our test will identify 98 of these
cases (TP)• Of the 999,900 non-Addison subjects,
the test will be positive in 0.2%, or about 2,000 (FP).

Predictive value of the positive test
The predictive value is the % of all positives that are true positives:
PV TPTP FP
100
9898 2000
100
4 7%.

What about the negative predictive value?
• TN = 999,900 - 2000 = 997,900• FN = 100 * 0.002 = 0 (or 1)
PV TNTN FN
100
997 900997 900 1
100
100%
,,

Summary of predictive value
Predictive value describes the usefulness of a clinical laboratory test in the real world.
Or does it?

Lessons about predictive value
• Even when you have a very good test, it is generally not cost effective to screen for diseases which have low incidence in the general population. Exception?
• The higher the clinical suspicion, the better the predictive value of the test. Why?
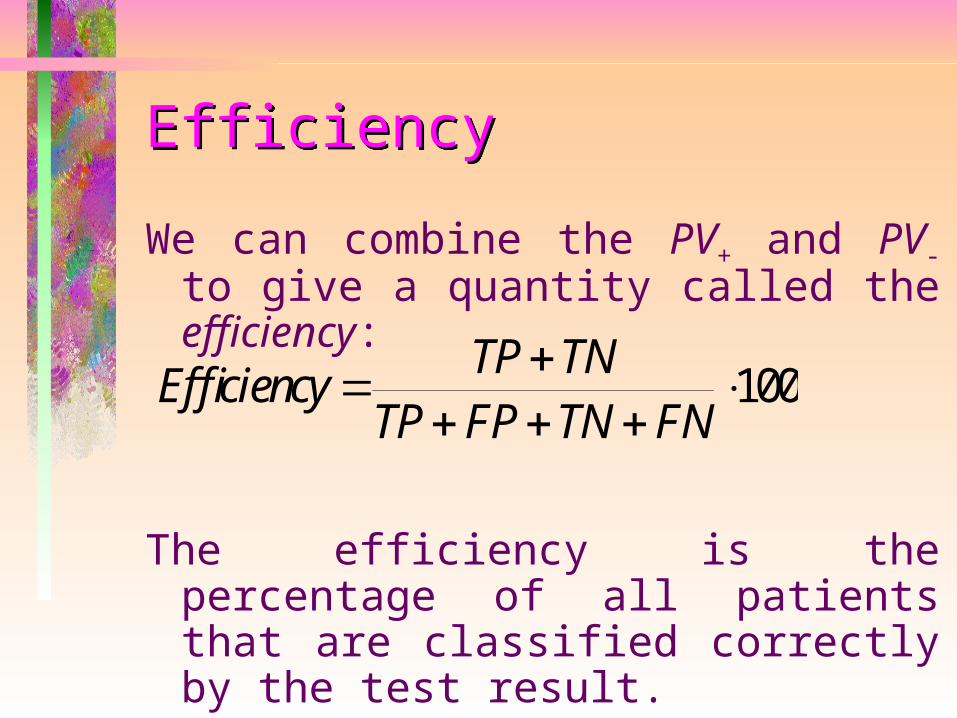
EfficiencyWe can combine the PV+ and PV- to
give a quantity called the efficiency:
The efficiency is the percentage of all patients that are classified correctly by the test result.
Efficiency TP TNTP FP TN FN
100

Efficiency of our Addison screen
98 997 90098 2000 997 900 2
100 99 8%
,
,.

332
Normal Distribution &Multivariate Normal Distribution
• For a single variable, the normal density function is:
• For variables in higher dimensions, this generalizes to:
where the mean is now a d-dimensional vector, S is a d x d covariance matrix and |S| is the determinant of S:

Principal Component Analysis• Given N data vectors from k-dimensions, find c <= k
orthogonal vectors that can be best used to represent data – The original data set is reduced to one consisting of
N data vectors on c principal components (reduced dimensions)
• Each data vector is a linear combination of the c principal component vectors
• Works for numeric data only• Used when the number of dimensions is large

Principal Component Analysis
X1
X2
Y1Y2

Principal Component AnalysisAimed at finding new co-ordinate
system which has some characteristics.
M=[4.5 4.25 ]Cov Matrix [ 2.57 1.86 ] [ 1.86 6.21]Eigen Values = 6.99, 1.79Eigen Vectors = [ 0.387 0.922 ] [ -0.922 0.387 ]

www.ritchcenter.com/nbv

However in some cases it is not possible to have PCA working.

Canonical Analysis

Unlike PCA which takes global mean and covariance, this takes between the group and within the group covariance matrix and the calculates canonical axes.

www.ritchcenter.com/nbv

Thanks