fra 2015 - forest futures methodology - fao
TRANSCRIPT

FRA 2015
Forest Futures Methodology
december, 2012
Forest resources Assessment Working Paper 182

FOOD AND AGRICULTURE ORGANIZATION OF THE UNITED NATIONSRome, 2012
FRA 2015 Forest Futures Methodology
Forest Resources Assessment Working Paper 182

The designations employed and the presentation of material in this information product do not imply the expression of any opinion whatsoever on the part of the Food and Agriculture Organization of the United Nations (FAO) concerning the legal or development status of any country, territory, city or area or of its authorities, or concerning the delimitation of its frontiers or boundaries. The mention of specific companies or products of manufacturers, whether or not these have been patented, does not imply that these have been endorsed or recommended by FAO in preference to others of a similar nature that are not mentioned.
All rights reserved. FAO encourages the reproduction and dissemination of material in this information product. Non-commercial uses will be authorized free of charge, upon request. Reproduction for resale or other commercial purposes, including educational purposes, may incur fees. Applications for permission to reproduce or disseminate FAO copyright materials, and all queries concerning rights and licences, should be addressed by e-mail to [email protected] or to the Chief, Publishing Policy and Support Branch, Office of Knowledge Exchange, Research and Extension, FAO, Viale delle Terme di Caracalla, 00153 Rome, Italy.

Contents
Acknowledgements vExecutive Summary vi
1. Background 1
2. Objective and anticipated outputs 3
3. Methodology 43.1 General approach 43.2 Integrated assessment 53.3 Existing outlook studies 6
3.3.1 Agricultural outlook 63.3.2 Forest sector outlook studies 6
3.4 Historical trend analysis: Looking back in order to look forward 73.4.1 Analysis of forest change assessed by the remote sensing survey 73.4.2 Analysis of historical deforestation 8
3.5 Modeling frameworks 93.5.1 Spatial allocation of projected forest change 93.5.2 Type and function of forests at risk of being lost 10
3.6 Scenario exploration and discussion platforms 103.6.1 Shared Socio-Economic Pathways 103.6.2 Scenario exploration 113.6.3 Discussion platforms 11
6. References 12
ANNEx I. Planted forest outlook 14
ANNEx II. Socio-economic and biophysical variable maps used for the historical trend analyses 16

v
Acknowledgements
This report was prepared by Marieke Sandker under supervision of Kenneth MacDicken. Forest Futures is a collaborative research activity and an extensive group of experts has contributed to the design of the study. In specific we would like to thank the Global Forest Resources Assessment (FRA) advisory group and participants of the technical consultations held in Ispra, Rome and Jacksonville in 2012 for their contributions. FAO has produced this publication with financial support from the SFM in a Changing Climate Programme funded by the Government of Finland. We thank the FRA team and other colleagues in the FAO Forestry Department, and Dominique van der Mensbrugghe and his team from the FAO Economic and Social Development Department. We furthermore would like to thank Robert Gilmore Pontius Jr and Yelena Finegold from Clark University for their support on spatial landuse change modeling and their contribution on that subject in this paper.

vi
Executive summary
Forest Futures will combine the projected global needs for food, feed, renewable energy and timber to envision their impact on forest resources and identify where competition for land will likely take place in the future. The Forest Futures Initiative will be based on a participatory approach backed-up by some high quality model inputs. Information will be provided on future forest land changes and protected areas at risk of being converted, as well as future production forest. The role of trade and of planted forest in wood supply will be discussed. This knowledge is crucial to and in high demand with forest industry and international policy processes.
A global analysis confronting forest change data with spatial databases of socio-economic and biophysical variables should give insight and a better understanding of processes driving forest loss and gain. These insights will inform the modeling process and function as a starting point for the creation of a future vision of global forest resources.
Forest Futures will build on existing outlook processes within FAO, such as the regional forestry sector outlook studies, the World Agriculture towards 2030/2050 study, and the Global Agro-Ecological Zones assessment of agricultural resources and potential, which form an extended assembly of state-of-the-art and expert knowledge. Projections on agriculture expansion, forest product demand, and agriculture suitability under a changing climate, resulting from these studies are considered in an integrated assessment process. The information is combined and translated into impacts on future forest resources to produce an informed view on global forests up to 2030/2050.
In the formulation and validation of scenarios for global forest resources, Forest Futures will draw from FRA’s vast pool of experts. Concerning the underlying exogenous assumptions, the Shared Socio-Economic Pathways (SSPs) will be used; a set of internally consistent global narratives. These scenarios will be discussed with national correspondents (notably of developing nations and countries with high forest change rates) and representatives of the International Forest Industry Association.

FRA 2015 – Forest Futures Methodology
1
1. Background
The Global Forest Resources Assessment (FRA) compiles and analyses forestry data provided by countries and published every 5-10 years since 1948. A user survey was launched in 2012, where FRA users indicated they are keenly interested in forest area and forest area change. Specifically they are keen to understand natural forest and planted forest area dynamics, to get a perspective on production and conservation. There is strong interest in not only understanding past forest change, but also having an informed view of what changes are likely to occur in forest area and what the impacts of these changes will be on production forestry and forest conservation. An improved understanding of these processes is key to the formulation and implementation of effective policies like Reducing Emissions from Deforestation and forest Degradation (REDD).
Forests are dynamic and forest areas reported by countries to the FRA only give us a snapshot, or a time series of snapshots, which is very useful but inevitably gives an incomplete picture of forests and their dynamics. Forest gain or loss obtained by comparing forest areas over time, gives the balance of a series of processes increasing and decreasing forest as shown in Figure 1. An increase in forest area can happen in two ways, either through afforestation (i.e. planting of trees on land that was not previously forested) or through natural expansion of forests. Reforestation doesn’t result in change of forest area following the FAO definition of forest. A reduction in forest area can happen either through natural disasters (where the area is incapable of regenerating within a reasonable time span) or through deforestation (i.e. human induced forest clearing where the land is converted into another use). Deforestation is by far the larger of these two processes reducing forest area.
FRA 2010 (FAO 2010a) provided estimates of deforestation or gross forest loss by subtracting reported afforestation and natural expansion from reported net change to calculate implied deforestation. There are a number of issues related to this approach. One is the lack of information; only 159 out of 233 countries reported afforestation and even fewer were able to report on natural expansion. The other is related to reliability of reported data.
FIGURE 1Forest change dynamics (adopted from FRA 2010)
Forest change dynamics
Forest Other land
DeforestationNatural disasters
AfforestationNatural expansion

FRA 2015 – Forest Futures Methodology
2
A more accurate estimate of the global forest area and its dynamics is given by the FRA’s global remote sensing survey (RSS) undertaken by FAO, its member countries, the EC Joint Research Centre (JRC) and other partners since 2008 (FAO & JRC 2012). The RSS uses a systematic sampling design with 10 km x 10 km sample plots on each longitude and latitude intersection, providing a sampling intensity of about 1 percent of the global land surface. The RSS found significant net gains in forest area in the boreal (0.9 million ha/year), subtropical (1.1 million ha/year) and temperate domain (0.9 million ha/year) between 1990 and 2005. In contrast, the tropical domain had a net loss of forest area of 6.8 million ha/year for that same period, nearly 2.5 times the net forest area gained in the other three domains combined (FAO & JRC 2012).
Deforestation is the result of many processes driven by multiple causes. We can distinguish between underlying causes and direct causes of land conversion, referred to as ‘drivers and pressures’ by Smith et al. (2010) or ‘proximate and underlying causes’ by Geist and Lambin (2001). Underlying causes (e.g. societal trends, socio-economic and technology factors) determine the degree of direct causes (e.g. conversion to cropland, clear-cut for logging) resulting in landuse change. The character of deforestation varies by geopolitical location. FRA’s pan-tropical remote sensing survey analyzing forest area change showed that in Africa direct conversion of forest area to small-scale agriculture was the most important land change process over the period 1980-2000 (56% of total area change), while in Latin America direct conversion of forest area to large-scale agriculture was most important for that period (41% of total area change). In Asia the share of processes contributing to total area change was more evenly spread, and compared to the other regions the most striking difference is the greater importance of intensification of agriculture in shifting cultivation areas (21% of total area change against 7% in Africa and 3% in Latin America). Though this analysis helps us to characterize deforestation, it doesn’t directly quantify the causes of forest loss.
Kissinger et al. (2012) do quantify the importance of drivers of deforestation by region from information reported by countries in their REDD+ Readiness Preparation Proposals (RPPs), which in most cases concerns estimates. According to their estimations between 70-80% of forest loss is converted into agriculture in Africa, around 70% in (sub)tropical Asia and >90% in Latin America, though no distinction is made between conversion to cropland and pasture land. A 2006 FRA working paper combining FAOSTAT data interpretation and expert estimation, estimates that at the global scale 75% of foregone forest is converted into cropland, 23% is converted into grassland and woodland (presumably driven by pasture extension and forest degrading activities/natural events), and 1-2% into urban land (Holmgren 2006). Apart from conversion to agriculture, other commonly referred direct causes of forest loss are forest clearing for wood (including fuelwood overharvesting), expansion of urban areas, infrastructure and mining, and irreversible damage by natural causes (Holmgren 2012; Smith et al. 2010). Kissinger et al. (2012) do not mention any timber logging or fuelwood collection as driving deforestation though they do quantify them as the most important drivers of forest degradation in the three continents.
FRA 2015 – Forest Futures Methodology
3
2. Objective and anticipated outputs
FRA has the ultimate objective of increasing the area and quality of sustainably managed forest through the provision of relevant information to key actors. Forest Futures will contribute to this objective by exploring a range of scenarios for global forest resources to help identify emerging opportunities and challenges for sustainable forest management. It will give a better understanding of the direct and indirect causes of deforestation, where it is expected and how it can be affected.
The anticipated outputs are:
DRIvERs OF FOREst AREA chAnGE The historical trend analysis will give us a ranking of the association of socio-economic and biophysical variables with past deforestation and afforestation.
FOREst AREA chAnGE Up tO 2030 AnD 2050On the basis of anticipated trends in forestry and other sectors affecting global forest resources (mainly agriculture) an integrated assessment model will approximate the extent of global forest resources in 2030/2050.
LOcAtIOns OF FOREst AREA chAnGEAnticipated forest resource change will be allocated spatially over the globe to assess hotspots of deforestation and locations where forests will be restored. This allocation is based the empirical calculation of past deforestation/afforestation and their association with socio-economic and biophysical variables.
typE AnD FUnctIOn OF FOREsts At RIsk OF BEInG LOstThe deforestation hotspots are accordingly overlaid with a map of primary forest, protected forests and production forest to assess whether they are at risk of being converted.
FRA 2015 – Forest Futures Methodology
4
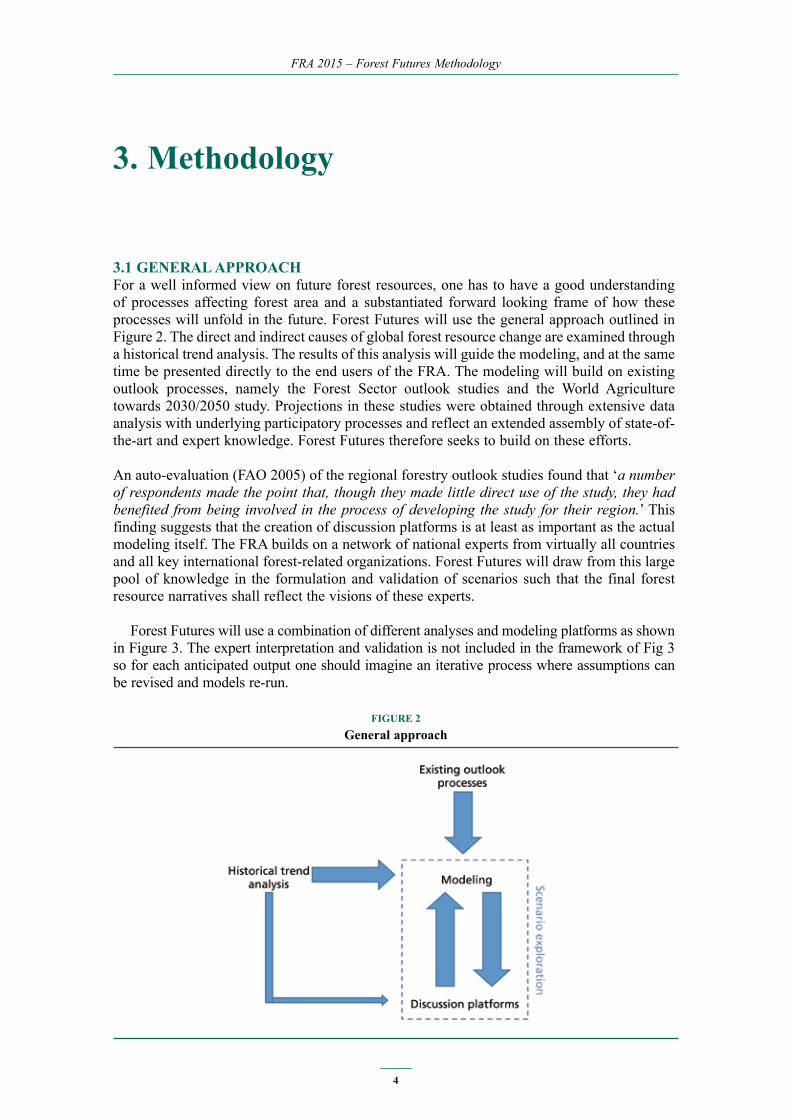
3. Methodology
3.1 GEnERAL AppROAchFor a well informed view on future forest resources, one has to have a good understanding of processes affecting forest area and a substantiated forward looking frame of how these processes will unfold in the future. Forest Futures will use the general approach outlined in Figure 2. The direct and indirect causes of global forest resource change are examined through a historical trend analysis. The results of this analysis will guide the modeling, and at the same time be presented directly to the end users of the FRA. The modeling will build on existing outlook processes, namely the Forest Sector outlook studies and the World Agriculture towards 2030/2050 study. Projections in these studies were obtained through extensive data analysis with underlying participatory processes and reflect an extended assembly of state-of-the-art and expert knowledge. Forest Futures therefore seeks to build on these efforts.
An auto-evaluation (FAO 2005) of the regional forestry outlook studies found that ‘a number of respondents made the point that, though they made little direct use of the study, they had benefited from being involved in the process of developing the study for their region.’ This finding suggests that the creation of discussion platforms is at least as important as the actual modeling itself. The FRA builds on a network of national experts from virtually all countries and all key international forest-related organizations. Forest Futures will draw from this large pool of knowledge in the formulation and validation of scenarios such that the final forest resource narratives shall reflect the visions of these experts.
Forest Futures will use a combination of different analyses and modeling platforms as shown in Figure 3. The expert interpretation and validation is not included in the framework of Fig 3 so for each anticipated output one should imagine an iterative process where assumptions can be revised and models re-run.
FIGURE 2General approach

FRA 2015 – Forest Futures Methodology
5
FIGURE 3Forest Futures’ framework of analyses, modeling platforms and information flows,
visualizing how anticipated outputs will be obtained
3.2 IntEGRAtED AssEssMEntThe central process in Figure 3 is referred to as ‘integrated assessment’ since it integrates knowledge from several disciplines and draws from FRA’s pool of experts to ‘assess’ their relative importance for forest resources. Knowledge from the outlook studies and historical trend analyses is combined with country aspirations and political targets to select the most likely future development of forest resources. This selection draws from expert interpretation so there is no standard formula or procedure, and countries may put different weights on driving factors determining forest resource change based on local circumstances. The historical trend analyses based on FRA’s remote sensing survey and historical forest loss as described earlier provide and analyze trends by region and climatic domain. They are complemented with country level historical trends of forest resources from FRA 2010 and agricultural land from FAOSTAT.

FRA 2015 – Forest Futures Methodology
6
3.3 ExIstInG OUtLOOk stUDIEs3.3.1 Agricultural outlookThe pressures on forest come predominantly from the agriculture sector. Therefore, any future vision of forest resources is largely determined by a future vision on agricultural expansion. The global perspective studies unit of FAO’s Economic and Social Development Department (hereafter FAO-ES) projects per capita food consumption with the World Food Model. In projecting the likely evolution of the key food and agricultural variables, the future is described as it is likely to be (to the best of knowledge at the time of carrying out the study), and not as it ought to be from a normative point of view. To date, no scenarios are explored in this approach though this is foreseen in the near future. The agriculture sector has increasingly been influenced by the energy sector over the past decade notably through the use of agricultural output as feedstock for biofuels, which FAO-ES is now adding to its need for food projections. The outlook draws on data from FAOSTAT and expert judgment, creating supply utilization accounts (SUA) for a demand-supply analysis. For its food production projection to materialize and assuming world population to increase according to the UN medium variant projection, global crop production will need to increase with 66% and global livestock production with 76% by 2050 (Conforti 2011). FAO-ES projects intensification in the form of yield increases and cropping intensities which they then use to project arable land to 2050. They compare the country level simulation results with the suitable arable land available according to the Global Agro-Ecological Zone (GAEZ) assessment of agricultural resources and potential and accordingly correct them by expert estimation (Alexandratos & Bruinsma 2012).
3.3.2 Forest sector outlook studiesArguably the second largest driver of deforestation and the first driver of afforestation is the demand for wood products. UNECE/FAO analyses structural developments in the forest sector and periodically produces regional studies of the long term outlook for demand (and to a lesser extent supply) for wood and the other forest goods and services, to support policy makers and analysts, as well as civil society and private sector decision makers. Recently forest sector outlook studies have been published for Russia (FAO 2012), North America (NAFSOS) (UNECE-FAO 2012), Europe (EFSOSII) (UNECE-FAO 2011), and Asia and the Pacific (FAO 2010b).
For Europe, the demand for wood (products and energy) is projected to increase with about 20-50% over the next 20 years (2010-2030). The 50% increase assumes wood to play a significant role in compliance with an ambitious target for all member states to reach a 20% share of energy from renewable sources by 2020 (Directive 2009/28/EC) (UNECE-FAO 2011). For North America, wood production is projected to almost double over the next 20 years (2010-2030) under the IPCC scenario B2. However, this increase seems more dramatic due to industrial roundwood production dropping significantly after the 2008 economic downturn. Compared to production figures of 2005, projected production in 2030 is about 50% higher (UNECE-FAO 2012). The Russian Forest sector outlook study projects industrial roundwood production to increase between 60-110% over the period 2010-2030 (FAO 2012). For the Asia and the Pacific region (including Oceania), the demand for industrial roundwood is projected to increase with around 80% over 15 years (2005-2020). Over 50% of this demand comes from the East Asia sub-region (Jonsson & Whiteman 2008 in FAO 2010b). While the supply-demand gap in the European forest sector outlook studies is projected to be modest (under the scenario with the largest gap this is still <3% of total European supply), for China (representing most of the East Asian sub region) it has more than doubled between 2000-2010 and is projected to increase again with about 50% between 2010-2020 (Jonsson & Whiteman 2008 in FAO 2010b). The North American and Russian forest sector outlook studies make no specific mention of discrepancies between regional wood supply and demand.

FRA 2015 – Forest Futures Methodology
7
In producing estimates of future production forest areas, planted forests will receive special attention. Though productive forest plantations1 only constituted about 3% of the global forest area in the year 2000, they were estimated to produce up to 35% of global wood supply in 2000 and projected to increase up to 46% of global wood supply in 2040 (ABARE & Pöyry 1999) or even as high as 64% of global roundwood consumption in 2050 according to an FAO outlook study (FAO 2000). Planted forests constituted about 5% of the global forest area in the year 2000, so under this definition the area is almost twice the area corresponding to the plantation definition. The most recent global outlook study on planted forest known to the author was realized by Carle and Holmgren (2008). However, their area projections are for several regions invalidated by recent country-reported planted forest areas (FAO 2010a) so this study will produce new planted forest area projections.
3.4 hIstORIcAL tREnD AnALysIs: Looking back in order to Look forwardWe combine spatially explicit assessments of past forest change with spatially explicit assessments of biophysical and socio-economic variables to analyze whether forest change processes show a relation to these variables. These variables represent either indirect drivers of land change processes (e.g. population density and income) or factors influencing direct drivers (e.g. accessibility and cropland suitability influence the likelihood of cropland conversion). The biophysical and socio-economic variables considered concern maps of: population density, income, accessibility, slope, elevation, soil type, crop suitability, pasture suitability and ruminant livestock density and are described in Annex II. We furthermore collect expert knowledge and review literature to identify socio-economic and political developments in the (sub)regions affecting forest land expansion.
3.4.1 Analysis of forest change assessed by the remote sensing surveyThe RSS assessment consists of 13,066 samples, of which roughly 10,000 samples have (some) forest for the approximate dates 1990-2000-2005. Images for 2010 are currently being processed with results expected by 2013. Both forest cover and forest land use are assessed though for the time being only results of forest land use have been processed (land use being consistent with forest reported in the FRA reports). Forest cover concerns the observed biophysical properties of the land surface, whereas land use is defined by the human activities and inputs on a given land area. Classifications have been validated by national experts. The RSS gives forest area (change) by administrative region and by climatic domain. The climatic domains are: boreal, subtropical, temperate and tropical.
The results from the remote sensing survey are combined with the socio-economic and biophysical variables (Annex II). Accordingly we analyze whether patterns can be seen between global forest loss in the samples and driver values. Given that the RSS finds net forest loss to concentrate in the tropics, the analysis is run by climatic domain and region. For each RSS sample we have forest land in 1990-2000-2005 and a set of biophysical and socio-economic values. Figure 4 gives an illustration of the possible relation between forest loss and accessibility, giving the sum of forest loss (1990-2005) divided by the total forest in 1990 by cost-distance category (so e.g. of all forest at a cost-distance of <2 hours in tropical Africa around 15% was lost between 1990-2005). Though there seems to be a strong relationship
1 Where FRA up to 2005 reported on primary, semi-natural, modified natural forest and plantations, since 2010 it reports on primary, other naturally generated and planted forest (for the latter detailing out % of which is introduced species).

FRA 2015 – Forest Futures Methodology
8
(i.e. forest loss is concentrated in the more accessible forest) this doesn’t necessarily mean the relation is statistically significant. A Mann-Whitney U test will be used to analyze whether the sample values in the different categories are significantly different.
3.4.2 Analysis of historical deforestation Given the complex character of deforestation and the approximate character of the variables, 15 years may result as too short a time period to analyze a relation between deforestation and the socio-economic and biophysical variables. We therefore also analyze deforestation over a longer period. In the absence of historical images of global forest land comparable to recent vegetation maps (i.e. Modis VCF), we use a map of potential forest derived from FRA’s global ecological zones map as a proxy to historically forested land. We assume that non-forest in the potential forest map has been deforested/irreversibly lost by natural causes over time. The global ecological zones map is an approximate equivalent of Köppen – Trewartha climatic types, in combination with vegetation physiognomy and one orographic zone (Iremonger & Gerrand 2011). We then compare the historical forest map with a forest map for the year 2000. The analysis was done relative to the year 2000 since most of the variable maps are available for that year. The forest map of 2000 was created calibrating 10 km by 10 km pixel-level resolution Modis VCF 2000 with FRA RSS forest areas assessed for 2000 by climatic domain x administrative region combination (resulting in 19 strata). The combination of the historical forest and the year 2000 forest land map gives a forest - non-forest map in which all non-forest represents forest that has been lost over time.
The grid cells of each variable map are attributed a percentage of forest loss, obtained through an empirical calculation from the intersection with the forest-non-forest map. The percent loss value of each category in the variable map is computed as the ratio of the quantity of non-forest grid cells in that category to the quantity of all grid cells in that category. To rank the association of the socio-economic and biophysical variable maps with past forest change we use the Relative Operating Characteristic (ROC). ROC is a method to compare a rank variable, such as Cost Distance, to a Boolean variable, such as the existence of non-forest in 2000 (Pontius & Batchu 2003). The ROC procedure analyzes each variable at multiple thresholds to measure the density of non-forest between each pair of sequential thresholds. Thus the procedure can detect the ranges within the variable that are either positively associated or negatively associated with non-forest. The Area Under the ROC Curve (AUC) is
FIGURE 4Forest loss in the Rss samples between 1990-2005 as percentage of total forest
in the Rss samples in 1990 in each cost-distance category
Tropical Africa Tropical Asia Tropical South America
< 2 hours
2–6
hours
6–12
hours
12–2
4 hours
> 24 h
ours
< 2 hours
2–6
hours
6–12
hours
12–2
4 hours
> 24 h
ours
< 2 hours
2–6
hours
6–12
hours
12–2
4 hours
> 24 h
ours

FRA 2015 – Forest Futures Methodology
9
a summary measure of the strength of the relationship. An AUC of 1 means a perfectly strong positive relationship, AUC of 0 means a perfectly strong negative relationship, and an AUC of 0.5 means a perfectly random relationship.
3.5 MODELInG FRAMEwORks3.5.1 spatial allocation of projected forest changeEnvisioned forest dynamics will be allocated spatially over the globe by GEOMOD (Pontius et al. 2001). GEOMOD is a spatially explicit allocation model that employs Geographic Information Science (GIS) to analyze biophysical and socio-economic variables, and their relationship to the allocation of forest at the initial time of the simulation, i.e. 2010. GEOMOD simulates the allocation of future gross gains and losses of forest based on the spatial patterns that exist at the initial time (the historical trend analysis described above). The quantity of gross gain and gross loss of forest by stratum for 2000-2010 is approximated with the annual change rate (2000-2005) from the remote sensing survey. Then GEOMOD allocates the changes at the pixel level according to the empirical relationship between forest at the initial time and the socio-economic and biophysical variables (Annex II). GEOMOD produces a map of simulated changes for the entire globe during 2010-2030 and 2010-2050 consisting of the categories: forest loss, forest gain, forest persistence, and non-forest persistence.
A validation interval of 2000-2010 is analyzed (as outlined in Fig 5). For the purpose of the validation, a reference map of forest change during 2000-2010 is created as follows. We modify the forest map of 2000 by allocating the same quantity of gross forest loss and gross forest gain in each stratum that we used in the simulation of 2000-2010. We allocate these changes within each stratum at the pixel level by using a map of the deviation in percent forest cover according to the VCF data. We allocate gross gains to the pixels that have the largest increase in percent tree cover, and we allocate gross losses to the pixels that have the largest decrease in percent tree cover according to VCF values. The validation then compares these reference changes during 2000-2010 to the simulated changes during 2000-2010. The Figure of Merit (FOM) calculation considers the number of pixels of hits, misses, and false alarms. A hit is where both the reference and the simulation shows change, a miss is where the
FIGURE 4Analysis of spatial allocation forest dynamics with GEOMOD
FRA 2015 – Forest Futures Methodology
10
reference shows change and the simulation shows persistence, and a false alarm is where the reference shows persistence and the simulation shows change. The FOM is a ratio, for which the numerator is the number of hits, and the denominator is the sum of hits, misses, and false alarms. Figure 5 outlines the procedure for simulating forest change and analyzing the type and function of forest at risk of being lost.
3.5.2 type and function of forests at risk of being lostThe projected global forest conversion is overlaid with the World Database on Protected Areas (WDPA) and a ‘world intact forest’ map. WDPA gives spatial and attribute information on over 190,000 nationally and internationally protected sites at global scale. The world intact forest map is created based on Modis VCF and the accessibility map and provides a proxy for primary forest. The forest which is not in the WDPA or part of the world intact forest map is considered a proxy for production forest.
The overlay should reveal locations of protected forest, primary forest and production forest with high risks of being cleared or degraded.
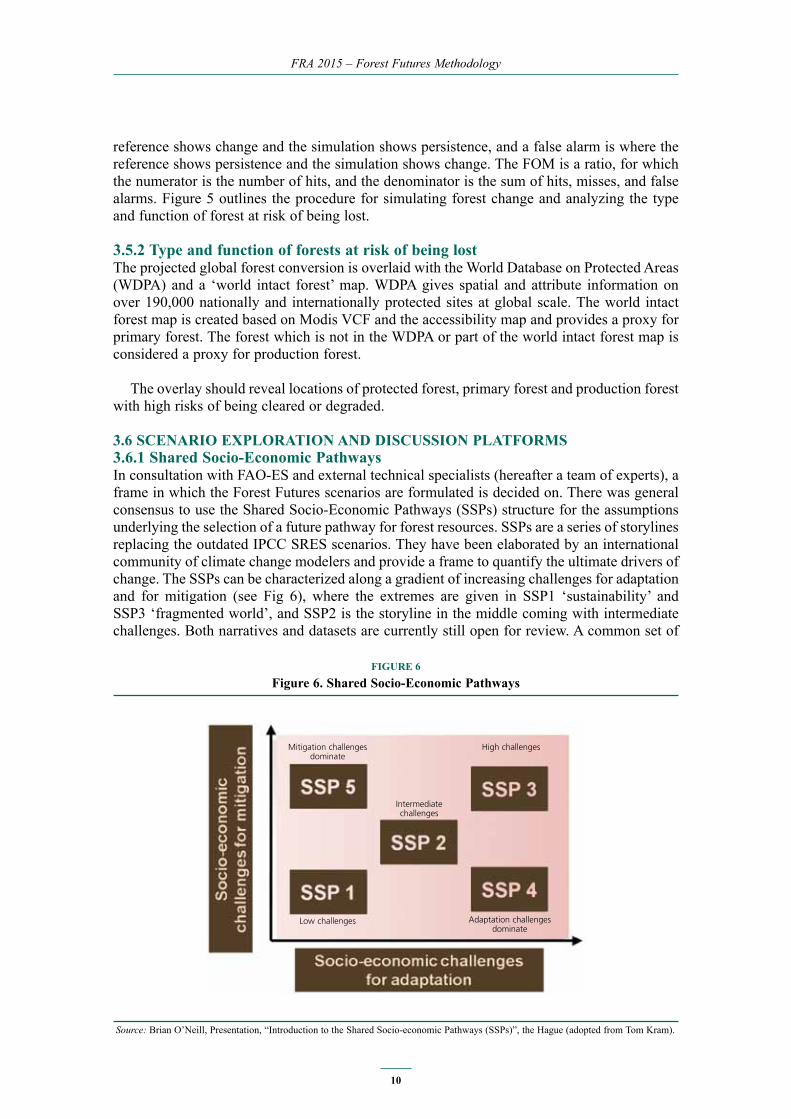
3.6 scEnARIO ExpLORAtIOn AnD DIscUssIOn pLAtFORMs 3.6.1 shared socio-Economic pathwaysIn consultation with FAO-ES and external technical specialists (hereafter a team of experts), a frame in which the Forest Futures scenarios are formulated is decided on. There was general consensus to use the Shared Socio-Economic Pathways (SSPs) structure for the assumptions underlying the selection of a future pathway for forest resources. SSPs are a series of storylines replacing the outdated IPCC SRES scenarios. They have been elaborated by an international community of climate change modelers and provide a frame to quantify the ultimate drivers of change. The SSPs can be characterized along a gradient of increasing challenges for adaptation and for mitigation (see Fig 6), where the extremes are given in SSP1 ‘sustainability’ and SSP3 ‘fragmented world’, and SSP2 is the storyline in the middle coming with intermediate challenges. Both narratives and datasets are currently still open for review. A common set of
FIGURE 6Figure 6. shared socio-Economic pathways
Source: Brian O’Neill, Presentation, “Introduction to the Shared Socio-economic Pathways (SSPs)”, the Hague (adopted from Tom Kram).
Mitigation challenges dominate
High challenges
Intermediate challenges
Low challenges Adaptation challenges dominate

FRA 2015 – Forest Futures Methodology
11
data related to the SSPs is provided for population (including the rural/urban split), GDP and education. Population goes up to roughly 8.5-10.3 billion people in 2050 (SSP2 around 9.3) and GDP to roughly 110-240 trillion $ (SSP2 around 170) in 2050. All other assumptions are left open for modelers to decide on in their elaboration of SSP scenarios.
The team of experts recommended exploring scenarios framed by SSP2, representing intermediate socio-economic challenges for adaptation and mitigation. SSP2’s storyline -if one seeks to compare with the previous SRES scenarios- is most similar to SRES b2 which was used in both the European and North American Forest Sector Outlook Study. Participants expressed the interest to explore impacts on forest resources under several SSP storylines and give the range of possible outcomes calculating with the extreme cases. However, the modelers indicated that the vast (human) resources needed to calculate the implications of a single SSP make it not feasible to produce high quality outputs following the tight timelines with preliminary results to be presented to the national correspondents in May 2013. They also indicated that the freedom in altering assumptions other than population, GDP and education leaves enough room for exploring a series of scenario variants around any given baseline and is more likely to provide policy and investment recommendations. As such, the exploration of several SSPs is not scheduled for FRA 2015 but should be considered for FRA 2020.
3.6.2 scenario explorationAs experimental set-up, a baseline based on SSP2 with scenario variants is proposed. The team of experts suggested alternating assumptions on agricultural intensification, bioenergy and forest management to explore scenario variants representing plausible socio-political and policy driven tendencies. According to FAO-ES, around 90% of future agriculture production comes from yield increases (presentation Van der Mensbrugghe, 2012). This indicates that changing the assumption on yield increases may have major impacts on arable land expansion and thus on forest land change, which is why it should be included even though it is beyond the scope of forest policies.
3.6.3 Discussion platformsGlobal and regional meetings with national correspondents will be organized to establish discussion platforms on future trends in regional and global forestry and in other sectors affecting forest resources. The modeling experts will show baseline and scenario variant projections as the starting point of discussion. The scenarios will be fine-tuned during the Forest Futures meetings with the modeling experts present while country representatives provide feedback and indicate the policy choices they would like to see analyzed.

FRA 2015 – Forest Futures Methodology
12
6. References
ABARE & Pöyry J (1999) Global outlook for plantations. Retrieved from http://adl.brs.gov.au/data/warehouse/pe_abarebrs99000431/PC11463.pdf
Alexandratos N and J Bruinsma (2012) World agriculture towards 2030/2050: the 2012 revision. ESA Working paper 12-03. Rome, FAO.
Carle BJ & Holmgren P (2008) Wood from planted forests: A Global Outlook 2005-2030. Forest Products Journal, 58(10469), 6-18.
Conforti P (2011) Looking ahead in world food and agriculture: Perspectives to 2050. Rome: FAO. Retrieved from http://www.fao.org/docrep/014/i2280e/i2280e.pdf
Del Lungo A, Ball J & Carle J (2006) Global planted forests thematic study: results and analysis. Rome.
EROS (1996) GTOPO30. Global digital elevation model (DEM). U.S. Geological Survey’s EROS Data Center, Sioux Falls, South Dakota, USA. http://edcdaac.usgs.gov/gtopo30/gtopo30.html
FAO (2000) The global outlook for future wood supply from forest plantations. Working Paper GFPOS/WP/03. Rome.
FAO (2001) Global Forest Resources Assessment 2000. Rome. doi:10.1016/S0264-8377(03)00003-6FAO (2005) Auto-evaluation of forestry sector outlook studies. Rome. Retrieved from http://www.
fao.org/docrep/009/af305e/af305e00.htmFAO (2006) Mapping global urban and rural population distributions. By M Salvatore et alFAO (2007) The Gridded Livestock of the WorldFAO (2010a) Global Forest Resources Assessment 2010. FAO Forestry Paper 163. RomeFAO (2010b) Asia-Pacific forestry sector outlook study II: Asia-Pacific Forests and Forestry to
2020. Bangkok: FAO. Retrieved from http://www.fao.org/docrep/012/i1594e/i1594e00.pdfFAO & JRC (2012) Global forest land-use change 1990-2005. FAO Forestry paper 169FAO (2012) Global ecological zones for FAO forest reporting: 2010 update. Forest Resources
Assessment Working Paper 179, FAO, Rome.FAO (2012) The Russian Federation Forest Sector outlook study to 2030. RomeFAO/IIASA/ISRIC/ISSCAS/JRC (2012) Harmonized World Soil Database (version 1.2). FAO,
Rome, Italy and IIASA, Laxenburg, Austria.Fischer G, Nachtergaele FO, Prieler S, Teixeira E, Tóth G, van Velthuizen H, Verelst L et al (2010)
Global Agro-ecological Zones: Model Documentation.Geist H J & Lambin EF (2001) What drives tropical deforestation? LUCC Report Series 4. Louvain
La Neuve.Holmgren L (2012) The global need for food , fibre and fuel. Land use perspectives on constraints
and opportunities in meeting future demand. Text. Åke Barklund, General Secretary and Managing Director, KSLA. Retrieved from http://www.ksla.se/wp-content/uploads/2012/06/KSLAT-4-2012-Food-fibre-and-fuel.pdf
Holmgren P (2006) Global Land Use Area Change Matrix: Input to GEO-4. Retrieved from ftp://ftp.fao.org/docrep/fao/010/ag049e/ag049e00.pdf
Kissinger G, Herold M, & De Sy V (2012) Drivers of deforestation and forest degradation: A synthesis report for REDD+ policymakers. Vancouver, Canada.
Pontius Jr, RG & Batchu K (2003) Using the relative operating characteristic to quantify certainty in prediction of location of land cover change in India. Transactions in GIS 7(4): 467-484.
Pontius Jr, RG & Schneider L (2001) Land-use change model validation by a ROC method for the Ipswich watershed, Massachusetts, USA. Agriculture, Ecosystems & Environment 85(1-3): 239-248.

FRA 2015 – Forest Futures Methodology
13
Smith P, Gregory PJ, van Vuuren D, Obersteiner M, Havlík P, Rounsevell M, Woods J, et al. (2010) Competition for land. Philosophical transactions of the Royal Society of London. Series B, Biological sciences, 365(1554), 2941-57. doi:10.1098/rstb.2010.0127
UNECE-FAO (2012) The North American Forest Sector Outlook Study. Retrieved from http://www.unece.org/fileadmin/DAM/timber/publications/SP-29_NAFSOS.pdf
UNECE/FAO (2011) European forest sector outlook study (EFSOS) II. Retrieved from http://www.unece.org/fileadmin/DAM/timber/publications/sp-28.pdf

FRA 2015 – Forest Futures Methodology
14
Annex 1
planted forest outlook
A thematic FRA study called the Global Planted Forests Assessment (Del Lungo et al. 2006) collected detailed information on planted forests in 61 countries, estimated to represent around 94% of the total plantation forest area in the FRA 2000 report (FAO 2001). Of these, 36 countries filled out a questionnaire while a desk study was conducted for the remaining 25 countries. The study provides information on area, species, growth parameters, ownership and end uses of planted forests. Based on this study, Carle and Holmgren (2008) produced a global outlook to 2030 for planted forests, examining three scenarios. For these scenarios area changes are predicted to expand at the same rate they increased in the past (scenario 2 and 3), or assumed to expand half the historical rate of increase (scenario1).
FIGURE 7comparison planted forest areas by region from global planted forest assessment (2005)
and projected (2030) by carle and holmgren with planted forest areas reported (1990, 2000, 2005, 2010) in FRA 2010 (FAO 2010a).

FRA 2015 – Forest Futures Methodology
15
When comparing planted forest areas and planted forest area increases from Carle and Holmgren (2008) with planted forest areas as reported in FRA 2010 (Fig 7), we see planted forest area increase is greatly underestimated for the Americas, and both area and area increase are greatly underestimated for Africa, while the area of planted forests for Europe is overestimated by large.

FRA 2015 – Forest Futures Methodology
16
Annex 2
socio-economic and biophysical variable maps used for the historical trend analyses
The socio-economic and biophysical variable datasets concern maps with: population density, income, accessibility, slope, elevation, soil type, crop suitability, pasture suitability and ruminant livestock density. In the analysis we are restricted to whatever information is available to us thus some factors which are likely to be important determinant of land change processes (e.g. tenure) are not considered.
The population density map for the year 2000 was extracted from FAO’s GeoNetwork (http://www.fao.org/geonetwork/srv/en/). The method used to generate the data layer is described in FAO (2006).
An income map is approximated by an administrative map of all nations where countries obtain the values of their Gross National Income per capita for the year 2000 from the World Bank. GNI is converted to international dollars using purchasing power parity rates. An international dollar has the same purchasing power over GNI as a U.S. dollar has in the United States. GNI is the sum of value added by all resident producers plus any product taxes (less subsidies) not included in the valuation of output plus net receipts of primary income (compensation of employees and property income) from abroad. Data are in current international dollars.
The accessibility map used was created by JRC for the World Bank (http://bioval.jrc.ec.europa.eu/products/gam/index.htm). Accessibility is approximated using a cost-distance algorithm and defined as the travel time to a location of interest using land (road/off road) or water (navigable river, lake and ocean) based travel.
Elevation and slope are derived from the GTOPO30 global coverage digital elevation model (EROS 1996) while the soil map comes from the harmonized world soil database (FAO/IIASA/ISRIC/ISSCAS/JRC 2012).
Crop and pasture suitability and ruminant livestock density are derived from the Global Agro-Ecological Zones (GAEZ) (Fischer et al. 2010) assessment of agricultural resources and potential. GAEZ is a land resources database combining geo-referenced global climate, soil and terrain data. The data is commonly assembled on the basis of global grids, typically at 5 arc-minute and 30 arc-second resolutions. Climatic data comprises precipitation, temperature, wind speed, sunshine hours and relative humidity, which are used to compile agronomically meaningful climate resources inventories including quantified thermal and moisture regimes in space and time. The database includes crop information such as crop parameters (harvest index, maximum leaf area index, maximum rate of photosynthesis, etc.), cultivation practices and input requirements, and utilization of main produce, crop residues and by-products. The mentioned biophysical information is combined with crop requirements, to estimate for each land grid cell at the 5 arc minute grid level suitability for crop production. GAEZ version 3.0 is released end of May 2012.

FRA 2015 – Forest Futures Methodology
17
The generalized crop suitability map is based on an assembly of individual crop suitability maps as produced by GAEZ. The crops selected for this generalized crop suitability map area those crops representing 90% of the crop area in the FAO agricultural outlook, and each pixel in the generalized crop suitability map represents the highest crop suitability index value for the selection of crops under rain-fed, low-input levels.
The generalized pasture suitability map is a GAEZ low input attainable grass/pasture yield map where pixel values represent average attainable output densities of 5 arc-minute grid cells in 10kg/ha, i.e. a value of 1000 means 10 tons/ha.
The Ruminant livestock dataset refers to the ruminant livestock density expressed as Tropical Livestock Units in the year 2000. Tropical livestock unit have an equivalent live-weight of 250 kg. The database was compiled by the Global Livestock Mapping Project of FAO-AGA (FAO 2007).This gridded data matches FAOSTAT totals for the year 2000. In IIASA the original resolution of 0.05 decimal degrees has been converted to the standard GAEZ 5 arc-minute resolution.

FRA 2015
Terms and Definitons
december, 2012
Forest resources Assessment Working Paper 180