fruit and tree nuts outlook - cornell...
TRANSCRIPT

Total U.S. citrus production for 2014/15 is forecast at 9.38 million tons, down less than 1 percent from the previous year. USDA’s National Agricultural Statistics Service (NASS) initially estimated the 2014/15 citrus crop in October 2014 at 9.66 million tons, 3 percent higher than the revised forecast. Production gains from tangerines/mandarins and lemons could not offset the losses in grapefruit, oranges and tangelos. The current forecast for the U.S. all-orange crop is 6.68 million tons, 2 percent less than 2013/14’s total crop of 6.78 million tons and 19 percent less than 2012/13. Disease pressures continue to reduce production out of Florida, with the non-Valencia orange crop down 12 percent this season while Valencia orange production is forecast to increase by 7 percent this spring. California navel orange production is up 3 percent this season, placing downward pressure on early 2015 fresh orange prices as increased supplies reached the market. Despite a few frosty nights, California oranges escaped mostly unscathed. Texas is expecting a drop in the spring Valencia harvest, but navels are forecast up 19 percent year over year. Domestic grapefruit production drops 2 percent in 2014/15. California is holding production steady from last season while Texas is experiencing a 5-percent bump; production amounts from both States put together bring levels close to 2012/13 volume. The Florida crop’s grapefruit sizes are smaller than average and, along with high fruit droppage rates, have reduced the 2014/15 crop forecast by 4 percent from last season. Arizona lemon production had jumped to 88,000 tons after back-to-back seasons of 72,000 tons, rebounding close to 2010/11 production levels. With higher supplies from Arizona and California, lemon grower prices should begin to ease after last year’s extremely strong prices. All tangerines and mandarins are forecast up 3 percent year over year. U.S. tangerines/mandarins production is estimated at 748,000 tons, up 3 percent from the previous year and if realized, will be the largest harvest on record. Production gains out of California and Arizona are making up for declining production in Florida. Fresh grower prices started strong this season in October but as harvest picked up in California, prices have declined below 2013/14’s monthly prices.
Fruit and Tree Nuts Outlook Agnes Perez [email protected] Kristy Plattner [email protected] U.S. Citrus Production Nearly Flat in 2014/15 From Previous Season
Economic Research Service Situation and Outlook FTS-358 March 27, 2015
Contents Price Outlook Citrus and Noncitrus Fruit Melons Tree Nuts 2014 Crop Value Summary Economic Insight: China Tree Nut Contacts and Links Selected Tables Grower prices Retail prices Citrus production Prices: Oranges Grapefruit Lemon Tangerines Supply and use: Orange juice Grapefruit juice Fresh strawberries Watermelon U.S. trade Topic Page Fruit & Tree Nuts ---------------- The next release is June 30, 2015 ---------------- Approved by the World Agricultural Outlook Board.

Price Outlook
2 Fruit and Tree Nuts Outlook/FTS-358/March 27, 2015
Economic Research Service, USDA
Grower Price Index for Fruit and Nuts Start Strong in 2015 The index of prices received by U.S. fruit and tree nut growers stayed at above-average levels throughout 2014, indicating some of the strongest grower prices received last year for fruit and tree nuts (fig. 1). The 2015 grower prices have begun the year fairly strong, denoted by the January index of 126 (2011=100), not much changed from the January 2014 index of 127, and 28 percent above the 2010-12 average January index. Holding the January index almost unchanged from a year ago, orange and lemon prices exceeded last year’s higher than average levels in January 2015 but the price gains were offset by lower grapefruit prices (table 1). In the citrus market, orange and grapefruit production declines in Florida have reduced overall U.S. crop size for these commodities in 2014/15. Production declines are due for the most part to reduced acreage, smaller fruit sizes, and a high incidence of fruit drop from citrus diseases. Resulting higher grower prices for fresh and processed Florida oranges helped bolster the U.S. all-orange grower price above a year ago since the start of the season in November. Despite expected reduced domestic production, grapefruit prices have dropped below year-ago levels since December 2014. The drop is due to increased supply shipments so far this season compared to last as well as to below-average fruit size in Florida. Meanwhile, strong demand for lemons is keeping prices up for the season thus far. Monthly average grower prices for noncitrus fruit were not reported by USDA’s National Agricultural Statistic Service (NASS) for all of 2013 (except for fresh apples, for which prices were reported for the first 3 months of 2013) and through March 2014. Compared with 2010-12 monthly average prices, fresh apple and pear prices in January 2015 were significantly higher, while fresh strawberry prices fell below the 2010-12 prices. While showing strength relative to 2010-12 average prices, increased domestic supplies are putting downward pressure on fresh apple and strawberry prices so far this season. The opposite is true for fresh pears.
90
100
110
120
130
140
150
Jan. Apr. July Oct.
Figure 1Index of prices received by growers for fruit and tree nuts2011=100
Source: USDA, National Agricultural Statistics Service, Agricultural Prices.
Average 2010-12
2014
2013
2015

3 Fruit and Tree Nuts Outlook/FTS-358/March 27, 2015
Economic Research Service, USDA
NASS reported a preliminary estimate for the 2014/15 season-average price for all U.S. apples (fresh and processed) at $0.265 per pound, down from $0.302 per pound in 2013/14—the second-highest on record. A record-large crop in Washington State, producer of more than 60 percent of U.S. apples, mostly contributed to a near-record harvest in the United States last fall. The NASS preliminary estimate for U.S. apple production for 2014/15 was 11.3 billion pounds, up 9 percent from the previous year and the highest since peak production in 1998. Free-on-board (f.o.b.) shipping-point prices for Red Delicious apples in Washington State’s Yakima Valley-Wenatchee District have been mostly averaging below the previous year since the start of the season in August 2014 (fig. 2), based on USDA, Agricultural Marketing Service data (AMS). Since Washington State is the largest supplier of U.S. apples, these weaker prices are likely being reflected at the national grower price level for fresh apples. Despite a strong U.S. dollar, exports of U.S. fresh apples for the first half of the 2014/15 season, August-January, were 13 percent ahead of the same period last season. However, apple supplies remain abundant, likely holding prices down from a year ago through the remainder of the season. As of March 1, fresh apple holdings were running 28 percent ahead of last season and 37 percent above the 5-year average, according to the U.S. Apple Association. The preliminary 2014/15 season-average price for U.S. fresh pears is $567 per ton (or $0.284 per pound), up from $491 per ton (or $0.246 per pound) in 2013/14 and the highest as far back as 1980. Average prices for the season are averaging at record-high levels in both the fresh and processing markets, although grower price gains are greater in the fresh market. The NASS preliminary estimate for U.S. pear production in 2014/15, July-June marketing season, show an 8-percent decline from the previous season to more than a 20-year low at 808,210 tons (or 1.62 billion pounds). Even though Russia’s import ban, the West Coast port labor dispute, and a strong U.S. dollar may have diverted some export-bound supplies to the domestic market, overall below-average production and generally high quality fruit helped boost domestic fresh pear prices. In Washington State, average f.o.b. shipping-point prices for various pear varieties (Bartlett, Bosc, and D’Anjou) were averaging around 8 percent higher during the first 8 months of the 2014/15 compared with the
Table 1--Monthly fruit prices received by grow ers, United States 2014-15 change*
Commodity December January 2013 2014 2014 2015 December January
---------------------Dollars per box ----------------------- PercentCitrus fruit: 1/
Grapefruit, all 7.57 7.56 7.51 6.96 7.30 6.09 -7.3 -16.6
Grapefruit, fresh 10.30 11.38 11.47 9.97 12.09 9.06 -13.1 -25.1
Lemons, all 11.80 10.60 23.52 21.68 21.17 18.20 -7.8 -14.0
Lemons, fresh 18.34 19.45 30.53 34.87 31.71 32.91 14.2 3.8
Oranges, all 7.97 7.74 6.93 9.12 8.24 9.28 31.6 12.6
Oranges, fresh 12.74 11.48 15.41 19.22 20.43 18.11 24.7 -11.4
------------------Dollars per pound ----------------------
Noncitrus fruit:
Apples, fresh 2/ 0.348 0.278 na 0.324 na 0.320 -6.8 15.1
Grapes, fresh 2/ 0.595 -- na 0.825 na -- -- --
Peaches, fresh 2/ -- -- na -- na -- -- --
Pears, fresh 2/ 0.292 0.241 na 0.353 na 0.364 20.7 51.0
Straw berries, fresh 2.230 1.840 na 2.090 na 1.350 -6.3 -26.6* Percent change for noncitrus fruit w ill be from the 2010-12 average because no monthly prices w ere reported for these commodities after the f irst quarter of 2013 and through the f irst quarter of 2014. -- Insuff icient number of reports to establish an estimate.1/ Equivalent on-tree price.2/ Equivalent packinghouse-door returns for CA, NY (apples only), OR (pears only), and WA (apples, peaches, and pears). Prices as soldfor other States.Source: USDA, National Agricultural Statistics Service, Agricultural Prices and Noncitrus Fruit and Nuts 2014 Preliminary Summary.
Average 2010-12 December January

4 Fruit and Tree Nuts Outlook/FTS-358/March 27, 2015
Economic Research Service, USDA
previous season (fig. 3). Now past the domestic season’s peak supply period, tighter supplies will likely keep fresh pear prices strong. Ample strawberry supplies from Florida and Mexico drove down U.S. freshstrawberry prices this winter. Harvest in California is picking up and supplies areexpected to take on the market this spring. However, anticipated reduced acreagecould result to lower overall production, especially if weather problems strike and cut yields. Though prices will likely weaken as California’s season gets in full swing,reduced production, if realized, should keep prices from falling below year-ago levels this spring and into the summer. Consumer Price Index for Fresh Fruit Also Strong Into 2015 The Consumer Price Index (CPI) for fresh fruit in January 2015, at 354.8 (1982-84=100), rose almost 2 percent above the January 2014 CPI and held strong relative to the same period of recent years (fig.4). Though weakening from the previous
0
5
10
15
20
25
30
Aug Sep Oct Nov Dec Jan Feb Mar Apr May Jun Jul
2010/11-2012/13 average
2013/14
2014/15
Figure 2Free-on-board shipping-point prices for Washington Red Delicious apples*
*Yakima Valley and Wenatchee District, Washington Extra Fancy grade, size 72-125.** Average of shipping-point high and low priceSource: USDA, Agricultural Marketing Service, Market News Portal. https://www.marketnews.usda.gov/mnp/fv-home
$ per carton tray pack**
0
5
10
15
20
25
30
Jul Aug Sep Oct Nov Dec Jan Feb Mar Apr May Jun
2010/11-2012/13 average
2013/14
2014/15
Figure 3Free-on-board shipping-point prices for Washington pears*
*Yakima Valley and Wenatchee District, various variety, U.S. No. 1 grade, size 80-110.** Average of shipping-point high and low priceSource: USDA, Agricultural Marketing Service, Market News Portal. https://www.marketnews.usda.gov/mnp/fv-home
$ per 4/5 bushel carton wrapped**

5 Fruit and Tree Nuts Outlook/FTS-358/March 27, 2015
Economic Research Service, USDA
month, the CPI remained nearly unchanged from a year ago in February at 352.5 (1982-84=100). Boosting the CPI were higher U.S. retail prices for navel oranges, lemons, Red Delicious apples, and Thompson seedless grapes in January and February, compared with the same period a year earlier, based on data from the U.S. Department of Labor, Bureau of Labor Statistics (BLS) (table 2). These higher prices more than offset price declines for bananas and strawberries. February grapefruit prices increased slightly over last year, also contributing to the boost in the CPI. Grape supplies from Chile, which dominate the U.S. winter market for fresh grapes, have rebounded, increasing overall fresh grape availability for U.S. retail promotions this winter. After a freeze-reduced crop curtailed Chile’s grape exports to the United States in winter 2014, more stable weather conditions are proving to benefit the country’s grape production this season, increasing export potential. From December 2014 to January 2015, U.S. fresh grape imports from Chile were up 9 percent in volume relative to the same time the previous year. Based on AMS data, cumulative grape shipments through early March show Chilean volume up by 15 percent. These larger volumes are being reflected in reported advertised retail prices for red and white seedless type grapes at major national U.S. retail supermarket outlets, in which prices are averaging down from year-ago levels since January. Through the first 2 weeks in March, reported prices for white seedless grapes averaged almost $2.00 per pound, down from $2.32 the same time last year; for red seedless grapes, prices averaged $1.96 per pound, compared with $2.32 a year ago. Strawberry supplies from Florida and Mexico are winding down for the season but California supplies are building up, pointing to a weakening of U.S. retail strawberry prices from the January average of $2.45 per 12-ounce pint. AMS data on national advertised retail prices show average strawberry prices at around $2.75 per 1-pound package in January, declining to $2.14 during the first 2 weeks of March. These prices also have remained below year-ago levels, reflecting increased promotional supplies from Florida and Mexico. California shipments through early March have lagged behind last year’s for the same period and may continue to do so with reduced acreage, likely providing some boost to prices in the coming months.
250.0
300.0
350.0
400.0
Jan. Mar. May July Sep. Nov.
Figure 4Consumer Price Index for fresh fruit1982-84=100
Source: U.S. Department of Labor, Bureau of Labor Statistics, http://www.bls.gov/data/home.htm.
Average 2010-12
2014
2013
2015

6 Fruit and Tree Nuts Outlook/FTS-358/March 27, 2015
Economic Research Service, USDA
Banana retail prices fell below a year ago in January despite an 8-percent decline in import supplies. Greater volume at the end of last year likely provided a buffer for supplies going into 2015 but the cold weather may have also slowed demand. AMS data indicate import shipments through early March continue to run behind a year ago, including volumes from major U.S. sources for imported bananas such as Guatemala, Costa Rica, and Honduras, likely supporting prices.
2014 2015 2014-15 change
Commodity Unit January February January February January February
--- Dollars --- --- Dollars --- --- Percent ---
Fresh:
Valencia oranges Pound -- -- -- -- -- --
Navel oranges Pound 1.118 1.146 1.195 1.185 6.9 3.4
Grapefruit Pound 1.050 1.002 1.037 1.026 -1.2 2.4
Lemons Pound 1.687 1.667 1.860 1.868 10.3 12.1
Red Delicious apples Pound 1.278 1.309 1.345 1.350 5.2 3.1
Bananas Pound 0.595 0.599 0.583 0.591 -2.0 -1.3
Peaches Pound -- -- -- -- -- --
Anjou pears Pound -- -- -- -- -- --
Strawberries 1/ 12-oz. pint 2.639 2.112 2.454 2.090 -7.0 -1.0
Thompson seedless grapes Pound 2.807 2.872 3.209 3.006 14.3 4.7
Processed:
Orange juice, concentrate 2/ 16-fl. oz. 2.414 2.430 2.732 2.734 13.2 12.5
Wine liter 10.622 12.152 12.912 12.370 21.6 1.8-- Insufficient marketing to establish price.1/ Dry pint. 2/ Data converted from 12-fluid-ounce containers.Source: U.S. Department of Labor, Bureau of Labor Statistics, http://www.bls.gov/data/home.htm.
Table 2--U.S. monthly retail prices for selected fruit, 2014-15
Citrus and Noncitrus Fruit
7 Fruit and Tree Nuts Outlook/FTS-358/March 27, 2015
Economic Research Service, USDA
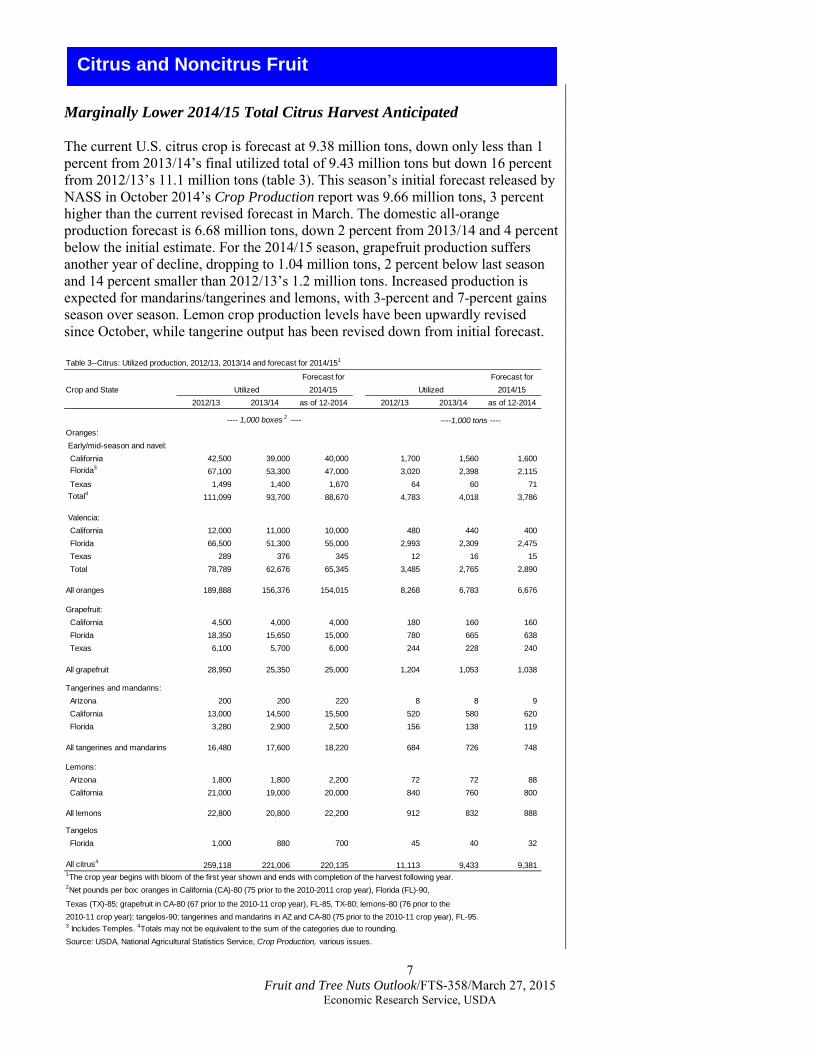
Marginally Lower 2014/15 Total Citrus Harvest Anticipated The current U.S. citrus crop is forecast at 9.38 million tons, down only less than 1 percent from 2013/14’s final utilized total of 9.43 million tons but down 16 percent from 2012/13’s 11.1 million tons (table 3). This season’s initial forecast released by NASS in October 2014’s Crop Production report was 9.66 million tons, 3 percent higher than the current revised forecast in March. The domestic all-orange production forecast is 6.68 million tons, down 2 percent from 2013/14 and 4 percent below the initial estimate. For the 2014/15 season, grapefruit production suffers another year of decline, dropping to 1.04 million tons, 2 percent below last season and 14 percent smaller than 2012/13’s 1.2 million tons. Increased production is expected for mandarins/tangerines and lemons, with 3-percent and 7-percent gains season over season. Lemon crop production levels have been upwardly revised since October, while tangerine output has been revised down from initial forecast.
Table 3--Citrus: Utilized production, 2012/13, 2013/14 and forecast for 2014/151
Forecast for Forecast forCrop and State Utilized 2014/15 Utilized 2014/15
2012/13 2013/14 as of 12-2014 2012/13 2013/14 as of 12-2014
----1,000 tons ----Oranges: Early/mid-season and navel: California 42,500 39,000 40,000 1,700 1,560 1,600 Florida3 67,100 53,300 47,000 3,020 2,398 2,115 Texas 1,499 1,400 1,670 64 60 71 Total4 111,099 93,700 88,670 4,783 4,018 3,786
Valencia: California 12,000 11,000 10,000 480 440 400 Florida 66,500 51,300 55,000 2,993 2,309 2,475 Texas 289 376 345 12 16 15 Total 78,789 62,676 65,345 3,485 2,765 2,890
All oranges 189,888 156,376 154,015 8,268 6,783 6,676
Grapefruit: California 4,500 4,000 4,000 180 160 160 Florida 18,350 15,650 15,000 780 665 638 Texas 6,100 5,700 6,000 244 228 240
All grapefruit 28,950 25,350 25,000 1,204 1,053 1,038
Tangerines and mandarins: Arizona 200 200 220 8 8 9 California 13,000 14,500 15,500 520 580 620 Florida 3,280 2,900 2,500 156 138 119
All tangerines and mandarins 16,480 17,600 18,220 684 726 748
Lemons: Arizona 1,800 1,800 2,200 72 72 88 California 21,000 19,000 20,000 840 760 800
All lemons 22,800 20,800 22,200 912 832 888
Tangelos Florida 1,000 880 700 45 40 32
All citrus4 259,118 221,006 220,135 11,113 9,433 9,381 1The crop year begins with bloom of the first year shown and ends with completion of the harvest following year.2Net pounds per box: oranges in California (CA)-80 (75 prior to the 2010-2011 crop year), Florida (FL)-90,
Texas (TX)-85; grapefruit in CA-80 (67 prior to the 2010-11 crop year), FL-85, TX-80; lemons-80 (76 prior to the2010-11 crop year); tangelos-90; tangerines and mandarins in AZ and CA-80 (75 prior to the 2010-11 crop year), FL-95.3 Includes Temples. 4Totals may not be equivalent to the sum of the categories due to rounding.Source: USDA, National Agricultural Statistics Service, Crop Production, various issues.
---- 1,000 boxes 2 ----

8 Fruit and Tree Nuts Outlook/FTS-358/March 27, 2015
Economic Research Service, USDA
California Orange Production Remains Unchanged for 2014/15 The March issue of the NASS Crop Production report forecasted the 2014/15 California all orange production at 2.0 million tons—unchanged from last year. The forecast is revised down one percent from the initial forecast back in October. The navel crop is estimated at 1.60 million tons, up 3 percent from last year, but still 6 percent below the 2012/13 crop. Cooling temperatures in the late fall and winter helped color the fruits. Growers had to treat fungal disease issues and spray for Fuller Rose beetles. A bilateral trade agreement between the United States and South Korea requires better control of the Fuller Rose beetle on California citrus exports, particularly navel oranges—a popular fruit in South Korea. A few cold weather snaps in December and January only resulted in minimal damage with most citrus unscathed. Quality was reported to be good during harvest. In early March, NASS’s California Field Office released the 2014/15 California Valencia Orange Objective Measurement report. In the report, Valencia orange-bearing acreage declined to 34,000 acres, from 36,000 acres the prior year. Along with acreage, average trees per acre have been reduced from 124 to 123. The average fruit set per tree in 2014/15 is down as well, declining 12 percent to 545 fruit per tree. Though fewer fruit are on the trees, the average fruit size is almost equal to that of last season, providing the basis for the forecast decreased production. The March report anticipates 20 million cartons (400,000 tons) of Valencia oranges in California, 9 percent less than last season’s final utilized production of 22 million cartons. Despite the forecasted increase in the navel orange crop, prices remain above last season at $19.39 per 80-pound box. This price is up 7 percent from last November and 18 percent above the 5-year average November monthly price for fresh oranges (table 4). The November price received for fresh California oranges is the highest
Table 4--Fresh oranges: Average equivalent on-tree prices received by California growers,
2009/10-2014/15
Month 2009/10 2010/11 2011/12 2012/13 2013/14 2014/15
November 17.76 15.31 15.52 15.20 18.17 19.39
December 13.06 13.75 13.53 12.90 15.97 19.14
January 11.56 12.35 11.73 11.50 21.77 18.44
February 10.86 9.65 11.13 10.10 23.67
March 10.90 8.90 10.86 10.13 23.38
April 10.66 9.22 13.82 11.45 23.90
May 14.66 10.63 15.38 14.05 23.31
June 14.22 11.81 14.81 15.31 20.11
July 9.29 9.85 11.03 11.90 17.67
August 9.49 10.75 10.23 12.30 17.67
September 9.29 11.45 12.53 14.80 18.27
October 9.29 11.15 12.13 15.30 15.77
Nov.-January average 14.13 13.80 13.59 13.20 18.64 18.99Source: USDA, National Agricultural Statistics Service, Agricultural Prices, various issues.
------- Dollars/box1 -------
175-lb box prior to 2010/11; 80-lb box thereafter.

9 Fruit and Tree Nuts Outlook/FTS-358/March 27, 2015
Economic Research Service, USDA
since at least 1980 for that month. Strong prices continued into December, with the average prices for the month 20 percent higher than the previous year’s price. However in January, prices began to drop below last season’s price. During the 2013/14 season, growers received higher prices each month during the marketing year. The harvest came in 10 percent below the previous 5-year average, which assisted in elevating prices throughout the season. With a forecasted increase in navel orange production this season, prices should dip lower than last season’s highs but should remain strong due partially to quality and somewhat tight supplies. According to AMS, movement of fresh navel oranges has been sluggish, with shipments through mid-March down 12 percent from the same period last year. Slow movement to market is assisting in keeping prices up, particularly as citrus fruit can be stored on tree. The slower movement to market is also affecting exports. Fresh orange exports season to date (November through January) were at 148,721 short tons, down 8 percent from the same time last season. Since 2010/11’s record breaking export volume of 827,687 tons, exports have been dropping down to last season’s total export volume of 560,428 tons. The first 2 months of the 2014/15 season witnessed declined shipments (down 22 percent and 13 percent), negating the minor gain in January. Canada received 3 percent fewer oranges through January than the same time last year. Shipments were also reduced to Hong Kong and South Korea this season to date, down by 21 percent and 40 percent, respectively. Slow movement to market, higher domestic prices, and the strong U.S. dollar reducing international purchasing power of U.S. goods, have all contributed to the reduced trade so far this season. However, due to reduced global orange production, as reported by USDA’s Foreign Agriculture Service (FAS) in January, USDA’s Economic Research Service (ERS) forecasts fresh U.S. orange exports to reach 572,000 tons. If realized, the export volume would be just 2 percent more than 2013/14’s export total. Historically, the bulk of U.S. fresh orange exports occur in the spring; the U.S. citrus industry will benefit from the resolution of the recent West Coast port labor dispute prior to their heavy shipping period. From November through January 2015, fresh orange imports were 12,277 short tons, up 9 percent from the same period last season. November and December import levels were 22 percent and 20 percent over the same months last season, and are above the 5-year import average for each month. January imports were down 1 percent year over year, but remained 50 percent above the 5-year average. Typically, the first 3 months of imports represent 6 percent of total imports for the year. Given the smaller fresh-orange crop, coupled with the strong dollar, ERS forecasts imports to reach 165,000 tons in 2014/15. If realized, imports would be 5 percent above last season’s final of 157,693 tons. Mexico has shipped 12 percent more fresh oranges to the United States through January than in 2013/14 and 41 percent more than 2012/13. Florida Orange Crop Estimate Drops Slightly for 2014/15 Season Florida’s 2014/15 all-orange crop is forecasted at 4.6 million tons, down just below 3 percent from last season’s 4.7 million tons. Currently, the non-Valencia orange forecast is down 12 percent at 2.12 million tons from 2013/14’s level, and nearly 30 percent below the 3.02-million-ton 2012/13 harvest. The non-Valencia crop has been revised downward since the October 2014 initial production forecast of 2.34

10 Fruit and Tree Nuts Outlook/FTS-358/March 27, 2015
Economic Research Service, USDA
million tons, which would have only been 2 percent less than the previous season’s utilized harvest. According to the Florida Citrus Administrative Committee (FCAC)’s March 15 Utilization Report, all early- and mid-season oranges, as well as navels, were already fully harvested. The Valencia crop has faced similar downward revisions from the initial estimate of 2.52 million tons and is currently estimated at 2.48 million tons, up 7 percent from 2013/14. Harvest of Valencia oranges is slower than previous seasons, with 97.5 percent of fruit still on tree when last season was 94.2 percent for the same period. With overall Florida orange production down, and a majority of those oranges destined for processing, ERS forecasts orange juice production to decline 3 percent to reach 664 million single-strength equivalent (sse) gallons (table 5). Lower juice yields and decline in overall production so far this season will be supplemented by more imports. ERS forecasts imports to increase to 425 million sse gallons. If realized, this would represent a 2-percent increase from a season ago. Already year-over-year increases in imports have been reported in 3 out of 4 months so far this marketing season. Lower beginning stocks and the decline in production has reduced overall domestic supply availability by 4 percent, which in turn limits export volume. Monthly exports this season are sluggish, lagging below last season’s volumes for each month and the 5-year average volumes. Based on these early indications and the strong dollar, ERS forecasts U.S. orange juice exports to be down 14 percent for this season relative to last, reaching 135 million
Table 5 --United States: Orange juice supply and utilization, 1986/87 to presentBeginning Domestic Ending Per capita
Season1 stocks Production Imports Supply Exports consumption stocks consumption
--------------------------------------Million SSE gallons 2 --------------------------------------- Gallons 1986/87 204 781 396 1,381 73 1,106 201 4.57 1987/88 201 907 296 1,404 90 1,103 212 4.52 1988/89 212 970 272 1,454 73 1,148 233 4.66 1989/90 233 652 350 1,235 90 920 225 3.70
1990/91 225 876 320 1,422 94 1,170 158 4.65 1991/92 158 930 286 1,374 107 1,096 170 4.30 1992/93 170 1,207 324 1,701 114 1,337 249 5.18 1993/94 249 1,133 405 1,787 107 1,320 360 5.04 1994/95 360 1,257 198 1,815 117 1,264 434 4.77
1995/96 434 1,271 261 1,967 119 1,431 417 5.34 1996/97 417 1,437 256 2,110 148 1,398 564 5.16 1997/98 564 1,555 281 2,400 150 1,571 679 5.73 1998/99 679 1,236 350 2,265 147 1,585 534 5.71 1999/2000 534 1,493 339 2,366 146 1,575 645 5.60
2000/01 645 1,389 258 2,292 123 1,471 698 5.18 2001/02 698 1,435 189 2,322 181 1,448 692 5.05 2002/03 692 1,250 291 2,233 103 1,426 705 4.93 2003/04 705 1,467 222 2,393 123 1,448 822 4.96 2004/05 822 974 358 2,153 119 1,411 623 4.79
2005/06 623 986 299 1,909 138 1,312 459 4.41 2006/07 459 889 399 1,747 123 1,248 376 4.15 2007/08 376 1,156 406 1,938 136 1,155 647 3.80 2008/09 647 1,060 317 2,025 125 1,206 594 3.93 2009/10 694 837 328 1,859 147 1,155 557 3.75 2010/11 558 919 265 1,742 210 1,128 404 3.63
2011/12 404 949 223 1,576 154 973 449 3.11 2012/13 449 845 421 1,714 159 1,022 534 3.24 2013/14 534 686 418 1,637 158 996 483 3.13 2014/15 F 483 664 425 1,573 135 989 449 3.09 F= forecast. 1Season begins in October of the first year shown as of 1998/99, prior-year season begins in December.
Source: USDA, Economic Research Service.
2SSE = single-strength equivalent.

11 Fruit and Tree Nuts Outlook/FTS-358/March 27, 2015
Economic Research Service, USDA
sse gallons—the lowest since 2008/09 if realized. Tight overall supplies this season will drive down orange juice ending stocks. ERS forecasts ending stocks at 449 million sse gallons, a 7-percent decline from last season’s ending stocks. Through January 2015, cold storage levels for orange juice were 4 percent lower than when compared to the same period a year ago. By reducing stocks and increasing imports, domestic consumption levels only dip 1 percent to 989 million sse gallons. Per capita consumption is forecast to drop to 3.09 gallons per person for the 2014/15 season. This is partially supported by the Florida Department of Citrus’s (FDOC) Nielsen retail sales data through March that shows a trend of overall increased price per gallon and lesser sales. Total orange juice sales volume from October through mid-February is down 9 percent compared to the same time last year, with prices up 5 percent. Not-from-concentrate (NFC) orange juice sales are down 3 percent through mid-February, with prices up 8 percent and gallon movement down 9 percent (fig. 5). Prices for the season so far are averaging $7.53 per gallon, compared to $7.12 per gallon last year. Grower prices for Florida processing oranges averaged $5.45 per box this season through January, 7 percent higher than the same period in 2013/14 (table 6). Despite starting off the season with very weak price per box, each month has gained some ground over last season. Sizes are small for non-Valencia oranges, limiting supply which could be assisting in the higher prices so far this season. Small fruit size is also forecast for the upcoming Valencia harvest, likely affecting prices the same way, especially as high on-tree droppage rate and low juice yields also combine with small fruit size to force orange juice production down. The FCOJ yield is now forecast at 1.57 gallons per box, close to even with last season’s final yield but revised down from the initial forecast.
12 Fruit and Tree Nuts Outlook/FTS-358/March 27, 2015
Economic Research Service, USDA
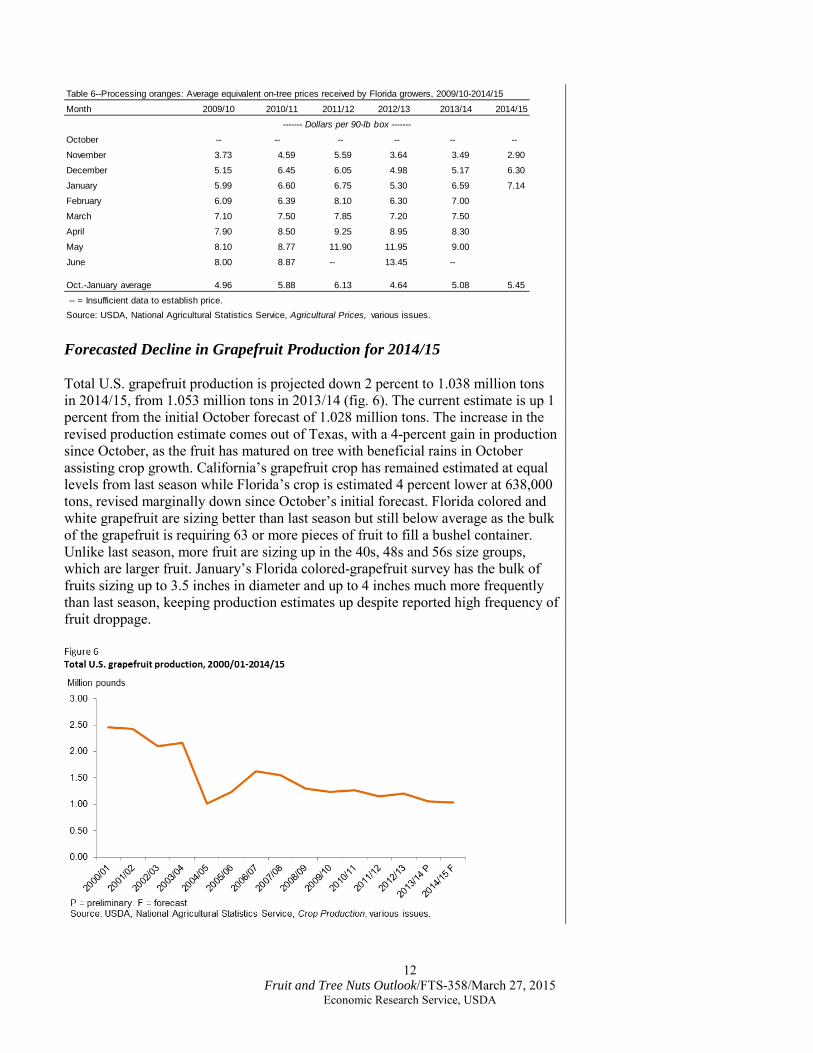
Forecasted Decline in Grapefruit Production for 2014/15 Total U.S. grapefruit production is projected down 2 percent to 1.038 million tons in 2014/15, from 1.053 million tons in 2013/14 (fig. 6). The current estimate is up 1 percent from the initial October forecast of 1.028 million tons. The increase in the revised production estimate comes out of Texas, with a 4-percent gain in production since October, as the fruit has matured on tree with beneficial rains in October assisting crop growth. California’s grapefruit crop has remained estimated at equal levels from last season while Florida’s crop is estimated 4 percent lower at 638,000 tons, revised marginally down since October’s initial forecast. Florida colored and white grapefruit are sizing better than last season but still below average as the bulk of the grapefruit is requiring 63 or more pieces of fruit to fill a bushel container. Unlike last season, more fruit are sizing up in the 40s, 48s and 56s size groups, which are larger fruit. January’s Florida colored-grapefruit survey has the bulk of fruits sizing up to 3.5 inches in diameter and up to 4 inches much more frequently than last season, keeping production estimates up despite reported high frequency of fruit droppage.
Table 6--Processing oranges: Average equivalent on-tree prices received by Florida growers, 2009/10-2014/15
Month 2009/10 2010/11 2011/12 2012/13 2013/14 2014/15
October -- -- -- -- -- --
November 3.73 4.59 5.59 3.64 3.49 2.90
December 5.15 6.45 6.05 4.98 5.17 6.30
January 5.99 6.60 6.75 5.30 6.59 7.14
February 6.09 6.39 8.10 6.30 7.00
March 7.10 7.50 7.85 7.20 7.50
April 7.90 8.50 9.25 8.95 8.30
May 8.10 8.77 11.90 11.95 9.00
June 8.00 8.87 -- 13.45 --
Oct.-January average 4.96 5.88 6.13 4.64 5.08 5.45
-- = Insufficient data to establish price.Source: USDA, National Agricultural Statistics Service, Agricultural Prices, various issues.
------- Dollars per 90-lb box -------

13 Fruit and Tree Nuts Outlook/FTS-358/March 27, 2015
Economic Research Service, USDA
The season average U.S. grower price for fresh grapefruit though January was $11.89 per box, 12 percent above the same period last season (table 7). October prices were $17.01 per box, nearly double the price of last October. Since the high in October, prices have weakened each month as more fruit reached the market. Movement of fresh grapefruit reported by AMS is up 3 percent through the mid-March when compared to the same period last year. Though prices have weakened seasonally, strong quality out of Texas should keep prices just slightly below last season’s. Slow movement is also noticeable in the FCAC’s utilization report through mid-March, with 35 percent of the Florida grapefruit crop waiting to be harvested, compared to 22 percent remaining on tree for the same period last year. The FDOC shipment data through March 1, 2015 has total fresh grapefruit movement down 6 percent season to date. Harvest was on-going with colored grapefruit having the largest quantities going to the fresh market. FCAC currently has about 32 percent of all grapefruit going to processing through early March, with 28 percent of white grapefruit sent to processing and a corresponding 33 percent for red grapefruit. These figures can change as the season progresses and more fruit moves from field to market. The slightly lower overall grapefruit production, reflecting mostly losses from Florida production and generally smaller fruit size is expected to reduce grapefruit juice production in 2014/15. Currently, ERS forecasts a 3-percent decline in grapefruit juice production to reach 63 million sse gallons (table 8). Softening the loss of production, ERS anticipates an increase of juice imports to 540,000 gallons sse, more than double the previous years volume of 220,000 gallons. With beginning stocks up 7 percent this season, overall supply is anticipated up 1 percent to 103.9 million sse gallons. Though available grapefruit juice supplies are up, movement has been slow, with FDOC reporting gallon sales of grapefruit juice down 5 percent season to date coupled with relatively similar year-to-date stock levels through the end of January. Slow movement is behind the almost stable ending stocks that ERS forecasts for 2014/15, at 39.9 million sse gallons, just 1 percent lower than last season’s 40.4
Table 7--Fresh grapefruit: Average equivalent on-tree prices received by U.S. growers, 2009/10-2014/15
Month 2009/10 2010/11 2011/12 2012/13 2013/14 2014/15
October 19.80 8.08 10.44 16.42 7.96 17.01
November 13.95 15.26 10.09 12.20 11.42 11.90
December 12.33 10.91 10.14 10.64 11.47 9.95
January 13.56 10.56 10.04 10.70 12.09 9.06
February 12.63 9.50 10.30 9.16 11.89
March 11.35 10.31 11.64 7.73 11.91
April 9.03 11.05 12.65 9.11 11.12
May 7.50 10.45 13.47 8.26 7.89
Oct.-Jan. average 14.91 11.20 10.18 12.49 10.74 11.981The net weight of a grapefruit box for Florida: 85 lb, for Arizona andCalifornia: 80 lb (67 prior to the 2010-11 crop year), for Texas: 80 lb.Source: USDA, National Agricultural Statistics Service, Agricultural Prices, various issues.
------- Dollars per box1 -------

14 Fruit and Tree Nuts Outlook/FTS-358/March 27, 2015
Economic Research Service, USDA
million sse gallons. The slight rise in supplies lends to a forecasted bump in exports to 13 million sse gallons, up 8 percent when compared with last season. Though season-to-date exports are down, the previous 5-year average export volume for October through January represents about 25 percent of total exports for the season, indicating that most of the exports for the season are to occur in the coming months. Total consumption is expected up marginally to 51 million sse gallons, representing about 0.16 gallons of grapefruit juice per person. Retail sales are currently down 5 percent, with juice prices up 4 percent over the same period according to FDOC’s February Nielsen sales report. As the season continues and fruit moves to processors, increasing domestic availability which could place downward pressure on prices, assisting in bolstering consumption. Florida grower prices for processing grapefruit are down from last season, reaching into negative price territory during the first 3 months of 2014/15 (table 9). Prices in January 2015 averaged $1.69 per 85-lb box, the first month so far this season to have positive prices, although not uncommon in the grapefruit processing market. Prices typically strengthen during the latter half of the year as supplies decline seasonally. Despite the lower processing grapefruit grower prices, grapefruit juice retail prices are strong, season to date. FDOC reported prices are averaging 4 percent above last season over the same period.
Table 8--Grapefruit juice: Supply and utilization 1991/92-2014/15
Supply UtilizationYear1 Beginning Ending
Production Imports stocks Total stocks Exports Total Per capita
Gallons
1991/92 119.5 4.2 41.6 165.3 38.6 23.2 103.5 0.40
1992/93 186.3 1.9 38.6 226.8 70.5 22.0 134.3 0.52
1993/94 168.5 0.9 70.5 239.8 59.4 17.4 163.0 0.62
1994/95 190.8 0.9 59.4 251.1 72.0 22.1 157.0 0.59
1995/96 171.5 0.5 72.0 244.0 66.2 26.8 151.0 0.56
1996/97 192.0 0.2 66.2 258.3 86.3 21.3 150.8 0.55
1997/98 166.0 0.2 86.3 252.5 67.8 18.1 166.6 0.60
1998/99 170.9 1.3 67.8 240.0 54.3 24.3 161.3 0.58
1999/2000 203.4 5.0 54.3 262.7 81.9 32.9 147.8 0.52
2000/01 183.3 0.9 81.9 266.2 74.8 39.0 152.3 0.53
2001/02 179.4 0.3 74.8 254.5 83.6 36.3 134.7 0.47
2002/03 140.5 0.4 83.6 224.5 71.7 38.3 114.4 0.39
2003/04 146.7 0.5 71.7 218.9 65.5 42.3 111.1 0.38
2004/05 49.0 11.5 65.5 125.9 35.5 23.9 66.5 0.22
2005/06 80.8 5.6 35.5 121.9 42.0 18.7 61.2 0.21
2006/07 121.4 0.9 42.0 164.4 57.9 20.2 86.3 0.29
2007/08 109.2 0.3 57.9 167.4 59.8 16.1 91.6 0.30
2008/09 83.6 0.5 59.8 143.9 47.8 15.6 80.5 0.26
2009/10 76.9 0.6 47.8 125.3 44.8 12.8 67.7 0.22
2010/11 83.9 0.4 44.7 128.9 36.6 15.9 76.4 0.24
2011/12 77.0 0.5 36.6 114.1 40.1 15.1 58.9 0.19
2012/13 75.0 0.8 40.1 115.9 37.9 14.6 63.4 0.20
2013/14 64.7 0.2 37.9 102.8 40.4 12.0 50.4 0.16
2014/15 F 63.0 0.5 40.4 103.9 39.9 13.0 51.0 0.16 F = forecast. 1Marketing season October-September. 2SSE = single-strength equivalent.
Source: USDA, Economic Research Service.
Consumption
------- Million SSE gallons 2 -------

15 Fruit and Tree Nuts Outlook/FTS-358/March 27, 2015
Economic Research Service, USDA
Lemon Prices Remain Strong While Forecast Production Increase The U.S. lemon crop is anticipated up 7 percent to 888,000 tons from 2013/14 final utilized total of 832,000 tons. Even with gains in production, the lemon harvest remains 3 percent below 2012/13’s harvest. Both Arizona and California have seen an increase in production. Production in Arizona is up 22 percent this season while California output has rebounded some, with a 5-percent increase over last season, but has yet to reach production levels similar to 2012/13. Fresh lemon grower prices have been exceptionally high since last year and holding strong through the beginning of this season, due to tight supplies and excellent quality. The average price for the season through January is $34.24 per box, nearly 30 percent above the 2013/14 average over the same period (table 10). Tight supplies and record-high lime prices in the spring of 2014 boosted U.S. demand for the lesser- priced lemons, resulting to higher lemon prices all season. On top of the already strong prices, supplies for lemons tightened during late summer pushing prices up further. Grower prices hovered around $40.00 per box from July through October. This season’s forecasted increase in production should alleviate some of the upward pressure on prices as the season continues and more lemons reach market. AMS reports that movement is up 7 percent this season through mid-March. Fresh lemon exports from August 2014 through January 2015 are up 2 percent compared to last season, reaching 65,565 tons. Shipments to Japan—a usual top destination for U.S. fresh lemons—dropped 30 percent so far this season. Canada is also receiving less fresh lemons this year but only a 2-percent loss through January. Some of the decline to Japan and Canada could be due to the very high prices lemons were receiving over the summer and early fall coupled with the strong dollar, hampering demand in this export markets. Hong Kong and China have increased shipments of U.S. fresh lemons so far this season, 71 percent and 58 percent, respectively. These countries increased imports are the main drivers of the 2 percent increase in total shipments through January. Strong demand for lemons to fill in for the tight, high-price lime market in the spring of 2014 reduced available supplies for the high-demand summer period, resulting in substantially higher lemon prices and imports. Imports of fresh lemons
Table 9--Processing grapefruit: Average equivalent on-tree prices received by Florida growers, 2009/10-201/15
Month 2009/10 2010/11 2011/12 2012/13 2013/14 2014/15
October -1.65 2.35 3.00 -0.47 -- -0.25
November 0.48 2.78 3.42 -0.19 0.01 -0.06
December 1.56 3.10 3.98 0.40 0.93 -0.93
January 2.35 3.54 4.66 1.76 1.91 1.69
February 2.76 3.81 4.60 3.14 2.29
March 2.85 3.65 4.90 3.67 2.72
April 1.73 3.62 4.45 2.53 2.79
May 0.93 3.48 -- -- --
Oct.-Jan. average 0.69 2.94 3.77 0.38 0.95 0.11
-- = Insufficient data to establish price.Source: USDA, National Agricultural Statistics Service, Agricultural Prices, various issues.
------- Dollars per 85-lb box -------

16 Fruit and Tree Nuts Outlook/FTS-358/March 27, 2015
Economic Research Service, USDA
from August 2014 through January 2015 were 48 percent above the same period last year to reach 56,499 tons. Mexico, the predominant supplier of fresh lemons to the United States, increased its exports to the United States by 30 percent so far this season over last. Chile also increased its shipments by 28 percent through January. Roughly 80 percent of lemon imports occur between August and January. Tangerines Continue Trend of Increased Production Thru 2014/15 Total production of U.S. tangerines/mandarins is estimated at 748,000 tons, a 3 percent crop gain since the previous year and if realized, will be the largest harvest on record (fig. 7). Production gains out of California and Arizona are making up for declining production in Florida. As of March’s NASS Crop Production report, California’s crop is estimated at 620,000 tons, up 7 percent from last season, resulting in yet another record harvest, if realized. Arizona’s mandarin production represents less than one percent of total U.S. production in 2014/15, nonetheless the crop forecast is up 10 percent from 2013/14’s 8,000 tons to 9,000 tons. Florida’s tangerine production is expected down 14 percent year-over-year to total 119,000 tons, the lightest crop since 1990/91, if realized. Downward revisions from the October forecast are due mainly to reductions to early harvest tangerines. Early season tangerines, Fallglo and Sunburst are sizing small, with 50 percent and 58 percent, respectively, being sized 210 or more per box. The harvest is complete for the earlier varieties. Honey tangerine harvest is underway, with 48.4 percent remaining as of March 1, according to the FCAC. Honey tangerines are also sizing up small. So far this season, the October through January grower price average is 6 percent higher than the same period last season. Fresh grower prices started strong this season at $35.54 per box in October then rose to $39.28 per box in November (table 11). As harvest picked up in California, prices have declined below 2013/14’s monthly prices. December and January prices were 3 percent and 26 percent lower than in 2013/14.
Table 10--Fresh lemons: Average equivalent on-tree prices received by U.S. growers, 2009/10-2014/15
Month 2009/10 2010/11 2011/12 2012/13 2013/14 2014/15
August 24.26 25.43 25.09 19.15 26.86 39.16
September 27.06 25.83 22.59 17.75 27.85 36.72
October 24.77 25.43 19.59 19.36 32.77 41.41
November 25.37 26.73 19.09 17.36 26.65 33.57
December 22.41 19.03 19.79 16.46 23.52 21.68
January 22.43 15.13 21.29 10.65 21.17 32.91
February 22.27 12.63 18.50 7.28 21.69
March 21.26 12.93 17.89 7.35 21.31
April 22.86 14.83 18.89 8.83 22.39
May 23.36 16.13 21.29 14.77 24.54
June 23.86 17.93 22.29 15.89 29.91
July 24.96 22.43 20.59 18.35 40.05
Aug.-Jan. average 24.38 22.93 21.24 16.79 26.47 34.241Beginning in 2010/11, boxes are 80 lb. Prior to 2010/11, box size was 76 lb.
Source: USDA, National Agricultural Statistics Service, Agricultural Prices, various issues.
------- Dollars per box1 -------

17 Fruit and Tree Nuts Outlook/FTS-358/March 27, 2015
Economic Research Service, USDA
California Early Strawberries Lag But Florida and Mexico Provide Ample Supplies California strawberry supplies are gradually picking up for the 2015 season although, season to date volume through early March is down 8 percent from a year ago, based on weekly shipment data from AMS. In abundance this winter, Florida supplies are making up for the slow start in the west, filling in particularly for markets in the east coast, with January through early March shipment volumes up 30 percent from the same time last year. Likewise, strawberries arriving from Mexico were at nearly last year’s volumes through early March, also contributing to ample supplies thus far this winter. Ample winter supplies lead to lower prices: U.S. fresh strawberry grower prices declined from $2.09 per pound in December 2014 to $1.35 per pound in January 2015 as both Florida and Mexico’s shipping season went into full swing. In February, ample supplies brought average strawberry f.o.b. shipping-point prices in Central Florida about 8 percent below the February 2014 average. Heightened
Table 11--Fresh tangerines and mandarins: Average equivalent on-tree prices received by
U.S. growers, 2009/10-2014/15
Month 2009/10 2010/11 2011/12 2012/13 2013/14 2014/15
October 14.00 11.90 9.55 15.05 -- 35.54
November 26.31 34.53 21.99 23.98 31.48 39.28
December 25.05 30.30 26.88 28.21 31.37 30.49
January 19.43 21.41 19.18 23.18 25.17 18.55
February 11.22 18.51 22.03 24.84 30.53
March 16.40 15.99 26.82 28.52 31.26
April 18.55 18.66 -- -- --May -- -- -- -- --
Oct.-Jan. average 21.20 24.54 19.40 22.61 29.34 30.97 -- = insufficient data to establish price. 1The net weight of a tangerine box for Florida: 95 lbs, for Arizona andCalifornia: 80 lbs (75 prior to the 2010-11 crop year).Source: USDA, National Agricultural Statistics Service, Agricultural Prices , various issues.
------- Dollars per box1 -------

18 Fruit and Tree Nuts Outlook/FTS-358/March 27, 2015
Economic Research Service, USDA
demand for strawberries leading up to Valentine’s Day provided a boost to f.o.b. prices, particularly in California where supplies were still somewhat short. U.S. consumers were able to purchase fresh strawberries at lower prices than last year in January, with retail prices averaging $2.45 per 12-oz dry pint, compared with $2.64 in January 2014, based on BLS data. Advertised retail prices at major national supermarkets in the United States tracked by AMS also showed strawberry prices down from a year ago (fig. 8). The prices run $0.12 to $0.13 cheaper than a year ago for 1-lb packages. Winter supplies from Florida and Mexico were winding down in March as California supplies continued to build up for the spring and summer demand. Prices are likely to continue to weaken in the next few months with seasonal supply increases from California. However, with reduced strawberry acreage anticipated in California in 2015, statewide production may be curtailed, especially if yields take a hit from less-than-normal weather. California acreage reduced: Total strawberry acreage in California in 2015 is reported at 37,438 acres, down from 38,937 acres in 2014, according to the California Strawberry Commission’s Acreage Survey. Eighty-five percent of this acreage was planted in the fall 2014, producing for the winter, spring, and summer of 2015. Fall planted acreage declined 5 percent from the previous year, reflecting reduced acres in all production districts. But supplying the fall 2015 strawberry market, California’s summer planted acreage is expected to be up 9 percent from a year ago. Summer plantings are mostly in the Oxnard and Santa Maria growing districts but small acreage is also present in the Watsonville/Salinas district. All three districts expect a bump in acreage in 2015. With the anticipated decrease in acreage in California and yield-per-acre assumption using the 2012-14 average, ERS projects the State’s strawberry production to reach 2.6 billion pounds in 2015, down about 5 percent compared to a year ago. At this level, California’s production will be slightly below the previous 3-year average of 2.7 billion pounds, but higher than the rest of the previous decade.

19 Fruit and Tree Nuts Outlook/FTS-358/March 27, 2015
Economic Research Service, USDA
With California’s dominant role in U.S. strawberry production, this projected decline points to a smaller overall crop in 2015, likely supporting grower prices through this summer that potentially will translate to higher prices to consumers. Fresh and frozen per capita use likely to decline: Net domestic production (U.S. production minus exports) accounts for almost 90 percent of all fresh strawberries consumed in the United States each year (table 12). Keeping this share at the same level, ERS projects U.S. fresh strawberry production in 2015 to be down 4 percent from last year’s 2.4 billion pounds and the remaining output channeled to the processing sector down about 3 percent. Fueled by population growth, healthy-diet awareness, and increased year-round availability, demand for strawberries continues to grow despite annual supply fluctuations. U.S. fresh strawberry per capita use has achieved record levels each year since 2002 reaching a peak of 8.0 pounds per person in 2013 (fig. 9). Last year’s per capita use was nearly unchanged from the 2013 record. Should the overall reduced crop be realized in 2015, fresh supplies for domestic and export markets will be slightly curtailed and U.S. fresh strawberry per capita use will potentially face a decline to levels slightly below the record high.
Table 12--Fresh strawberries: Supply and utilization in the United States, 1980 to 2014 Supply Utilization
Year ConsumptionUtilized production Imports Total supply Exports Total Per capita
Pounds
1980 482.1 12.7 494.8 47.1 447.7 1.971981 537.5 6.7 544.2 44.4 499.8 2.171982 589.6 4.5 594.1 44.0 550.1 2.371983 585.4 5.1 590.5 46.4 544.1 2.321984 748.2 8.8 757.0 56.3 700.7 2.961985 754.1 9.6 763.7 51.5 712.2 2.991986 734.8 13.0 747.8 51.5 696.3 2.891987 780.4 33.2 813.6 57.1 756.5 3.121988 855.5 39.4 894.9 78.0 816.9 3.331989 861.6 36.0 897.6 93.0 804.7 3.25
1990 863.6 32.2 895.8 85.7 810.1 3.241991 968.2 31.5 999.7 95.2 904.4 3.571992 999.7 23.8 1,023.5 102.3 921.2 3.591993 1,010.8 31.4 1,042.2 102.1 940.1 3.621994 1,147.7 43.7 1,191.4 126.4 1,065.0 4.051995 1,145.6 58.8 1,204.4 111.4 1,093.1 4.101996 1,212.6 67.3 1,279.9 116.0 1,163.9 4.321997 1,201.8 31.9 1,233.7 115.8 1,117.9 4.101998 1,132.2 58.1 1,190.3 109.3 1,081.1 3.921999 1,305.2 94.8 1,400.0 124.3 1,275.7 4.57
2000 1,433.3 76.2 1,509.5 136.5 1,373.0 4.862001 1,259.7 70.7 1,330.4 128.1 1,202.3 4.212002 1,406.3 89.9 1,496.2 156.9 1,339.3 4.652003 1,642.4 90.3 1,732.7 194.8 1,537.9 5.292004 1,694.4 94.4 1,788.8 182.6 1,606.3 5.482005 1,811.0 122.7 1,933.7 207.6 1,726.1 5.832006 1,910.9 153.4 2,064.3 229.1 1,835.2 6.142007 1,973.3 157.7 2,131.0 240.3 1,890.7 6.262008 2,091.1 143.0 2,234.1 269.2 1,964.9 6.452009 2,288.0 187.2 2,475.2 271.8 2,203.3 7.17
2010 2,319.6 198.3 2,517.9 279.8 2,238.1 7.232011 2,332.4 243.5 2,575.9 279.6 2,296.4 7.362012 2,455.2 351.3 2,806.5 301.6 2,504.8 7.972013 2,508.5 330.6 2,839.1 306.1 2,533.0 8.002014 P 2,454.3 355.9 2,810.2 273.6 2,536.6 7.96P = preliminary.Source: USDA, Economic Research Service.
-- Million pounds --

20 Fruit and Tree Nuts Outlook/FTS-358/March 27, 2015
Economic Research Service, USDA
Table 13--Frozen strawberries: Supply and utilization in the United States, 1980 to 2014 Consumption
Industry Imports Beginning Total Ending Exports Per capitaYear pack2 stocks supply stocks3 Total product weight
------------------------------------- Million pounds -------------------------------------------------
1980 253.1 83.5 132.5 469.1 151.9 4.4 312.8 1.371981 210.6 60.1 151.9 422.6 115.2 6.6 300.8 1.311982 272.7 34.9 115.2 422.8 139.9 7.1 275.8 1.191983 292.7 42.6 139.9 475.2 176.6 5.9 292.7 1.251984 231.4 50.9 176.6 458.9 166.0 8.0 284.9 1.211985 229.2 59.7 166.0 454.9 167.1 6.6 281.2 1.181986 237.6 52.5 167.1 457.2 146.6 8.5 302.1 1.261987 334.4 75.3 146.6 556.3 236.0 10.8 309.5 1.271988 274.6 64.3 236.0 574.9 235.2 17.8 321.9 1.311989 238.2 55.0 235.2 528.4 167.2 20.5 340.7 1.38
1990 305.9 72.1 167.2 545.2 198.3 32.8 314.1 1.261991 330.2 70.5 198.3 599.1 219.9 26.1 353.1 1.391992 268.5 58.2 219.9 546.6 173.8 30.0 342.8 1.341993 365.7 54.5 173.8 594.0 214.1 40.4 339.5 1.311994 369.0 55.2 214.1 638.3 244.7 63.1 330.4 1.261995 371.1 73.5 244.7 689.4 255.1 53.1 381.2 1.431996 330.1 56.9 255.1 642.1 212.0 46.9 383.2 1.421997 328.2 61.0 212.0 601.1 220.5 47.3 333.3 1.221998 373.8 54.2 220.5 648.6 201.4 59.6 387.6 1.401999 419.8 89.8 201.4 711.0 277.7 55.6 377.7 1.35
2000 439.7 78.0 277.7 795.4 310.5 42.8 442.2 1.572001 422.4 76.0 310.5 808.8 243.7 42.9 522.2 1.832002 415.9 112.7 243.7 772.2 263.7 45.4 463.1 1.612003 429.1 120.1 263.7 812.9 247.2 22.9 542.8 1.872004 433.6 125.7 247.2 806.4 293.6 22.0 490.9 1.672005 416.5 161.6 293.6 871.7 218.8 22.2 630.7 2.132006 458.5 181.5 218.8 858.8 202.5 28.1 628.2 2.102007 502.2 182.2 202.5 886.8 280.2 32.0 574.6 1.692008 424.9 173.8 280.2 878.9 235.2 35.0 608.6 1.782009 482.4 170.3 235.2 887.9 322.5 32.1 533.4 1.54
2010 459.0 188.0 322.5 969.5 263.1 34.3 672.1 1.932011 458.3 193.1 263.1 914.6 291.7 45.1 577.7 1.652012 497.9 215.6 291.7 1005.2 303.0 53.5 648.7 1.842013 460.0 199.4 303.0 962.4 279.1 62.9 620.4 1.7420141 465.3 224.0 279.1 968.4 206.8 63.4 698.1 1.951Preliminary.2After 2002, estimates from the Processing Strawberry Advisory Board of California. Previous estimates from theAmerican Frozen Food Institute. 3Stock data from USDA, National Agricultural Statistics Service, Cold Storage Summary.Source: USDA, Economic Research Service.
Pounds

21 Fruit and Tree Nuts Outlook/FTS-358/March 27, 2015
Economic Research Service, USDA
As a residual market to fresh, demand was fairly strong in the frozen strawberry market in 2014. Though U.S. strawberry production declined last year, production destined for processing increased at the same time strawberry grower prices moving through this sector averaged 22 percent higher than the previous year at $42.6 per hundredweight. The Processing Strawberry Advisory Board of California reported the U.S. frozen strawberry pack in 2014 was up 1 percent from the previous year to 465.3 million pounds, product-weight equivalent, and along with higher imports and beginning inventories, bumped up overall frozen strawberry supplies to 968 million pounds—the third highest on record (table 13). At the end of 2014, frozen inventories were down 26 percent from the previous year to 206.8 million pounds—the lowest since 1998. U.S. consumers are the main market for U.S. frozen strawberries; only around 10 percent of the annual frozen pack gets exported, mainly to Canada, Japan, Mexico, and South Korea. Last year, U.S. frozen strawberry exports reached a record high at 63.4 million pounds, product-weight equivalent. Lower frozen inventories carried forward into 2015, along with projected lower frozen pack will mean limited supplies of frozen strawberries to meet this year’s export and domestic demand. U.S. frozen strawberry per capita use will likely decline from last year’s record-high 2.19 pounds, product-weight equivalent (or 1.95 pounds on a fresh-weight basis). Ample Blueberry Supplies Soften Prices This Winter Southern Hemisphere supplies take over the U.S. blueberry market during the winter in the absence of domestic production. Imports, mainly from Chile, start to trickle into the market during the fall and peak around the winter months of January and February. Other Southern Hemisphere countries such as Argentina, Uruguay and Peru also export fresh blueberries to the United States (mostly in the fall) but at much lesser volumes. Chilean blueberries make about half of annual U.S. fresh blueberry imports, Argentina more than one-tenth, and Uruguay and Peru each about 2 percent. Chilean exports to increase: Despite some freezing temperatures affecting some blueberry production areas in Chile back in October 2014, weather during the growing season has generally been promising for promoting fruit growth and crop quality, potentially increasing exports this season. As U.S. blueberry demand continues to grow, fresh blueberry imports have grown to play a more important role in meeting this demand by enabling the market to provide year-round supplies (fig. 10). The United States remains a very important market for Chile’s blueberry exports. Based on data from the Chilean Blueberry Committee, an affiliate of the Chilean Fresh Fruit Exporters Association, Chile is projected to export close to 104,000 tons of fresh blueberries during the 2014/15 season, up 40 percent from last season when a frost-reduced crop tightened export supplies. In addition to the frost, phytosanitary issues restricting the entry of Chilean blueberries from certain production regions into the U.S. market and a port labor dispute were reported by the industry to have also contributed to the export decline in 2013/14. Increased import supplies pressure down prices this winter: Chile’s 2014/15 blueberry shipping season was well underway going into 2015. AMS shipment data showed cumulative U.S. import volumes from the country in 2014 through mid-March were up 22 percent from the same period the year before, driving down

22 Fruit and Tree Nuts Outlook/FTS-358/March 27, 2015
Economic Research Service, USDA
blueberry prices in the United States this winter relative to last year’s. Shipment gains were up substantially from a year ago in January then moderated in February. As Chile’s shipping season started off about a week earlier than normal, volumes also fell from January to February, providing some strength to February prices from earlier in the year. Shipping-point f.o.b. prices for Chilean blueberries (entering Los Angeles, Miami, and Philadelphia ports) averaged $25.83 per flat of 12 1-pint cups with lids in January, compared with $29.05 in January 214. F.o.b. prices in February averaged $27.71 per flat, compared with $25.54 the same time last year. U.S. consumers are finding blueberry prices more attractive thus far in 2015. Each month from January through early March, U.S. advertised retail prices for fresh blueberries averaged $3.00 to $3.50 per 1-pint package, compared with $3.30 to $3.80 the same time last year. As with the f.o.b. prices, advertised retail prices rose with each succeeding month, reflecting seasonal declines in Chilean supplies. Meanwhile, domestic production is gearing up for the upcoming harvest, commencing with the Florida crop. Delays in early domestic production to boost prices this spring: Florida blueberries are the first to become available during the U.S. blueberry season, typically having market presence until Georgia and the Carolina States enter the market in late April. Production then transitions to other major producing States through the summer. Blueberry production areas in north Florida and Georgia experienced freezing temperatures around mid-February. Growers applied frost protection but windy conditions raised concerns as to the effectiveness of frost protective systems. How much damage this freeze may have caused remains to be seen. Industry reports indicated, production in Central Florida could be less affected by the freeze but the overall colder weather will likely delay harvest start. This will likely leave some supply gap in the market, providing a boost to domestic blueberry prices this spring.

23 Fruit and Tree Nuts Outlook/FTS-358/March 27, 2015
Economic Research Service, USDA
Avocado Supplies in the U.S. Market To Be Plentiful The California Avocado Commission (CAC) indicated that the State’s avocado crop in 2014/15 will be about 10 percent larger than the previous season. On the basis of this expected growth rate and NASS’s 2013/14 production estimate, ERS projects 2014/15 production in California between 163,000-164,000 tons (or approximately 327 million pounds). Though smaller than recent bumper crop years 2005/06, 2009/10, and 2011/12 when production averaged over 250,000 tons, this season’s anticipated production is well above the previous 5-year average of non-bumper crop years (fig. 11). NASS did not report production in 2012/13 but CAC indicated that year was also a bumper year for California avocados, with approximately 250,000 tons (or 500 million pounds) in production, up 8 percent from 2011/12. Because California produces around 85 percent of U.S. avocados each year, production in the State strongly influences fluctuations in annual overall crop size. Despite some cold-weather induced crop damage in early January, the California avocado crop in 2014/15 is reported to be of excellent quality. So far, warm weather this winter has gotten supplies off to an earlier start. Early California supplies this winter were light but higher than last year. Growers were expecting harvest to pick up in March and bring in as much promotable volume by April and May before anticipated large supplies enter the market from Peru this summer. Industry sources have indicated Peru may likely ship nearly 50 percent more avocados to the U.S. market this summer compared to last, the same time California and Mexico have market presence. Exporters to the United States garner higher prices this winter: Late-season avocados from Mexico account for a majority of the supplies available in the U.S. market during the winter, along with some late-season volume from Chile. Despite continued higher-than-year-ago volumes from Mexico, Hass avocado prices in the United States have averaged above year-ago levels early this winter. Free-on-board (f.o.b.) shipping-point prices for Mexican Hass avocados averaged $32 and 35 per 2-layer carton (size 32s and 36s) in January and February, respectively, compared
24 Fruit and Tree Nuts Outlook/FTS-358/March 27, 2015
Economic Research Service, USDA
with $30 for the same months a year ago. Contributing to the price boost, AMS weekly shipment data show Chilean volumes were down substantially from a year ago in those two months. Small crop in Chile lowers country’s exports: Reduced Chilean avocados in the United States were reflective of Chile’s export response to significantly reduce acreage and production in the country in 2014/15, the result of severe drought conditions over the last four years affecting major production areas in the northern portion of the country. Avocado prices in Chile are more favorable, if not similar, to what Chilean growers could get selling in the export market, not to mention the advantage of receiving immediate payment for their production if sold domestically, according to FAS Global Agricultural Information Network (GAIN report no. C11418). Hence, the domestic market is home to about half of Chile’s avocado production. Having lost market share to Mexico in the U.S. avocado market, especially with Mexico’s year-round market presence in all 50 U.S. States, the European Union now serves as Chile’s top market for avocados, with the United States falling to second place. Increased production in Mexico in 2014/15: Aided in part by moderately higher production, Mexico’s Hass avocado exports to the United States are expected to continue to increase in 2014/15 (July-June). Good weather and continued implementation of phytosanitary pest control programs helped boost avocado production in Mexico. FAS forecasts Mexico’s 2014/15 production to increase to a record 1.50 million metric tons (3.31 billion pounds), up 23 percent from 2013/14. Favorable demand in domestic and international markets continues to encourage increased avocado production in Mexico. Acreage is expanding in other production areas outside Michoacán where production is mostly (over 80 percent of total crop) concentrated. Export promotion efforts is now shifting from being State focused (Michoacán in particular), to a whole country approach. Fresh avocado exports are expected to continue to grow in the next few years even though new domestic market niches emerge for avocados in Mexico, such as for non-food avocado products in the cosmetic industry. In 2014/15, nearly half of Mexico’s production is geared for exports and the United States remains as Mexico’s No.1 avocado export destination. Large supplies to lead to favorable prices for U.S. consumers: Given the expected increase in production in California and forecast increased exports from Mexico, growing demand for avocados in the United States will continue to be met with abundant supplies in 2014/15. Domestic avocado demand set a new record high in 2013/14, reaching the 6-pound per person mark, nearly double the amount a decade ago and almost four times as much as in the 1990s (fig. 12). Anticipated large supplies from Peru will also compete in the U.S. market this summer, and the presence of all three supply sources will provide retailers plentiful promotable volume through the summer. As such, U.S. consumers should expect to see favorable prices this spring and summer as they satisfy their appetite for avocados. As of this winter, U.S. advertised retail prices for Hass avocados averaged at or slightly over $1 each from January through March (thru February thus far), about 2 cents lower than in the same period a year ago, based on AMS data. Increased production to boost exports: On the export side, the expected production gains in California should help promote U.S. avocado exports in 2014/15, especially as the domestic market more consistently receives year-round

25 Fruit and Tree Nuts Outlook/FTS-358/March 27, 2015
Economic Research Service, USDA
supplies from imports. Totaling 25 million pounds and valued at $39 million, exports in 2013/14 declined to almost half the record-high volume in 2012/13 due mostly to reduced California production. Both volume and value of U.S. exports were down to top markets—Canada, Japan, and Mexico.

Melons
26 Fruit and Tree Nuts Outlook/FTS-358/March 27, 2015
Economic Research Service, USDA
Melons Per Capita Use Declines In 2014, estimated domestic disappearance (also known as net domestic use, which is a proxy for consumption) of melons totaled 7.26 billion pounds, declining 8 percent from the previous year. As annual population growth remained at less than 1 percent last year, the 2014 disappearance estimate translates to 22.8 pounds per person, down from 24.9 pounds in 2013 and the lowest by far since the estimate of 19.3 pounds in 1983 (fig. 13). Demand for melons in the United States peaked in 1999 at 29.7 pounds per person. Though imports have risen to record-high levels in recent years, declining domestic production continues to serve a growing U.S. population and export markets that take about 7 percent of annual domestic output, up from about 6 percent in the 1990s and 3 percent in the 1980s. A combination of reduced planted and harvested acreage and lower yields, particularly for watermelons and cantaloupes, lowered U.S. production of melons in 2014 by 13 percent from the previous year, enough to drive down overall domestic supplies. Watermelons: Total U.S. watermelon supply (domestic production plus imports) and domestic disappearance (total supply minus exports) fell below the previous 5-year average in 2014 (table 14). Relative to the previous year, total domestic disappearance in 2014 declined 6 percent to 4.30 billion pounds and per capita use dropped 7 percent to 13.5 pounds. The average watermelon yield per acre in 2014 declined to a 5-year low, along with planted and harvested acreage, driving down domestic production by 12 percent to 3.2 billion pounds—the lowest since 1991. Production was down in most major producing States, including Texas, Georgia, California, Florida, South Carolina, Arizona, and North Carolina. Imports were a record high, totaling 1.44 billion pounds and valued at $297 million. Supplying nearly 90 percent of U.S. watermelon imports, import volume from Mexico rose 8 percent in 2014 from the previous year and though smaller in scale, volume gains from Guatemala were substantially higher. Supplies from other leading sources--Honduras, Nicaragua, Panama, and Costa Rica—all declined.

27 Fruit and Tree Nuts Outlook/FTS-358/March 27, 2015
Economic Research Service, USDA
Despite reduced domestic production, U.S. watermelon exports continued strong in 2014, increasing 1 percent in volume from the previous year to 337 million pounds, 5 percent above the previous 5-year average. The value of exports declined almost 1 percent in 2014 to $83.6 million, but held moderately above the average value of the past 5 years. Volumes to Canada, Japan, and Mexico, leading U.S. watermelon export markets, all rose in 2014 from the previous year. Canada was recipient of 98 percent of the total export volume while the other two leading markets combined received most of the remaining volume. Seedless watermelon imports rose to a record 1.27 billion pounds, 88 percent of total watermelon imports in the United States in 2014. Imports increased from Mexico and Guatemala, with the latter realizing sharply higher gains. AMS data show continued increased supplies of imported seedless watermelons from Guatemala through mid-March plus a bouncing back in supplies from Honduras, which realized a sharp dip in their exports to the United States last year. However, tight early season imports from Mexico have driven prices higher for U.S. consumers earlier this year. Imports fill in demand gaps during the winter and early spring when domestic production is not in season. Seasonal supply increases into the spring will likely temper recent price gains. Advertised retail prices for red flesh seedless miniature watermelons in the United States were averaging 35 cents to 55 cents higher than last year’s January and February weighted-average prices, based on AMS data. As of early March 2015, the price for the same product showed weakening from earlier in the year and at $3.14 the price is almost even from the same time last year. Cantaloupe: Domestic disappearance of cantaloupe in 2014 declined 15 percent from the previous year to 2.2 billion pounds (table 15). With the slight growth in population, per capita use was estimated down 15 percent to almost 7 pounds—a 30-year low (in 1981, per capita use was estimated at 6.1 pounds). In the previous 5 years, per capita use averaged 8.4 pounds, 20 percent higher than in 2014. Five out of the nine States for which NASS reports annual production had output declines in2014; this includes the leading cantaloupe-producing States—California, Indiana, and South Carolina. A combination of 10 percent lower average yields and 8 percent to 9 percent reductions in planted and harvested acreage led to an 18-
Table 14--U.S. watermelons: Supply, utilization, and price, farm weight, 1970-2014
Supply Utilization Trade shares of: Per Use Supply
Year Imports2 Total Exports2 Domestic capita use imported exported
----------------------------------- Million Pounds -------------------------------- ---- Pounds ---- -------- Percent --------
Average1970s 2,564.7 165.8 2,730.4 91.4 2,639.1 12.3 6.3 3.41980s 2,842.0 238.6 3,080.5 61.4 3,019.1 12.7 7.8 2.01990s 3,766.4 342.0 4,108.4 216.7 3,891.8 14.7 8.6 5.2
Annual2000 3,749.4 446.0 4,195.4 293.3 3,902.1 13.8 11.4 7.02001 4,047.8 483.5 4,531.3 249.4 4,281.9 15.0 11.3 5.52002 3,958.5 451.3 4,409.8 364.5 4,045.4 14.0 11.2 8.32003 3,832.7 489.2 4,321.9 383.7 3,938.3 13.5 12.4 8.92004 3,688.0 546.9 4,234.9 424.0 3,810.9 13.0 14.4 10.02005 3,702.3 659.8 4,362.1 349.9 4,012.2 13.5 16.4 8.02006 3,986.5 830.5 4,817.0 297.4 4,519.6 15.1 18.4 6.22007 3,734.9 902.7 4,637.6 286.0 4,351.6 14.4 20.7 6.22008 3,994.0 1,057.1 5,051.1 307.1 4,744.0 15.6 22.3 6.12009 3,893.1 1,002.6 4,895.7 307.9 4,587.8 14.9 21.9 6.3
2010 4,170.1 989.9 5,160.0 296.1 4,863.9 15.7 20.4 5.72011 3,612.7 1,044.3 4,657.0 343.2 4,313.8 13.8 24.2 7.42012 3,615.3 1,092.6 4,707.9 344.1 4,363.7 13.9 25.0 7.32013 3,610.2 1,302.9 4,913.1 332.9 4,580.1 14.5 28.4 6.82014 3,195.2 1,442.5 4,637.7 337.1 4,300.6 13.5 33.5 7.3
Source: USDA, Economic Research Service.
Production1
1 Source: USDA, National Agricultural Statistics Service. Production data were estimated by ERS for 1982-91 based on available State data adjusted to the national level. Includes all uses. 2 Source: U.S. Dept. of Commerce, U.S. Census Bureau.

28 Fruit and Tree Nuts Outlook/FTS-358/March 27, 2015
Economic Research Service, USDA
percent decline in domestic production from the previous year, for a total of 1.49 billion pounds, the lowest since 1984 (at 1.65 billion pounds). As domestic production fell, lower imports and increased exports placed additional downward adjustments on overall supplies for domestic consumption. Import volume declined 5 percent in 2014 from the year before to 902 million pounds, marking a 17-year low. With the exception of Costa Rica, import volume declined from nearly all sources, including top suppliers to the United States—Guatemala and Honduras. Valued at $41.2 million, exports rose 10 percent in 2014 from the previous year, totaling 160.9 million pounds, higher than the two prior years but 6 percent below the previous 5-year average. Ninety five percent of the exports went to Canada. Though export volume fell to this leading market in 2014, gains to Mexico, Costa Rica, and the Bahamas helped boost exports. In January through February 2015, U.S. advertised retail prices for cantaloupes averaged $2.47 each, about 2 cents lower than the same period last year. From a high of $2.79 around mid-January, prices have generally fallen and as of mid-March were at $2.36 each, compared with $2.56 a year ago. AMS shipment data indicate imports are picking up, with increased volumes from the top 3 suppliers (Guatemala, Honduras, and Costa Rica) boosting overall imports this season through mid-March. Honeydew: With harvested acreage unchanged from 2013, higher overall yields boosted U.S. honeydew melon production to 373.9 million pounds in 2014, up 4 percent from the year before. Increased production was met with almost no change in imports and lackluster exports in 2014, leading to increased available supplies for U.S. consumers and correspondingly, a 3-percent increase in domestic honeydew per capita use (table 16). Although up last year, domestic production has generally trended down at least over the past two decades. Meanwhile, imports (mostly from Mexico) have gradually shown increasing presence in the U.S. markets and exports remain a small but stable outlet for U.S. honeydews.
Table 15--U.S. cantaloupes: Supply, utilization, and price, farm weight, 1970-2014
Supply Utilization Trade shares of: Per Use Supply
Year Total Exports3 Domestic capita use imported exported
----------------------------------- Million Pounds -------------------------------- ---- Pounds ---- -------- Percent --------Average1970s 1,163.7 166.3 1,330.0 46.7 1,283.3 6.0 13.0 3.51980s 1,716.7 257.3 1,974.0 87.7 1,886.4 7.9 13.3 4.51990s 1,953.1 691.9 2,644.9 117.6 2,527.3 9.5 26.8 4.4
Annual2000 2,177.4 1,119.2 3,296.6 155.5 3,141.0 11.1 35.6 4.72001 2,261.3 1,070.1 3,331.4 146.0 3,185.4 11.2 33.6 4.42002 2,244.3 1,108.6 3,352.9 156.1 3,196.8 11.1 34.7 4.72003 2,206.9 1,079.2 3,286.1 147.3 3,138.8 10.8 34.4 4.52004 2,129.8 910.8 3,040.6 160.7 2,879.9 9.8 31.6 5.32005 2,046.5 952.0 2,998.5 162.2 2,836.3 9.6 33.6 5.42006 1,949.8 962.8 2,912.6 146.4 2,766.1 9.3 34.8 5.02007 2,042.6 1,008.2 3,050.8 157.9 2,893.0 9.6 34.9 5.22008 1,929.4 931.0 2,860.4 157.7 2,702.7 8.9 34.4 5.52009 1,905.9 1,045.0 2,950.9 169.9 2,781.0 9.0 37.6 5.8
2010 1,880.8 949.2 2,830.0 186.1 2,643.9 8.5 35.9 6.62011 1,869.2 1,033.1 2,902.3 202.4 2,699.9 8.6 38.3 7.02012 1,670.6 841.7 2,512.3 150.1 2,362.1 7.5 35.6 6.02013 1,817.3 947.6 2,764.9 146.7 2,618.3 8.3 36.2 5.32014 1,491.2 901.6 2,392.8 160.9 2,231.9 7.0 40.4 6.7
Source: USDA, Economic Research Service.
Production1 Imports2
1Source: USDA, National Agricultural Statistics Service. Production data were estimated by ERS for 1982-91 based on available State data adjusted to the national level. Includes all uses. 2 Source: U.S. Dept. of Commerce, U.S. Census Bureau. 3 Exports for 1978-89 adjusted using Canadian import data.

29 Fruit and Tree Nuts Outlook/FTS-358/March 27, 2015
Economic Research Service, USDA
Last year, U.S. advertised retail prices for honeydew melons averaged $3.24 each for the entire season, compared with $3.14 in 2013. This year, U.S. consumers are seeing more favorable early-season pricing. U.S. honeydews typically are not in season until late spring, with peak harvest in the summer months. Winter market supplies are from imports. Imports were running slightly ahead of last year through early March and advertised retail prices for honeydew melons in the United States were averaging $3.08 each, compared with $3.27 the same time a year ago.
Table 16--U.S. honeydew melons: Supply, utilization, and price, farm weight, 1970-20141
Supply Utilization Per Use Supply
Year Total Exports2 Domestic capita use imported exported
----------------------------------- Million pounds -------------------------------- ---- Pounds ---- -------- Percent --------Average1970s 251.4 18.7 270.0 25.1 245.0 1.1 7.7 9.71980s 437.1 61.7 498.7 23.5 475.3 2.0 12.4 4.81990s 455.7 143.1 598.7 48.0 550.7 2.1 25.8 8.2
Annual2000 511.6 174.1 685.7 46.8 638.9 2.3 27.3 6.82001 472.0 139.9 611.9 48.6 563.2 2.0 24.8 8.02002 506.5 171.5 678.0 47.3 630.6 2.2 27.2 7.02003 507.5 163.9 671.4 39.4 632.1 2.2 25.9 5.92004 478.1 165.6 643.7 42.2 601.5 2.0 27.5 6.62005 424.3 175.7 600.0 45.6 554.4 1.9 31.7 7.62006 422.1 187.3 609.4 46.2 563.2 1.9 33.3 7.62007 414.4 180.8 595.2 42.3 552.9 1.8 32.7 7.12008 369.0 191.5 560.5 46.3 514.2 1.7 37.2 8.32009 365.7 171.8 537.5 40.2 497.4 1.6 34.5 7.5
2010 370.4 189.6 560.0 43.1 516.9 1.7 36.7 7.72011 362.8 181.4 544.2 42.6 501.5 1.6 36.2 7.82012 328.6 182.1 510.7 43.3 467.4 1.5 39.0 8.52013 360.5 198.4 558.9 47.6 511.3 1.6 38.8 8.52014 P 373.9 197.1 571.0 40.6 530.4 1.7 37.2 7.1
have a separate HS code. From 1970-79, trade was estimated as 50 percent of the category called "other melons." From 1980-91, shipment data were used to estimate the distribution of the "other melon" category (ranged from 42 to 59 percent. Exports were not adjusted due to data l imitations. Source: USDA, Economic Research Service.
P= preliminary. 1 Source: USDA, National Agricultural Statistics Service. 2 Source: Bureau of the Census, Dept. of Commerce. Honeydews do not
Production1 Imports2
Trade shares of:

Tree Nuts
30 Fruit and Tree Nuts Outlook/FTS-358/March 27, 2015
Economic Research Service, USDA
Almond Production Revised Down for 2014/15 Season
In the January NASS Noncitrus Fruit and Tree Nut 2014 Preliminary Summary report, California almond production was revised down 11 percent to 1.87 billion pounds, from the initial estimate of 2.1 billion pounds reported in the June 2014 Almond Objective Measurement Report, and down 7 percent from last season’s final production estimate of 2.01 billion pounds (fig. 14). Yield per acre was down 9 percent from last’s seasons 2,390 pounds per acre, reaching only 2,170 pounds per acre—the lowest since the 2009. A smaller amount of nuts per tree this season, estimated to be 6,646 nuts per tree, down from 2013’s 6,686 nuts per tree, partly explains the reduced yield and production. In fact, nuts per tree across California have declined slightly each season since 2011, when 7,353 nuts per tree were reported. The fewer nuts on tree actually gives the nutmeat more resources to develop into heavier kernels. This season, nut sizes were estimated to weigh 1.45 grams, 6 percent heavier than 2013’s average nut weight of 1.36 grams. The heavier nut, coupled with the 3-percent acreage gain, assisted in keeping crop levels above the previous 5-year production average of 1.796 billion pounds. With the lower production this season, season-average grower prices were the highest recorded as far back as 1970. Grower prices averaged $3.50 per pound in 2014/15, up 9 percent from $3.21 per pound the previous season. The higher grower price pushed up the value of utilized production to record high $6.46 billion, just 1 percent above last season’s. Almond production in California has set record-breaking crop values since 2010. It was in 2012 when the crop broke the $6.0 billion mark. Exports of California almonds through January 2015 are down 16 percent when compared to the same time last season. Inshell almond exports are down 6 percent year over year. Exports of inshell almonds to Hong Kong, a major destination for U.S. almonds, are down 23 percent from last year while shipments to India and the United Arab Emirates increased by 17 percent and 55 percent, respectively. Shipments to China are down more than threefold, at 5.8 million pounds, from 19.3 million pounds last season to date. The gains have not offset the losses in export volumes for inshell almonds. Shelled almond export volume is down 18 percent through January to reach 478 million pounds. Spain received 42 percent fewer shelled almonds from the United States than last season to date and Germany and Hong Kong each received more than 10 percent fewer almonds. Exports should remain lower than last season due to the slowing of movement out of west coast ports and the strength of the U.S. dollar. Since the U.S. is the largest global producer of almonds, imports tend to be of less importance to the domestic market, with only about 6 percent of total U.S. domestic supplies sourced from imports over the previous 5 years. Australia is the main source of imported almonds in the United States. Imports of inshell almonds from Australia are down 36 percent season to date. U.S. shelled almond imports this season through January have more than doubled from 4.205 million pounds last season to 9.442 million pounds. Shelled imports from Australia are up fourfold from last season and those from Spain up 80 percent.

31 Fruit and Tree Nuts Outlook/FTS-358/March 27, 2015
Economic Research Service, USDA

2014 Crop Value Summary
32 Fruit and Tree Nuts Outlook/FTS-358/March 27, 2015
Economic Research Service, USDA
2014 Total Crop Value for Fruit, Tree Nuts, and Melons Unchanged From Previous Year The February NASS release of Crop Value 2014 Summary reported the value of U.S. fruit, melon, and tree nut production at $30.6 billion in 2014, relatively unchanged from the previous year (table 17). Top ranking commodities were almonds, grapes, apples, strawberries, oranges, and pistachios, each with at least over $1 billion in crop value. The almond crop value ranked highest, at $6.5 billion, nearly a quarter of total crop value for fruit, nuts, and melons. The next 5 commodities together accounted for another 48 percent. Completing the top 10 list included blueberries, sweet cherries, lemons, and peaches. Citrus fruit: The 2014 U.S. citrus crop was valued at $3.4 billion, 7 percent higher than in 2013 but down from the $3.7 billion in 2012. Significant gains in crop values for lemons and tangerines and mandarins boosted the overall citrus value in 2014. Except for tangerines and mandarins, domestic production declined for all citrus commodities in 2014. These declines were behind lower crop values for grapefruit, oranges, and tangelos (mostly in Florida). At the same time, strong demand held 2013/14 grower prices for tangerines and mandarins above the previous season despite increased production and imports, driving up the value of production while sharply higher lemon prices more than offset the decline in production, raising the 2014 lemon crop value by 62 percent. Noncitrus fruit: Among noncitrus fruit crops, plums/prunes, nectarines, and raspberries had the largest increases in crop value in 2014. Increased production drove up the value of production for these crops (for plums/prunes higher grower prices also contributed). Grapes continue to be the highest valued noncitrus fruit crop in the United States and rank second to almonds in terms of total U.S. fruit, tree nuts, and melon crop value. The value of U.S. grape production totaled $5.8 billion in 2014, down 6 percent from the previous year as lower production more than offset the resulting higher grape prices. Grape production declined in some of the major producing States, including California, New York, and Pennsylvania. Apples, strawberries, blueberries, and sweet cherries round out the top 5 noncitrus fruit crops in 2014, and together with grapes, accounted for 82 percent of the value of noncitrus fruit production. Crop values for these leading crops rose in 2014, except for apples. Grower price declines for apples outpaced the increase in domestic production. Producing more than half of U.S. apples, record-high production in Washington State provided most of the downward push on 2014/15 grower prices. Sweet cherry production also increased in 2014 but prices did not drop enough to bring about a decline in crop value. Meanwhile, cultivated blueberry production and grower prices both rose in 2014 while strawberry grower prices rose higher than the decline in domestic production. Melons: Total crop value for U.S. melons in 2014 fell 6 percent from the previous year to $847.8 million. This decline reflects the drop in watermelon crop value from $514.0 million in 2013 to 431.2 in 2014, accounting for about half the total value. Reduced average yields and acreage brought U.S. watermelon production down in 2014 but watermelon grower prices also fell. Grower prices for cantaloupe

33 Fruit and Tree Nuts Outlook/FTS-358/March 27, 2015
Economic Research Service, USDA
and honeydew melons averaged 25 percent and 13 percent higher than the previous year in 2014. Cantaloupe prices rose with reduced domestic production while honeydew prices strengthened amidst a larger crop last year. Tree nuts: The highest valued tree nut crop in the United States is almonds, generating $6.4 billion in 2014, 1 percent above the previous year. Crop values for hazelnuts and pecans also rose above the previous year, but moderate to significant declines were reported for macadamia nuts and pistachios. NASS did not report a crop value estimate for walnuts in 2014 or for the season-average price, although production is reported up 22 percent from the previous year. While almond bearing acreage continued to rise in California, lower yields pushed production down from 2.0 billion pounds (shelled basis) in 2013 to 1.9 billion pounds in 2014. With the lower production, the season-average grower price for almonds was the highest recorded since 1970. Top States in U.S. fruit and tree nut crop value: NASS reports annual fruit and tree nut crop values for 42 of the 50 U.S. States. While production occurs widely across many of these States, U.S. fruit and tree nut production (excluding melons)
Table 17--Value of fruit, melon, and tree nut crops, by commodity, 2012-14Percent
Crop value Share of total value changeCommodity 2012 2013 2014 2012 2013 2014 2013-14
---------------1,000 dollars----------------- ------------- Percent ------------- Percent
Grapefruit 279,033 257,280 231,897 1.0 0.8 0.8 -9.9Lemons 448,698 400,295 647,737 1.6 1.3 2.1 61.8Oranges 2,621,620 2,073,374 1,960,080 9.2 6.8 6.4 -5.5Tangelos (FL) 14,299 12,986 9,839 1 1 1 -24.2Tangerines & mandarins 349,167 426,573 543,435 1.2 1.4 1.8 27.4Apples 3,314,996 3,113,126 2,963,981 11.6 10.1 9.7 -4.8Apricots 40,879 44,987 52,513 0.1 0.1 0.2 16.7Avocados -- 358,837 -- -- 1.2 -- --Bananas (HI) -- 13,050 -- -- 1 -- --Blackberries (OR) 43,590 42,268 43,197 0.2 0.1 0.1 2.2Cultivated blueberries 772,588 729,532 811,625 2.7 2.4 2.6 11.3Wild blueberries (ME) 69,075 65,984 63,480 0.2 0.2 0.2 -3.8Boysenberries 2,044 2,503 3,034 1 1 1 21.2Sw eet cherries 843,313 771,798 806,095 3.0 2.5 2.6 4.4Tart cherries 50,520 104,395 105,438 0.2 0.3 0.3 1.0Cranberries 385,506 287,050 266,173 1.4 0.9 0.9 -7.3Dates (CA) 41,674 33,880 38,700 0.1 0.1 0.1 14.2Figs (CA) 19,520 23,092 21,941 0.1 0.1 0.1 --Grapes 5,661,096 6,133,369 5,758,390 19.8 20.0 18.8 -6.1Guavas (HI) -- 357 -- -- 1 -- --Kiw ifruit (CA) 27,508 32,595 -- 0.1 0.1 -- --Nectarines 144,906 122,155 181,580 0.5 0.4 0.6 48.6Olives (CA) 130,038 134,881 66,299 0.5 0.4 0.2 -50.8Papayas (HI) -- 8,316 -- -- 0.0 -- --Peaches 618,369 547,978 616,473 2.2 1.8 2.0 12.5Pears 432,988 430,660 457,833 1.5 1.4 1.5 6.3Plums (CA) 79,940 62,043 115,760 0.3 0.2 0.4 86.6Dried prunes (CA) 183,540 170,000 209,000 0.6 0.6 0.7 22.9Prunes and plums (4 States)2 6,288 6,169 7,401 1 1 1 1
Raspberries (OR, WA, and CA) 290,024 309,542 388,545 1.0 1.0 1.3 25.5Straw berries 2,453,039 2,609,038 2,865,432 8.6 8.5 9.4 9.8
MelonsCantaloupes 319,348 320,029 327,934 1.1 1.0 1.1 2.5Honeydew s 67,973 75,389 88,649 0.2 0.2 0.3 17.6Watermelons 476,768 513,987 431,184 1.7 1.7 1.4 -16.1
Tree nutsAlmonds 4,816,860 6,384,690 6,464,500 16.9 20.8 21.1 1.3Hazelnuts 64,965 120,600 129,600 0.2 0.4 0.4 7.5Macadamia nuts 35,200 35,670 34,800 0.1 0.1 0.1 -2.4Pecans 475,991 460,390 507,990 1.7 1.5 1.7 10.3Pistachios 1,438,110 1,635,600 1,290,140 5.0 5.3 4.2 -21.1Walnuts 1,505,910 1,825,320 -- 5.3 5.9 -- --
Totals 3 28,525,383 30,699,788 30,638,127 100.0 100.0 100.0 -0.2-- Not available.1 Equal to or less than 0.05 percent. 2 Idaho, Michigan, Oregon, and Washington. 3 Sum of all melon commodities and reported total for fruit and nutsSource: USDA, National Agricultural Statistics Service, Crop Values 2014 Summary.

34 Fruit and Tree Nuts Outlook/FTS-358/March 27, 2015
Economic Research Service, USDA
continues to be heavily concentrated in California, accounting for over 70 percent of the total crop value in 2014, totaling $21.3 billion (table 18). Most major tree nuts (i.e., almonds, walnuts, and pistachios), grapes, strawberries, peaches, figs, kiwifruit, olives, plums and prunes, and fresh-market citrus are predominantly produced in California, along with many other fruits for which the State is also an important producer. Washington and Florida follow with an 11-percent and a 6-percent annual share while Oregon and Michigan complete the top 5 list. Fruit and tree nut crop values in the top 2 producing States rose by 1-3 percent above the previous year in 2014 but mostly significant declines in over half the number of producing States, including Florida and Michigan, left the total crop value steady from the prior year.
Table 18--Value of fruit and tree nut crops, by State, 2012-14Percent
Crop value Share of U.S. value change StateState 2012 2013 2014 2012 2013 2014 2013-14 ranking
------------1,000 dollars------------- -----------------Percent-----------------------
Alabama 10,710 11,223 7,295 0.0 0.0 0.0 -35.0 36Arizona 49,131 79,898 102,727 0.2 0.3 0.3 28.6 14Arkansas 7,647 8,051 7,534 0.0 1 1 -6.4 35California 18,400,587 21,121,425 21,324,267 66.5 70.9 71.6 1.0 1Colorado 30,140 15,186 31,334 0.1 0.1 0.1 106.3 20Connecticut 13,120 23,314 14,822 0.0 0.1 0.0 -36.4 28Florida 2,402,324 2,013,949 1,645,447 8.7 6.8 5.5 -18.3 3Georgia 313,466 299,884 317,956 1.1 1.0 1.1 6.0 7Hawaii 35,200 58,033 34,800 0.1 0.2 0.1 -40.0 19Idaho 43,149 34,986 26,119 0.2 0.1 0.1 -25.3 23Illinois 23,600 12,697 18,010 0.1 0.0 0.1 41.8 25Indiana 4,604 14,898 10,520 0.0 0.1 0.0 -29.4 34Iowa 135 4,040 1,935 1 1 1 -52.1 39Kansas 4,050 2,200 1,144 1 1 1 -48.0 41Louisiana 13,500 10,270 12,790 0.0 1 1 24.5 31Maine 84,463 79,139 74,317 0.3 0.3 0.2 -6.1 16Maryland 19,017 9,890 12,852 0.1 0.0 0.0 29.9 30Massachusetts 121,769 82,382 93,891 0.4 0.3 0.3 14.0 15Michigan 207,347 531,044 475,735 0.7 1.8 1.6 -10.4 5Minnesota 9,322 11,801 12,137 0.0 0.0 0.0 2.8 32Mississippi 18,475 16,684 11,486 0.1 0.1 0.0 -31.2 33Missouri 25,684 20,267 15,207 0.1 0.1 0.1 -25.0 27Montana 2,021 3,702 3,775 1 1 1 2.0 38New Hampshire 7,845 10,506 6,905 1 1 1 -34.3 37New Jersey 178,865 117,160 158,418 0.6 0.4 0.5 35.2 10New Mexico 110,500 136,800 130,000 0.4 0.5 0.4 -5.0 11New York 323,035 340,219 389,773 1.2 1.1 1.3 14.6 6North Carolina 115,197 116,933 125,116 0.4 0.4 0.4 7.0 13Ohio 21,918 38,388 27,230 0.1 0.1 0.1 -29.1 22Oklahoma 24,750 19,767 20,700 0.1 0.1 0.1 4.7 24Oregon 601,627 659,555 696,721 2.2 2.2 2.3 5.6 4Pennsylvania 186,722 150,851 127,740 0.7 0.5 0.4 -15.3 12Rhode island 1,362 937 708 1 1 1 -24.4 42South Carolina 68,119 71,485 68,884 0.2 0.2 0.2 -3.6 17Tennessee 2,880 2,796 1,849 1 1 1 -33.9 40Texas 159,772 139,903 201,665 0.6 0.5 0.7 44.1 8Utah 31,770 28,080 28,307 0.1 0.1 0.1 0.8 21Vermont 10,405 13,970 13,722 0.0 0.0 1 -1.8 29Virginia 88,127 48,944 57,377 0.3 0.2 0.2 17.2 18Washington 3,601,625 3,190,518 3,280,312 13.0 10.7 11.0 2.8 2West Virginia 29,953 17,922 17,856 0.1 0.1 0.1 -0.4 26Wisconsin 257,361 220,706 179,977 0.9 0.7 0.6 -18.5 9
United States 27,661,294 29,790,383 29,790,360 100.0 100.0 100.0 1
Source: USDA, National Agricultural Statistics Service, Crop Values 2014 Summary .
1 Less than 0.05 percent.

Trade Summary Tables
35 Fruit and Tree Nuts Outlook/FTS-358/March 27, 2015
Economic Research Service, USDA
Table 19--U.S. exports of selected fruit and tree nut products Season to date (through January) Year-to-date
Commodity Marketing season 2014 2015 change
---------- 1,000 pounds ---------- PercentFresh market: Oranges November-October 322,289 297,442 -7.7 Grapefruit September-August 185,733 176,286 -5.1 Lemons August-July 128,071 131,130 2.4 Apples August-July 966,941 1,097,792 13.5 Grapes May-April 1,143,525 1,088,352 -4.8 Pears July-June 312,704 274,916 -12.1 Peaches (including nectarines) January-December 376 1,227 225.9 Strawberries January-December 12,438 14,769 18.7 Cherries January-December 264 151 -42.8 Canteloupe January-December 2,393 1,627 -32.0 Watermelon January-December 3,023 1,816 -39.9
------ 1,000 sse gallons 1 -------Processed: Orange juice, frozen concentrate October-September 7,049 5,058 -28.2 Orange juice, not-from-concentrate October-September 36,374 30,993 -14.8 Grapefruit juice October-September 3,527 3,256 -7.7 Apple juice and cider August-July 4,308 4,889 13.5 Wine January-December 7,370 5,258 -28.7
---------- 1,000 pounds ----------
Raisins August-July 169,851 144,304 -15.0 Canned pears June-May 9,249 7,540 -18.5 Canned peaches June-May 31,694 31,500 -0.6 Frozen strawberries January-December 4,323 4,508 4.3
---------- 1,000 pounds ----------Tree nuts: Almonds (shelled basis) August-July 742,248 625,002 -15.8 Walnuts (shelled basis) September-August 194,183 198,419 2.2 Pecans (shelled basis) October-September 28,898 43,069 49.0 Pistachios (shelled basis) September-August 88,996 66,974 -24.71Single-strength equivalent.Source: U.S. trade data provided by the U.S. Department of Commerce, U.S. Census Bureau.
Table 20--U.S. imports of selected fruit and tree nut products Season to date (through January) Year-to-date
Commodity Marketing season 2014 2015 change
---------- 1,000 pounds ---------- PercentFresh market: Oranges November-October 22,564 24,574 8.9 Tangerines (including clementines) October-September 183,112 173,183 -5.4 Lemons August-July 76,606 113,091 47.6 Limes January-December 82,413 90,071 9.3 Apples August-July 104,371 94,505 -9.5 Grapes May-April 603,066 577,937 -4.2 Pears July-June 37,954 37,386 -1.5 Peaches (including nectarines) January-December 10,779 29,579 174.4 Cantaloupe January-December 110,954 144,189 30.0 Watermelon January-December 63,551 81,464 28.2 Bananas January-December 898,532 826,104 -8.1 Mangoes January-December 39,394 36,151 -8.2
------ 1,000 sse gallons 1 -------Processed: Orange juice, frozen concentrate October-September 114,075 124,496 9.1 Apple juice and cider August-July 243,121 209,399 -13.9 Wine January-December 25,976 18,743 -27.8
---------- 1,000 pounds ----------
Canned pears June-May 52,439 47,112 -10.2 Canned peaches (including nectarines) June-May 155,203 151,847 -2.2 Canned pineapple January-December 68,694 56,880 -17.2 Frozen strawberries January-December 12,317 20,796 68.8
---------- 1,000 pounds ----------Tree nuts: Brazil nuts (shelled basis) January-December 1,348 1,126 -16.5 Cashews (shelled basis) January-December 24,090 20,534 -14.8 Pine nuts (shelled basis) January-December 19 17 -11.1 Pecans (shelled basis) October-September 43,658 58,710 34.51 Single-strength equivalent.Source: U.S. trade data provided by the U.S. Department of Commerce, U.S. Census Bureau.

Contacts and Links
36 Fruit and Tree Nuts Outlook/FTS-358/March 27, 2015
Economic Research Service, USDA
Data The Fruit and Tree Nuts Situation and Outlook Yearbook has over 130 tables of annual or monthly time-series data on specific fruit commodities. Data include bearing acreage, production, prices, trade, per capita use, and more. To order a copy, call 1-800-999-6779. Related Websites Fruit and Tree Nuts Outlook http://usda.mannlib.cornell.edu/MannUsda/viewDocumentInfo.do?documentID=1378 Fruit and Tree Nuts Topic Page http://www.ers.usda.gov/topics/crops/fruit-tree-nuts.aspx Organic Farming Topic Page http://www.ers.usda.gov/topics/natural-resources-environment/organic-agriculture.aspx Vegetable and Pulses Topic Page http://www.ers.usda.gov/topics/crops/vegetables-pulses.aspx
Contact Information Agnes Perez (Noncitrus and tropical fruit; melons), (202) 694-5255, [email protected] Kristy Plattner (Citrus and tree nuts), (202) 694-5190, [email protected] Subscription Information Subscribe to ERS’ e-mail notification service at http://www.ers.usda.gov/subscribe-to-ers-e-newsletters.aspx to receive timely notification of newsletter availability. Printed copies can be purchased from the National Technical Information Service by calling 1-800-999-6779 (specify the issue number or series SUB-FTS-4036).
The U.S. Department of Agriculture (USDA) prohibits discrimination in all its programs and activities on the basis of race, color, national origin, age, disability, and, where applicable, sex, marital status, familial status, parental status, religion, sexual orientation, genetic information, political beliefs, reprisal, or because all or a part of an individual’s income is derived from any public assistance program. (Not all prohibited bases apply to all programs.) Persons with disabilities who require alternative means for communication of program information (Braille, large print, audiotape, etc.) should contact USDA’s TARGET Center at (202) 720-2600 (voice and TDD). To file a complaint of discrimination write to USDA, Director, Office of Civil Rights, 1400 Independence Avenue, S.W., Washington, D.C. 20250-9410 or call (800) 795-3272 (voice) or (202) 720-6382 (TDD). USDA is an equal opportunity provider and employer.
E-mail Notification Readers of ERS outlook reports have two ways they can receive an e-mail notice about release of reports and associated data. • Receive timely notification (soon after the report is posted on the web) via USDA’s Economics, Statistics and Market Information System (which is housed at Cornell University’s Mann Library). Go to http://usda.mannlib.cornell.edu/MannUsda/aboutEmailService.do and follow the instructions to receive e-mail notices about ERS, Agricultural Marketing Service, National Agricultural Statistics Service, and World Agricultural Outlook Board products. • Receive weekly notification (on Friday afternoon) via the ERS website. Go to http://www.ers.usda.gov/subscribe-to-ers-e-newsletters.aspx and follow the instructions to receive notices about ERS outlook reports, Amber Waves magazine, and other reports and data products on specific topics. ERS also offers RSS (really simple syndication) feeds for all ERS products. Go to http://www.ers.usda.gov/rss.aspx to get started.

China Tree Nut Market Overview China has grown to become a significant market for U.S. tree nut exports, despite being a global leader in tree nut production itself. China dominates global production of chestnuts and walnuts, but its growers cannot meet Chinese consumers’ developing taste for nuts that are not widely grown in the country, such as pistachios, almonds, pecans, and macadamia nuts. Trade was curbed by an economic slowdown and rising prices during 2013-14, but consumer demand suggests that China will become an even larger market for tree nuts. U.S. Exports Grow to China and Hong Kong China’s rising demand for tree nuts has played a key role in the growth of U.S. tree nut exports (Morecraft, 2015). Sales of U.S. tree nuts to China and Hong Kong combined soared from $77 million in 2000 to over $1.6 billion in 2012 (fig. 1). China-Hong Kong is the largest market for U.S. almond exports. Hong Kong accounts for most of the sales. Along with China’s economic development and a rising standard of living, Chinese dietary structure is undergoing a significant change and the demand for tree nuts keeps rising dramatically. Almonds and pistachios are the two predominant types of nuts exported to China-Hong Kong, together accounting for 70 percent of sales during 2013 (fig. 2). Walnuts are the third-largest export type, with 17 percent of sales, followed by pecans (8 percent) and hazelnuts (4 percent). Another 1 percent is comprised of macadamia, cashews, Brazil nuts, and mixed nuts. Demand for imported nuts is so vigorous that China’s Ministry of Finance reduced import tariffs for selected types of nuts beginning in January 2015 (fig. 3). Tariffs were cut by more
Fruit and Tree Nuts Outlook: Economic Insight China’s Potential as an Export Market for Tree Nuts Zhengzhou Yang1 and Fred Gale [email protected] and [email protected]
Economic Research Service Situation and Outlook FTS-358SA March 27, 2015
Approved by the World Agricultural Outlook Board.
1 Zhengzhou Yang is a research scholar at the University of Kentucky, Department of Agricultural Economics. H. Frederick Gale is an economist at USDA’s Economic Research Service (ERS). We would like to thank Kristy Plattner, USDA/ERS, Bill Morecraft of Blue Diamond Growers, and Chris Frederick, USDA, Foreign Agricultural Service, for their valuable comments.

2 Fruit and Tree Nuts Outlook Special Article/FTS-358SA/March 27, 2015
Economic Research Service, USDA

3 Fruit and Tree Nuts Outlook Special Article/FTS-358SA/March 27, 2015
Economic Research Service, USDA
than half for the main U.S. exports. The pecan and almond tariffs were reduced from 24 percent to 10 percent. The tariffs on pistachios and cashew were cut in half to 5 percent and 10 percent, respectively. During 2012, China had temporarily cut tariffs on pistachios to 5 percent (Wu, 2011), which helped U.S pistachio exports to China in 2012 increase 34 percent from the previous year. Chestnut and ginkgo tariffs were also temporarily cut to 20 percent that year. Imported nuts are assessed a 13-percent value added tax in addition to the tariff. The tariff cut was likely motivated by rising prices for nuts. The average unit values of U.S. pistachio and almond exports to China-Hong Kong each rose 50 percent from 2012 to 2014 (fig. 4). Walnut unit values rose 23 percent. Pecan unit values were steady during 2012-14, but they had risen 60 percent during 2009-11. The higher prices dampened consumer demand, and the higher U.S. export price, which was partly caused by the continuing deflation of the Chinese yuan exchange rate, may have contributed to the decrease in exports to China during 2013-14. According to an industry report, Chinese nut roasters persuaded authorities to cut tariffs during 2015 to help the industry meet the increased demand from Chinese consumers, and to reduce the cost of imported nuts (Chen, 2015). In addition to rising prices, China’s demand for imported nuts may have been curbed by a general slowdown in the country’s economic growth during 2013-14. An anticorruption campaign reduced demand for a wide array of items when officials were ordered to cut back on banquets, travel, and other spending considered excessive or frivolous. The demand for imported nuts may have been affected since nuts are often given as gifts and are commonly consumed at restaurants and during travel. A dispute disrupted trade when a new Chinese nut industry standard required that almonds be sold under a different Chinese name (see box, “Almond Name Dispute”).
Almond Name Dispute When U.S. almonds were introduced to China in the 1980s there was no Chinese word for the nut. Sellers began calling almonds a name that is also used for apricot kernels, a seed used in pharmaceuticals. In recent years, Chinese apricot growers and processors complained that the Chinese name used for imported almonds confused consumers and hurt sales of apricot kernels. A new Chinese industry standard that took effect in 2012 determined that almonds should be labeled as “flat peach kernels.” Chinese retailers were ordered to remove packages of almonds using the old name, so U.S. industry officials agreed to rename almonds “badamu,” a phonetic translation of the Farsi word for almonds.

4 Fruit and Tree Nuts Outlook Special Article/FTS-358SA/March 27, 2015
Economic Research Service, USDA
Rising Chinese Tree Nut Consumption China’s consumption of tree nuts is growing as living standards rise and the population urbanizes. Nuts are a popular snack and are prized by Chinese consumers for their health benefits. Processed products like nut-based milks, oils, milled powder, and confections are becoming more common, and nuts are now used in baking. Chinese Dietary Guidelines issued by the Chinese Nutrition Society (2011) recommended consuming up to 10 grams of tree nuts daily for a healthy diet. Household surveys by China’s National Bureau of Statistics reported an average per capita of 3 kilograms per year for 2013, about 20 percent below the recommendation. Urbanization is a major influence on consumption. Surveys show that per capita purchases of nuts by urban residents are about 2.5 times those of rural residents. The urban share of China’s population has been increasing about 1 percentage point annually and is now 52 percent. Urbanization is expected to continue rising as authorities reduce barriers to rural-urban migration. Expansion of convenience stores, highway rest areas, and airport shops and the growth of e-commerce increase the number of marketing channels for nuts. Major Global Producer of Chinese-type Chestnuts and Walnuts China is also a major producer of tree nuts. Its output, mainly walnuts and Chinese-type chestnuts, is estimated at 3.8 million metric tons (mmt). Production of imported nuts, such as almonds and pistachios, is relatively small and has not kept up with consumer demand. According to Chen (2015), Chinese authorities were persuaded to reduce tariffs for pecans, pistachios, and cashews because increased imports would not compete with domestic production. China’s domestic tree nut output grew rapidly at the same time imports were growing. According to the United Nations’ Food and Agriculture Organization (FAO) data, China’s nut output grew from about 1 mmt in 2000 to 3.8 mmt in 2013, while China’s share of global tree nut consumption rose from under 10 percent in the early 1990s to 25 percent in 2012. However, the composition of China’s nut output has not been in sync with the country’s consumption. Nearly all of the growth in China’s nut output has been in chestnuts and walnuts, which, combined, account for over 90 percent of total China’s nut production. China accounts for over 80 percent of Chinese-type chestnuts and half of walnuts produced in the world, but its share of almonds (about 6 percent) and pistachios (under 2 percent) remained small and stagnant (fig. 5).

5 Fruit and Tree Nuts Outlook Special Article/FTS-358SA/March 27, 2015
Economic Research Service, USDA
China’s nut output has expanded mainly by increased tree-planting on hilly and mountainous land in central, northern and southwest China, areas with relatively humid climates. Regions with dry, arid climates suitable for pistachios and almonds are concentrated in remote areas of northwestern China that lack irrigation resources to support growing nut trees. Xinjiang Autonomous Region, China’s only pistachio-growing region, has focused its scarce water resources on cotton, tomatoes, and melon crops. These regional resource constraints have kept Chinese almond and pistachio output from expanding to meet the growing demand. Cropland Retirement Program Adds Trees Land-retirement and poverty-alleviation programs contributed to the boost in China’s nut output during the last two decades. Beginning in the late 1990s, authorities encouraged expansion of nut production in hilly and mountainous regions to alleviate poverty and to replace cultivation of subsistence crops with trees on erodible land. A land-retirement program, known as “grain for green,” gave villagers grain rations and one-time cash subsidies to plant trees or grass on 9 million hectares of erodible cropland on hillsides, wetlands, or grasslands (1 hectare = 2.47 acres). The proportion of retired land used for nut trees is unknown. However, the program may have contributed to output growth since the expansion of China’s area in nut trees after 2000 coincided with the launching of the “grain for green” program. A new round of land retirement began in 2014, but its target for land retirement is less than a third of the 1999-2013 area of 9 million hectares. The 2014 land retirement program offered a lower one-time subsidy for tree-planting than did the earlier program. China has other programs to alleviate poverty and promote adjustment in rural areas that support nut production. Chinese authorities have ambitious plans to boost production of nuts and other tree crops to meet domestic demand. Forestry officials issued a strategic plan to increase output of 40 kinds of tree crops by 2020 (China State Forestry Administration, 2014). The plan includes three types of nuts: walnut, Chinese-type chestnuts, and almonds. The plan calls for increasing walnut production more than fivefold and increasing chestnuts by 80 percent. The plan aims to raise almond output from 40,000 metric tons to over 1 million metric tons. However, the objectives appear unrealistic since they would require vast amounts of land to be planted in nut trees. Walnuts have been a particular target of Government support. Walnuts were singled out for support in the annual “Number one document” on rural policies in 2010. Frederick, Tang and Wu (2014) list a number of walnut-focused support programs that fund walnut demonstration farms and technical assistance. A program to promote production of tree crops that can add to the Nation’s supply of edible oil was initiated in 2011 (China Ministry of Finance, 2011). This program includes olives, walnuts, and tea oil. The program’s 4 billion yuan in annual funding includes support for growing seedlings, development of new varieties, extension, establishing orchards, processing facilities, subsidized loans, and insurance. Portions of China’s agricultural machinery purchase subsidies are designated for tree-based oil crops, and subsidies for seedlings, fertilizer, fuel and pesticide are available. Chinese authorities give modest support to farmer cooperatives—including farmers growing nuts—to organize training, facilitate marketing, and construct storage or packing facilities. Some provincial and local governments assist groups of farmers to sell their products via e-commerce platforms and in shops that sell regional specialty products. Fragmented, Dispersed Production Constrains Growth Greater attention to food security concerns constrains the development of nut production in China. Nut companies have developed nut groves on some highly productive cropland, but officials want to retain this land for production of cereal grains. In many places, officials are zoning land as “permanent” cropland that cannot be converted to nongrain uses, a measure that constrains the development of large-scale, mechanized orchards on fertile, accessible

6 Fruit and Tree Nuts Outlook Special Article/FTS-358SA/March 27, 2015
Economic Research Service, USDA
land. Most of the government-supported nut-development projects are in mountainous southwest provinces or the arid northwest, both of which are thousands of miles from coastal cities that have the strongest demand. The pattern of production created by recruiting poor farmers poses a problem as the country moves into a new phase of economic development. China’s nut production is dominated by scattered, small groves in relatively inaccessible areas that require large amounts of labor to maintain trees and harvest nuts. In recent years, many laborers have moved out of remote villages and wages are rising rapidly. This leaves producers vulnerable to tighter labor supplies demanding higher wages. Yields and labor productivity are low, contributing to higher unit costs for Chinese nut producers. According to United Nations, Food and Agriculture Organization (FAO) data, Chinese yields of almonds, walnuts, and cashews are much lower than U.S. yields per hectare. Chinese officials are encouraging villages to consolidate collectively owned land and lease it to companies, but farmers earning high returns from nut trees in prime locations prefer to keep the land for themselves (Frederick, Tang, and Bu, 2014). Since a majority of the trees are on hilly terrain, they cannot be easily consolidated in larger stands, and mechanized equipment cannot be used. Moreover, the soil is often poor and irrigation is unavailable. Producers often lack equipment for drying and proper storage and roads are poor, leading to high proportions of waste and spoilage. Modern nut production is capital-intensive and has a long production cycle. Field research by one of the authors estimated that one hectare of walnut production requires an outlay of nearly 90,000 yuan (about $14,500) over 3 years. Salaries for managers and technical staff account for the highest proportion of cost. Few growers can obtain long-term loans, and most are unwilling to invest their own savings or borrow from informal lenders at high interest rates to plant nut trees that have risky, long-term payoffs. Volatile Domestic Prices Influence Nut Trade Domestic Chinese nut prices affect domestic policies as well as demand for imports. Rising walnut prices since 2005 explain Chinese officials’ focus on promoting walnut production (fig. 6). In contrast, prices of Chinese chestnuts have a strong cyclical tendency—rising for 2 to 3 years before dropping sharply. Prices of both types of nut rose dramatically during 2009-12, a period of generally rising commodity prices in China. Rising prices also correspond to rising U.S. nut exports to China during those years. The peak in domestic walnut and chestnut prices during 2012 corresponds to the peak year for U.S. nut exports to China. Chinese prices fell in 2013, due to a combination of favorable weather that boosted nut output, and a general slowdown in commodity prices as the Chinese economy slowed. The decline in Chinese prices likely contributed to weaker U.S. nut exports to China during 2013-14.
2010 2011 2012
Item
Land rent 6,000 6,000 6,000
Labor 3,000 3,500 4,000
Hired management and technical staff cost 12,000 12,000 12,000
Road building 5,000 - -
Mechanized spray irrigation facility and irrigation cost 3,000 500 500
Seedlings 5,000 - -
Others 3,000 3,000 3,000
37,000 25,000 25,000
Total (all 3 years) 87,500
Table 1: Initial 3 years’ investment for 1 hectare of walnut production in China, 2010-12
Yuan
Source: USDA, Economic Research Service calculations based on field research data from Sichuan, Heibei and Shandong provinces.
Note: The labor cost was the seasonal hired labor cost. Irrigation facility and cost were accumulated with free access to the water. In fact, in Hebei, Shandong area, farmers will pay for the extra cost of digging a well to get water. The least average cost of digging a well is around 3,000 yuan in China.
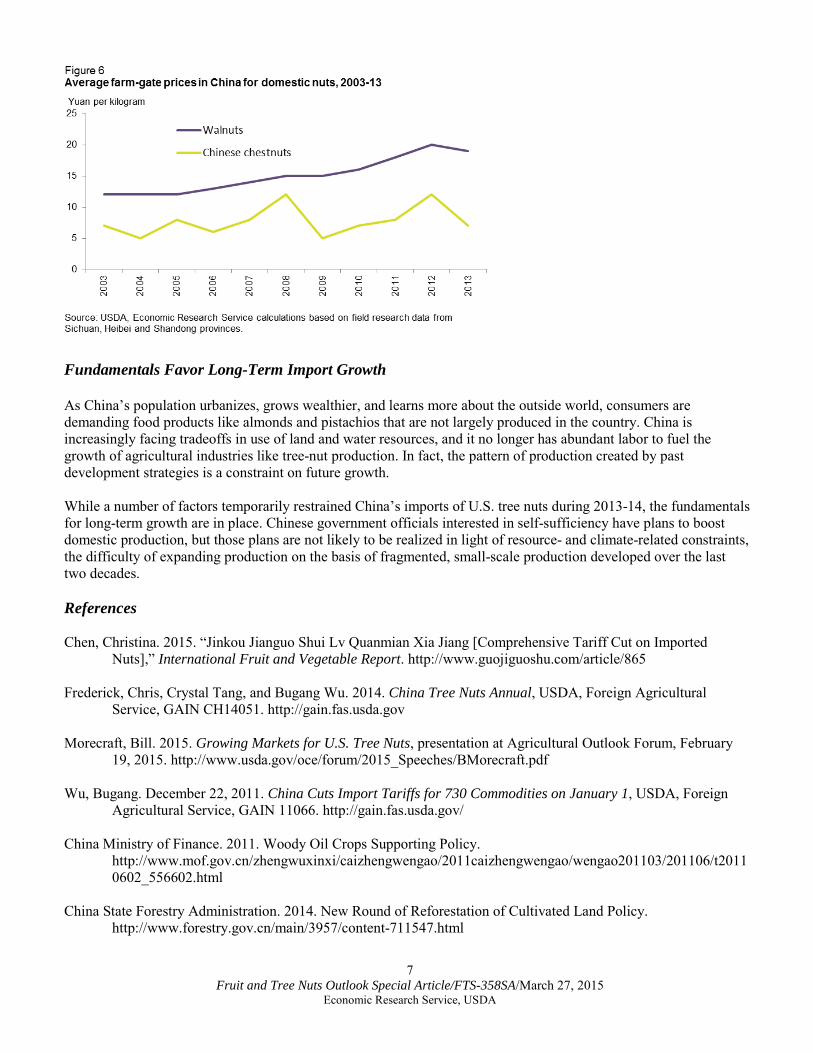
7 Fruit and Tree Nuts Outlook Special Article/FTS-358SA/March 27, 2015
Economic Research Service, USDA
Fundamentals Favor Long-Term Import Growth As China’s population urbanizes, grows wealthier, and learns more about the outside world, consumers are demanding food products like almonds and pistachios that are not largely produced in the country. China is increasingly facing tradeoffs in use of land and water resources, and it no longer has abundant labor to fuel the growth of agricultural industries like tree-nut production. In fact, the pattern of production created by past development strategies is a constraint on future growth. While a number of factors temporarily restrained China’s imports of U.S. tree nuts during 2013-14, the fundamentals for long-term growth are in place. Chinese government officials interested in self-sufficiency have plans to boost domestic production, but those plans are not likely to be realized in light of resource- and climate-related constraints, the difficulty of expanding production on the basis of fragmented, small-scale production developed over the last two decades. References Chen, Christina. 2015. “Jinkou Jianguo Shui Lv Quanmian Xia Jiang [Comprehensive Tariff Cut on Imported
Nuts],” International Fruit and Vegetable Report. http://www.guojiguoshu.com/article/865 Frederick, Chris, Crystal Tang, and Bugang Wu. 2014. China Tree Nuts Annual, USDA, Foreign Agricultural
Service, GAIN CH14051. http://gain.fas.usda.gov Morecraft, Bill. 2015. Growing Markets for U.S. Tree Nuts, presentation at Agricultural Outlook Forum, February
19, 2015. http://www.usda.gov/oce/forum/2015_Speeches/BMorecraft.pdf Wu, Bugang. December 22, 2011. China Cuts Import Tariffs for 730 Commodities on January 1, USDA, Foreign
Agricultural Service, GAIN 11066. http://gain.fas.usda.gov/ China Ministry of Finance. 2011. Woody Oil Crops Supporting Policy.
http://www.mof.gov.cn/zhengwuxinxi/caizhengwengao/2011caizhengwengao/wengao201103/201106/t20110602_556602.html
China State Forestry Administration. 2014. New Round of Reforestation of Cultivated Land Policy.
http://www.forestry.gov.cn/main/3957/content-711547.html