prospective plantings 03/31/2016 - cornell...
TRANSCRIPT

Prospective Plantings
ISSN: 1949-159X
Released March 31, 2016, by the National Agricultural Statistics Service (NASS), Agricultural Statistics Board, United States Department of
Agriculture (USDA).
Corn Planted Acreage Up 6 Percent from 2015 Soybean Acreage Down Less Than 1 Percent All Wheat Acreage Down 9 Percent All Cotton Acreage Up 11 Percent
Corn planted area for all purposes in 2016 is estimated at 93.6 million acres, up 6 percent from last year. If realized, this
will represent the highest planted acreage in the United States since 2013, and will be the third highest planted acreage in
the United States since 1944.
Soybean planted area for 2016 is estimated at 82.2 million acres, down less than 1 percent from last year. Compared with
last year, planted acreage intentions are down or unchanged in 23 of the 31 estimating States.
All wheat planted area for 2016 is estimated at 49.6 million acres, down 9 percent from 2015. The 2016 winter wheat
planted area, at 36.2 million acres, is down 8 percent from last year and down 1 percent from the previous estimate. Of
this total, about 26.2 million acres are Hard Red Winter, 6.60 million acres are Soft Red Winter, and 3.37 million acres are
White Winter. Area planted to other spring wheat for 2016 is estimated at 11.3 million acres, down 14 percent from 2015.
Of this total, about 10.7 million acres are Hard Red Spring wheat. The intended Durum planted area for 2016 is estimated
at 2.00 million acres, up 3 percent from the previous year.
All cotton planted area for 2016 is estimated at 9.56 million acres, 11 percent above last year. Upland area is estimated at
9.35 million acres, up 11 percent from 2015. American Pima area is estimated at 215,000 acres, up 36 percent from 2015.

2 Prospective Plantings (March 2016) USDA, National Agricultural Statistics Service
This report was approved on March 31, 2016.
Secretary of Agriculture
Designate
Robert Johansson
Agricultural Statistics Board
Chairperson
James M. Harris

Prospective Plantings (March 2016) 3 USDA, National Agricultural Statistics Service
Contents
Corn Area Planted – States and United States: 2014-2016 ..................................................................................................... 6
Corn and Soybean Planted Acreage – United States Chart ..................................................................................................... 7
Sorghum Area Planted – States and United States: 2014-2016 .............................................................................................. 7
Oat Area Planted – States and United States: 2014-2016 ....................................................................................................... 8
Barley Area Planted – States and United States: 2014-2016 .................................................................................................. 9
All Wheat Area Planted – States and United States: 2014-2016 .......................................................................................... 10
Winter Wheat Area Planted – States and United States: 2014-2016 .................................................................................... 11
Durum Wheat Area Planted – States and United States: 2014-2016 .................................................................................... 12
Other Spring Wheat Area Planted – States and United States: 2014-2016 ........................................................................... 12
All Hay Area Harvested – States and United States: 2014-2016 .......................................................................................... 13
Rice Area Planted by Class – States and United States: 2014-2016 ..................................................................................... 14
Canola Area Planted – States and United States: 2014-2016................................................................................................ 14
Soybean Area Planted – States and United States: 2014-2016 ............................................................................................. 15
Peanut Area Planted – States and United States: 2014-2016 ................................................................................................ 15
Sunflower Area Planted by Type – States and United States: 2014-2016 ............................................................................ 16
Flaxseed Area Planted – States and United States: 2014-2016 ............................................................................................. 16
Cotton Area Planted by Type – States and United States: 2014-2016 .................................................................................. 17
Sugarbeet Area Planted – States and United States: 2014-2016 ........................................................................................... 18
Tobacco Area Harvested – States and United States: 2014-2016 ......................................................................................... 18
Tobacco Area Harvested by Class and Type – States and United States: 2014-2016 .......................................................... 19
Dry Edible Bean Area Planted – States and United States: 2014-2016 ................................................................................ 20
Chickpea (Garbanzo Bean) Area Planted – States and United States: 2014-2016 ............................................................... 21
Lentil Area Planted – States and United States: 2014-2016 ................................................................................................. 22
Dry Edible Pea Area Planted – States and United States: 2014-2016 .................................................................................. 22
Austrian Winter Pea Area Planted – States and United States: 2014-2016 .......................................................................... 22

4 Prospective Plantings (March 2016) USDA, National Agricultural Statistics Service
Spring Potato Area Planted – States and United States: 2014-2016 ..................................................................................... 23
Sweet Potato Area Planted – States and United States: 2014-2016 ...................................................................................... 23
Crop Area Planted and Harvested, Yield, and Production in Domestic Units – United States: 2015 and 2016 ................... 24
Crop Area Planted and Harvested, Yield, and Production in Metric Units – United States: 2015 and 2016 ........................ 26
Winter Weather Summary .................................................................................................................................................... 28
Crop Comments .................................................................................................................................................................... 30
Statistical Methodology ......................................................................................................................................................... 34
Reliability of Prospective Plantings Planted Acreage Estimates .......................................................................................... 35
Information Contacts ............................................................................................................................................................. 36

Prospective Plantings (March 2016) 5 USDA, National Agricultural Statistics Service
This page intentionally left blank.

6 Prospective Plantings (March 2016) USDA, National Agricultural Statistics Service
Corn Area Planted – States and United States: 2014-2016
State
Area planted
2014 2015 2016 1
Percent of previous year
(1,000 acres) (1,000 acres) (1,000 acres) (percent)
Alabama .............................. Arizona ................................ Arkansas .............................. California ............................. Colorado .............................. Connecticut .......................... Delaware ............................. Florida .................................. Georgia ................................ Idaho .................................... Illinois ................................... Indiana ................................. Iowa ..................................... Kansas ................................. Kentucky .............................. Louisiana ............................. Maine ................................... Maryland .............................. Massachusetts ..................... Michigan .............................. Minnesota ............................ Mississippi ........................... Missouri ............................... Montana ............................... Nebraska ............................. Nevada ................................ New Hampshire ................... New Jersey .......................... New Mexico ......................... New York ............................. North Carolina ...................... North Dakota ........................ Ohio ..................................... Oklahoma ............................ Oregon ................................. Pennsylvania ....................... Rhode Island ........................ South Carolina ..................... South Dakota ....................... Tennessee ........................... Texas ................................... Utah ..................................... Vermont ............................... Virginia ................................. Washington .......................... West Virginia ........................ Wisconsin ............................ Wyoming .............................. United States .......................
300 75
540 520
1,150 26
175 75
350 320
11,900 5,900
13,700 4,050 1,520
400 31
500 16
2,550
8,200 510
3,500 130
9,300 4
15 85
125 1,140
840
2,800 3,700
320 80
1,460 2
295 5,800
920
2,250 75 92
500 215 51
4,000 90
90,597
260 70
460 430
1,100 26
170 80
330 280
11,700 5,650
13,500 4,150 1,400
400 31
440 16
2,350
8,100 510
3,250 105
9,400 2
15 80
125 1,080
790
2,750 3,550
310 65
1,340 2
295 5,400
780
2,300 60 92
450 170 50
4,000 85
87,999
340 65
790 440
1,250 25
175 100 390 320
12,100 5,800
13,900 4,800 1,500
730 31
490 15
2,450
8,200 800
3,600 95
9,700 4
14 75
105 1,100
930
3,400 3,550
360 75
1,400 2
320 5,700
840
2,600 75 95
490 210 50
4,000 100
93,601
131 93
172 102 114 96
103 125 118 114
103 103 103 116 107 183 100 111 94
104
101 157 111 90
103 200 93 94 84
102
118 124 100 116 115 104 100 108 106 108
113 125 103 109 124 100 100 118
106
1 Intended plantings in 2016 as indicated by reports from farmers.

Prospective Plantings (March 2016) 7 USDA, National Agricultural Statistics Service
Sorghum Area Planted – States and United States: 2014-2016
State
Area planted
2014 2015 2016 1
Percent of previous year
(1,000 acres) (1,000 acres) (1,000 acres) (percent)
Arizona 2 ..............................
Arkansas ............................. Colorado .............................. Georgia ............................... Illinois .................................. Kansas ................................ Louisiana ............................. Mississippi ........................... Missouri ............................... Nebraska ............................. New Mexico ......................... North Carolina
3 ...................
Oklahoma ............................ South Dakota ....................... Texas .................................. United States .......................
25 170 345 40 23
2,850 100 110 85
210
110 (NA) 370 200
2,500
7,138
24 450 440 50 38
3,400 77
120 155 270
125
(NA) 440 270
2,600
8,459
(NA) 140 360 35 25
3,150 66 50 75
270
125 50
420 250
2,200
7,216
(X) 31 82 70 66 93 86 42 48
100
100 (X) 95 93 85
85
(NA) Not available. (X) Not applicable. 1
Intended plantings in 2016 as indicated by reports from farmers. 2
Estimates discontinued in 2016. 3
Estimates began in 2016.
50.0
60.0
70.0
80.0
90.0
100.0
1996 1998 2000 2002 2004 2006 2008 2010 2012 2014 2016
Million acres
Corn and Soybean Planted Acreage - United States
Corn
Soybeans

8 Prospective Plantings (March 2016) USDA, National Agricultural Statistics Service
Oat Area Planted – States and United States: 2014-2016 [Includes area planted in preceding fall]
State
Area planted
2014 2015 2016 1
Percent of previous year
(1,000 acres) (1,000 acres) (1,000 acres) (percent)
Alabama .............................. Arkansas .............................. California ............................. Colorado .............................. Georgia ................................ Idaho .................................... Illinois ................................... Indiana
2 ...............................
Iowa ..................................... Kansas ................................. Maine ................................... Michigan .............................. Minnesota ............................ Missouri ............................... Montana ............................... Nebraska ............................. New York ............................. North Carolina ...................... North Dakota ........................ Ohio ..................................... Oklahoma ............................ Oregon ................................. Pennsylvania ....................... South Carolina ..................... South Dakota ....................... Texas ................................... Utah
2 ...................................
Virginia 2 ..............................
Washington .......................... Wisconsin ............................ Wyoming .............................. United States .......................
50 12
120 45 60 70 35 20
145 85
32 55
230 25 45
110 55 33
235 50
60 30 90 21
250 450 20 10 25
255 30
2,753
55 11
120 45 65 75 40 15
125 95
30 75
280 30 50
135 70 35
275 70
40 35 95 24
325 520 20 12 18
280 23
3,088
60 10 85 30 55 55 30
(NA) 90
120
31 50
200 30 55
145 75 40
320 75
40 30 85 25
310 450
(NA) (NA)
15 220 20
2,751
109 91 71 67 85 73 75 (X) 72
126
103 67 71
100 110 107 107 114 116 107
100 86 89
104 95 87 (X) (X) 83 79 87
89
(NA) Not available. (X) Not applicable. 1
Intended plantings in 2016 as indicated by reports from farmers. 2
Estimates discontinued in 2016.
Prospective Plantings (March 2016) 9 USDA, National Agricultural Statistics Service
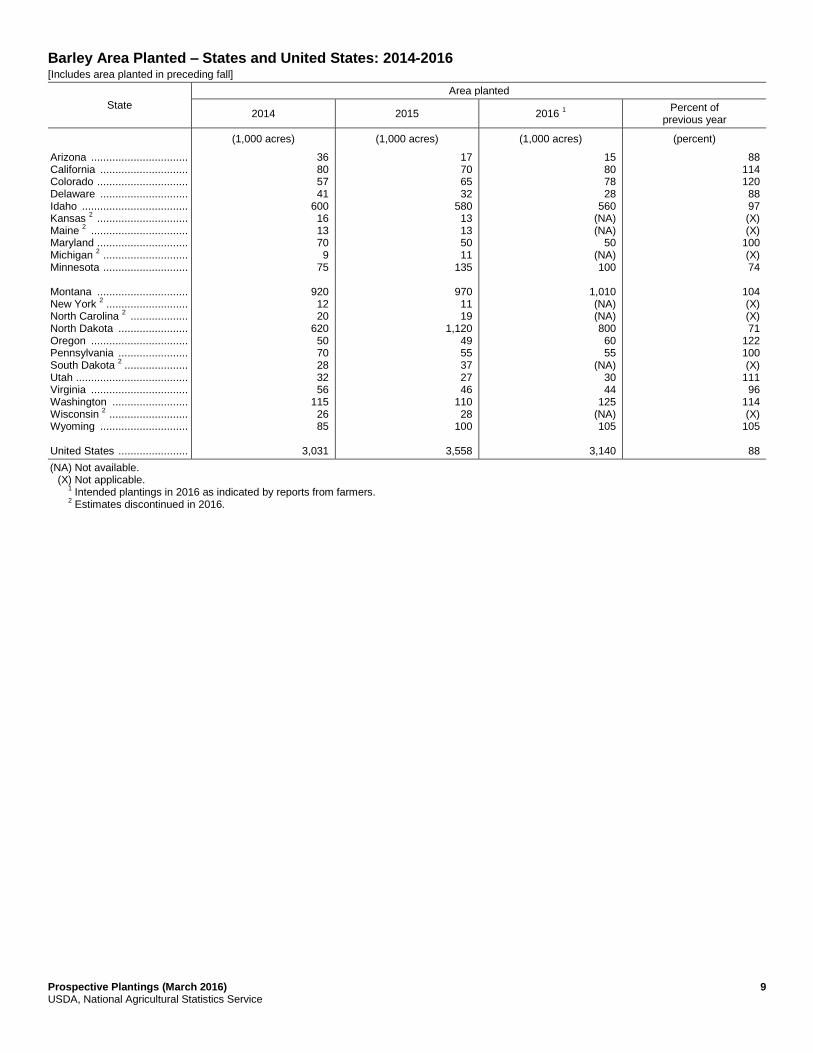
Barley Area Planted – States and United States: 2014-2016 [Includes area planted in preceding fall]
State
Area planted
2014 2015 2016 1
Percent of previous year
(1,000 acres) (1,000 acres) (1,000 acres) (percent)
Arizona ................................ California ............................. Colorado .............................. Delaware ............................. Idaho ................................... Kansas
2 ..............................
Maine 2 ................................
Maryland .............................. Michigan
2 ............................
Minnesota ............................ Montana .............................. New York
2 ...........................
North Carolina 2 ...................
North Dakota ....................... Oregon ................................ Pennsylvania ....................... South Dakota
2 .....................
Utah ..................................... Virginia ................................ Washington ......................... Wisconsin
2 ..........................
Wyoming ............................. United States .......................
36 80 57 41
600 16 13 70 9
75
920 12 20
620 50 70 28 32 56
115 26 85
3,031
17 70 65 32
580 13 13 50 11
135
970 11 19
1,120 49 55 37 27 46
110 28
100
3,558
15 80 78 28
560 (NA) (NA)
50 (NA) 100
1,010 (NA) (NA) 800 60 55
(NA) 30 44
125 (NA) 105
3,140
88 114 120 88 97 (X) (X)
100 (X) 74
104 (X) (X) 71
122 100 (X)
111 96
114 (X)
105
88
(NA) Not available. (X) Not applicable. 1
Intended plantings in 2016 as indicated by reports from farmers. 2
Estimates discontinued in 2016.

10 Prospective Plantings (March 2016) USDA, National Agricultural Statistics Service
All Wheat Area Planted – States and United States: 2014-2016 [Includes area planted in preceding fall]
State
Area planted
2014 2015 2016 1
Percent of previous year
(1,000 acres) (1,000 acres) (1,000 acres) (percent)
Alabama .............................. Arizona ................................ Arkansas .............................. California ............................. Colorado .............................. Delaware ............................. Florida .................................. Georgia ................................ Idaho .................................... Illinois ................................... Indiana ................................. Iowa ..................................... Kansas ................................. Kentucky .............................. Louisiana ............................. Maryland .............................. Michigan .............................. Minnesota ............................ Mississippi ........................... Missouri ............................... Montana ............................... Nebraska ............................. Nevada ................................ New Jersey .......................... New Mexico ......................... New York ............................. North Carolina ...................... North Dakota ........................ Ohio ..................................... Oklahoma ............................ Oregon ................................. Pennsylvania ....................... South Carolina ..................... South Dakota ....................... Tennessee ........................... Texas ................................... Utah ..................................... Virginia ................................. Washington .......................... West Virginia ........................ Wisconsin ............................ Wyoming .............................. United States .......................
255 85
465 530
2,759 80 15
300 1,271
740
390 26
9,600 630 160 340 550
1,262 230 880
5,985 1,550
21 33
380 120 830
7,960 620
5,300
830 185 230
2,514 530
6,000 130 290
2,320 10
295 140
56,841
260 150 350 465
2,408 70 25
215 1,200
540
290 20
9,200 560 110 355 510
1,532 150 760
5,520 1,490
12 27
385 120 650
7,990 520
5,300
835 195 170
2,756 455
6,000 125 260
2,280 9
230 145
54,644
195 101 220 460
2,206 80 20
200 1,221
560
350 25
8,500 550 40
360 580
1,385 90
690
4,930 1,350
18 25
370 130 490
7,040 600
5,000
785 190 90
2,284 440
5,000 126 240
2,180 8
290 140
49,559
75 67 63 99 92
114 80 93
102 104
121 125 92 98 36
101 114 90 60 91
89 91
150 93 96
108 75 88
115 94
94 97 53 83 97 83
101 92 96 89
126 97
91
1 Intended plantings for 2016 as indicated by reports from farmers.

Prospective Plantings (March 2016) 11 USDA, National Agricultural Statistics Service
Winter Wheat Area Planted – States and United States: 2014-2016 [Includes area planted in preceding fall]
State
Area planted
2014 2015 2016 Percent of
previous year
(1,000 acres) (1,000 acres) (1,000 acres) (percent)
Alabama .............................. Arizona ................................ Arkansas ............................. California ............................. Colorado .............................. Delaware ............................. Florida ................................. Georgia ............................... Idaho ................................... Illinois .................................. Indiana ................................ Iowa ..................................... Kansas ................................ Kentucky .............................. Louisiana ............................. Maryland .............................. Michigan .............................. Minnesota ............................ Mississippi ........................... Missouri ............................... Montana .............................. Nebraska ............................. Nevada ................................ New Jersey .......................... New Mexico ......................... New York ............................. North Carolina ..................... North Dakota ....................... Ohio ..................................... Oklahoma ............................ Oregon ................................ Pennsylvania ....................... South Carolina ..................... South Dakota ....................... Tennessee ........................... Texas .................................. Utah ..................................... Virginia ................................ Washington ......................... West Virginia ....................... Wisconsin ............................ Wyoming ............................. United States .......................
255 8
465 490
2,750 80 15
300 780 740
390 26
9,600 630 160 340 550 42
230 880
2,500 1,550
15 33
380 120 830 870 620
5,300
750 185 230
1,210 530
6,000 120 290
1,700 10
295 140
42,409
260 5
350 400
2,400 70 25
215 750 540
290 20
9,200 560 110 355 510 52
150 760
2,350 1,490
8 27
385 120 650 200 520
5,300
740 195 170
1,420 455
6,000 115 260
1,650 9
230 145
39,461
195 11
220 400
2,200 80 20
200 750 560
350 25
8,500 550 40
360 580 35 90
690
2,200 1,350
12 25
370 130 490 140 600
5,000
680 190 90
1,150 440
5,000 115 240
1,700 8
290 140
36,216
75 220 63
100 92
114 80 93
100 104
121 125 92 98 36
101 114 67 60 91
94 91
150 93 96
108 75 70
115 94
92 97 53 81 97 83
100 92
103 89
126 97
92

12 Prospective Plantings (March 2016) USDA, National Agricultural Statistics Service
Durum Wheat Area Planted – States and United States: 2014-2016 [Includes area planted in preceding fall in Arizona and California]
State
Area planted
2014 2015 2016 1
Percent of previous year
(1,000 acres) (1,000 acres) (1,000 acres) (percent)
Arizona ................................ California ............................. Idaho .................................... Montana ............................... North Dakota ........................ South Dakota ....................... United States .......................
77 40 11
435 840
4
1,407
145 65 10
620 1,090
6
1,936
90 60 11
630 1,200
4
1,995
62 92
110 102 110 67
103
1 Intended plantings in 2016 as indicated by reports from farmers.
Other Spring Wheat Area Planted – States and United States: 2014-2016
State
Area planted
2014 2015 2016 1
Percent of previous year
(1,000 acres) (1,000 acres) (1,000 acres) (percent)
Colorado .............................. Idaho .................................... Minnesota ............................ Montana ............................... Nevada ................................ North Dakota ........................ Oregon ................................. South Dakota ....................... Utah ..................................... Washington .......................... United States .......................
9 480
1,220 3,050
6 6,250
80 1,300
10 620
13,025
8 440
1,480 2,550
4 6,700
95 1,330
10 630
13,247
6 460
1,350 2,100
6 5,700
105 1,130
11 480
11,348
75 105 91 82
150 85
111 85
110 76
86
1 Intended plantings in 2016 as indicated by reports from farmers.

Prospective Plantings (March 2016) 13 USDA, National Agricultural Statistics Service
All Hay Area Harvested – States and United States: 2014-2016
State
Area harvested
2014 2015 2016 1
Percent of previous year
(1,000 acres) (1,000 acres) (1,000 acres) (percent)
Alabama .............................. Arizona ................................ Arkansas ............................. California ............................. Colorado .............................. Connecticut ......................... Delaware ............................. Florida ................................. Georgia ............................... Idaho ................................... Illinois .................................. Indiana ................................ Iowa ..................................... Kansas ................................ Kentucky .............................. Louisiana ............................. Maine .................................. Maryland .............................. Massachusetts ..................... Michigan .............................. Minnesota ............................ Mississippi ........................... Missouri ............................... Montana .............................. Nebraska ............................. Nevada ................................ New Hampshire ................... New Jersey .......................... New Mexico ......................... New York ............................. North Carolina ..................... North Dakota ....................... Ohio ..................................... Oklahoma ............................ Oregon ................................ Pennsylvania ....................... Rhode Island ....................... South Carolina ..................... South Dakota ....................... Tennessee ........................... Texas .................................. Utah ..................................... Vermont ............................... Virginia ................................ Washington ......................... West Virginia ....................... Wisconsin ............................ Wyoming ............................. United States .......................
750 300
1,225 1,345 1,340
53 13
320 580
1,390
520 600
1,155 2,300 2,265
470 150 195 75
980
1,910 600
3,480 2,730 2,580
430 54
106 305
1,370
830 2,700
960 3,590 1,030 1,400
7 270
3,250 1,766
5,440
680 185
1,175 870 618
1,640 1,060
57,062
730 335
1,125 1,180 1,450
53 14
290 570
1,330
490 560
1,160 2,450 2,370
430 135 215 92
970
1,570 680
2,960 2,500 2,700
320 48
102 280
1,230
777 2,750 1,080 3,020 1,060 1,290
6 300
3,400 1,765
4,730
670 145
1,175 750 590
1,510 1,080
54,437
730 330
1,120 1,160 1,400
55 14
300 570
1,330
480 550
1,200 2,400 2,400
400 135 220 99
930
1,700 700
3,200 2,500 2,700
310 48
102 260
1,230
830 2,800 1,000 2,800 1,100 1,210
7 290
3,250 1,800
4,750
680 145
1,180 720 620
1,500 1,050
54,305
100 99
100 98 97
104 100 103 100 100
98 98
103 98
101 93
100 102 108 96
108 103 108 100 100 97
100 100 93
100
107 102 93 93
104 94
117 97 96
102
100 101 100 100 96
105 99 97
100
1 Intended area harvested in 2016 as indicated by reports from farmers.

14 Prospective Plantings (March 2016) USDA, National Agricultural Statistics Service
Rice Area Planted by Class – States and United States: 2014-2016
Class and State
Area planted
2014 2015 2016 1
Percent of previous year
(1,000 acres) (1,000 acres) (1,000 acres) (percent)
Long grain Arkansas .............................. California ............................. Louisiana ............................. Mississippi ........................... Missouri ............................... Texas ................................... United States ....................... Medium grain Arkansas .............................. California ............................. Louisiana ............................. Mississippi ........................... Missouri ............................... Texas ................................... United States ....................... Short grain Arkansas .............................. California
2 ...........................
United States ....................... All Arkansas .............................. California ............................. Louisiana ............................. Mississippi ........................... Missouri ............................... Texas ................................... United States .......................
1,270
4 396 190 210 141
2,211
215 405 70 1 6 9
706
1 36
37
1,486 445 466 191 216 150
2,954
1,060
7 355 150 175 127
1,874
245 380 65
- 7 6
703
1 36
37
1,306 423 420 150 182 133
2,614
1,430
7 410 220 200 185
2,452
150 390 30
- 7 4
581
1 30
31
1,581 427 440 220 207 189
3,064
135 100 115 147 114 146
131
61 103 46 (X)
100 67
83
100 83
84
121 101 105 147 114 142
117
- Represents zero. (X) Not applicable. 1
Intended plantings in 2016 as indicated by reports from farmers. 2
Includes sweet rice.
Canola Area Planted – States and United States: 2014-2016
State
Area planted
2014 2015 2016 1
Percent of previous year
(1,000 acres) (1,000 acres) (1,000 acres) (percent)
Idaho .................................... Kansas
2 ..............................
Minnesota ............................ Montana ............................... North Dakota ........................ Oklahoma ............................ Oregon ................................. Washington .......................... Other States
3 ......................
United States .......................
35.0 (D)
15.0 63.0
1,200.0 270.0 11.0 51.0
70.0
1,715.0
28.0 (D)
23.0 82.0
1,410.0 140.0
4.3 37.0
52.7
1,777.0
25.0 40.0 24.0 75.0
1,450.0 90.0 6.5
37.0
-
1,747.5
89 (D) 104 91
103 64
151 100
(X)
98
- Represents zero. (D) Withheld to avoid disclosing data for individual operations. (X) Not applicable. 1
Intended plantings in 2016 as indicated by reports from farmers. 2
Beginning in 2016, Kansas is published individually. 3
For 2014 and 2015, Other States include Colorado and Kansas. Beginning in 2016, Other States is discontinued.

Prospective Plantings (March 2016) 15 USDA, National Agricultural Statistics Service
Soybean Area Planted – States and United States: 2014-2016
State
Area planted
2014 2015 2016 1
Percent of previous year
(1,000 acres) (1,000 acres) (1,000 acres) (percent)
Alabama .............................. Arkansas ............................. Delaware ............................. Florida ................................. Georgia ............................... Illinois .................................. Indiana ................................ Iowa ..................................... Kansas ................................ Kentucky .............................. Louisiana ............................. Maryland .............................. Michigan .............................. Minnesota ............................ Mississippi ........................... Missouri ............................... Nebraska ............................. New Jersey .......................... New York ............................. North Carolina ..................... North Dakota ....................... Ohio ..................................... Oklahoma ............................ Pennsylvania ....................... South Carolina ..................... South Dakota ....................... Tennessee ........................... Texas .................................. Virginia ................................ West Virginia ....................... Wisconsin ............................ United States .......................
480 3,230
185 39
300 9,800 5,450 9,850 4,000 1,760
1,410
510 2,050 7,350 2,210 5,650 5,400
105 330
1,750
5,900 4,700
375 570 450
5,150 1,640
155 650 27
1,800
83,276
500 3,200
175 33
325 9,800 5,550 9,850 3,900 1,840
1,430
520 2,030 7,600 2,300 4,550 5,300
105 305
1,820
5,750 4,750
395 580 475
5,150 1,750
130 630 27
1,880
82,650
470 3,050
165 30
320 10,000 5,550 9,700 3,850 1,650
1,150
510 2,100 7,400 2,000 5,500 5,300
100 315
1,700
5,900 4,650
350 590 440
5,000 1,650
190 630 26
1,950
82,236
94 95 94 91 98
102 100 98 99 90
80 98
103 97 87
121 100 95
103 93
103 98 89
102 93 97 94
146 100 96
104
99 1 Intended plantings in 2016 as indicated by reports from farmers.
Peanut Area Planted – States and United States: 2014-2016
State
Area planted
2014 2015 2016 1
Percent of previous year
(1,000 acres) (1,000 acres) (1,000 acres) (percent)
Alabama .............................. Arkansas
2 ...........................
Florida ................................. Georgia ............................... Mississippi ........................... New Mexico ......................... North Carolina ..................... Oklahoma ............................ South Carolina ..................... Texas .................................. Virginia ................................ United States .......................
175.0 (NA)
175.0 600.0 32.0 4.5
94.0 12.0
112.0 130.0 19.0
1,353.5
200.0 (NA)
190.0 785.0 44.0 5.0
90.0 10.0
112.0 170.0 19.0
1,625.0
170.0 18.0
150.0 730.0 40.0 5.0
95.0 9.0
110.0 130.0 19.0
1,476.0
85 (X) 79 93 91
100 106 90 98 76
100
91
(NA) Not available. (X) Not applicable. 1
Intended plantings in 2016 as indicated by reports from farmers. 2
Estimates began in 2016.

16 Prospective Plantings (March 2016) USDA, National Agricultural Statistics Service
Sunflower Area Planted by Type – States and United States: 2014-2016
Varietal type and State
Area planted
2014 2015 2016 1
Percent of previous year
(1,000 acres) (1,000 acres) (1,000 acres) (percent)
Oil California ............................. Colorado .............................. Kansas ................................. Minnesota ............................ Nebraska ............................. North Dakota ........................ Oklahoma
2 ..........................
South Dakota ....................... Texas ................................... United States ....................... Non-oil California ............................. Colorado .............................. Kansas ................................. Minnesota ............................ Nebraska ............................. North Dakota ........................ Oklahoma
2 ..........................
South Dakota ....................... Texas ................................... United States ....................... All California ............................. Colorado .............................. Kansas ................................. Minnesota ............................ Nebraska ............................. North Dakota ........................ Oklahoma
2 ..........................
South Dakota ....................... Texas ................................... United States .......................
44.0 35.0 45.0 47.0 27.0
520.0 3.0
410.0 43.0
1,174.0
3.5 11.5 18.0 15.0 11.0
145.0 1.3
125.0 61.0
391.3
47.5 46.5 63.0 62.0 38.0
665.0 4.3
535.0 104.0
1,565.3
33.0 60.0 57.0 77.0 29.0
620.0 3.5
580.0 91.0
1,550.5
1.4 13.0 27.0 24.0 20.0
100.0 2.2
99.0 22.0
308.6
34.4 73.0 84.0
101.0 49.0
720.0 5.7
679.0 113.0
1,859.1
42.0 40.0 45.0 75.0 27.0
630.0 (NA)
530.0 55.0
1,444.0
1.4 9.0
13.0 21.0 17.0 95.0 (NA) 75.0 18.0
249.4
43.4 49.0 58.0 96.0 44.0
725.0 (NA)
605.0 73.0
1,693.4
127 67 79 97 93
102 (X) 91 60
93
100 69 48 88 85 95 (X) 76 82
81
126 67 69 95 90
101 (X) 89 65
91
(NA) Not available. (X) Not applicable. 1
Intended plantings in 2016 as indicated by reports from farmers. 2
Estimates discontinued in 2016.
Flaxseed Area Planted – States and United States: 2014-2016
State
Area planted
2014 2015 2016 1
Percent of previous year
(1,000 acres) (1,000 acres) (1,000 acres) (percent)
Minnesota 2 ..........................
Montana ............................... North Dakota ........................ South Dakota ....................... United States .......................
2 28
275 6
311
3 31
410 19
463
(NA) 38
340 12
390
(X) 123 83 63
84
(NA) Not available. (X) Not applicable. 1
Intended plantings in 2016 as indicated by reports from farmers. 2
Estimates discontinued in 2016.

Prospective Plantings (March 2016) 17 USDA, National Agricultural Statistics Service
Cotton Area Planted by Type – States and United States: 2014-2016
Type and State
Area planted
2014 2015 2016 1
Percent of previous year
(1,000 acres) (1,000 acres) (1,000 acres) (percent)
Upland Alabama .............................. Arizona ................................ Arkansas ............................. California ............................. Florida ................................. Georgia ............................... Kansas ................................ Louisiana ............................. Mississippi ........................... Missouri ............................... New Mexico ......................... North Carolina ..................... Oklahoma ............................ South Carolina ..................... Tennessee ........................... Texas .................................. Virginia ................................ United States ....................... American Pima Arizona ................................ California ............................. New Mexico ......................... Texas .................................. United States ....................... All Alabama .............................. Arizona ................................ Arkansas ............................. California ............................. Florida ................................. Georgia ............................... Kansas ................................ Louisiana ............................. Mississippi ........................... Missouri ............................... New Mexico ......................... North Carolina ..................... Oklahoma ............................ South Carolina ..................... Tennessee ........................... Texas .................................. Virginia ................................ United States .......................
350.0 150.0 335.0 57.0
107.0 1,380.0
31.0 170.0 425.0 250.0
43.0
465.0 240.0 280.0 275.0
6,200.0 87.0
10,845.0
15.0 155.0
5.4 17.0
192.4
350.0 165.0 335.0 212.0 107.0
1,380.0 31.0
170.0 425.0 250.0
48.4
465.0 240.0 280.0 275.0
6,217.0 87.0
11,037.4
315.0 89.0
210.0 47.0 85.0
1,130.0 16.0
115.0 320.0 185.0
35.0
385.0 215.0 235.0 155.0
4,800.0 85.0
8,422.0
17.5 117.0
7.0 17.0
158.5
315.0 106.5 210.0 164.0 85.0
1,130.0 16.0
115.0 320.0 185.0
42.0
385.0 215.0 235.0 155.0
4,817.0 85.0
8,580.5
320.0 115.0 330.0 45.0 90.0
1,150.0 22.0
150.0 450.0 270.0
40.0
290.0 270.0 190.0 235.0
5,300.0 80.0
9,347.0
20.0 165.0
8.0 22.0
215.0
320.0 135.0 330.0 210.0 90.0
1,150.0 22.0
150.0 450.0 270.0
48.0
290.0 270.0 190.0 235.0
5,322.0 80.0
9,562.0
102 129 157 96
106 102 138 130 141 146
114 75
126 81
152 110 94
111
114 141 114 129
136
102 127 157 128 106 102 138 130 141 146
114 75
126 81
152 110 94
111
1 Intended plantings in 2016 as indicated by reports from farmers.

18 Prospective Plantings (March 2016) USDA, National Agricultural Statistics Service
Sugarbeet Area Planted – States and United States: 2014-2016 [Relates to year of intended harvest in all States except California]
State
Area planted
2014 2015 2016 1
Percent of previous year
(1,000 acres) (1,000 acres) (1,000 acres) (percent)
California 2 ...........................
Colorado .............................. Idaho .................................... Michigan .............................. Minnesota ............................ Montana ............................... Nebraska ............................. North Dakota ........................ Oregon ................................. Washington
3 ........................
Wyoming .............................. United States .......................
24.3 29.6
170.0 151.0 440.0 45.1 49.1
215.0 7.5
(NA) 30.9
1,162.5
25.0 27.5
171.0 152.0 443.0 44.1 47.5
208.0 9.2
(NA) 31.5
1,158.8
25.0 32.8
174.0 151.0 444.0 42.0 40.8
210.0 7.0 2.0
30.0
1,158.6
100 119 102 99
100 95 86
101 76 (X) 95
100
(NA) Not available. (X) Not applicable. 1
Intended plantings in 2016 as indicated by reports from processors. 2
Relates to year of intended harvest for fall planted beets in central California and to year of planting for overwintered beets in central and southern California.
3 Estimates began in 2016.
Tobacco Area Harvested – States and United States: 2014-2016
State
Area harvested
2014 2015 2016 1
Percent of previous year
(acres) (acres) (acres) (percent)
Connecticut 2 ........................
Georgia ................................ Kentucky .............................. Massachusetts
2 ...................
North Carolina ...................... Ohio
2 ...................................
Pennsylvania ....................... South Carolina ..................... Tennessee ........................... Virginia ................................. Other States
3 ......................
United States .......................
(D) 15,000 91,700
(D) 193,400
2,000 9,100
15,800 24,250 24,330
2,780
378,360
(D) 13,500 72,900
(D) 171,000
1,900 7,900
13,000 20,800 23,050
2,500
326,550
(NA) 13,500 75,700
(NA) 160,950
(NA) 7,000
14,500 20,350 22,450
-
314,450
(X) 100 104 (X) 94 (X) 89
112 98 97
(X)
96
- Represents zero. (D) Withheld to avoid disclosing data for individual operations. (NA) Not available. (X) Not applicable. 1
Intended area harvested in 2016 as indicated by reports from farmers. 2
Estimates discontinued in 2016. 3
Includes data withheld above.

Prospective Plantings (March 2016) 19 USDA, National Agricultural Statistics Service
Tobacco Area Harvested by Class and Type – States and United States: 2014-2016
Class, type, and State
Area harvested
2014 2015 2016 1
Percent of previous year
(acres) (acres) (acres) (percent)
Class 1, Flue-cured (11-14) Georgia .............................................................................. North Carolina .................................................................... South Carolina .................................................................... Virginia ............................................................................... United States ...................................................................... Class 2, Fire-cured (21-23) Kentucky ............................................................................. Tennessee .......................................................................... Virginia ............................................................................... United States ...................................................................... Class 3A, Light air-cured Type 31, Burley Kentucky ......................................................................... North Carolina ................................................................ Ohio
2 .............................................................................
Pennsylvania .................................................................. Tennessee ...................................................................... Virginia ........................................................................... United States .................................................................. Type 32, Southern Maryland Pennsylvania .................................................................. Total light air-cured (31-32) .............................................. Class 3B, Dark air-cured (35-37) Kentucky ............................................................................. Tennessee .......................................................................... United States ...................................................................... Class 4, Cigar filler Pennsylvania .................................................................. Class 5, Cigar binder Type 51, Connecticut Valley Broadleaf Connecticut
2 ..................................................................
Massachusetts 2 .............................................................
United States
2 ................................................................
Class 6, Cigar wrapper Type 61, Connecticut Valley Shade-grown Connecticut
2 ..................................................................
Massachusetts 2 .............................................................
United States
2 ................................................................
Other cigar types (51-61) .................................................. Total cigar types (41-61)
3 .................................................
All tobacco United States ......................................................................
15,000
192,000 15,800 22,500
245,300
10,700 7,600
330
18,630
76,000 1,400 2,000 5,100
15,500 1,500
101,500
2,000
103,500
5,000 1,150
6,150
2,000
(D) (D)
(D)
(D) (D)
(D)
2,780
4,780
378,360
13,500
170,000 13,000 21,500
218,000
9,900 7,600
250
17,750
58,000 1,000 1,900 4,700
12,000 1,300
78,900
1,600
80,500
5,000 1,200
6,200
1,600
(D) (D)
(D)
(D) (D)
(D)
2,500
4,100
326,550
13,500
160,000 14,500 21,000
209,000
10,000 7,100
250
17,350
61,000 950
(NA) 4,000
12,000 1,200
79,150
1,600
80,750
4,700 1,250
5,950
1,400
(NA) (NA)
(NA)
(NA) (NA)
(NA)
(NA)
1,400
314,450
100 94
112 98
96
101 93
100
98
105 95 (X) 85
100 92
100
100
100
94 104
96
88
(X) (X)
(X)
(X) (X)
(X)
(X)
34
96
(D) Withheld to avoid disclosing data for individual operations. (NA) Not available. (X) Not applicable. 1
Intended area harvested in 2016 as indicated by reports from farmers. 2
Estimates discontinued in 2016. 3
Beginning in 2016, estimates only include Class 4 Cigar filler.

20 Prospective Plantings (March 2016) USDA, National Agricultural Statistics Service
Dry Edible Bean Area Planted – States and United States: 2014-2016 [Excludes beans grown for garden seed]
State
Area planted
2014 2015 2016 1
Percent of previous year
(1,000 acres) (1,000 acres) (1,000 acres) (percent)
Arizona 2 ..............................
California ............................. Colorado .............................. Idaho .................................... Kansas
2 ..............................
Michigan .............................. Minnesota ............................ Montana ............................... Nebraska ............................. New Mexico
2 .......................
New York
2 ...........................
North Dakota ........................ Oregon
2 ..............................
South Dakota 2 ....................
Texas ................................... Washington .......................... Wisconsin
2 .........................
Wyoming .............................. United States .......................
11.0 48.0 46.0
125.0 7.5
230.0 155.0 37.5
170.0 10.5
8.0
630.0 8.5
14.0 23.0
127.7 7.9
42.0
1,701.6
9.1 45.0 50.0
120.0 8.0
275.0 190.0 49.0
140.0 12.9
8.0
655.0 9.0
12.5 31.0
110.0 7.9
32.0
1,764.4
(NA) 39.0 55.0
120.0 (NA)
215.0 155.0 80.0
115.0 (NA)
(NA)
590.0 (NA) (NA) 30.0
120.0 (NA) 40.0
1,559.0
(X) 87
110 100 (X) 78 82
163 82 (X)
(X) 90 (X) (X) 97
109 (X)
125
88
(NA) Not available. (X) Not applicable. 1
Intended plantings in 2016 as indicated by reports from farmers. 2
Estimates discontinued in 2016.

Prospective Plantings (March 2016) 21 USDA, National Agricultural Statistics Service
Chickpea (Garbanzo Bean) Area Planted – States and United States: 2014-2016 [Chickpea acres included with dry bean acres]
Size and State
Area planted
2014 2015 2016 1
Percent of previous year
(1,000 acres) (1,000 acres) (1,000 acres) (percent)
Small chickpeas 2
Idaho ................................................................... Montana .............................................................. North Dakota ....................................................... Oregon
3 ..............................................................
South Dakota 3 .....................................................
Washington ......................................................... Other States
4 ......................................................
United States ....................................................... Large chickpeas
5
California ............................................................. Idaho ................................................................... Montana .............................................................. Nebraska
3 ...........................................................
North Dakota ....................................................... Oregon
3 ..............................................................
South Dakota 3 .....................................................
Washington ......................................................... Other States
4 ......................................................
United States ....................................................... All chickpeas (Garbanzo) California ............................................................. Idaho ................................................................... Montana .............................................................. Nebraska
3 ...........................................................
North Dakota ....................................................... Oregon
3 ..............................................................
South Dakota 3 .....................................................
Washington ......................................................... United States .......................................................
29.0 (D) 2.0 (D) (D)
22.0
13.8
66.8
9.3 45.0 (D)
- 4.4 (D) (D)
68.0
21.6
148.3
9.3 74.0 31.5
- 6.4 1.1 2.8
90.0
215.1
32.0 (D) 5.0 (D)
- 20.0
15.2
72.2
7.7 38.0 (D) 0.2 2.4 (D) 3.2
55.0
28.8
135.3
7.7 70.0 43.0 0.2 7.4 1.0 3.2
75.0
207.5
30.0 18.0 5.0
(NA) (NA) 30.0
-
83.0
7.0 40.0 50.0 (NA)
6.0 (NA) (NA) 60.0
-
163.0
7.0 70.0 68.0 (NA) 11.0 (NA) (NA) 90.0
246.0
94
(D) 100 (X) (X)
150
(X)
115
91 105 (D) (X)
250 (X) (X)
109
(X)
120
91 100 158 (X)
149 (X) (X)
120
119
- Represents zero. (D) Withheld to avoid disclosing data for individual operations. (NA) Not available. (X) Not applicable. 1
Intended plantings in 2016 as indicated by reports from farmers. 2
Chickpeas (or Garbanzo beans) smaller than 20/64 inches. 3
Estimates discontinued in 2016. 4
Includes data withheld above. 5
Chickpeas (or Garbanzo beans) larger than 20/64 inches.

22 Prospective Plantings (March 2016) USDA, National Agricultural Statistics Service
Lentil Area Planted – States and United States: 2014-2016
State
Area planted
2014 2015 2016 1
Percent of previous year
(1,000 acres) (1,000 acres) (1,000 acres) (percent)
Idaho .................................... Montana ............................... North Dakota ........................ Washington .......................... United States .......................
25.0 130.0 75.0 51.0
281.0
33.0 235.0 165.0 60.0
493.0
40.0 500.0 240.0 70.0
850.0
121 213 145 117
172
1 Intended plantings in 2016 as indicated by reports from farmers.
Dry Edible Pea Area Planted – States and United States: 2014-2016
State
Area planted
2014 2015 2016 1
Percent of previous year
(1,000 acres) (1,000 acres) (1,000 acres) (percent)
Idaho .................................... Montana ............................... Nebraska
2 ...........................
North Dakota ........................ Oregon ................................. South Dakota
2 .....................
Washington .......................... United States .......................
46.0 525.0 (NA)
265.0 9.0
(NA) 90.0
935.0
51.0 595.0 (NA)
385.0 7.0
(NA) 105.0
1,143.0
40.0 580.0 50.0
640.0 8.0
25.0 80.0
1,423.0
78 97 (X)
166 114 (X) 76
124
(NA) Not available. (X) Not applicable. 1
Intended plantings in 2016 as indicated by reports from farmers. 2
Estimates began in 2016.
Austrian Winter Pea Area Planted – States and United States: 2014-2016
State
Area planted
2014 2015 2016 1
Percent of previous year
(1,000 acres) (1,000 acres) (1,000 acres) (percent)
Idaho .................................... Montana ............................... Oregon ................................. United States .......................
9.0 12.0 3.0
24.0
13.0 15.0 6.0
34.0
14.0 11.0 6.0
31.0
108 73
100
91 1 Intended plantings in 2016 as indicated by reports from farmers.

Prospective Plantings (March 2016) 23 USDA, National Agricultural Statistics Service
Spring Potato Area Planted – States and United States: 2014-2016
State
Area planted
2014 2015 2016 1
Percent of previous year
(1,000 acres) (1,000 acres) (1,000 acres) (percent)
Arizona 2 ..............................
California ............................. Florida ................................. North Carolina
3 ...................
United States .......................
3.8 25.0 30.5 14.5
73.8
3.6 23.0 30.0 13.5
70.1
(NA) 26.0 29.0 (NA)
55.0
(X) 113 97 (X)
78
(NA) Not available. (X) Not applicable. 1
Intended plantings in 2016 as indicated by reports from farmers. 2
Estimates discontinued in 2016. 3
Beginning in 2016, North Carolina estimates included with summer states.
Sweet Potato Area Planted – States and United States: 2014-2016
State
Area planted
2014 2015 2016 1
Percent of previous year
(1,000 acres) (1,000 acres) (1,000 acres) (percent)
Alabama 2 ............................
Arkansas ............................. California ............................. Florida ................................. Louisiana ............................. Mississippi ........................... New Jersey
2 .......................
North Carolina ..................... Texas
2 ................................
Other States
3 ......................
United States .......................
2.1 4.0
19.0 6.0 9.0
22.0 1.2
73.0 1.0
-
137.3
2.6 4.0
18.5 5.6
10.0 27.0 1.2
87.0 1.0
-
156.9
(NA) (D)
20.0 (D)
10.0 25.0 (NA)
105.0 (NA)
9.4
169.4
(X) (D) 108 (D) 100 93 (X)
121 (X)
(X)
108
- Represents zero. (D) Withheld to avoid disclosing data for individual operations. (NA) Not available. (X) Not applicable. 1
Intended plantings in 2016 as indicated by reports from farmers. 2
Estimates discontinued in 2016. 3
Includes data withheld above.

24 Prospective Plantings (March 2016) USDA, National Agricultural Statistics Service
Crop Area Planted and Harvested, Yield, and Production in Domestic Units – United States: 2015 and 2016 [Data are the latest estimates available, either from the current report or from previous reports. Current year estimates are for the full 2016 crop year. Blank data cells indicate estimation period has not yet begun]
Crop Area planted Area harvested
2015 2016 2015 2016
(1,000 acres) (1,000 acres) (1,000 acres) (1,000 acres)
Grains and hay Barley .............................................................................................. Corn for grain
1 .................................................................................
Corn for silage ................................................................................. Hay, all ............................................................................................. Alfalfa ........................................................................................... All other ........................................................................................ Oats ................................................................................................. Proso millet ...................................................................................... Rice ................................................................................................. Rye .................................................................................................. Sorghum for grain
1 ..........................................................................
Sorghum for silage ........................................................................... Wheat, all ......................................................................................... Winter .......................................................................................... Durum .......................................................................................... Other spring ................................................................................. Oilseeds Canola ............................................................................................. Cottonseed ...................................................................................... Flaxseed .......................................................................................... Mustard seed ................................................................................... Peanuts ........................................................................................... Rapeseed ........................................................................................ Safflower .......................................................................................... Soybeans for beans ......................................................................... Sunflower ......................................................................................... Cotton, tobacco, and sugar crops Cotton, all ........................................................................................ Upland ......................................................................................... American Pima ............................................................................. Sugarbeets ...................................................................................... Sugarcane ....................................................................................... Tobacco ........................................................................................... Dry beans, peas, and lentils Austrian winter peas ........................................................................ Dry edible beans .............................................................................. Chickpeas, all
3 ............................................................................
Large ......................................................................................... Small .......................................................................................... Dry edible peas ................................................................................ Lentils .............................................................................................. Wrinkled seed peas ......................................................................... Potatoes and miscellaneous Hops ................................................................................................ Maple syrup ..................................................................................... Mushrooms ...................................................................................... Peppermint oil .................................................................................. Potatoes, all ..................................................................................... Spring .......................................................................................... Summer ....................................................................................... Fall ............................................................................................... Spearmint oil .................................................................................... Sweet potatoes ................................................................................ Taro (Hawaii) ...................................................................................
3,558
87,999 (NA) (NA) (NA) (NA)
3,088 445
2,614 1,569 8,459 (NA)
54,644 39,461 1,936
13,247
1,777.0 (X)
463 44.0
1,625.0 1.2
168.2 82,650 1,859.1
8,580.5 8,422.0
158.5 1,158.8
(NA) (NA)
34.0 1,764.4
207.5 135.3 72.2
1,143.0 493.0 (NA)
(NA) (NA) (NA) (NA)
1,065.2 70.1 50.5
944.6 (NA)
156.9 (NA)
3,140
93,601
(NA)
2,751
3,064
7,216
49,559 36,216 1,995
11,348
1,747.5
390
1,476.0
82,236 1,693.4
9,562.0 9,347.0
215.0 1,158.6
(NA)
31.0 1,559.0
246.0 163.0 83.0
1,423.0 850.0
55.0
169.4
3,109
80,749 6,221
54,437 17,778 36,659 1,276
418 2,575
360 7,851
306 47,094 32,257 1,896
12,941
1,714.5 (X)
456 40.1
1,567.0 1.1
159.1 81,814 1,799.4
8,057.9 7,903.0
154.9 1,144.3
891.7 326.6
21.0 1,711.4
203.1 131.2 71.9
1,083.5 476.0 (NA)
43.6 (NA) (NA) 65.2
1,053.3 68.5 47.1
937.7 27.2
153.1 0.3
54,305
314.5
See footnote(s) at end of table. --continued

Prospective Plantings (March 2016) 25 USDA, National Agricultural Statistics Service
Crop Area Planted and Harvested, Yield, and Production in Domestic Units – United States: 2015 and 2016 (continued) [Data are the latest estimates available, either from the current report or from previous reports. Current year estimates are for the full 2016 crop year. Blank data cells indicate estimation period has not yet begun]
Crop Yield per acre Production
2015 2016 2015 2016
(1,000) (1,000)
Grains and hay Barley ................................................................................... bushels Corn for grain ........................................................................ bushels Corn for silage ............................................................................ tons Hay, all ....................................................................................... tons Alfalfa ..................................................................................... tons All other .................................................................................. tons Oats ...................................................................................... bushels Proso millet ........................................................................... bushels Rice
2 ........................................................................................... cwt
Rye ....................................................................................... bushels Sorghum for grain ................................................................. bushels Sorghum for silage ...................................................................... tons Wheat, all ............................................................................. bushels Winter ............................................................................... bushels Durum ............................................................................... bushels Other spring ...................................................................... bushels Oilseeds Canola ................................................................................... pounds Cottonseed ................................................................................. tons Flaxseed ............................................................................... bushels Mustard seed ......................................................................... pounds Peanuts ................................................................................. pounds Rapeseed .............................................................................. pounds Safflower ............................................................................... pounds Soybeans for beans .............................................................. bushels Sunflower .............................................................................. pounds Cotton, tobacco, and sugar crops Cotton, all
2 ............................................................................... bales
Upland 2 ................................................................................ bales
American Pima 2 ................................................................... bales
Sugarbeets ................................................................................. tons Sugarcane .................................................................................. tons Tobacco ................................................................................. pounds Dry beans, peas, and lentils Austrian winter peas
2 .................................................................. cwt
Dry edible beans 2 ....................................................................... cwt
Chickpeas, all 2 3 ...................................................................... cwt
Large 2 ................................................................................... cwt
Small 2 ................................................................................... cwt
Dry edible peas 2 ......................................................................... cwt
Lentils 2 ........................................................................................ cwt
Wrinkled seed peas ..................................................................... cwt Potatoes and miscellaneous Hops ...................................................................................... pounds Maple syrup ........................................................................... gallons Mushrooms ............................................................................ pounds Peppermint oil ........................................................................ pounds Potatoes, all ................................................................................. cwt Spring ...................................................................................... cwt Summer ................................................................................... cwt Fall .......................................................................................... cwt Spearmint oil ......................................................................... pounds Sweet potatoes ............................................................................ cwt Taro (Hawaii) ......................................................................... pounds
68.9
168.4 20.4 2.47 3.32 2.06 70.2 33.9
7,470 31.9 76.0 14.6 43.6 42.5 43.5 46.3
1,677 (X)
22.1 671
3,963 1,382 1,347 48.0
1,625
771 760
1,348 30.8 37.3
2,178
1,238 1,760 1,242 1,231 1,263 1,687 1,108 (NA)
1,807 (NA) (NA)
90 418 296 334 431 113 203
10,300
214,297
13,601,198 126,894 134,388 58,974 75,414 89,535 14,159
192,343 11,496
596,751 4,475
2,051,752 1,370,188
82,484 599,080
2,875,010 4,153.0 10,095 26,927
6,210,590 1,520
214,251 3,929,160 2,923,730
12,943.0 12,508.0
435.0 35,278 33,244
711,236
260 30,121 2,523 1,615
908 18,283 5,276
384
78,846.0 3,414
952,619 5,882
440,498 20,251 15,734
404,513 3,070
31,016 3,502
(NA) Not available. (X) Not applicable. 1
Area planted for all purposes. 2
Yield in pounds. 3
Chickpeas included with dry edible beans.

26 Prospective Plantings (March 2016) USDA, National Agricultural Statistics Service
Crop Area Planted and Harvested, Yield, and Production in Metric Units – United States: 2015 and 2016 [Data are the latest estimates available, either from the current report or from previous reports. Current year estimates are for the full 2016 crop year. Blank data cells indicate estimation period has not yet begun]
Crop Area planted Area harvested
2015 2016 2015 2016
(hectares) (hectares) (hectares) (hectares)
Grains and hay Barley ................................................................................. Corn for grain
1 ....................................................................
Corn for silage .................................................................... Hay, all
2 .............................................................................
Alfalfa .............................................................................. All other ........................................................................... Oats .................................................................................... Proso millet ......................................................................... Rice .................................................................................... Rye ..................................................................................... Sorghum for grain
1 .............................................................
Sorghum for silage .............................................................. Wheat, all
2 .........................................................................
Winter ............................................................................. Durum ............................................................................. Other spring .................................................................... Oilseeds Canola ................................................................................ Cottonseed ......................................................................... Flaxseed ............................................................................. Mustard seed ...................................................................... Peanuts .............................................................................. Rapeseed ........................................................................... Safflower ............................................................................. Soybeans for beans ............................................................ Sunflower ............................................................................ Cotton, tobacco, and sugar crops Cotton, all
2 .........................................................................
Upland ............................................................................ American Pima ................................................................ Sugarbeets ......................................................................... Sugarcane .......................................................................... Tobacco .............................................................................. Dry beans, peas, and lentils Austrian winter peas ........................................................... Dry edible beans ................................................................. Chickpeas
3 .....................................................................
Large ............................................................................ Small ............................................................................. Dry edible peas ................................................................... Lentils ................................................................................. Wrinkled seed peas ............................................................ Potatoes and miscellaneous Hops ................................................................................... Maple syrup ........................................................................ Mushrooms ......................................................................... Peppermint oil ..................................................................... Potatoes, all
2 ......................................................................
Spring ............................................................................. Summer .......................................................................... Fall .................................................................................. Spearmint oil ....................................................................... Sweet potatoes ................................................................... Taro (Hawaii) ......................................................................
1,439,890
35,612,320 (NA) (NA) (NA) (NA)
1,249,680 180,090
1,057,860 634,960
3,423,270 (NA)
22,113,880 15,969,470
783,480 5,360,930
719,130 (X)
187,370 17,810
657,620 490
68,070 33,447,630
752,360
3,472,440 3,408,300
64,140 468,950
(NA) (NA)
13,760 714,040 83,970 54,750 29,220
462,560 199,510
(NA)
(NA) (NA) (NA) (NA)
431,080 28,370 20,440
382,270 (NA)
63,500 (NA)
1,270,730
37,879,390
(NA)
1,113,300
1,239,970
2,920,240
20,056,030 14,656,250
807,360 4,592,420
707,200
157,830
597,320
33,280,090 685,300
3,869,650 3,782,640
87,010 468,870
(NA)
12,550 630,910 99,550 65,960 33,590
575,870 343,990
22,260
68,550
1,258,180
32,678,310 2,517,580
22,030,110 7,194,580
14,835,530 516,380 169,160
1,042,080 145,690
3,177,220 123,840
19,058,470 13,054,090
767,290 5,237,090
693,840 (X)
184,540 16,230
634,150 450
64,390 33,109,310
728,200
3,260,950 3,198,270
62,690 463,090 360,860 132,150
8,500 692,590
82,190 53,100 29,100
438,480 192,630
(NA)
17,660 (NA) (NA)
26,390 426,260
27,720 19,060
379,480 11,010 61,960
140
21,976,690
127,250
See footnote(s) at end of table. --continued

Prospective Plantings (March 2016) 27 USDA, National Agricultural Statistics Service
Crop Area Planted and Harvested, Yield, and Production in Metric Units – United States: 2015 and 2016 (continued) [Data are the latest estimates available, either from the current report or from previous reports. Current year estimates are for the full 2016 crop year. Blank data cells indicate estimation period has not yet begun]
Crop Yield per hectare Production
2015 2016 2015 2016
(metric tons) (metric tons) (metric tons) (metric tons)
Grains and hay Barley .............................................................................................. Corn for grain ................................................................................... Corn for silage ................................................................................. Hay, all
2 ..........................................................................................
Alfalfa .......................................................................................... All other ....................................................................................... Oats ................................................................................................. Proso millet ...................................................................................... Rice ................................................................................................. Rye .................................................................................................. Sorghum for grain ............................................................................ Sorghum for silage ........................................................................... Wheat, all
2 ......................................................................................
Winter .......................................................................................... Durum .......................................................................................... Other spring ................................................................................. Oilseeds Canola ............................................................................................. Cottonseed ...................................................................................... Flaxseed .......................................................................................... Mustard seed ................................................................................... Peanuts ........................................................................................... Rapeseed ........................................................................................ Safflower ......................................................................................... Soybeans for beans ......................................................................... Sunflower ........................................................................................ Cotton, tobacco, and sugar crops Cotton, all
2 ......................................................................................
Upland ......................................................................................... American Pima ............................................................................ Sugarbeets ...................................................................................... Sugarcane ....................................................................................... Tobacco ........................................................................................... Dry beans, peas, and lentils Austrian winter peas ........................................................................ Dry edible beans .............................................................................. Chickpeas, all
3 ............................................................................
Large ......................................................................................... Small ......................................................................................... Dry edible peas ................................................................................ Lentils .............................................................................................. Wrinkled seed peas ......................................................................... Potatoes and miscellaneous Hops ................................................................................................ Maple syrup ..................................................................................... Mushrooms ...................................................................................... Peppermint oil .................................................................................. Potatoes, all
2 ..................................................................................
Spring .......................................................................................... Summer ....................................................................................... Fall .............................................................................................. Spearmint oil ................................................................................... Sweet potatoes ................................................................................ Taro (Hawaii) ...................................................................................
3.71
10.57 45.73 5.53 7.44 4.61 2.52 1.90 8.37 2.00 4.77
32.78 2.93 2.86 2.93 3.11
1.88 (X)
1.39 0.75 4.44 1.55 1.51 3.23 1.82
0.86 0.85 1.51
69.11 83.57 2.44
1.39 1.97 1.39 1.38 1.42 1.89 1.24 (NA)
2.03 (NA) (NA) 0.10
46.87 33.14 37.44 48.35 0.13
22.71 11.55
4,665,770
345,486,340 115,116,300 121,914,740 53,500,310 68,414,430 1,299,600
321,120 8,724,530
292,010 15,158,170 4,059,650
55,839,540 37,290,410 2,244,850
16,304,290
1,304,080 3,767,540
256,420 12,210
2,817,080 690
97,180 106,934,210
1,326,180
2,818,010 2,723,300
94,710 32,003,660 30,158,450
322,610
11,790 1,366,270
114,440 73,260 41,190
829,300 239,320 17,420
35,760 17,070
432,100 2,670
19,980,650 918,570 713,680
18,348,400 1,390
1,406,860 1,590
(NA) Not available. (X) Not applicable. 1
Area planted for all purposes. 2
Total may not add due to rounding. 3
Chickpeas included with dry edible beans.

28 Prospective Plantings (March 2016) USDA, National Agricultural Statistics Service
Winter Weather Summary
Highlights: A strong El Niño brought some widely expected winter weather impacts to the United States, but also
provided some surprises. For example, atmospheric warmth in part supplied by the balmy central and eastern equatorial
Pacific Ocean contributed to the Nation’s warmest December-February period on record. Similarly, the contiguous
United States experienced its wettest winter since the record-setting El Niño of 1997-98. However, El Niño’s impacts on
the Western winter wet season were somewhat reversed, with wetter conditions in the Pacific Northwest and drier weather
in the Southwest. In addition, uncharacteristically wet conditions affected much of the Midwest, especially in December.
The cool conditions that often cover the South during El Niño were present only periodically, mainly in January and
February.
In fact, December seemed like anything but a winter month, ranking first all-time for both United States warmth and
wetness. The wet conditions peaked in late December, culminating in record flooding in parts of the middle
Mississippi Valley. Despite the overall December warmth, a late-month blizzard on the southern High Plains proved
devastating for livestock. Elsewhere, storms during December and January provided Western drought relief. Although
many of January’s storms were focused across the West, several had impacts farther east. For example, a blizzard struck
the Mid-Atlantic States on January 22-23, with significant snow extending as far west as the interior Southeast. Warmth
returned to nearly all of the United States during February, while storminess largely vacated the West. Despite the lack of
late-winter storms in the West, overall United States drought coverage plunged from more than one-third (34.8 percent) of
the Lower 48 States on October 20, 2015, to approximately one-seventh (14.3 percent) of the Country on March 1, 2016.
Historical Perspective: Given the warming influence of El Niño and the lack of sustained cold waves, it was not
surprisingly the warmest United States winter during the period of record that began in 1895-96. According to preliminary
information provided by the National Centers for Environmental Information (NCEI), the Nation’s winter average
temperature of 36.8°F was 4.6°F above the 1901-2000 mean, edging the 1999-2000 standard of 36.5°F. It was the
warmest winter on record in all six New England States, and among the ten warmest in 28 other States. All 48 States were
in the “warm” half of the historical distribution; Nevada and Utah were the “coolest” States, each reporting its
41st warmest winter.
Meanwhile, the Nation experienced its 12th-wettest winter—and wettest December-February period since the record-wet
El Niño winter of 1997-98. December-February precipitation averaged 8.05 inches across the Lower 48 States,
119 percent of normal. It was the 39th-driest winter in Louisiana and Wyoming, but among the ten wettest winters in
Washington, Nebraska, three Midwestern States, and four Southeastern States.
December: Record-setting December warmth covered much of the Midwest and East, while heavy to record-setting
precipitation fell across the Northwest, mid-South, and upper Midwest. Relentless precipitation further eased or eradicated
Northwestern drought, but southern California and the Desert Southwest received little December moisture. Farther east,
an already wet pattern in the Nation’s mid-section culminated in a late-month deluge that drove the Mississippi River to
record-high levels from Cape Girardeau, Missouri, to Thebes, Illinois. Record-breaking crests were also noted along
several Mississippi River tributaries, especially in Missouri.
The wetness across the mid-South and lower Midwest increased concerns about soft red winter wheat due to standing
water and lowland flooding. During December, the portion of Illinois’ winter wheat rated in good to excellent condition
fell from 67 to 58 percent. Excessively wet conditions also plagued parts of the Southeast, hampering final harvest and
winter wheat planting efforts. In North Carolina, only 42 percent of the winter wheat was rated in good to excellent
condition at the end of December, down from 69 percent on November 29.
Unusual warmth accompanied the general wetness across the eastern half of the Country. In the Southeast, warm
conditions allowed winter grains and cool-season pastures to continue to develop. Farther north, periods of snow
blanketed the upper Midwest, despite above-normal temperatures. Occasional snow also fell across the Plains, providing
winter wheat with some moisture and insulation. On the southern High Plains, however, a late-month blizzard caused
significant livestock losses due to bitter cold and wind-driven snow.
According to NCEI, the contiguous United States experienced unprecedented December warmth and wetness. The

Prospective Plantings (March 2016) 29 USDA, National Agricultural Statistics Service
Nation’s monthly average temperature of 38.6°F was 6.0°F above the 1901-2000 mean and easily topped the
December 1939 standard of 37.7°F. It was the warmest December on record in Iowa, Minnesota, and Missouri, along with
every State east of the Mississippi River. Meanwhile, December precipitation averaged 3.93 inches, 167 percent of
normal. Another El Niño-influenced December, 1982, slipped to second place on the all-time list with 3.76 inches. Two
States, Iowa and Wisconsin, weathered their wettest December, and it was among the ten wettest in eighteen other States
stretching from Washington and Oregon to the Carolinas and Georgia.
January: Frequent storms, in part fueled by a strong El Niño, further dented Western drought and maintained generally
adequate to locally excessive soil moisture across the central and eastern United States.
In early January and again at month’s end, a southward shift in the storm track brought significant precipitation to
southern California and the Southwest. For the remainder of January, storms primarily crossed the Northwest, with
meaningful precipitation often falling as far south as northern and central California. By the end of January, the average
water content of the high-elevation Sierra Nevada snowpack stood at 20 inches, about 115 percent of average for the date.
Meanwhile, wet weather in southern Florida resulted in numerous January rainfall records and adversely affected winter
vegetables and other crops. At times, high winds accompanied southern Florida’s heavy rain. Farther north, a major winter
storm on January 22-23 produced freezing rain in parts of the Carolinas and heavy snow from the interior Southeast to the
northern Mid-Atlantic States.
Some of the coldest air of the season trailed the storm into the Southeast from January 23-25, although Florida’s citrus
belt escaped without a significant freeze. Elsewhere, near- to above-normal temperatures dominated the Country during
January, with colder-than-normal conditions mostly limited to the Southeast and areas blanketed by the January 22-23
snowfall.
Amid the overall stormy January pattern, a few areas began to turn dry. However, drier-than-normal January conditions
across the southern Plains, mid-south, and parts of the Southeast were mostly favorable, following the excessive rainfall
and flooding of October-December 2015. At the end of January, USDA categorized more than two-thirds of the winter
wheat in good to excellent condition in several major production States, including Oklahoma (74 percent good to
excellent); Ohio (74 percent); Michigan (73 percent); Montana (72 percent); Indiana (71 percent); and South Dakota
(67 percent). In contrast, North Carolina’s wheat continued to struggle from the effects of autumn wetness and delayed
planting; only 36 percent of the State’s crop was rated good to excellent on January 31.
By February 2, the United States drought coverage of 15.5 percent represented the smallest area drought extent since
October 26, 2010. As recently as October 20, 2015, contiguous United States drought coverage stood at 34.8 percent. In
January, most of the remaining Western drought was only apparent when looking at long-term indicators such as
below-average reservoir storage, groundwater shortages, and tree mortality.
According to NCEI, the contiguous United States experienced its 34th-warmest, and 36th-driest January during the
122-year period of record. The Nation’s monthly average temperature of 32.2°F was 2.1°F above the 1901-2000 mean.
State temperature rankings ranged from the 33rd-coolest January in West Virginia to the 11th-warmest January in Maine.
Meanwhile, January precipitation averaged 2.03 inches, 88 percent of normal. However, Florida’s precipitation averaged
5.96 inches, 201 percent of normal, marking its fourth-wettest January. California (6.16 inches, 145 percent of normal)
experienced its wettest January since 2010. It was also California’s wettest October-January period (13.62 inches;
117 percent of normal) since 2009-10. In contrast, Ohio noted its ninth-driest January.
February: For the second time in 3 months, warmth stretched nearly coast to coast, with only small sections of the
southern Atlantic States experiencing cooler-than-normal weather. Unlike December, when unprecedented warmth
covered areas from the Mississippi Valley to the East Coast, February’s record-setting high temperatures were focused
across the Plains.
As a result, winter wheat prematurely broke dormancy across the central and southern Plains, leaving the crop vulnerable
to potential spring freezes. On the northern Plains, where February temperatures averaged more than 10°F above normal
in some locations, wheat lost some winter hardiness and was often buffeted by breezy conditions. The Plains’ most

30 Prospective Plantings (March 2016) USDA, National Agricultural Statistics Service
impressive warm spells peaked on February 18 and 27, with numerous monthly record highs established on both dates.
During February, the portion of the winter wheat crop rated in good to excellent condition declined in Texas, from 49 to
40 percent, in part due to short-term dryness. Pockets of dryness also developed elsewhere across the southern half of the
Plains. In contrast, early-month snowfall provided wheat with beneficial moisture across much of Nebraska,
eastern Colorado, and northwestern Kansas.
Uncharacteristic of a strong, mature El Niño, February was unusually dry across much of the West. During February, the
average water content of the high-elevation Sierra Nevada snowpack was nearly steady at 20 to 22 inches, with only
minor storms affecting key watersheds. Since February is typically an important month for Sierra Nevada snowpack
accumulation, the percent of historic average dropped from about 115 percent of average on February 1 to just 85 percent
by month’s end. Farther north, occasional precipitation benefited Northwestern winter grains.
Meanwhile, mild, occasionally stormy conditions prevailed across the Midwest, although a mid-month cold snap briefly
resulted in some of the coldest weather of the season. Overwintering conditions remained mostly favorable for
Midwestern wheat, with more than two-thirds of the crop rated in good to excellent condition at the end of February in
Ohio (72 percent) and Indiana (67 percent).
Similarly, the mid-month cold spell interrupted an otherwise mild regime in the Northeast, while cool conditions were a
little more persistent in the Southeast. An abundance of precipitation fell during February across most of the eastern
one-third of the Country, with some of the heaviest rain occurring in the coastal Carolinas. Severe weather outbreaks were
noted across portions of the South and East on February 2-3, 15-16, and 23-24. From the Ohio Valley into the
Northeastern and Mid-Atlantic States, some of the precipitation—especially around mid-month—fell as snow, sleet, or
freezing rain.
By February 29, only one-eighth (12.5 percent) of the Country was covered by snow, compared to 60.2 percent at the end
of February 2015. At the same time, just 14.3 percent of the Nation was experiencing drought on March 1, according to
the United States Drought Monitor. Drought coverage across the contiguous United States had not been lower in more
than 5 years, since October 2010.
According to NCEI, the contiguous United States experienced its seventh-warmest, 46th-driest February during the
122-year period of record. The Nation’s monthly average temperature of 39.5°F was 5.7°F above the 1901-2000 mean,
while the average precipitation of 1.93 inches was 91 percent of normal. Overall, it was the Nation’s warmest February
since 2000. All States reported a February average temperature in the upper (warm) half of the historical distribution. For
a dozen States across the western and central United States, as well as three States in New England, temperatures were
among the ten highest respective February values on record. In Montana, where the monthly average temperature of
33.6°F was 12.3°F above the 20th century mean, it was the second-warmest February behind 1991. Meanwhile, State
precipitation rankings ranged from the 14th-driest February in California to top-ten values for February wetness in
New Hampshire, New York, Maine, and Vermont. California’s monthly precipitation averaged 1.14 inches, just
30 percent of normal.
Crop Comments
Corn: Growers intend to plant 93.6 million acres of corn for all purposes in 2016, up 6 percent from last year and up
3 percent from 2014. If realized, this will be the third highest planted acreage in the United States since 1944. Compared
with last year, planted acreage is expected to be up or unchanged in 41 of the 48 estimating States. The increase in planted
acres is mainly due to the expectation of higher returns in 2016 compared with other crops. Acreage increases of
400,000 or more compared with last year are expected in Illinois, Iowa, Kansas, and North Dakota.
Sorghum: Growers intend to plant 7.22 million acres of sorghum for all purposes in 2016, down 15 percent from last
year. Kansas and Texas, the leading sorghum producing States, account for 74 percent of the expected United States
acreage. As of March 20, Texas growers had planted 22 percent of their expected acreage, 16 percentage points ahead of
last year but identical to the five-year average.

Prospective Plantings (March 2016) 31 USDA, National Agricultural Statistics Service
Oats: Area seeded to oats for the 2016 crop year is estimated at 2.75 million acres, down 11 percent from 2015. If
realized, United States planted acres will be the third lowest on record. Record low planted acreage is estimated in
Arkansas, California, Colorado, Idaho, Illinois, Iowa, Oregon, Pennsylvania, Texas, and Wyoming.
Barley: Producers intend to seed 3.14 million acres of barley for the 2016 crop year, down 12 percent from the previous
year. If realized, this will be the fourth smallest seeded area on record. In Montana, the planted area is expected to be up
4 percent from 2015. In North Dakota, planted acreage is expected to decrease by 29 percent from last year.
Winter wheat: The 2016 winter wheat planted area is estimated at 36.2 million acres, down 8 percent from 2015 and
down 1 percent from the previous estimate. States with notable acreage decreases from the previous year are Colorado,
Kansas, Oklahoma, South Dakota, and Texas, while notable increases occurred in the Great Lakes region. Record low
acreage is estimated for Nebraska, New Jersey, and Utah. Of the total acreage, about 26.2 million acres are Hard Red
Winter, 6.60 million acres are Soft Red Winter, and 3.37 million acres are White Winter.
Durum wheat: Area seeded to Durum wheat for 2016 is estimated at 2.00 million acres, up 3 percent from 2015. Planted
acreage is expected to increase in Montana and North Dakota, the two largest Durum-producing States. If realized,
planted acres will tie a record low in South Dakota.
Other spring wheat: Growers intend to plant 11.3 million acres, down 14 percent from 2015. If realized, this will
represent the lowest United States acreage since 1972. Of the total, about 10.7 million acres are Hard Red Spring wheat.
Compared with last year, acreage increases are expected in Idaho, Nevada, Oregon, and Utah. Acreage decreases are
expected in Colorado, Minnesota, Montana, North Dakota, South Dakota, and Washington. If realized, planted acres will
be a record low in Colorado.
Rice: Area planted to rice in 2016 is expected to total 3.06 million acres, up 17 percent from 2015. Lower prices for
competing commodities is contributing to the expected increase in rice acres compared with last year. The expected acres
planted to long grain rice in Arkansas, Louisiana, Mississippi, Missouri, and Texas account for the increase in both long
grain and all rice planted acres. Arkansas, the largest long grain producing State, is expected to increase long grain acres
by 35 percent. Medium and short grain acres are expected to decline by 17 and 16 percent, respectively from 2015.
California, the largest medium and short grain producing State, is expected to increase medium grain acres by 3 percent in
2016.
Hay: Producers intend to harvest 54.3 million acres of all hay in 2016, down slightly from 2015. Harvested area of all hay
is expected to hold steady or decline in all Western States, except Oregon and Utah. Increases in harvested acreage are
expected in many Upper and Middle Mississippi Valley, Tennessee Valley, and Mid-Atlantic States. In the Northeast,
several States expect harvested acreage to remain unchanged from last year.
A record low for all hay harvested area is expected in California, Illinois, Indiana, Michigan, New Hampshire, New York,
Pennsylvania, Vermont, and Wisconsin in 2016.
Soybeans: Growers intend to plant 82.2 million acres in 2016, down less than 1 percent from last year. Compared with
last year, planted acreage intentions are down or unchanged in 23 of the 31 estimating States. Decreases of 200,000 acres
or more are anticipated in Louisiana, Minnesota, and Mississippi. Compared with last year, the largest increase in acreage
is expected in Missouri. If realized, the planted area in North Dakota, Pennsylvania, and Wisconsin will be the largest on
record.
Peanuts: Growers intend to plant 1.48 million acres in 2016, down 9 percent from the previous year. The expected
decrease in planted area is largely driven by price concerns due to the large supply of peanuts. Over the last two years,
growers increased peanut acres in many States due to relatively low prices of other crops creating a large supply going
into the 2016 crop year. In Georgia, the largest peanut-producing State, expected planted area is down 7 percent from
2015.
Sunflower: Growers intend to plant a total of 1.69 million acres in 2016, down 9 percent from last year. If realized,
planted area for the Nation will be the fourth lowest since 1977. Area intended for oil type varieties, at 1.44 million acres,

32 Prospective Plantings (March 2016) USDA, National Agricultural Statistics Service
is down 7 percent from 2015. The area intended for non-oil varieties, estimated at 249,400 acres, is down 19 percent from
last year and will be the lowest since 1987, if realized.
Compared with last year, growers in six of the eight major sunflower-producing States expect a decline in sunflower
acreage this year. Producers in South Dakota, the leading sunflower-producing State, intend to plant 605,000 acres, down
more than 70,000 acres from last year.
Canola: Producers intend to plant 1.75 million acres in 2016, down 2 percent from 2015. Despite the decline, planted area
in the United States will be the third largest on record, if realized. Compared with last year, planted area is expected to
decrease in three of the major canola-producing States, with acreage in Oklahoma expected to decrease 50,000 acres from
the previous year. Producers in North Dakota, the leading canola-producing State, intend to plant 1.45 million acres this
year, an increase of 40,000 acres from 2015.
Flaxseed: Producers intend to plant 390,000 acres of flaxseed in 2016, down 73,000 acres, or 16 percent less than was
planted in 2015. Acreage in North Dakota, the largest flaxseed-producing State, is down 17 percent or 70,000 acres from
the previous year.
Cotton: Growers intend to plant 9.56 million acres in 2016, up 11 percent from last year. Despite the expected increase, if
realized, this will be the seventh lowest planted acreage on record in the United States. Upland area is expected to total
9.35 million acres, up 11 percent from 2015. American Pima area is expected to total 215,000 acres, up 36 percent from
2015.
Growers in all States except North Carolina, South Carolina, and Virginia are expected to increase planted acreage from
last year. If realized, upland cotton planted area in California for 2016 will be a record low.
Sugarbeets: Area expected to be planted to sugarbeets for the 2016 crop year is estimated at 1.16 million acres, virtually
unchanged from 2015. Intended plantings are below the previous year in five of the eleven estimating States and above in
three States.
Tobacco: United States all tobacco area for harvest in 2016 is expected to be 314,450 acres, down 4 percent from 2015.
Flue-cured tobacco, at 209,000 acres, is 4 percent below 2015 and accounts for 66 percent of this year’s total tobacco
acreage. Total light air-cured tobacco type area, at 80,750 acres, is virtually unchanged from 2015. Burley tobacco, at
79,150 acres, is up slightly from last year.
Fire-cured tobacco, at 17,350 acres, is down 2 percent from 2015. Dark air-cured tobacco, at 5,950 acres, is 4 percent
below last year. Cigar filler tobacco, at 1,400 acres is down 13 percent from the previous year.
Spring potatoes: Area planted to spring potatoes is expected to be 55,000 acres for the 2016 season, down 22 percent
from 2015. Beginning with the 2016 season, Arizona was removed from the spring potato estimating program, and
North Carolina was moved to the summer potato estimating program.
Sweet potatoes: Planted area of sweet potatoes in 2016 is expected to be 169,400 acres, up 8 percent from the previous
year. January ending temperatures were above the norm in Mississippi. Rainy conditions during February and March
either halted any field preparation, or made it sporadic at best. North Carolina’s February topsoil moisture was rated
46 percent adequate and 54 percent surplus making it difficult to progress with field preparation.
Dry beans: Area planted to dry beans in 2016 is expected to be 1.56 million acres, down 12 percent from the previous
season. Expected area planted for all chickpeas is 246,000 acres, up 19 percent from last season. Small chickpeas, at
83,000 acres, is 15 percent above 2015, while large chickpeas, at 163,000 acres, increased 20 percent from the previous
year. If realized, both small and all chickpea acreage will be a record high. Strong prices and demand have encouraged
farmers to increase chickpea area.
Six of the 11 estimating States expect a decrease in planted acres from last year. The top four producing States in 2015,
which included Michigan, Minnesota, Nebraska, and North Dakota, are expecting lower acreage than a year ago.

Prospective Plantings (March 2016) 33 USDA, National Agricultural Statistics Service
Lentils: Area planted for the 2016 crop year is expected to total 850,000 acres, up 72 percent from 2015. Prospective
plantings are up in all program States which includes Idaho, Montana, North Dakota, and Washington. Montana’s
anticipated area is up 113 percent from 2015, while North Dakota growers expect to plant 45 percent more acres than a
year ago. If realized, planted acreage will be record high in Montana and the United States. Strong prices and demand
have been reported.
Dry edible peas: Area planted for the 2016 crop year is expected to total 1.42 million acres, up 24 percent from 2015. If
realized, this will be a record high planted area. Prospective plantings are up in North Dakota and Oregon, but down in
Idaho, Montana, and Washington. If realized, North Dakota’s expected planted area, at 640,000 acres, will be a record
high. Nebraska and South Dakota were added to the estimating program this year.
Austrian winter peas: Intended planted area for 2016 is estimated at 31,000 acres, down 9 percent from 2015. Growers
in Idaho indicated an acreage increase, while Montana farmers anticipate lower plantings from a year ago. No planted
acreage change is anticipated in Oregon.

34 Prospective Plantings (March 2016) USDA, National Agricultural Statistics Service
Statistical Methodology Survey Procedures: The acreage estimates in this report are based primarily on surveys conducted during the first two
weeks of March. The March Agricultural Survey is a probability survey that includes a sample of over 83,000 farm
operators selected from a list of producers that ensures all operations in the United States have a chance to be selected.
These operators were contacted by mail, internet, telephone, or personal interview to obtain information on crop acreage
intentions for the 2016 crop year.
Estimating Procedures: National, Regional, State, and grower reported data were reviewed for reasonableness and
consistency with historical estimates. Each Regional Field Office submits their analysis of the current situation to the
Agricultural Statistics Board (ASB). Survey data are compiled to the National level and are reviewed at this level
independently of each State's review. Acreage estimates were based on survey data and the historical relationship of
official estimates to the survey data.
Revision Policy: Acreage estimates in the Prospective Plantings report will not be revised. These estimates are intended
to reflect grower intentions as of the survey period. New acreage estimates will be made based on surveys conducted in
June when crop acreages have been established or planting intentions are firm. These new estimates will be published in
the Acreage report scheduled for June 30, 2016. Winter wheat is an exception. Since winter wheat was seeded prior to the
March survey, any changes in estimates in this report are considered revisions. The estimate of the harvested acreage of
winter wheat will be published on May 10, 2016, along with the first production forecast of the crop year.
Reliability: The survey used to make acreage estimates is subject to sampling and non-sampling errors that are common
to all surveys. Sampling errors represent the variability between estimates that would result if many different samples
were surveyed at the same time. Sampling errors for major crops are generally between 1.0 and 3.0 percent, but they
cannot be applied directly to the acreage published in this report to determine confidence intervals because the official
estimates represent a composite of information from more than a single source.
Non-sampling errors cannot be measured directly. They may occur due to incorrect reporting and/or recording, data
omissions or duplications, and errors in processing. To minimize non-sampling errors, vigorous quality controls are used
in the data collection process and all data are carefully reviewed for consistency and reasonableness.
To assist users in evaluating the reliability of acreage estimates in this report, the "Root Mean Square Error," a statistical
measure based on past performance, is computed. The deviations between the acreage estimates in this report and the final
estimates are expressed as a percentage of the final estimates. The average of squared percentage deviations for the latest
20 year period is computed. The square root of the average becomes statistically the "Root Mean Square Error."
Probability statements can be made concerning expected differences in the current estimates relative to the final end of
season estimates, assuming that factors affecting this year's estimates are not different from those influencing recent years.
For example, the "Root Mean Square Error" for the corn planted estimate is 1.5 percent. This means that chances are 2 out
of 3 that the current corn acreage estimate will not be above or below the final estimate by more than 1.5 percent. Chances
are 9 out of 10 (90 percent confidence level) that the difference will not exceed 2.6 percent.
Also, shown in the following table is a 20 year record for selected crops of the difference between the
Prospective Plantings planted acreage estimates and the final estimates. Using corn again as an example, changes between
the intentions estimates and the final estimates during the past 20 years have averaged 1.04 million acres, ranging from
32,000 acres to 3.07 million acres. The prospective plantings estimates have been below the final estimate 7 times and
above 13 times. This does not imply that the planted estimate this year is likely to understate or overstate the final
estimate.

Prospective Plantings (March 2016) 35 USDA, National Agricultural Statistics Service
Reliability of Prospective Plantings Planted Acreage Estimates [Based on data for the past twenty years]
Crop Root mean square error
90 percent confidence
interval
Difference between forecast and final estimate
Thousand acres Years
Average Smallest Largest Below final
Above final
(percent) (percent) (1,000 acres) (1,000 acres) (1,000 acres) (number) (number)
Barley .......................................... Corn for grain ............................... Oats ............................................. Sorghum for grain ........................ Soybeans for beans ..................... Upland cotton .............................. Wheat Winter wheat .............................. Durum wheat ............................. Other spring ...............................
7.1 1.5 7.0 9.4 2.1 6.4
1.8
20.5 6.4
12.3 2.6
12.1 16.2 3.6
11.0
3.0 35.4 11.0
234 1,042
189 655
1,290 620
592 241 709
31 32 21 31 25 6
52 15 12
455 3,073
660 2,471 3,296 2,115
1,290 1,028 2,543
5 7 3
13 10 11
7
12 10
15 13 17 7
10 9
13 8
10

36 Prospective Plantings (March 2016) USDA, National Agricultural Statistics Service
USDA, National Agricultural Statistics Service Information Contacts
Listed below are the commodity statisticians in the Crops Branch of the National Agricultural Statistics Service to contact
for additional information. E-mail inquiries may be sent to [email protected]
Lance Honig, Chief, Crops Branch ....................................................................................................... (202) 720-2127
Anthony Prillaman, Head, Field Crops Section .................................................................................... (202) 720-2127
Angie Considine – Cotton, Cotton Ginnings, Sorghum ................................................................... (202) 720-5944
Tony Dahlman – Oats, Soybeans ..................................................................................................... (202) 690-3234
Chris Hawthorn – Corn, Flaxseed, Proso Millet .............................................................................. (202) 720-9526
James Johanson – County Estimates, Hay ....................................................................................... (202) 690-8533
Scott Matthews – Crop Weather, Barley .......................................................................................... (202) 720-7621
Jean Porter – Rye, Wheat ................................................................................................................. (202) 720-8068
Bianca Pruneda – Peanuts, Rice ....................................................................................................... (202) 720-7688
Travis Thorson – Sunflower, Other Oilseeds ................................................................................... (202) 720-7369
Jorge Garcia-Pratts, Head, Fruits, Vegetables and Special Crops Section ............................................ (202) 720-2127
Vincent Davis – Fresh and Processing Vegetables, Onions, Strawberries,
Sugarbeets, Sugarcane, Cherries ................................................................................................ (202) 720-2157
Fleming Gibson – Citrus, Coffee, Tropical Fruits ............................................................................ (202) 720-5412
Greg Lemmons – Berries, Cranberries, Potatoes, Sweet Potatoes .................................................. (202) 720-4285
Dave Losh – Hops ............................................................................................................................ (360) 709-2400
Dan Norris – Austrian Winter Peas, Dry Edible Peas, Lentils, Mint,
Mushrooms, Peaches, Pears, Wrinkled Seed Peas, Dry Beans .................................................. (202) 720-3250
Daphne Schauber – Floriculture, Grapes, Maple Syrup, Nursery, Tree Nuts ................................. (202) 720-4215
Chris Singh – Apples, Apricots, Plums, Prunes, Tobacco .............................................................. (202) 720-4288

Access to NASS Reports For your convenience, you may access NASS reports and products the following ways:
All reports are available electronically, at no cost, on the NASS web site: http://www.nass.usda.gov
Both national and state specific reports are available via a free e-mail subscription. To set-up this free
subscription, visit http://www.nass.usda.gov and click on “National” or “State” in upper right corner above
“search” box to create an account and select the reports you would like to receive.
For more information on NASS surveys and reports, call the NASS Agricultural Statistics Hotline at (800) 727-9540,
7:30 a.m. to 4:00 p.m. ET, or e-mail: [email protected].
The U.S. Department of Agriculture (USDA) prohibits discrimination against its customers, employees, and applicants for
employment on the basis of race, color, national origin, age, disability, sex, gender identity, religion, reprisal, and where
applicable, political beliefs, marital status, familial or parental status, sexual orientation, or all or part of an individual's
income is derived from any public assistance program, or protected genetic information in employment or in any program
or activity conducted or funded by the Department. (Not all prohibited bases will apply to all programs and/or
employment activities.)
If you wish to file a Civil Rights program complaint of discrimination, complete the USDA Program Discrimination
Complaint Form (PDF), found online at http://www.ascr.usda.gov/complaint_filing_cust.html, or at any USDA office, or
call (866) 632-9992 to request the form. You may also write a letter containing all of the information requested in the
form. Send your completed complaint form or letter to us by mail at U.S. Department of Agriculture, Director, Office of
Adjudication, 1400 Independence Avenue, S.W., Washington, D.C. 20250-9410, by fax (202) 690-7442 or email at