full research report - old mutual
TRANSCRIPT

Old Mutual Savings & Investment Monitor
Covid-19 Special report 2020
Full Research Report
Peppercorn Research
July 2020
1 | P a g e
Contents
1. Recap of the Findings of the Measure 14 (July 2019) Results 1
2. Overview of the 2020 Covid 19 Special Edition Results 3
3. Sample and Methodology 4
4. Sandwich Generation and Dependency Issues 6
5. Working Life 9
6. Impact of Covid 19 Pandemic on Income Levels 10
7. Perceptions of Current Financial Situation & Future Outlook 12
8. Informal Savings 16
9. Use of Education Policies 18
10. Debt & Credit 19
11. Coping Mechanisms 21
12. Anticipated Shifts in Spending Patterns 23
13. Greatest Fears and Concerns around Covid 19 27
14. Seeing a Silver Lining? 30
15. Faith in the Government and the South African Economy 32
1 | P a g e
1. Recap of Main Findings from Measure 14 (July 2019)
The 2019 results were set against an already weakening economic backdrop.
South Africa’s unemployment rate increased to 27.6 percent in the first quarter of 2019 and with further large-
scale retrenchments taking place later in the year. Whilst our Saving & Investment Monitor sample focusses
on working people that does not mean that they were not affected. On the contrary, breadwinners were
increasingly looked to by non-working family for financial assistance, as was borne out in the increasing %
supporting adult dependents with the knock-on increase of those who find themselves part of the Sandwich
Generation – with 2019 recording the highest level since the inception of this study in 2009.
On the political front, much of the Ramaphoria felt in early 2018 had died down. Whilst President
Ramaphosa delivered his inauguration speech to jubilant South Africans in May 2019, subsequent cabinet
appointments made it clear that whilst many of those accused of maladministration and corruption were
dropped, internal power plays meant that a completely clean sweep was not possible. Be that as it may,
the belt tightening evident in the cabinet restructure (including cutting down the number of ministries from
36 to 28) was appreciated.
Negative public sentiment towards corruption, maladministration and sheer wastage of public funds
continued to run high. As the Zondo commission of enquiry into state capture, together with evidence from
the PIC inquiry reported eye-watering accounts of excess and blatant theft, so the negative sentiment
continued to grow.
It was of little comfort to say that we were not alone in facing both economic and political challenges. The
significant rise in trade tensions (in particular as between the Trump administration and China) did not bode
well (for emerging economies in particular). Similarly, the continued uncertainty around Brexit was not
conducive to growth.
The 2019 results saw continued belt-tightening and noted the extent to which some households had already
cut down as much as they can. Those categories that were most sticky or resilient to change were those
that are practically difficult to change (accommodation costs, cost of getting to work) or emotionally
difficult to cut (education, assistance to dependents) or else deemed essentials (car insurance, security,
medical aid).
In order to cope, households were increasingly looking to loans from family and friends or financial institutions
to make ends meet.
Despite this trend (or in conjunction with it), we did see attempts to pay down debt quicker, especially true
of higher-earning households in relation to store account debt and credit cards. However, a closer look at
store cards and credit card usage patterns revealed reliance on these to fund day-to-day purchases like
2 | P a g e
groceries rather than this credit being reserved for the purchase of large ticket items or to finance
emergencies.
There was a decrease in saving for emergencies with buffer savings increasingly becoming a luxury.
Confidence in financial decision-making deteriorated further with significant pockets unsure where to turn
for advice.
On a positive note, claimed confidence in the South African economy improved further in 2019. We noted
then that time would tell if that optimism was to be rewarded.
It seems a long time ago. Who could have imagined what lay ahead?
3 | P a g e
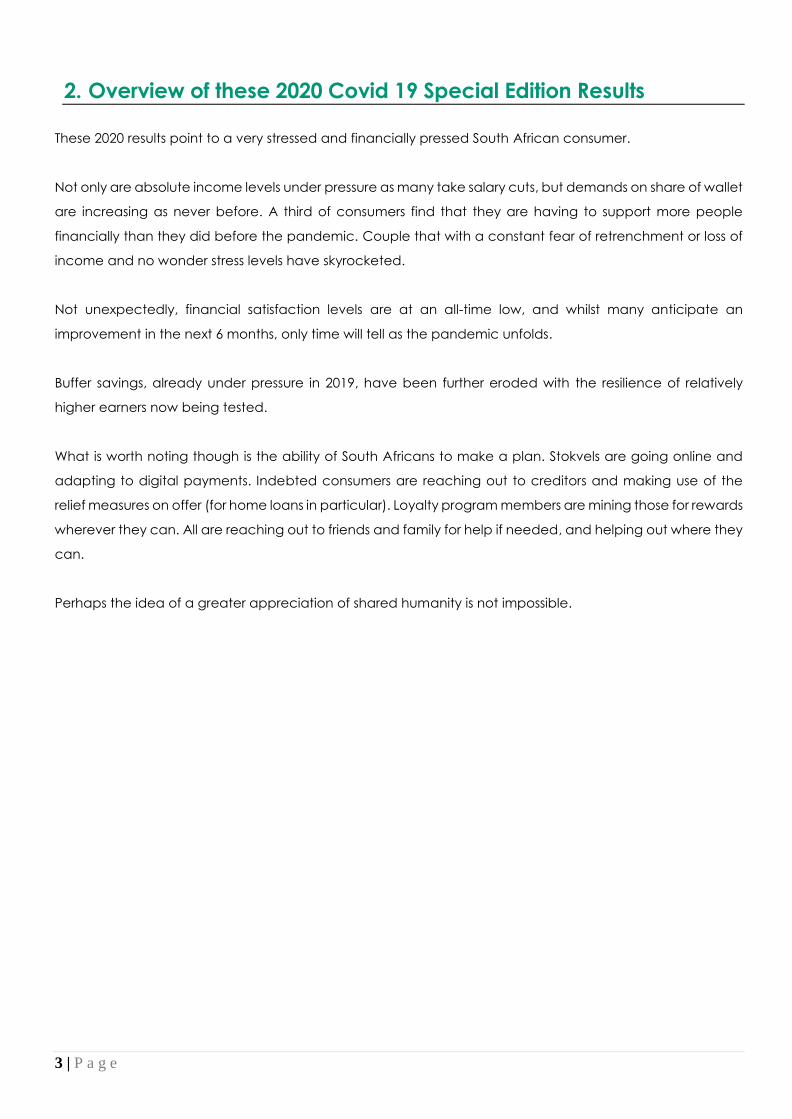
2. Overview of these 2020 Covid 19 Special Edition Results
These 2020 results point to a very stressed and financially pressed South African consumer.
Not only are absolute income levels under pressure as many take salary cuts, but demands on share of wallet
are increasing as never before. A third of consumers find that they are having to support more people
financially than they did before the pandemic. Couple that with a constant fear of retrenchment or loss of
income and no wonder stress levels have skyrocketed.
Not unexpectedly, financial satisfaction levels are at an all-time low, and whilst many anticipate an
improvement in the next 6 months, only time will tell as the pandemic unfolds.
Buffer savings, already under pressure in 2019, have been further eroded with the resilience of relatively
higher earners now being tested.
What is worth noting though is the ability of South Africans to make a plan. Stokvels are going online and
adapting to digital payments. Indebted consumers are reaching out to creditors and making use of the
relief measures on offer (for home loans in particular). Loyalty program members are mining those for rewards
wherever they can. All are reaching out to friends and family for help if needed, and helping out where they
can.
Perhaps the idea of a greater appreciation of shared humanity is not impossible.
4 | P a g e
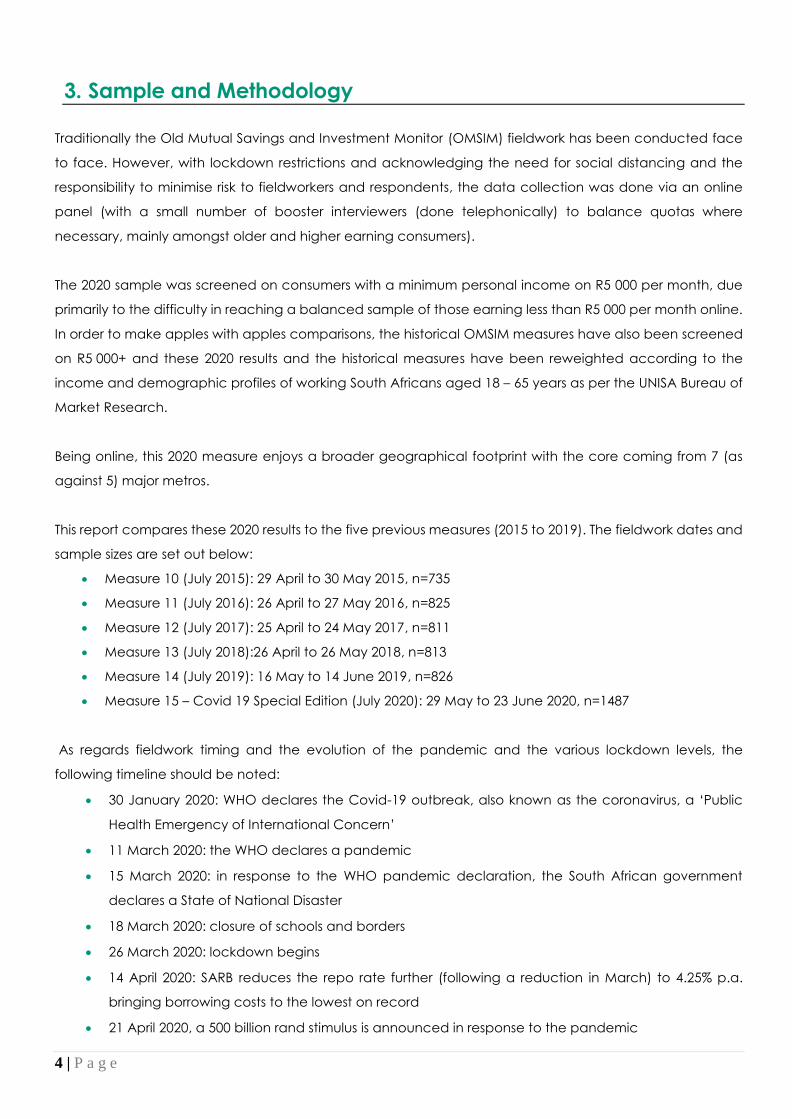
3. Sample and Methodology
Traditionally the Old Mutual Savings and Investment Monitor (OMSIM) fieldwork has been conducted face
to face. However, with lockdown restrictions and acknowledging the need for social distancing and the
responsibility to minimise risk to fieldworkers and respondents, the data collection was done via an online
panel (with a small number of booster interviewers (done telephonically) to balance quotas where
necessary, mainly amongst older and higher earning consumers).
The 2020 sample was screened on consumers with a minimum personal income on R5 000 per month, due
primarily to the difficulty in reaching a balanced sample of those earning less than R5 000 per month online.
In order to make apples with apples comparisons, the historical OMSIM measures have also been screened
on R5 000+ and these 2020 results and the historical measures have been reweighted according to the
income and demographic profiles of working South Africans aged 18 – 65 years as per the UNISA Bureau of
Market Research.
Being online, this 2020 measure enjoys a broader geographical footprint with the core coming from 7 (as
against 5) major metros.
This report compares these 2020 results to the five previous measures (2015 to 2019). The fieldwork dates and
sample sizes are set out below:
Measure 10 (July 2015): 29 April to 30 May 2015, n=735
Measure 11 (July 2016): 26 April to 27 May 2016, n=825
Measure 12 (July 2017): 25 April to 24 May 2017, n=811
Measure 13 (July 2018):26 April to 26 May 2018, n=813
Measure 14 (July 2019): 16 May to 14 June 2019, n=826
Measure 15 – Covid 19 Special Edition (July 2020): 29 May to 23 June 2020, n=1487
As regards fieldwork timing and the evolution of the pandemic and the various lockdown levels, the
following timeline should be noted:
30 January 2020: WHO declares the Covid-19 outbreak, also known as the coronavirus, a ‘Public
Health Emergency of International Concern’
11 March 2020: the WHO declares a pandemic
15 March 2020: in response to the WHO pandemic declaration, the South African government
declares a State of National Disaster
18 March 2020: closure of schools and borders
26 March 2020: lockdown begins
14 April 2020: SARB reduces the repo rate further (following a reduction in March) to 4.25% p.a.
bringing borrowing costs to the lowest on record
21 April 2020, a 500 billion rand stimulus is announced in response to the pandemic

5 | P a g e
1 May 2020: President Ramaphosa announces that from 1 May 2020, a gradual and phased easing
of the lockdown restrictions will begin, lowering the national alert level to 4.
1 June 2020: national restrictions were lowered to level 3.
Sample details are set out below. Note that age, personal income, gender and population group were all
quota controlled.
2015 2016 2017 2018 2019 2020
Personal Monthly Income
R5 000 to R11 999 46% 46% 45% 44% 43% 42%
R12 000 to R19 999 21% 22% 22% 22% 22% 22%
R20 000+ 33% 33% 33% 33% 35% 33%
Age
18-29 Years 20% 20% 20% 19% 19% 18%
30-49 Years 60% 60% 61% 62% 63% 63%
50+ Years 20% 19% 19% 19% 18% 19%
Gender
Male 63% 62% 62% 62% 63% 59%
Female 37% 38% 38% 38% 37% 41%
Population Group
African 62% 64% 66% 67% 68% 65%
Coloured 12% 13% 12% 12% 13% 12%
Indian/Asian 5% 5% 5% 5% 5% 7%
White 20% 18% 17% 16% 15% 16%
6 | P a g e
4. Sandwich Generation and Dependency Issues
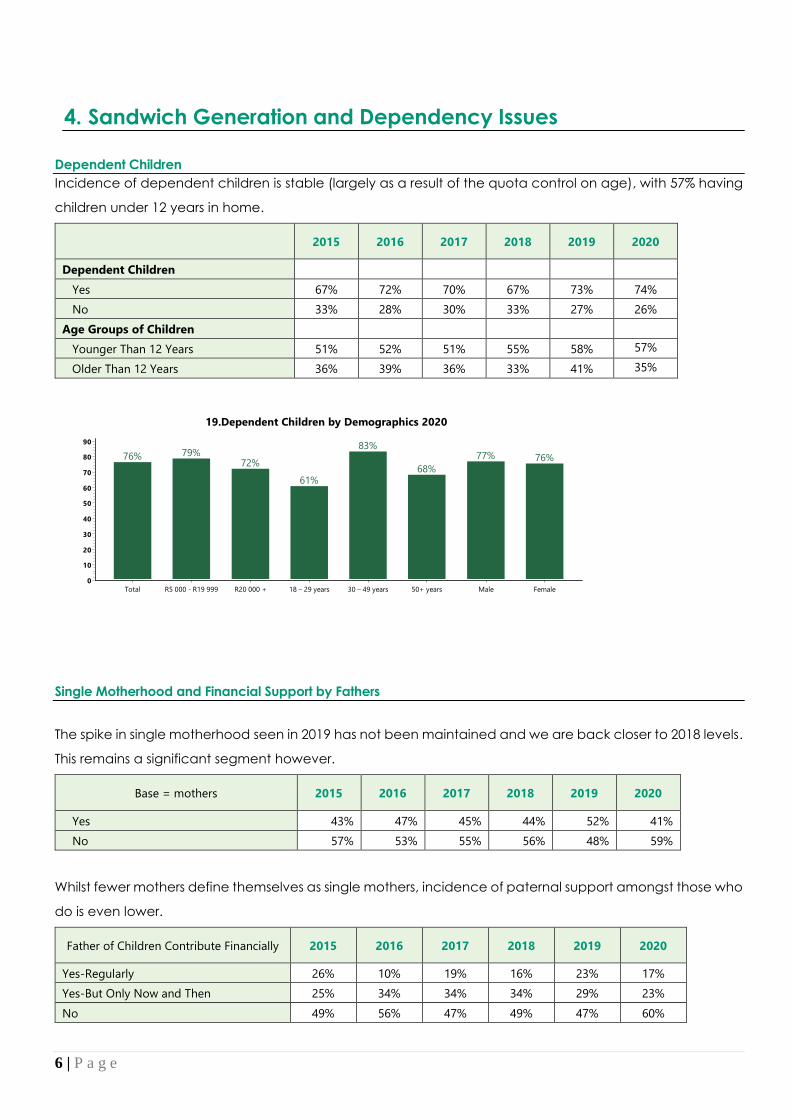
Dependent Children Incidence of dependent children is stable (largely as a result of the quota control on age), with 57% having
children under 12 years in home.
2015 2016 2017 2018 2019 2020
Dependent Children
Yes 67% 72% 70% 67% 73% 74%
No 33% 28% 30% 33% 27% 26%
Age Groups of Children
Younger Than 12 Years 51% 52% 51% 55% 58% 57%
Older Than 12 Years 36% 39% 36% 33% 41% 35%
Single Motherhood and Financial Support by Fathers
The spike in single motherhood seen in 2019 has not been maintained and we are back closer to 2018 levels.
This remains a significant segment however.
Base = mothers 2015 2016 2017 2018 2019 2020
Yes 43% 47% 45% 44% 52% 41%
No 57% 53% 55% 56% 48% 59%
Whilst fewer mothers define themselves as single mothers, incidence of paternal support amongst those who
do is even lower.
Father of Children Contribute Financially 2015 2016 2017 2018 2019 2020
Yes-Regularly 26% 10% 19% 16% 23% 17%
Yes-But Only Now and Then 25% 34% 34% 34% 29% 23%
No 49% 56% 47% 49% 47% 60%
19.Dependent Children by Demographics 2020Old Mutual Covid 19 Database
Base - RMM or PF (Segments)
Demographics 2020
Total R5 000 - R19 999 R20 000 + 18 – 29 years 30 – 49 years 50+ years Male Female
%
90
80
70
60
50
40
30
20
10
0
76% 79%72%
61%
83%
68%
77% 76%

7 | P a g e
Other Dependents (Other Than Children)
2019 saw an uptick in adult dependents and 2020 sees another, even sharper increase, with incidence being
slightly higher amongst lower income earners.
2015 2016 2017 2018 2019 2020
Have adult dependents 35% 38% 36% 39% 43% 52%
Sandwich Generation
The term ‘Sandwich Generation’ has been coined to describe those who are supporting not only children
but also parents and / or other older dependents. 2019 saw a significant increase to 34% and 2020 this has
increased again to 42%. This is the highest level recorded since the inception of The Old Mutual Savings &
Investment Monitor.
2015 2016 2017 2018 2019 2020
Sandwich Generation 27% 31% 28% 31% 34% 42%
23.Adult Dependents by Demographics 2020Old Mutual Covid 19 Database
Base - RMM or PF (Segments)
Demographics 2020
Total R5 000 - R19 999 R20 000 + 18 – 29 years 30 – 49 years 50+ years Male Female
%
60
55
50
45
40
35
30
25
20
15
10
5
0
52% 54%
48%
57%54%
41%
53%50%
Sandwich Generation by Demographics 2020Old Mutual Covid 19 Database
Base - RMM or PF (Segments)
Demographics 2020
Total R5 000 - R19 999 R20 000 + 18 – 29 years 30 – 49 years 50+ years Male Female
%
50
45
40
35
30
25
20
15
10
5
0
42%44%
39% 40%
47%
31%
44%40%
8 | P a g e
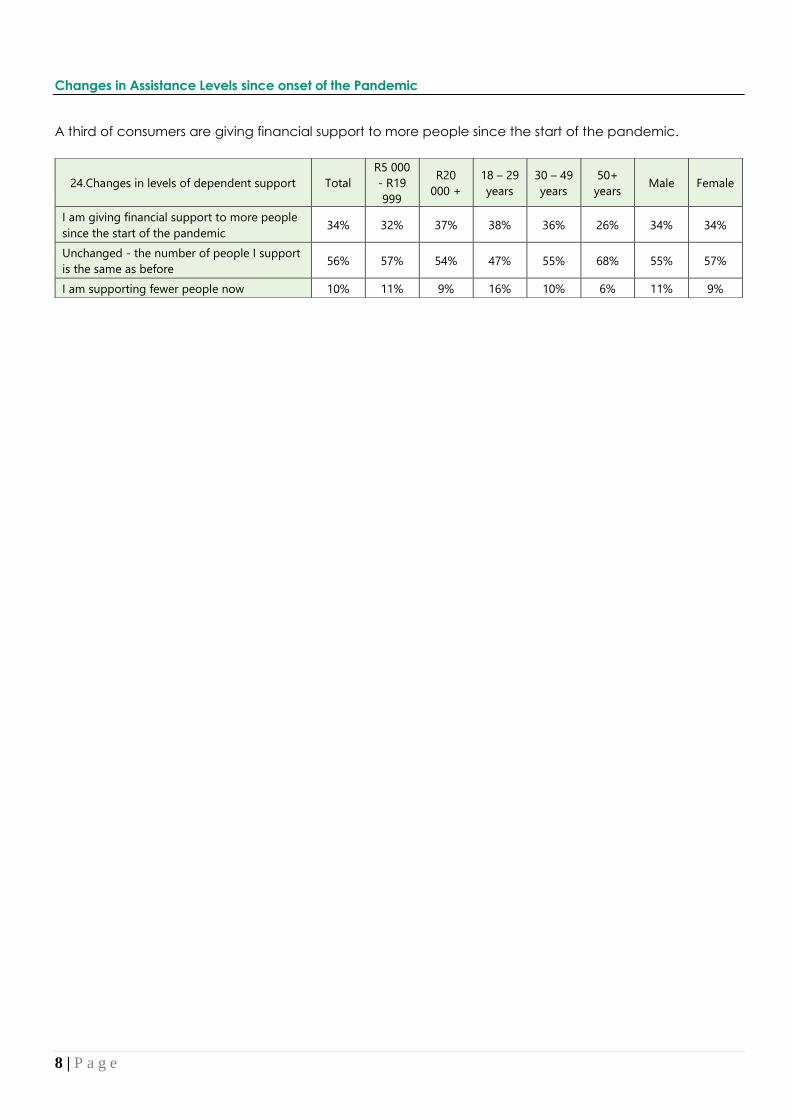
Changes in Assistance Levels since onset of the Pandemic
A third of consumers are giving financial support to more people since the start of the pandemic.
24.Changes in levels of dependent support Total
R5 000
- R19
999
R20
000 +
18 – 29
years
30 – 49
years
50+
years Male Female
I am giving financial support to more people
since the start of the pandemic 34% 32% 37% 38% 36% 26% 34% 34%
Unchanged - the number of people I support
is the same as before 56% 57% 54% 47% 55% 68% 55% 57%
I am supporting fewer people now 10% 11% 9% 16% 10% 6% 11% 9%
9 | P a g e
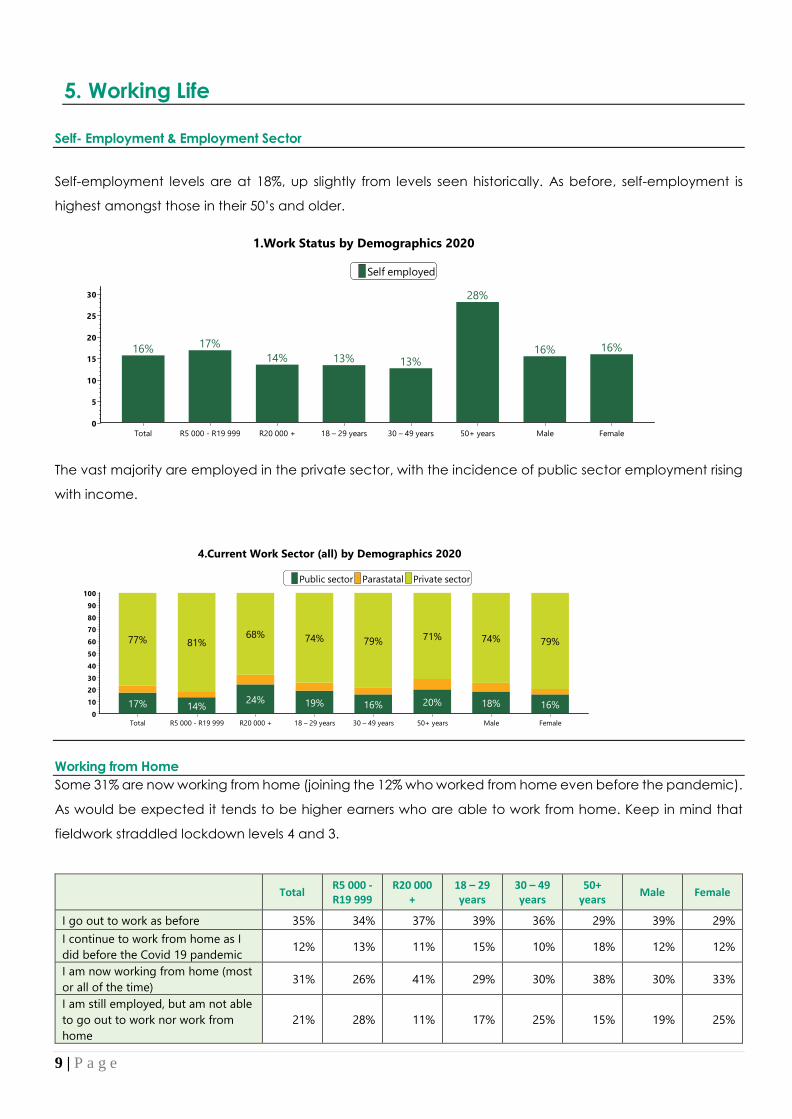
5. Working Life
Self- Employment & Employment Sector
Self-employment levels are at 18%, up slightly from levels seen historically. As before, self-employment is
highest amongst those in their 50’s and older.
The vast majority are employed in the private sector, with the incidence of public sector employment rising
with income.
Working from Home
Some 31% are now working from home (joining the 12% who worked from home even before the pandemic).
As would be expected it tends to be higher earners who are able to work from home. Keep in mind that
fieldwork straddled lockdown levels 4 and 3.
Total R5 000 - R19 999
R20 000 +
18 – 29 years
30 – 49 years
50+ years
Male Female
I go out to work as before 35% 34% 37% 39% 36% 29% 39% 29%
I continue to work from home as I
did before the Covid 19 pandemic 12% 13% 11% 15% 10% 18% 12% 12%
I am now working from home (most
or all of the time) 31% 26% 41% 29% 30% 38% 30% 33%
I am still employed, but am not able
to go out to work nor work from
home
21% 28% 11% 17% 25% 15% 19% 25%
1.Work Status by Demographics 2020Old Mutual Covid 19 Database
Base - RMM or PF (Segments)
1.Work Status Self employed
16% Total17% R5 000 - R19 99914% R20 000 +13% 18 – 29 years13% 30 – 49 years28% 50+ years16% Male16% Female
Demographics 2020
Total R5 000 - R19 999 R20 000 + 18 – 29 years 30 – 49 years 50+ years Male Female
%
30
25
20
15
10
5
0
16% 17%
14% 13% 13%
28%
16% 16%
4.Current Work Sector (all) by Demographics 2020Old Mutual Covid 19 Database
Base - RMM or PF (Segments)
4.Current Work Sector (all) Public sector Parastatal Private sector
Public sectorParastatalPrivate sector
Demographics 2020
Total R5 000 - R19 999 R20 000 + 18 – 29 years 30 – 49 years 50+ years Male Female
%
100
90
80
70
60
50
40
30
20
10
0
17% 14%24% 19% 16% 20% 18% 16%
77% 81%68% 74% 79% 71% 74% 79%
10 | P a g e
6. Impact of Covid 19 Pandemic on Income Levels
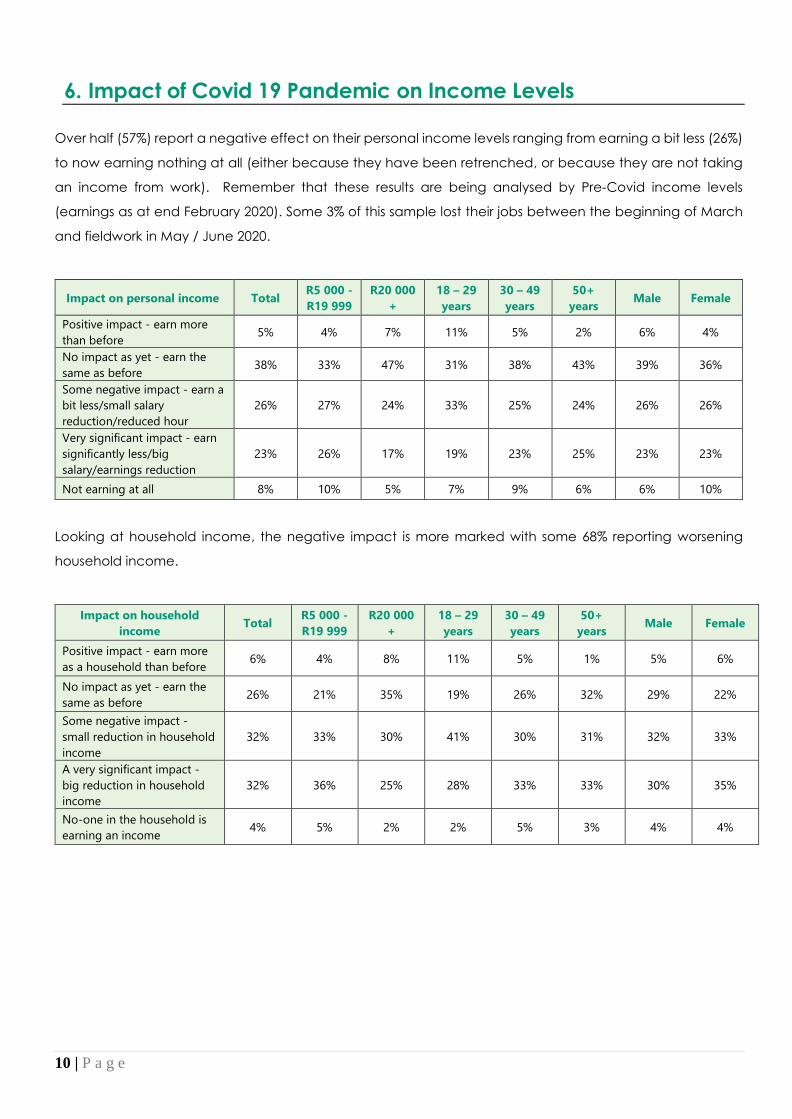
Over half (57%) report a negative effect on their personal income levels ranging from earning a bit less (26%)
to now earning nothing at all (either because they have been retrenched, or because they are not taking
an income from work). Remember that these results are being analysed by Pre-Covid income levels
(earnings as at end February 2020). Some 3% of this sample lost their jobs between the beginning of March
and fieldwork in May / June 2020.
Impact on personal income Total R5 000 -
R19 999
R20 000
+
18 – 29
years
30 – 49
years
50+
years Male Female
Positive impact - earn more
than before 5% 4% 7% 11% 5% 2% 6% 4%
No impact as yet - earn the
same as before 38% 33% 47% 31% 38% 43% 39% 36%
Some negative impact - earn a
bit less/small salary
reduction/reduced hour
26% 27% 24% 33% 25% 24% 26% 26%
Very significant impact - earn
significantly less/big
salary/earnings reduction
23% 26% 17% 19% 23% 25% 23% 23%
Not earning at all 8% 10% 5% 7% 9% 6% 6% 10%
Looking at household income, the negative impact is more marked with some 68% reporting worsening
household income.
Impact on household
income Total
R5 000 -
R19 999
R20 000
+
18 – 29
years
30 – 49
years
50+
years Male Female
Positive impact - earn more
as a household than before 6% 4% 8% 11% 5% 1% 5% 6%
No impact as yet - earn the
same as before 26% 21% 35% 19% 26% 32% 29% 22%
Some negative impact -
small reduction in household
income
32% 33% 30% 41% 30% 31% 32% 33%
A very significant impact -
big reduction in household
income
32% 36% 25% 28% 33% 33% 30% 35%
No-one in the household is
earning an income 4% 5% 2% 2% 5% 3% 4% 4%
11 | P a g e
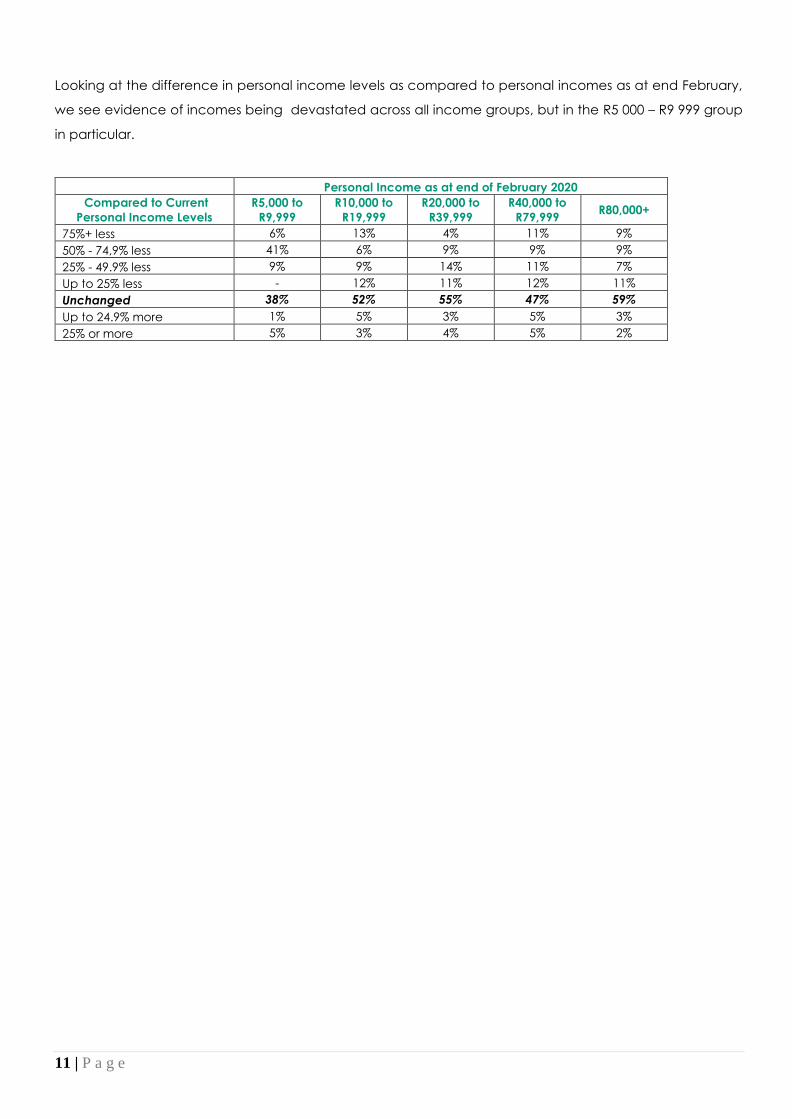
Looking at the difference in personal income levels as compared to personal incomes as at end February,
we see evidence of incomes being devastated across all income groups, but in the R5 000 – R9 999 group
in particular.
Personal Income as at end of February 2020
Compared to Current
Personal Income Levels
R5,000 to
R9,999
R10,000 to
R19,999
R20,000 to
R39,999
R40,000 to
R79,999 R80,000+
75%+ less 6% 13% 4% 11% 9%
50% - 74,9% less 41% 6% 9% 9% 9%
25% - 49.9% less 9% 9% 14% 11% 7%
Up to 25% less - 12% 11% 12% 11%
Unchanged 38% 52% 55% 47% 59%
Up to 24.9% more 1% 5% 3% 5% 3%
25% or more 5% 3% 4% 5% 2%
12 | P a g e
7. Perceptions of Current Financial Situation & Future Outlook
Satisfaction with Current Financial Situation
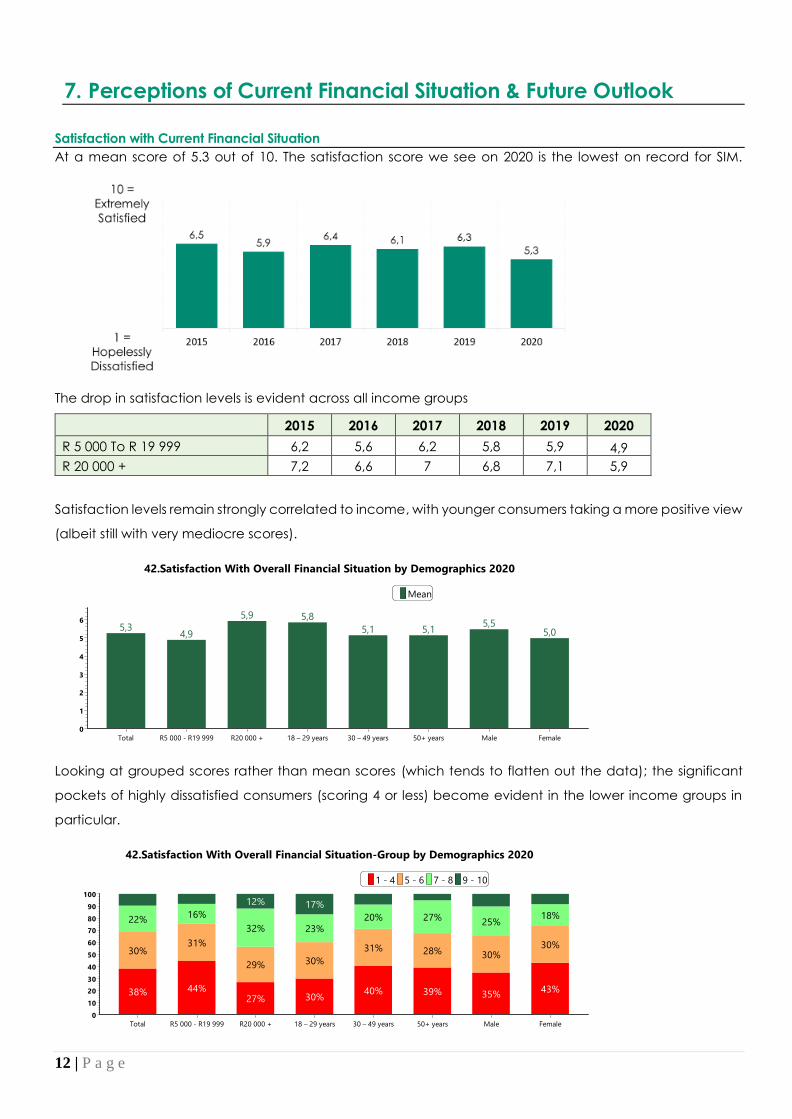
At a mean score of 5.3 out of 10. The satisfaction score we see on 2020 is the lowest on record for SIM.
The drop in satisfaction levels is evident across all income groups
2015 2016 2017 2018 2019 2020
R 5 000 To R 19 999 6,2 5,6 6,2 5,8 5,9 4,9
R 20 000 + 7,2 6,6 7 6,8 7,1 5,9
Satisfaction levels remain strongly correlated to income, with younger consumers taking a more positive view
(albeit still with very mediocre scores).
Looking at grouped scores rather than mean scores (which tends to flatten out the data); the significant
pockets of highly dissatisfied consumers (scoring 4 or less) become evident in the lower income groups in
particular.
42.Satisfaction With Overall Financial Situation by Demographics 2020Old Mutual Covid 19 Database
Base - RMM or PF (Segments)
42.Satisfaction With Overall Financial Situation Mean
5 Total5 R5 000 - R19 9996 R20 000 +6 18 – 29 years5 30 – 49 years5 50+ years5 Male5 Female
Demographics 2020
Total R5 000 - R19 999 R20 000 + 18 – 29 years 30 – 49 years 50+ years Male Female
6
5
4
3
2
1
0
5,34,9
5,9 5,8
5,1 5,15,5
5,0
42.Satisfaction With Overall Financial Situation-Group by Demographics 2020Old Mutual Covid 19 Database
Base - RMM or PF (Segments)
42.Satisfaction With Overall Financial Situation-Group 1 - 4 5 - 6 7 - 8 9 - 10
1 - 45 - 67 - 89 - 10
Demographics 2020
Total R5 000 - R19 999 R20 000 + 18 – 29 years 30 – 49 years 50+ years Male Female
%
100
90
80
70
60
50
40
30
20
10
0
38% 44%27% 30%
40% 39% 35%43%
30%31%
29% 30%
31% 28% 30%30%
22%16%
32% 23%
20% 27%25%
18%
12% 17%
13 | P a g e
Financial Situation Compared to a Year Ago
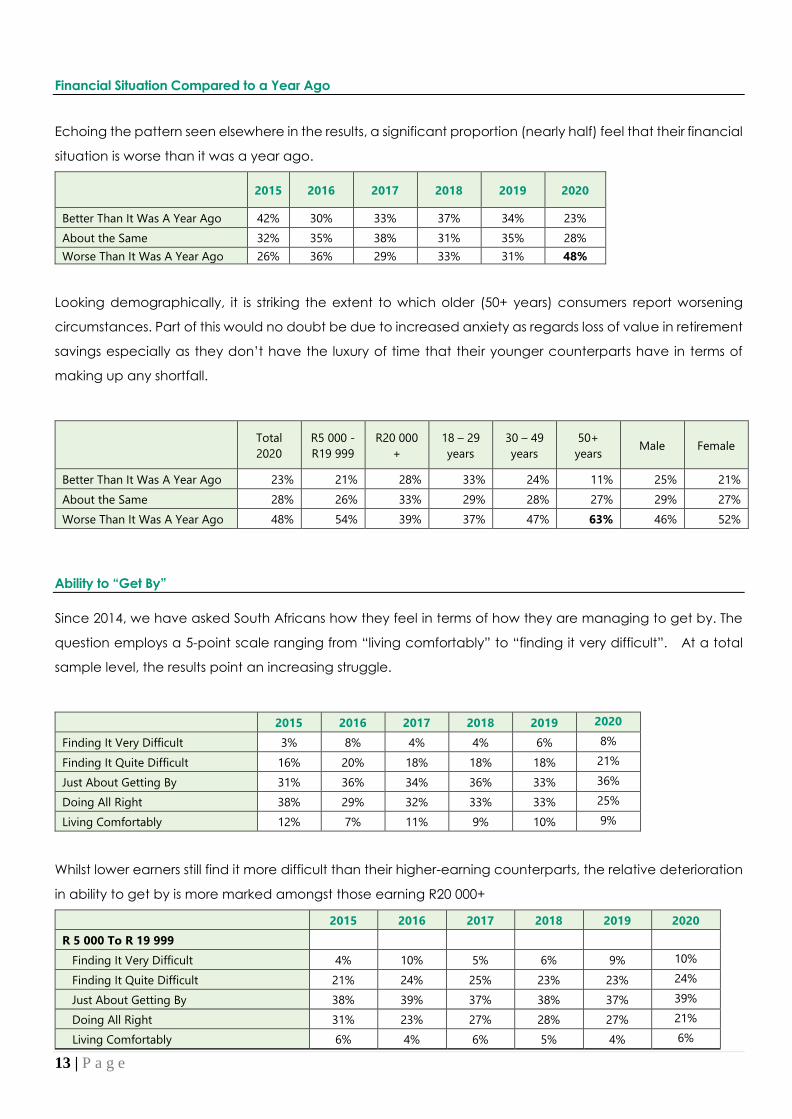
Echoing the pattern seen elsewhere in the results, a significant proportion (nearly half) feel that their financial
situation is worse than it was a year ago.
2015 2016 2017 2018 2019 2020
Better Than It Was A Year Ago 42% 30% 33% 37% 34% 23%
About the Same 32% 35% 38% 31% 35% 28%
Worse Than It Was A Year Ago 26% 36% 29% 33% 31% 48%
Looking demographically, it is striking the extent to which older (50+ years) consumers report worsening
circumstances. Part of this would no doubt be due to increased anxiety as regards loss of value in retirement
savings especially as they don’t have the luxury of time that their younger counterparts have in terms of
making up any shortfall.
Total
2020
R5 000 -
R19 999
R20 000
+
18 – 29
years
30 – 49
years
50+
years Male Female
Better Than It Was A Year Ago 23% 21% 28% 33% 24% 11% 25% 21%
About the Same 28% 26% 33% 29% 28% 27% 29% 27%
Worse Than It Was A Year Ago 48% 54% 39% 37% 47% 63% 46% 52%
Ability to “Get By”
Since 2014, we have asked South Africans how they feel in terms of how they are managing to get by. The
question employs a 5-point scale ranging from “living comfortably” to “finding it very difficult”. At a total
sample level, the results point an increasing struggle.
2015 2016 2017 2018 2019 2020
Finding It Very Difficult 3% 8% 4% 4% 6% 8%
Finding It Quite Difficult 16% 20% 18% 18% 18% 21%
Just About Getting By 31% 36% 34% 36% 33% 36%
Doing All Right 38% 29% 32% 33% 33% 25%
Living Comfortably 12% 7% 11% 9% 10% 9%
Whilst lower earners still find it more difficult than their higher-earning counterparts, the relative deterioration
in ability to get by is more marked amongst those earning R20 000+
2015 2016 2017 2018 2019 2020
R 5 000 To R 19 999
Finding It Very Difficult 4% 10% 5% 6% 9% 10%
Finding It Quite Difficult 21% 24% 25% 23% 23% 24%
Just About Getting By 38% 39% 37% 38% 37% 39%
Doing All Right 31% 23% 27% 28% 27% 21%
Living Comfortably 6% 4% 6% 5% 4% 6%
14 | P a g e
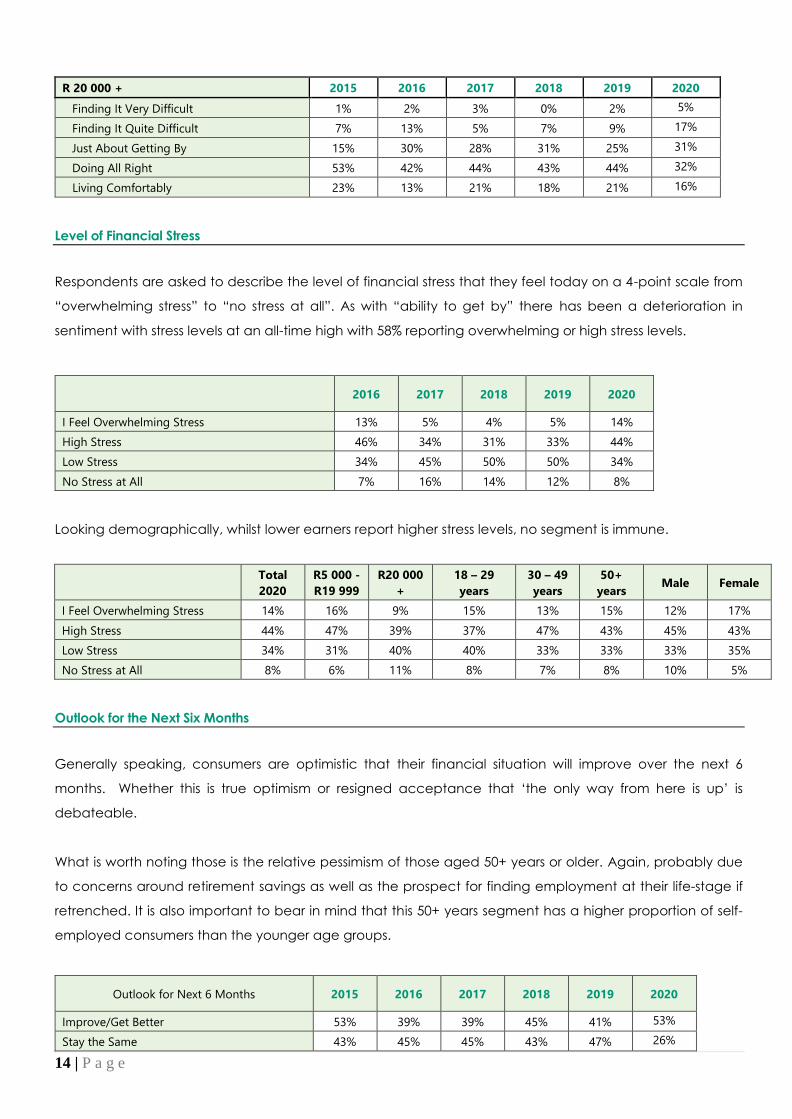
R 20 000 + 2015 2016 2017 2018 2019 2020
Finding It Very Difficult 1% 2% 3% 0% 2% 5%
Finding It Quite Difficult 7% 13% 5% 7% 9% 17%
Just About Getting By 15% 30% 28% 31% 25% 31%
Doing All Right 53% 42% 44% 43% 44% 32%
Living Comfortably 23% 13% 21% 18% 21% 16%
Level of Financial Stress
Respondents are asked to describe the level of financial stress that they feel today on a 4-point scale from
“overwhelming stress” to “no stress at all”. As with “ability to get by” there has been a deterioration in
sentiment with stress levels at an all-time high with 58% reporting overwhelming or high stress levels.
2016 2017 2018 2019 2020
I Feel Overwhelming Stress 13% 5% 4% 5% 14%
High Stress 46% 34% 31% 33% 44%
Low Stress 34% 45% 50% 50% 34%
No Stress at All 7% 16% 14% 12% 8%
Looking demographically, whilst lower earners report higher stress levels, no segment is immune.
Total
2020
R5 000 -
R19 999
R20 000
+
18 – 29
years
30 – 49
years
50+
years Male Female
I Feel Overwhelming Stress 14% 16% 9% 15% 13% 15% 12% 17%
High Stress 44% 47% 39% 37% 47% 43% 45% 43%
Low Stress 34% 31% 40% 40% 33% 33% 33% 35%
No Stress at All 8% 6% 11% 8% 7% 8% 10% 5%
Outlook for the Next Six Months
Generally speaking, consumers are optimistic that their financial situation will improve over the next 6
months. Whether this is true optimism or resigned acceptance that ‘the only way from here is up’ is
debateable.
What is worth noting those is the relative pessimism of those aged 50+ years or older. Again, probably due
to concerns around retirement savings as well as the prospect for finding employment at their life-stage if
retrenched. It is also important to bear in mind that this 50+ years segment has a higher proportion of self-
employed consumers than the younger age groups.
Outlook for Next 6 Months 2015 2016 2017 2018 2019 2020
Improve/Get Better 53% 39% 39% 45% 41% 53%
Stay the Same 43% 45% 45% 43% 47% 26%
15 | P a g e
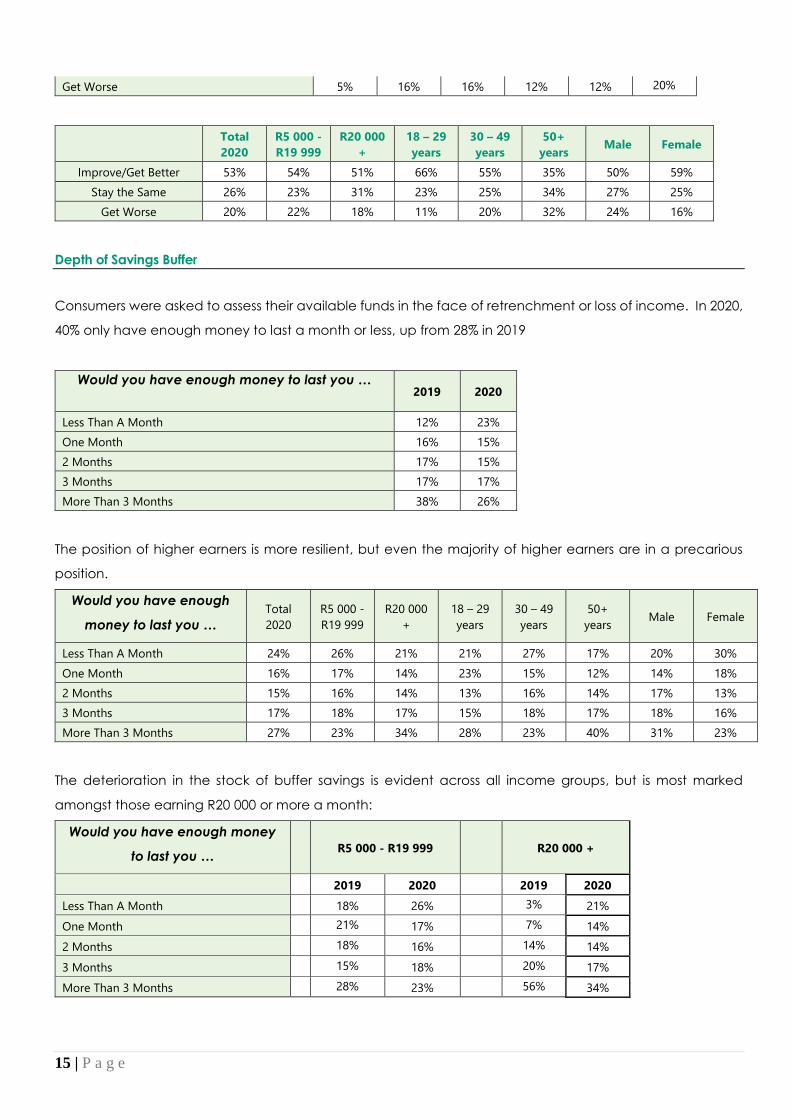
Get Worse 5% 16% 16% 12% 12% 20%
Total
2020
R5 000 -
R19 999
R20 000
+
18 – 29
years
30 – 49
years
50+
years Male Female
Improve/Get Better 53% 54% 51% 66% 55% 35% 50% 59%
Stay the Same 26% 23% 31% 23% 25% 34% 27% 25%
Get Worse 20% 22% 18% 11% 20% 32% 24% 16%
Depth of Savings Buffer
Consumers were asked to assess their available funds in the face of retrenchment or loss of income. In 2020,
40% only have enough money to last a month or less, up from 28% in 2019
Would you have enough money to last you …
2019 2020
Less Than A Month 12% 23%
One Month 16% 15%
2 Months 17% 15%
3 Months 17% 17%
More Than 3 Months 38% 26%
The position of higher earners is more resilient, but even the majority of higher earners are in a precarious
position.
Would you have enough
money to last you …
Total
2020
R5 000 -
R19 999
R20 000
+
18 – 29
years
30 – 49
years
50+
years Male Female
Less Than A Month 24% 26% 21% 21% 27% 17% 20% 30%
One Month 16% 17% 14% 23% 15% 12% 14% 18%
2 Months 15% 16% 14% 13% 16% 14% 17% 13%
3 Months 17% 18% 17% 15% 18% 17% 18% 16%
More Than 3 Months 27% 23% 34% 28% 23% 40% 31% 23%
The deterioration in the stock of buffer savings is evident across all income groups, but is most marked
amongst those earning R20 000 or more a month:
Would you have enough money
to last you … R5 000 - R19 999 R20 000 +
2019 2020 2019 2020
Less Than A Month 18% 26% 3% 21%
One Month 21% 17% 7% 14%
2 Months 18% 16% 14% 14%
3 Months 15% 18% 20% 17%
More Than 3 Months 28% 23% 56% 34%
16 | P a g e
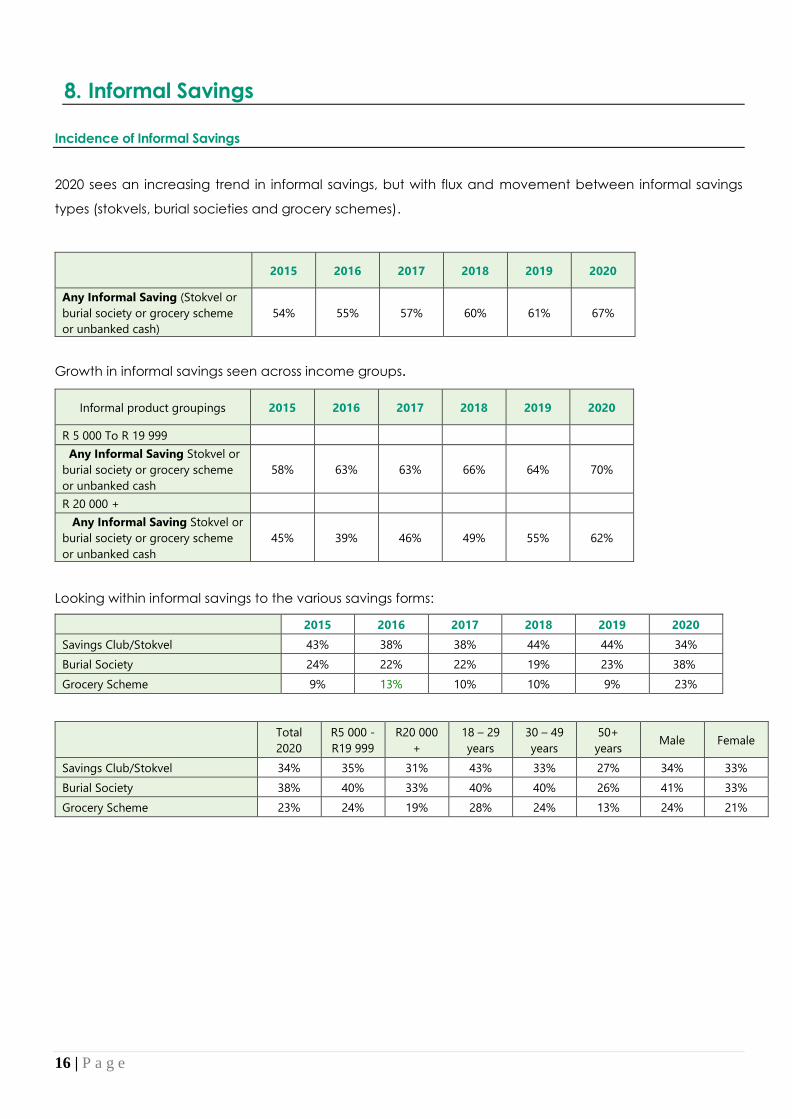
8. Informal Savings
Incidence of Informal Savings
2020 sees an increasing trend in informal savings, but with flux and movement between informal savings
types (stokvels, burial societies and grocery schemes).
2015 2016 2017 2018 2019 2020
Any Informal Saving (Stokvel or
burial society or grocery scheme
or unbanked cash)
54% 55% 57% 60% 61% 67%
Growth in informal savings seen across income groups.
Informal product groupings 2015 2016 2017 2018 2019 2020
R 5 000 To R 19 999
Any Informal Saving Stokvel or
burial society or grocery scheme
or unbanked cash
58% 63% 63% 66% 64% 70%
R 20 000 +
Any Informal Saving Stokvel or
burial society or grocery scheme
or unbanked cash
45% 39% 46% 49% 55% 62%
Looking within informal savings to the various savings forms:
2015 2016 2017 2018 2019 2020
Savings Club/Stokvel 43% 38% 38% 44% 44% 34%
Burial Society 24% 22% 22% 19% 23% 38%
Grocery Scheme 9% 13% 10% 10% 9% 23%
Total
2020
R5 000 -
R19 999
R20 000
+
18 – 29
years
30 – 49
years
50+
years Male Female
Savings Club/Stokvel 34% 35% 31% 43% 33% 27% 34% 33%
Burial Society 38% 40% 33% 40% 40% 26% 41% 33%
Grocery Scheme 23% 24% 19% 28% 24% 13% 24% 21%
17 | P a g e
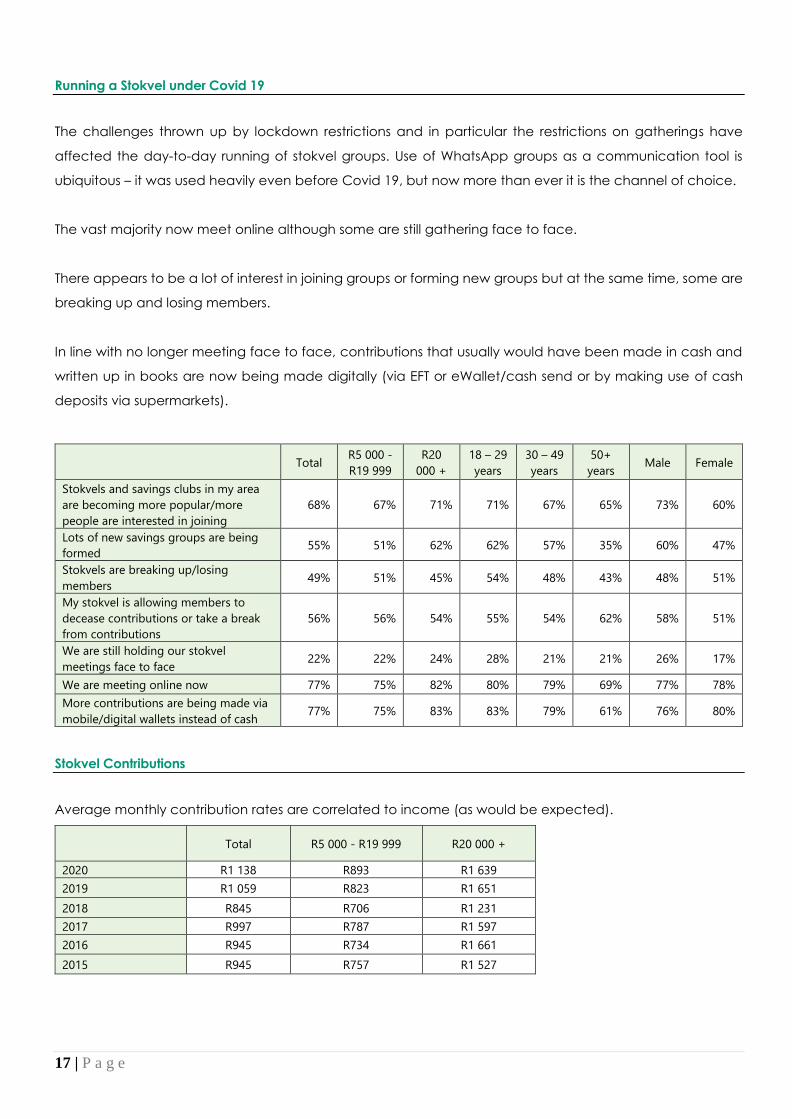
Running a Stokvel under Covid 19
The challenges thrown up by lockdown restrictions and in particular the restrictions on gatherings have
affected the day-to-day running of stokvel groups. Use of WhatsApp groups as a communication tool is
ubiquitous – it was used heavily even before Covid 19, but now more than ever it is the channel of choice.
The vast majority now meet online although some are still gathering face to face.
There appears to be a lot of interest in joining groups or forming new groups but at the same time, some are
breaking up and losing members.
In line with no longer meeting face to face, contributions that usually would have been made in cash and
written up in books are now being made digitally (via EFT or eWallet/cash send or by making use of cash
deposits via supermarkets).
Total R5 000 -
R19 999
R20
000 +
18 – 29
years
30 – 49
years
50+
years Male Female
Stokvels and savings clubs in my area
are becoming more popular/more
people are interested in joining
68% 67% 71% 71% 67% 65% 73% 60%
Lots of new savings groups are being
formed 55% 51% 62% 62% 57% 35% 60% 47%
Stokvels are breaking up/losing
members 49% 51% 45% 54% 48% 43% 48% 51%
My stokvel is allowing members to
decease contributions or take a break
from contributions
56% 56% 54% 55% 54% 62% 58% 51%
We are still holding our stokvel
meetings face to face 22% 22% 24% 28% 21% 21% 26% 17%
We are meeting online now 77% 75% 82% 80% 79% 69% 77% 78%
More contributions are being made via
mobile/digital wallets instead of cash 77% 75% 83% 83% 79% 61% 76% 80%
Stokvel Contributions
Average monthly contribution rates are correlated to income (as would be expected).
Total R5 000 - R19 999 R20 000 +
2020 R1 138 R893 R1 639
2019 R1 059 R823 R1 651
2018 R845 R706 R1 231
2017 R997 R787 R1 597
2016 R945 R734 R1 661
2015 R945 R757 R1 527
18 | P a g e
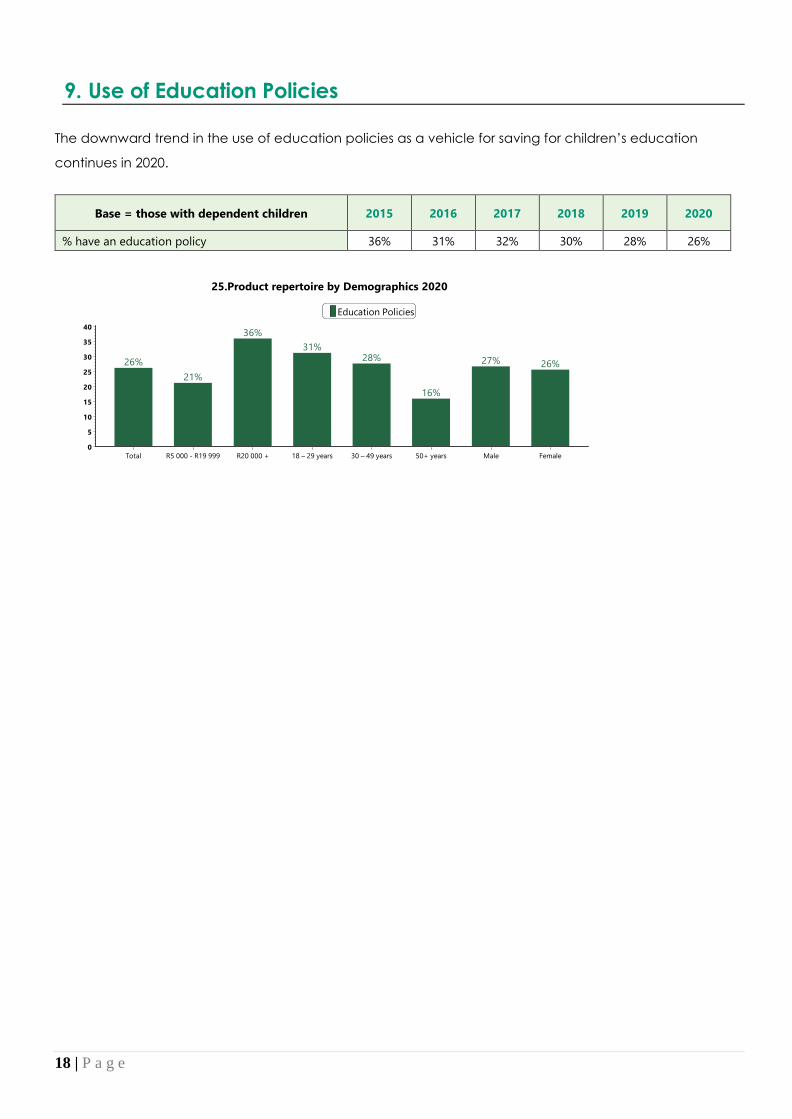
9. Use of Education Policies
The downward trend in the use of education policies as a vehicle for saving for children’s education
continues in 2020.
Base = those with dependent children 2015 2016 2017 2018 2019 2020
% have an education policy 36% 31% 32% 30% 28% 26%
25.Product repertoire by Demographics 2020Old Mutual Covid 19 Database
Base - RMM or PF (Segments) and Yes (19.Dependent Children)
25.Product repertoire Education Policies
26% Total21% R5 000 - R19 99936% R20 000 +31% 18 – 29 years28% 30 – 49 years16% 50+ years27% Male26% Female
Demographics 2020
Total R5 000 - R19 999 R20 000 + 18 – 29 years 30 – 49 years 50+ years Male Female
%
40
35
30
25
20
15
10
5
0
26%
21%
36%
31%28%
16%
27% 26%
Autobase Off
19 | P a g e
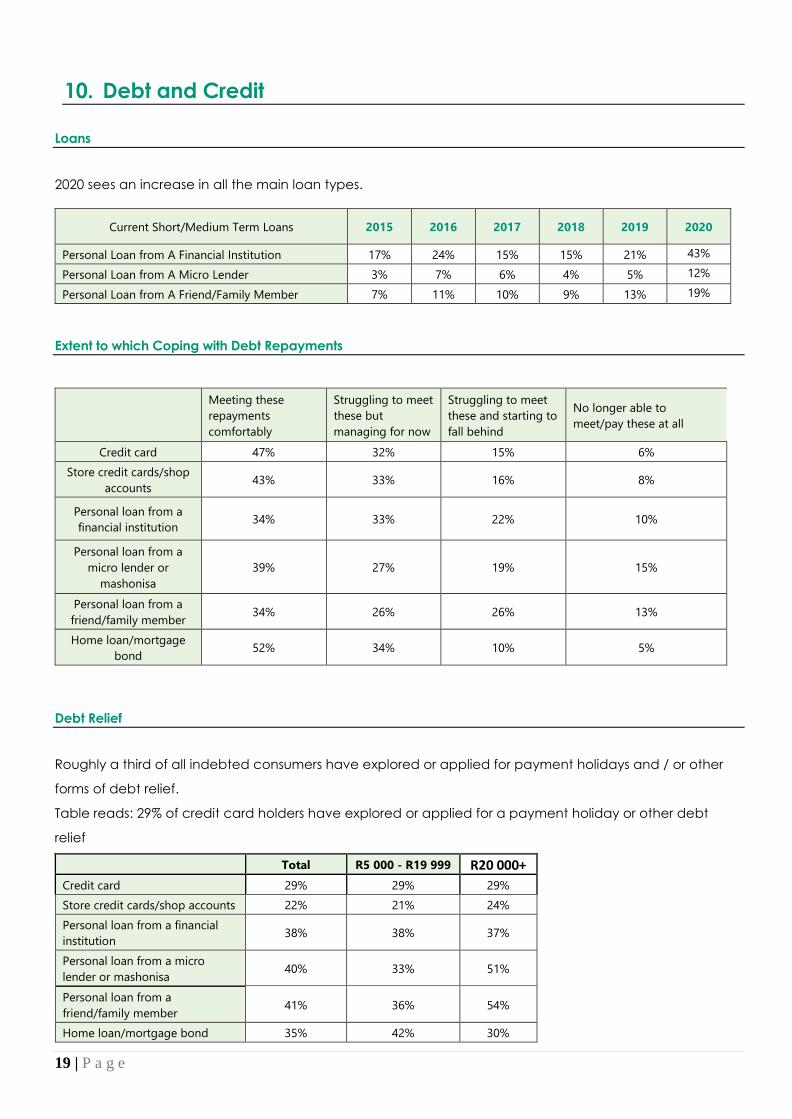
10. Debt and Credit
Loans
2020 sees an increase in all the main loan types.
Current Short/Medium Term Loans 2015 2016 2017 2018 2019 2020
Personal Loan from A Financial Institution 17% 24% 15% 15% 21% 43%
Personal Loan from A Micro Lender 3% 7% 6% 4% 5% 12%
Personal Loan from A Friend/Family Member 7% 11% 10% 9% 13% 19%
Extent to which Coping with Debt Repayments
Meeting these
repayments
comfortably
Struggling to meet
these but
managing for now
Struggling to meet
these and starting to
fall behind
No longer able to
meet/pay these at all
Credit card 47% 32% 15% 6%
Store credit cards/shop
accounts 43% 33% 16% 8%
Personal loan from a
financial institution 34% 33% 22% 10%
Personal loan from a
micro lender or
mashonisa
39% 27% 19% 15%
Personal loan from a
friend/family member 34% 26% 26% 13%
Home loan/mortgage
bond 52% 34% 10% 5%
Debt Relief
Roughly a third of all indebted consumers have explored or applied for payment holidays and / or other
forms of debt relief.
Table reads: 29% of credit card holders have explored or applied for a payment holiday or other debt
relief
Total R5 000 - R19 999 R20 000+
Credit card 29% 29% 29%
Store credit cards/shop accounts 22% 21% 24%
Personal loan from a financial
institution 38% 38% 37%
Personal loan from a micro
lender or mashonisa 40% 33% 51%
Personal loan from a
friend/family member 41% 36% 54%
Home loan/mortgage bond 35% 42% 30%
20 | P a g e
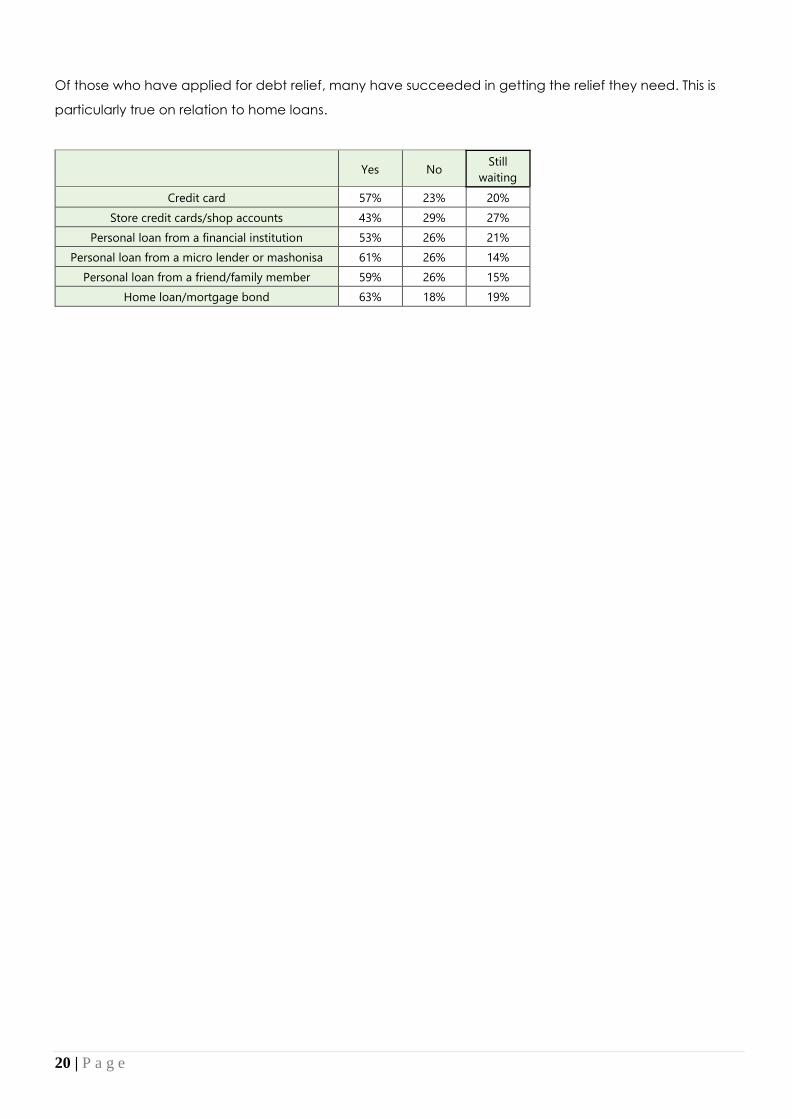
Of those who have applied for debt relief, many have succeeded in getting the relief they need. This is
particularly true on relation to home loans.
Yes No Still
waiting
Credit card 57% 23% 20%
Store credit cards/shop accounts 43% 29% 27%
Personal loan from a financial institution 53% 26% 21%
Personal loan from a micro lender or mashonisa 61% 26% 14%
Personal loan from a friend/family member 59% 26% 15%
Home loan/mortgage bond 63% 18% 19%
21 | P a g e
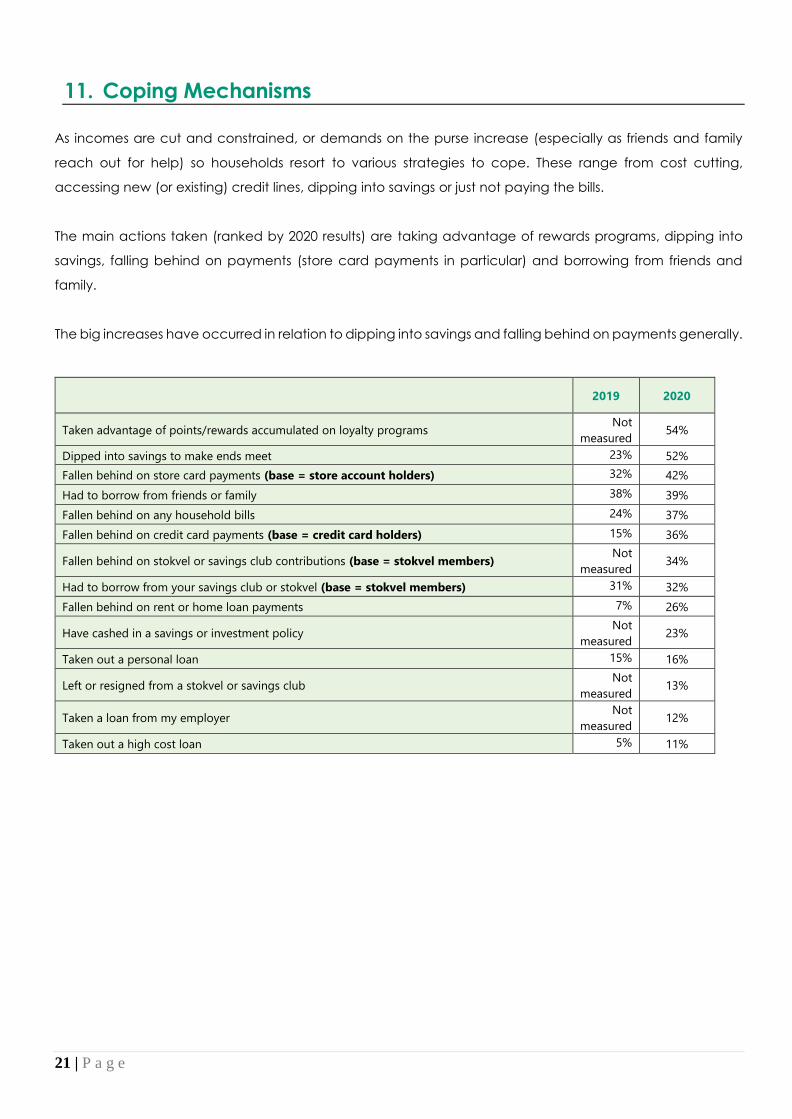
11. Coping Mechanisms
As incomes are cut and constrained, or demands on the purse increase (especially as friends and family
reach out for help) so households resort to various strategies to cope. These range from cost cutting,
accessing new (or existing) credit lines, dipping into savings or just not paying the bills.
The main actions taken (ranked by 2020 results) are taking advantage of rewards programs, dipping into
savings, falling behind on payments (store card payments in particular) and borrowing from friends and
family.
The big increases have occurred in relation to dipping into savings and falling behind on payments generally.
2019 2020
Taken advantage of points/rewards accumulated on loyalty programs Not
measured 54%
Dipped into savings to make ends meet 23% 52%
Fallen behind on store card payments (base = store account holders) 32% 42%
Had to borrow from friends or family 38% 39%
Fallen behind on any household bills 24% 37%
Fallen behind on credit card payments (base = credit card holders) 15% 36%
Fallen behind on stokvel or savings club contributions (base = stokvel members) Not
measured 34%
Had to borrow from your savings club or stokvel (base = stokvel members) 31% 32%
Fallen behind on rent or home loan payments 7% 26%
Have cashed in a savings or investment policy Not
measured 23%
Taken out a personal loan 15% 16%
Left or resigned from a stokvel or savings club Not
measured 13%
Taken a loan from my employer Not
measured 12%
Taken out a high cost loan 5% 11%
22 | P a g e
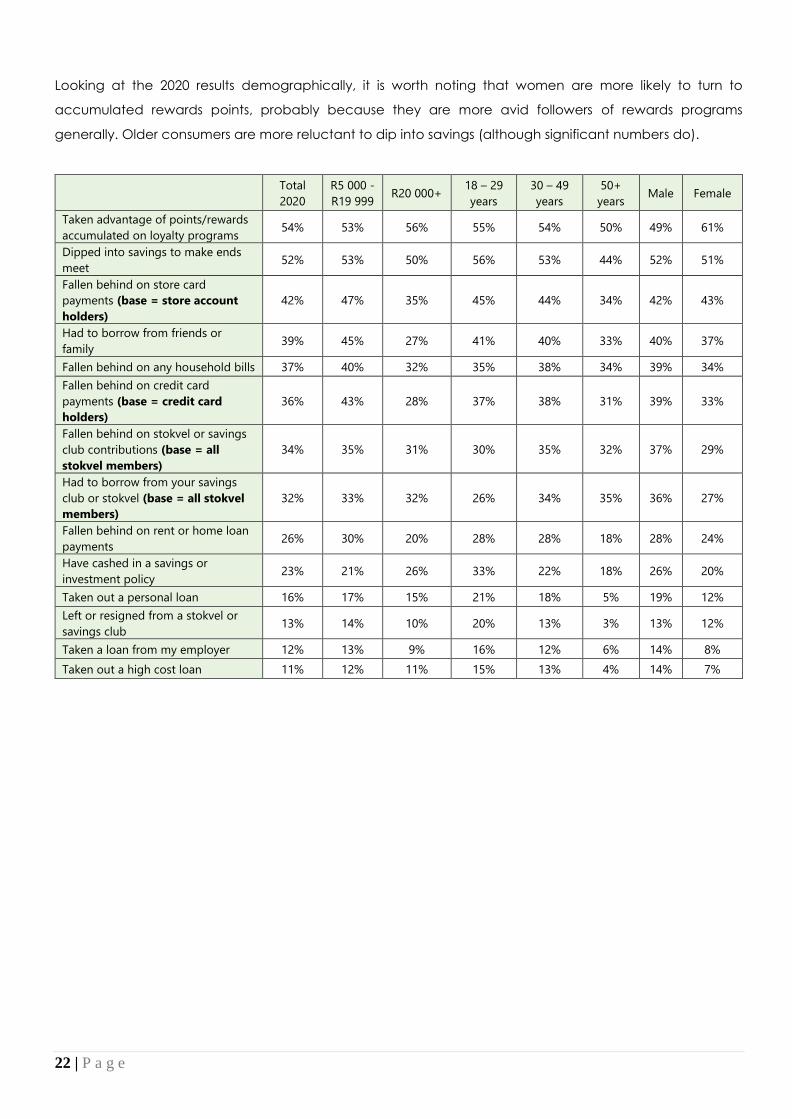
Looking at the 2020 results demographically, it is worth noting that women are more likely to turn to
accumulated rewards points, probably because they are more avid followers of rewards programs
generally. Older consumers are more reluctant to dip into savings (although significant numbers do).
Total
2020
R5 000 -
R19 999 R20 000+
18 – 29
years
30 – 49
years
50+
years Male Female
Taken advantage of points/rewards
accumulated on loyalty programs 54% 53% 56% 55% 54% 50% 49% 61%
Dipped into savings to make ends
meet 52% 53% 50% 56% 53% 44% 52% 51%
Fallen behind on store card
payments (base = store account
holders)
42% 47% 35% 45% 44% 34% 42% 43%
Had to borrow from friends or
family 39% 45% 27% 41% 40% 33% 40% 37%
Fallen behind on any household bills 37% 40% 32% 35% 38% 34% 39% 34%
Fallen behind on credit card
payments (base = credit card
holders)
36% 43% 28% 37% 38% 31% 39% 33%
Fallen behind on stokvel or savings
club contributions (base = all
stokvel members)
34% 35% 31% 30% 35% 32% 37% 29%
Had to borrow from your savings
club or stokvel (base = all stokvel
members)
32% 33% 32% 26% 34% 35% 36% 27%
Fallen behind on rent or home loan
payments 26% 30% 20% 28% 28% 18% 28% 24%
Have cashed in a savings or
investment policy 23% 21% 26% 33% 22% 18% 26% 20%
Taken out a personal loan 16% 17% 15% 21% 18% 5% 19% 12%
Left or resigned from a stokvel or
savings club 13% 14% 10% 20% 13% 3% 13% 12%
Taken a loan from my employer 12% 13% 9% 16% 12% 6% 14% 8%
Taken out a high cost loan 11% 12% 11% 15% 13% 4% 14% 7%
23 | P a g e
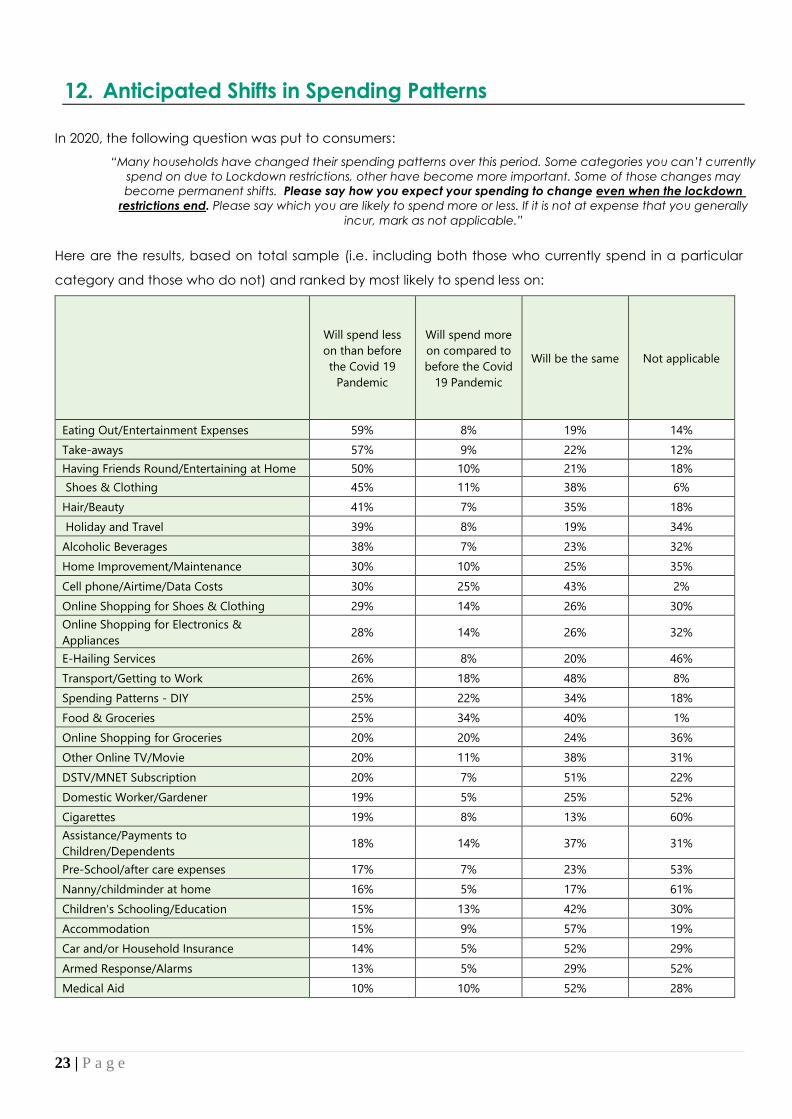
12. Anticipated Shifts in Spending Patterns
In 2020, the following question was put to consumers:
“Many households have changed their spending patterns over this period. Some categories you can’t currently
spend on due to Lockdown restrictions, other have become more important. Some of those changes may
become permanent shifts. Please say how you expect your spending to change even when the lockdown
restrictions end. Please say which you are likely to spend more or less. If it is not at expense that you generally
incur, mark as not applicable.”
Here are the results, based on total sample (i.e. including both those who currently spend in a particular
category and those who do not) and ranked by most likely to spend less on:
Will spend less
on than before
the Covid 19
Pandemic
Will spend more
on compared to
before the Covid
19 Pandemic
Will be the same Not applicable
Eating Out/Entertainment Expenses 59% 8% 19% 14%
Take-aways 57% 9% 22% 12%
Having Friends Round/Entertaining at Home 50% 10% 21% 18%
Shoes & Clothing 45% 11% 38% 6%
Hair/Beauty 41% 7% 35% 18%
Holiday and Travel 39% 8% 19% 34%
Alcoholic Beverages 38% 7% 23% 32%
Home Improvement/Maintenance 30% 10% 25% 35%
Cell phone/Airtime/Data Costs 30% 25% 43% 2%
Online Shopping for Shoes & Clothing 29% 14% 26% 30%
Online Shopping for Electronics &
Appliances 28% 14% 26% 32%
E-Hailing Services 26% 8% 20% 46%
Transport/Getting to Work 26% 18% 48% 8%
Spending Patterns - DIY 25% 22% 34% 18%
Food & Groceries 25% 34% 40% 1%
Online Shopping for Groceries 20% 20% 24% 36%
Other Online TV/Movie 20% 11% 38% 31%
DSTV/MNET Subscription 20% 7% 51% 22%
Domestic Worker/Gardener 19% 5% 25% 52%
Cigarettes 19% 8% 13% 60%
Assistance/Payments to
Children/Dependents 18% 14% 37% 31%
Pre-School/after care expenses 17% 7% 23% 53%
Nanny/childminder at home 16% 5% 17% 61%
Children's Schooling/Education 15% 13% 42% 30%
Accommodation 15% 9% 57% 19%
Car and/or Household Insurance 14% 5% 52% 29%
Armed Response/Alarms 13% 5% 29% 52%
Medical Aid 10% 10% 52% 28%
24 | P a g e
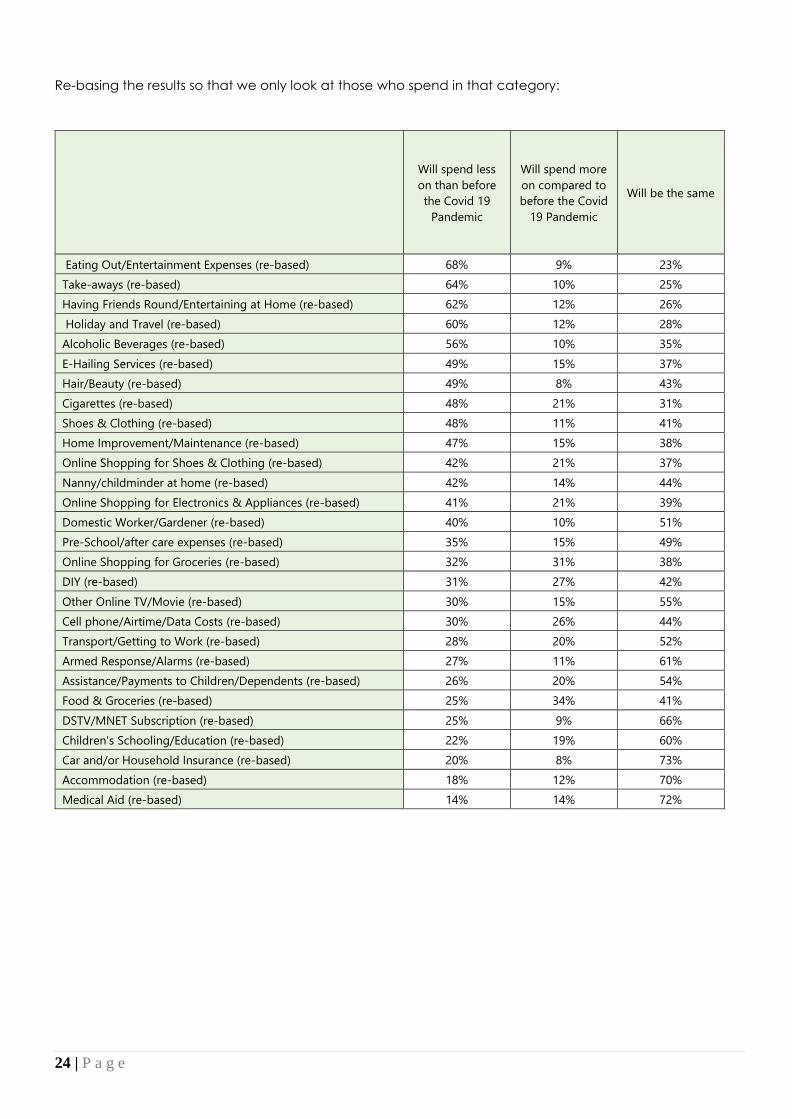
Re-basing the results so that we only look at those who spend in that category:
Will spend less
on than before
the Covid 19
Pandemic
Will spend more
on compared to
before the Covid
19 Pandemic
Will be the same
Eating Out/Entertainment Expenses (re-based) 68% 9% 23%
Take-aways (re-based) 64% 10% 25%
Having Friends Round/Entertaining at Home (re-based) 62% 12% 26%
Holiday and Travel (re-based) 60% 12% 28%
Alcoholic Beverages (re-based) 56% 10% 35%
E-Hailing Services (re-based) 49% 15% 37%
Hair/Beauty (re-based) 49% 8% 43%
Cigarettes (re-based) 48% 21% 31%
Shoes & Clothing (re-based) 48% 11% 41%
Home Improvement/Maintenance (re-based) 47% 15% 38%
Online Shopping for Shoes & Clothing (re-based) 42% 21% 37%
Nanny/childminder at home (re-based) 42% 14% 44%
Online Shopping for Electronics & Appliances (re-based) 41% 21% 39%
Domestic Worker/Gardener (re-based) 40% 10% 51%
Pre-School/after care expenses (re-based) 35% 15% 49%
Online Shopping for Groceries (re-based) 32% 31% 38%
DIY (re-based) 31% 27% 42%
Other Online TV/Movie (re-based) 30% 15% 55%
Cell phone/Airtime/Data Costs (re-based) 30% 26% 44%
Transport/Getting to Work (re-based) 28% 20% 52%
Armed Response/Alarms (re-based) 27% 11% 61%
Assistance/Payments to Children/Dependents (re-based) 26% 20% 54%
Food & Groceries (re-based) 25% 34% 41%
DSTV/MNET Subscription (re-based) 25% 9% 66%
Children's Schooling/Education (re-based) 22% 19% 60%
Car and/or Household Insurance (re-based) 20% 8% 73%
Accommodation (re-based) 18% 12% 70%
Medical Aid (re-based) 14% 14% 72%
25 | P a g e
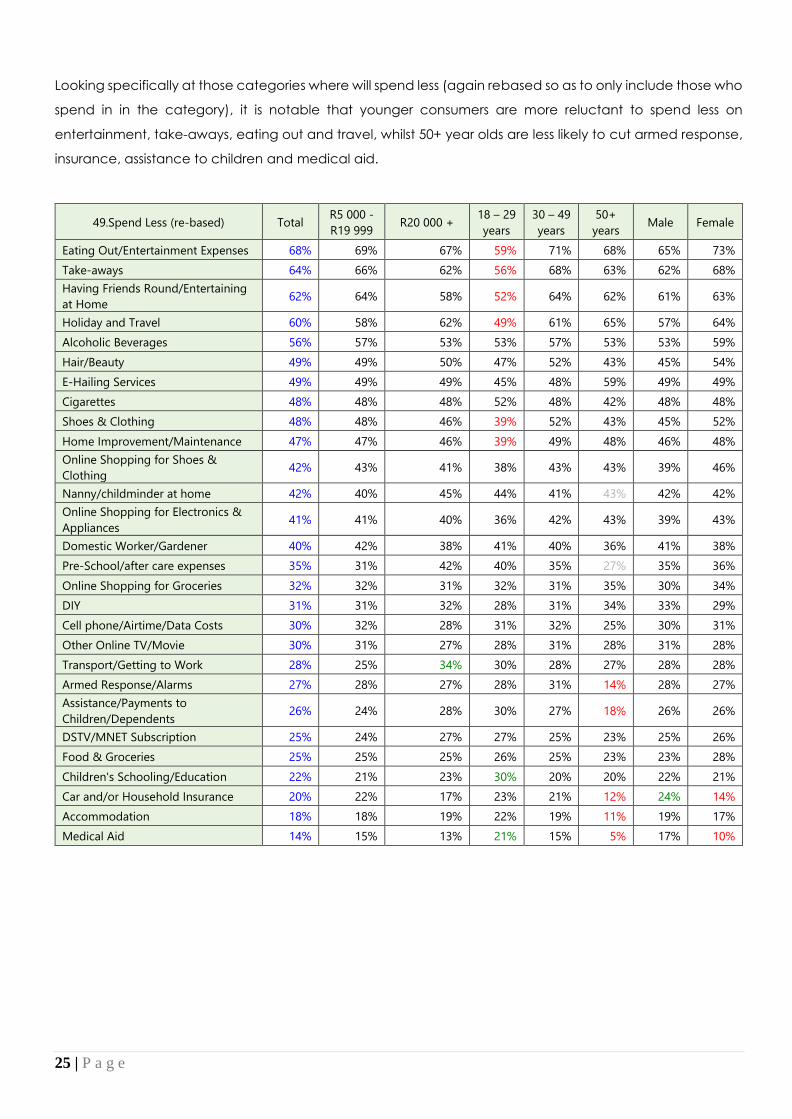
Looking specifically at those categories where will spend less (again rebased so as to only include those who
spend in in the category), it is notable that younger consumers are more reluctant to spend less on
entertainment, take-aways, eating out and travel, whilst 50+ year olds are less likely to cut armed response,
insurance, assistance to children and medical aid.
49.Spend Less (re-based) Total R5 000 -
R19 999 R20 000 +
18 – 29
years
30 – 49
years
50+
years Male Female
Eating Out/Entertainment Expenses 68% 69% 67% 59% 71% 68% 65% 73%
Take-aways 64% 66% 62% 56% 68% 63% 62% 68%
Having Friends Round/Entertaining
at Home 62% 64% 58% 52% 64% 62% 61% 63%
Holiday and Travel 60% 58% 62% 49% 61% 65% 57% 64%
Alcoholic Beverages 56% 57% 53% 53% 57% 53% 53% 59%
Hair/Beauty 49% 49% 50% 47% 52% 43% 45% 54%
E-Hailing Services 49% 49% 49% 45% 48% 59% 49% 49%
Cigarettes 48% 48% 48% 52% 48% 42% 48% 48%
Shoes & Clothing 48% 48% 46% 39% 52% 43% 45% 52%
Home Improvement/Maintenance 47% 47% 46% 39% 49% 48% 46% 48%
Online Shopping for Shoes &
Clothing 42% 43% 41% 38% 43% 43% 39% 46%
Nanny/childminder at home 42% 40% 45% 44% 41% 43% 42% 42%
Online Shopping for Electronics &
Appliances 41% 41% 40% 36% 42% 43% 39% 43%
Domestic Worker/Gardener 40% 42% 38% 41% 40% 36% 41% 38%
Pre-School/after care expenses 35% 31% 42% 40% 35% 27% 35% 36%
Online Shopping for Groceries 32% 32% 31% 32% 31% 35% 30% 34%
DIY 31% 31% 32% 28% 31% 34% 33% 29%
Cell phone/Airtime/Data Costs 30% 32% 28% 31% 32% 25% 30% 31%
Other Online TV/Movie 30% 31% 27% 28% 31% 28% 31% 28%
Transport/Getting to Work 28% 25% 34% 30% 28% 27% 28% 28%
Armed Response/Alarms 27% 28% 27% 28% 31% 14% 28% 27%
Assistance/Payments to
Children/Dependents 26% 24% 28% 30% 27% 18% 26% 26%
DSTV/MNET Subscription 25% 24% 27% 27% 25% 23% 25% 26%
Food & Groceries 25% 25% 25% 26% 25% 23% 23% 28%
Children's Schooling/Education 22% 21% 23% 30% 20% 20% 22% 21%
Car and/or Household Insurance 20% 22% 17% 23% 21% 12% 24% 14%
Accommodation 18% 18% 19% 22% 19% 11% 19% 17%
Medical Aid 14% 15% 13% 21% 15% 5% 17% 10%
26 | P a g e
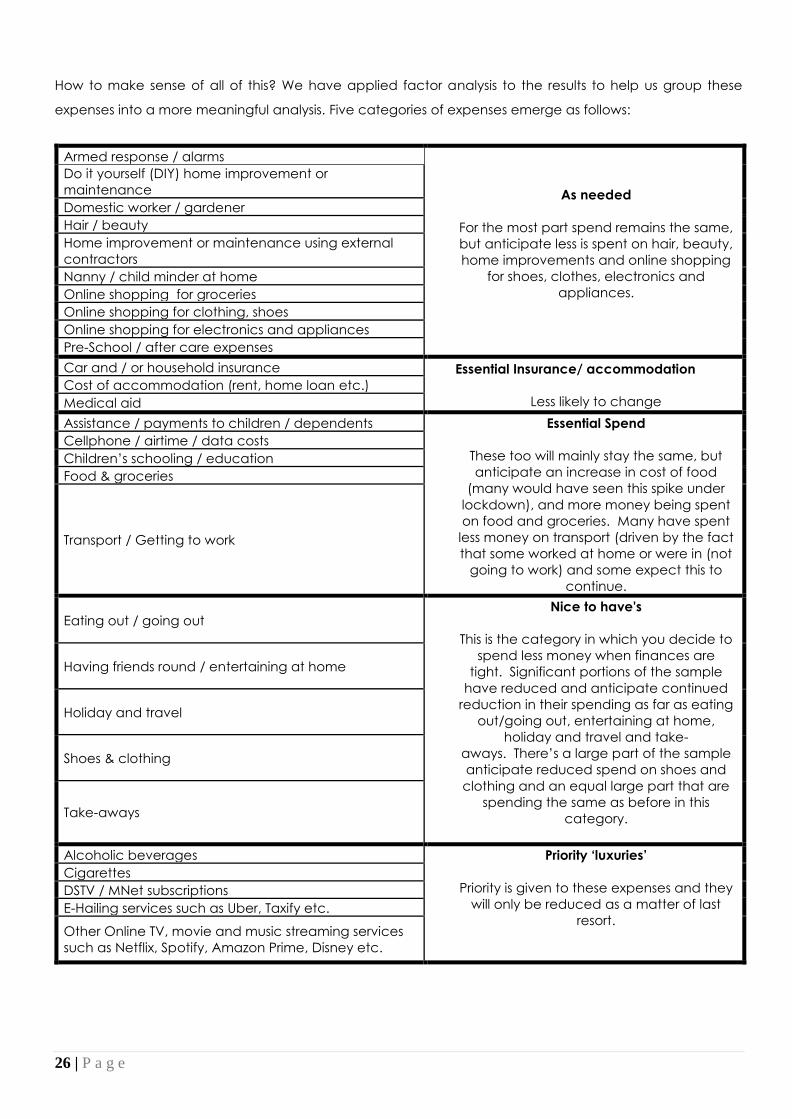
How to make sense of all of this? We have applied factor analysis to the results to help us group these
expenses into a more meaningful analysis. Five categories of expenses emerge as follows:
Armed response / alarms
As needed
For the most part spend remains the same,
but anticipate less is spent on hair, beauty,
home improvements and online shopping
for shoes, clothes, electronics and
appliances.
Do it yourself (DIY) home improvement or
maintenance
Domestic worker / gardener
Hair / beauty
Home improvement or maintenance using external
contractors
Nanny / child minder at home
Online shopping for groceries
Online shopping for clothing, shoes
Online shopping for electronics and appliances
Pre-School / after care expenses
Car and / or household insurance Essential Insurance/ accommodation
Less likely to change
Cost of accommodation (rent, home loan etc.)
Medical aid
Assistance / payments to children / dependents Essential Spend
These too will mainly stay the same, but
anticipate an increase in cost of food
(many would have seen this spike under
lockdown), and more money being spent
on food and groceries. Many have spent
less money on transport (driven by the fact
that some worked at home or were in (not
going to work) and some expect this to
continue.
Cellphone / airtime / data costs
Children’s schooling / education
Food & groceries
Transport / Getting to work
Eating out / going out Nice to have's
This is the category in which you decide to
spend less money when finances are
tight. Significant portions of the sample
have reduced and anticipate continued
reduction in their spending as far as eating
out/going out, entertaining at home,
holiday and travel and take-
aways. There’s a large part of the sample
anticipate reduced spend on shoes and
clothing and an equal large part that are
spending the same as before in this
category.
Having friends round / entertaining at home
Holiday and travel
Shoes & clothing
Take-aways
Alcoholic beverages Priority ‘luxuries’
Priority is given to these expenses and they
will only be reduced as a matter of last
resort.
Cigarettes
DSTV / MNet subscriptions
E-Hailing services such as Uber, Taxify etc.
Other Online TV, movie and music streaming services
such as Netflix, Spotify, Amazon Prime, Disney etc.
27 | P a g e
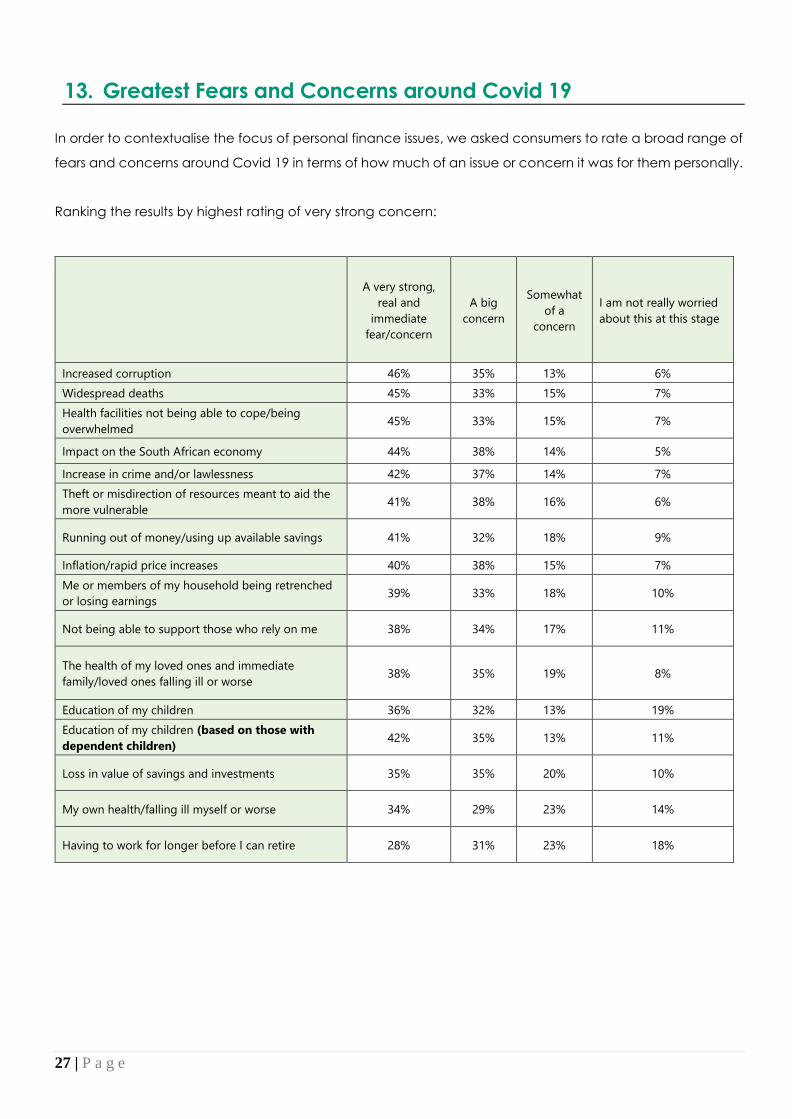
13. Greatest Fears and Concerns around Covid 19
In order to contextualise the focus of personal finance issues, we asked consumers to rate a broad range of
fears and concerns around Covid 19 in terms of how much of an issue or concern it was for them personally.
Ranking the results by highest rating of very strong concern:
A very strong,
real and
immediate
fear/concern
A big
concern
Somewhat
of a
concern
I am not really worried
about this at this stage
Increased corruption 46% 35% 13% 6%
Widespread deaths 45% 33% 15% 7%
Health facilities not being able to cope/being
overwhelmed 45% 33% 15% 7%
Impact on the South African economy 44% 38% 14% 5%
Increase in crime and/or lawlessness 42% 37% 14% 7%
Theft or misdirection of resources meant to aid the
more vulnerable 41% 38% 16% 6%
Running out of money/using up available savings 41% 32% 18% 9%
Inflation/rapid price increases 40% 38% 15% 7%
Me or members of my household being retrenched
or losing earnings 39% 33% 18% 10%
Not being able to support those who rely on me 38% 34% 17% 11%
The health of my loved ones and immediate
family/loved ones falling ill or worse 38% 35% 19% 8%
Education of my children 36% 32% 13% 19%
Education of my children (based on those with
dependent children) 42% 35% 13% 11%
Loss in value of savings and investments 35% 35% 20% 10%
My own health/falling ill myself or worse 34% 29% 23% 14%
Having to work for longer before I can retire 28% 31% 23% 18%
28 | P a g e
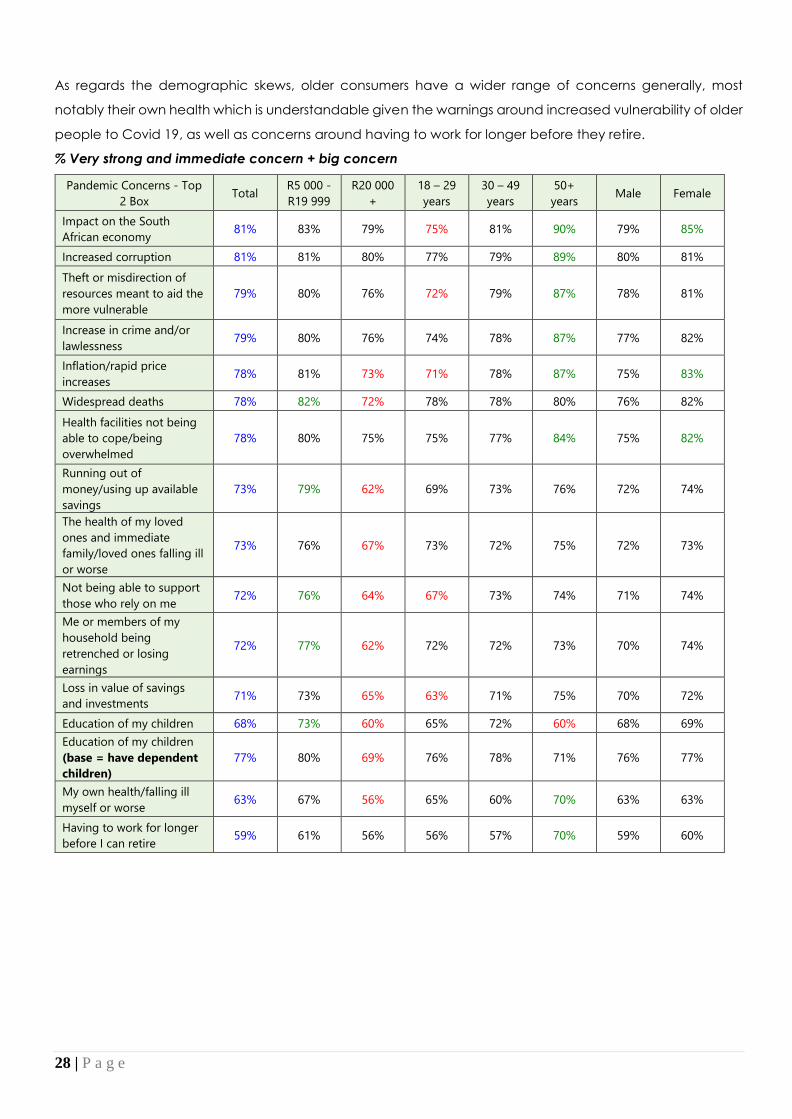
As regards the demographic skews, older consumers have a wider range of concerns generally, most
notably their own health which is understandable given the warnings around increased vulnerability of older
people to Covid 19, as well as concerns around having to work for longer before they retire.
% Very strong and immediate concern + big concern
Pandemic Concerns - Top
2 Box Total
R5 000 -
R19 999
R20 000
+
18 – 29
years
30 – 49
years
50+
years Male Female
Impact on the South
African economy 81% 83% 79% 75% 81% 90% 79% 85%
Increased corruption 81% 81% 80% 77% 79% 89% 80% 81%
Theft or misdirection of
resources meant to aid the
more vulnerable
79% 80% 76% 72% 79% 87% 78% 81%
Increase in crime and/or
lawlessness 79% 80% 76% 74% 78% 87% 77% 82%
Inflation/rapid price
increases 78% 81% 73% 71% 78% 87% 75% 83%
Widespread deaths 78% 82% 72% 78% 78% 80% 76% 82%
Health facilities not being
able to cope/being
overwhelmed
78% 80% 75% 75% 77% 84% 75% 82%
Running out of
money/using up available
savings
73% 79% 62% 69% 73% 76% 72% 74%
The health of my loved
ones and immediate
family/loved ones falling ill
or worse
73% 76% 67% 73% 72% 75% 72% 73%
Not being able to support
those who rely on me 72% 76% 64% 67% 73% 74% 71% 74%
Me or members of my
household being
retrenched or losing
earnings
72% 77% 62% 72% 72% 73% 70% 74%
Loss in value of savings
and investments 71% 73% 65% 63% 71% 75% 70% 72%
Education of my children 68% 73% 60% 65% 72% 60% 68% 69%
Education of my children
(base = have dependent
children)
77% 80% 69% 76% 78% 71% 76% 77%
My own health/falling ill
myself or worse 63% 67% 56% 65% 60% 70% 63% 63%
Having to work for longer
before I can retire 59% 61% 56% 56% 57% 70% 59% 60%
29 | P a g e
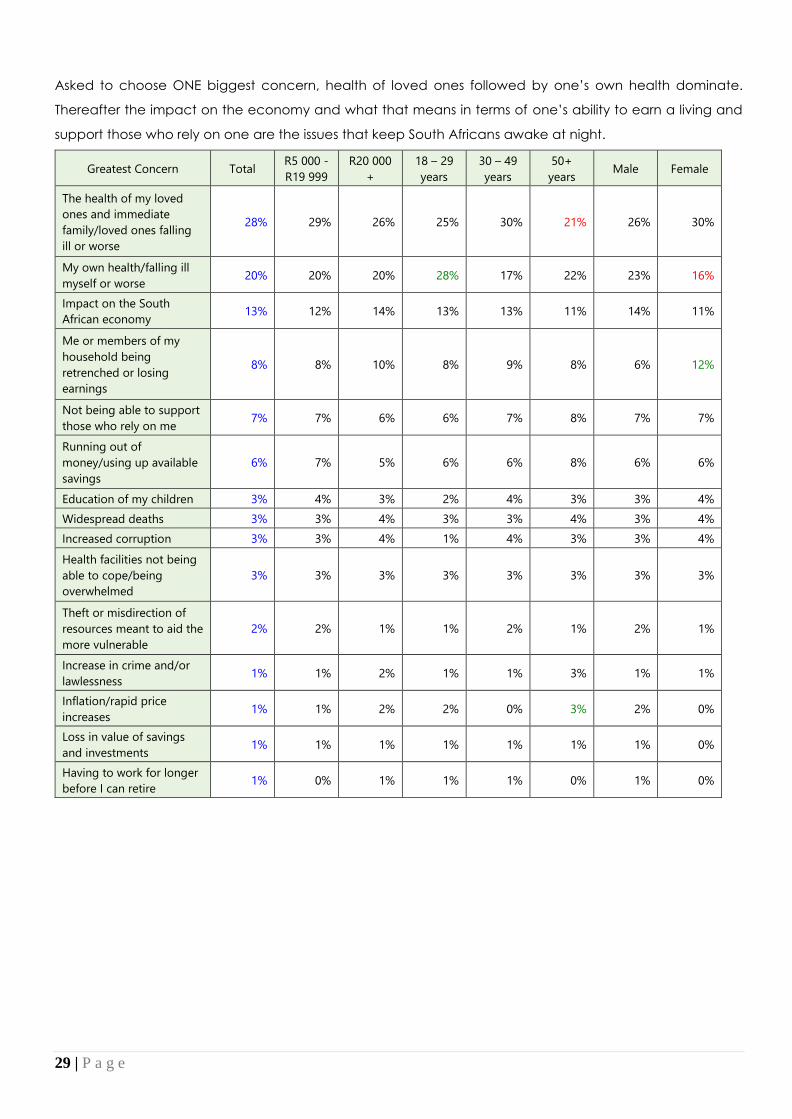
Asked to choose ONE biggest concern, health of loved ones followed by one’s own health dominate.
Thereafter the impact on the economy and what that means in terms of one’s ability to earn a living and
support those who rely on one are the issues that keep South Africans awake at night.
Greatest Concern Total R5 000 -
R19 999
R20 000
+
18 – 29
years
30 – 49
years
50+
years Male Female
The health of my loved
ones and immediate
family/loved ones falling
ill or worse
28% 29% 26% 25% 30% 21% 26% 30%
My own health/falling ill
myself or worse 20% 20% 20% 28% 17% 22% 23% 16%
Impact on the South
African economy 13% 12% 14% 13% 13% 11% 14% 11%
Me or members of my
household being
retrenched or losing
earnings
8% 8% 10% 8% 9% 8% 6% 12%
Not being able to support
those who rely on me 7% 7% 6% 6% 7% 8% 7% 7%
Running out of
money/using up available
savings
6% 7% 5% 6% 6% 8% 6% 6%
Education of my children 3% 4% 3% 2% 4% 3% 3% 4%
Widespread deaths 3% 3% 4% 3% 3% 4% 3% 4%
Increased corruption 3% 3% 4% 1% 4% 3% 3% 4%
Health facilities not being
able to cope/being
overwhelmed
3% 3% 3% 3% 3% 3% 3% 3%
Theft or misdirection of
resources meant to aid the
more vulnerable
2% 2% 1% 1% 2% 1% 2% 1%
Increase in crime and/or
lawlessness 1% 1% 2% 1% 1% 3% 1% 1%
Inflation/rapid price
increases 1% 1% 2% 2% 0% 3% 2% 0%
Loss in value of savings
and investments 1% 1% 1% 1% 1% 1% 1% 0%
Having to work for longer
before I can retire 1% 0% 1% 1% 1% 0% 1% 0%

30 | P a g e
14. Seeing a Silver Lining?
Consumers were presented with some possible upsides or positives that may come out of the Covid 19
Pandemic. Increased recognition of essential workers, more empathy, improved public health and a better
work / life balance are the potential positives that come forward most strongly.
Unfortunately, there is some scepticism as to whether this Covid 19 will have any meaningful effect on
poverty alleviation, cooperation between political parties, wildlife trade or management of SOE’s
I think this
will be a big
positive
I hope that
this happens,
I think it
might
I hope that this
happens, but I
don't think it will
This may or may not
happen, but it's not
something I am
particularly concerned
about
Respect and appreciation of essential workers 41% 31% 20% 8%
Appreciation of shared humanity/Ubuntu/more
empathy 28% 33% 29% 10%
Improved public health services 26% 29% 35% 10%
Better work/life balance 24% 33% 34% 9%
Greater focus on service delivery 23% 30% 36% 11%
Better cooperation between the private
sector/business and Government 21% 32% 34% 12%
Better focus on environmental issues such as
pollution 20% 29% 36% 14%
More effective poverty alleviation 18% 27% 43% 12%
Better cooperation between political politics 18% 24% 44% 14%
Decrease in demand for exotic wildlife trade 17% 25% 37% 21%
Better management of State Owned Enterprises
(SOE's) 16% 27% 41% 15%
31 | P a g e
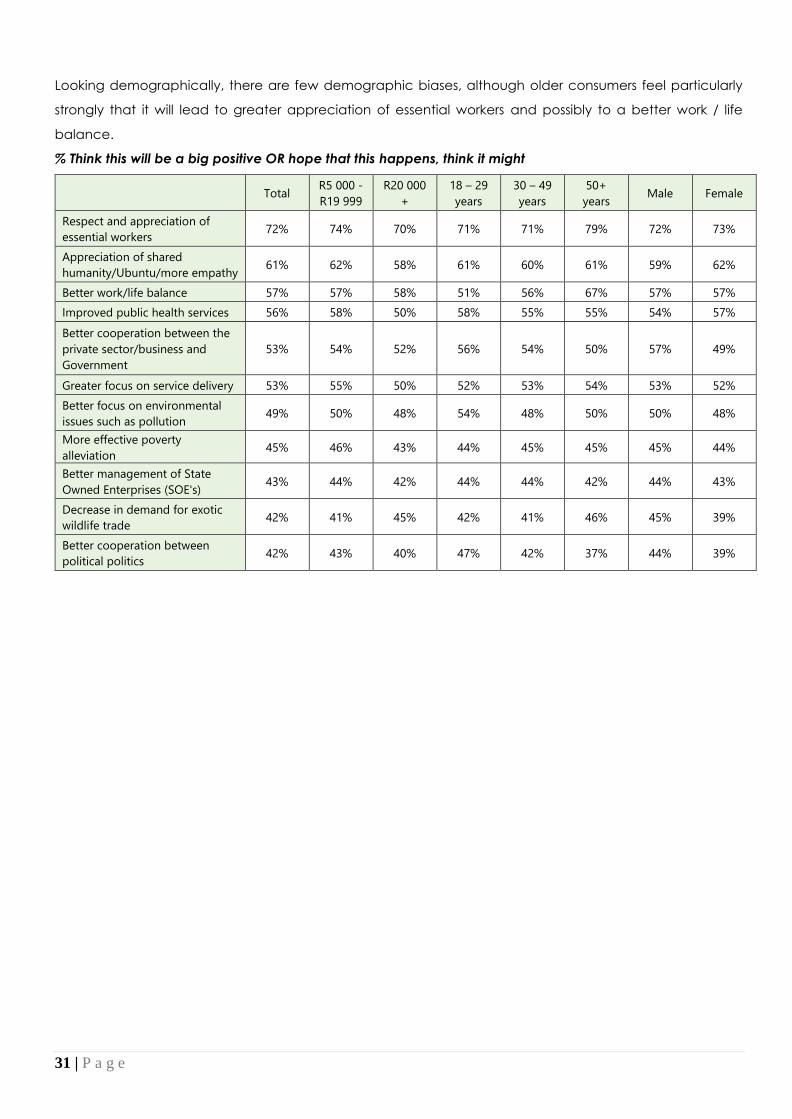
Looking demographically, there are few demographic biases, although older consumers feel particularly
strongly that it will lead to greater appreciation of essential workers and possibly to a better work / life
balance.
% Think this will be a big positive OR hope that this happens, think it might
Total R5 000 -
R19 999
R20 000
+
18 – 29
years
30 – 49
years
50+
years Male Female
Respect and appreciation of
essential workers 72% 74% 70% 71% 71% 79% 72% 73%
Appreciation of shared
humanity/Ubuntu/more empathy 61% 62% 58% 61% 60% 61% 59% 62%
Better work/life balance 57% 57% 58% 51% 56% 67% 57% 57%
Improved public health services 56% 58% 50% 58% 55% 55% 54% 57%
Better cooperation between the
private sector/business and
Government
53% 54% 52% 56% 54% 50% 57% 49%
Greater focus on service delivery 53% 55% 50% 52% 53% 54% 53% 52%
Better focus on environmental
issues such as pollution 49% 50% 48% 54% 48% 50% 50% 48%
More effective poverty
alleviation 45% 46% 43% 44% 45% 45% 45% 44%
Better management of State
Owned Enterprises (SOE's) 43% 44% 42% 44% 44% 42% 44% 43%
Decrease in demand for exotic
wildlife trade 42% 41% 45% 42% 41% 46% 45% 39%
Better cooperation between
political politics 42% 43% 40% 47% 42% 37% 44% 39%
32 | P a g e
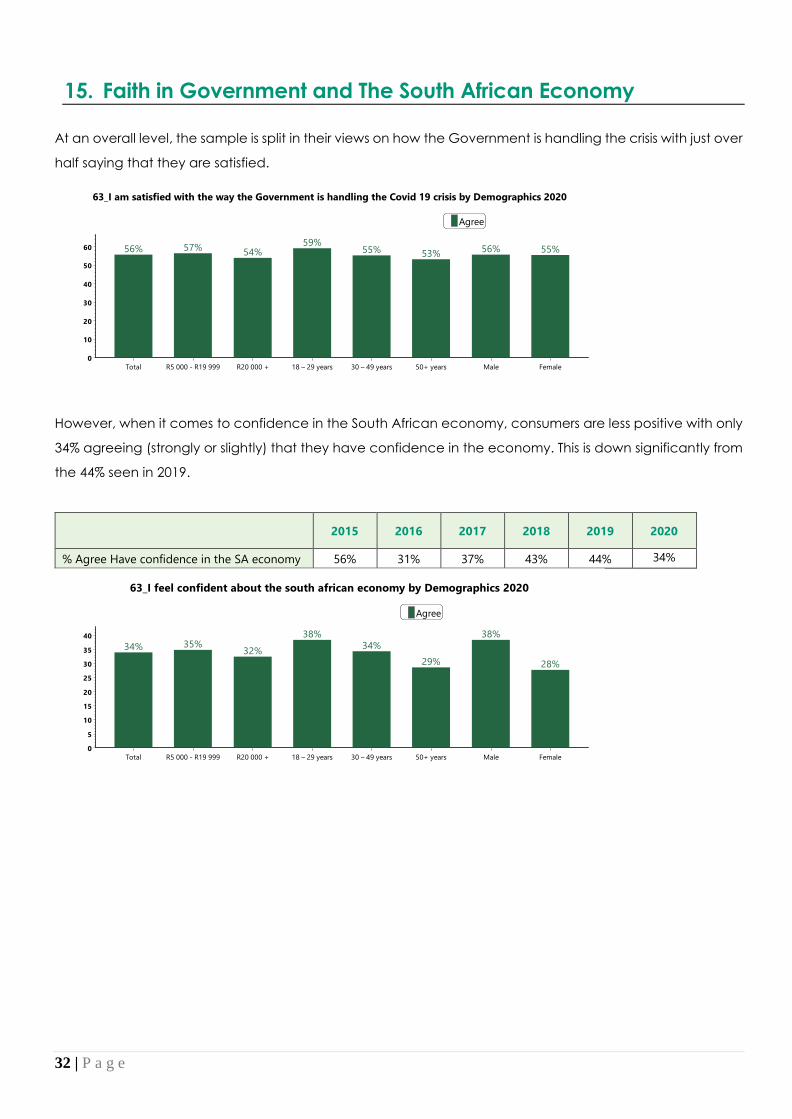
15. Faith in Government and The South African Economy
At an overall level, the sample is split in their views on how the Government is handling the crisis with just over
half saying that they are satisfied.
However, when it comes to confidence in the South African economy, consumers are less positive with only
34% agreeing (strongly or slightly) that they have confidence in the economy. This is down significantly from
the 44% seen in 2019.
2015 2016 2017 2018 2019 2020
% Agree Have confidence in the SA economy 56% 31% 37% 43% 44% 34%
63_I am satisfied with the way the Government is handling the Covid 19 crisis by Demographics 2020Old Mutual Covid 19 Database
Base - RMM or PF (Segments)
63_I am satisfied with the way the Government is handling the Covid 19 crisis Agree
56% Total57% R5 000 - R19 99954% R20 000 +59% 18 – 29 years55% 30 – 49 years53% 50+ years56% Male55% Female
Demographics 2020
Total R5 000 - R19 999 R20 000 + 18 – 29 years 30 – 49 years 50+ years Male Female
%
60
50
40
30
20
10
0
56% 57%54%
59%55% 53%
56% 55%
63_I feel confident about the south african economy by Demographics 2020Old Mutual Covid 19 Database
Base - RMM or PF (Segments)
63_I feel confident about the south african economy Agree
34% Total35% R5 000 - R19 99932% R20 000 +38% 18 – 29 years34% 30 – 49 years29% 50+ years38% Male28% Female
Demographics 2020
Total R5 000 - R19 999 R20 000 + 18 – 29 years 30 – 49 years 50+ years Male Female
%
40
35
30
25
20
15
10
5
0
34% 35%32%
38%
34%
29%
38%
28%