fundamentals and advances in magnetic hyperthermia
TRANSCRIPT

Fundamentals and advances in magnetic hyperthermiaE. A. Périgo, G. Hemery, O. Sandre, D. Ortega, E. Garaio, F. Plazaola, and F. J. Teran Citation: Applied Physics Reviews 2, 041302 (2015); doi: 10.1063/1.4935688 View online: http://dx.doi.org/10.1063/1.4935688 View Table of Contents: http://scitation.aip.org/content/aip/journal/apr2/2/4?ver=pdfcov Published by the AIP Publishing Articles you may be interested in Alternating current magnetic susceptibility and heat dissipation by Mn1− x Zn x Fe2O4 nanoparticles forhyperthermia treatment J. Appl. Phys. 117, 17D157 (2015); 10.1063/1.4919327 The fabrication and characterization of stable core-shell superparamagnetic nanocomposites for potentialapplication in drug delivery J. Appl. Phys. 117, 17D139 (2015); 10.1063/1.4917264 Engineering of gadofluoroprobes: Broad-spectrum applications from cancer diagnosis to therapy Appl. Phys. Lett. 104, 023703 (2014); 10.1063/1.4861881 Effect of the distribution of anisotropy constants on hysteresis losses for magnetic hyperthermia applications Appl. Phys. Lett. 103, 142417 (2013); 10.1063/1.4824649 Enhancing cancer therapeutics using size-optimized magnetic fluid hyperthermia J. Appl. Phys. 111, 07B306 (2012); 10.1063/1.3671427
This article is copyrighted as indicated in the article. Reuse of AIP content is subject to the terms at: http://scitation.aip.org/termsconditions. Downloaded to IP:
158.64.77.122 On: Tue, 01 Dec 2015 08:52:59
APPLIED PHYSICS REVIEWS
Fundamentals and advances in magnetic hyperthermia
E. A. P�erigo,1,a) G. Hemery,2,3 O. Sandre,2,3 D. Ortega,4,5,6 E. Garaio,7 F. Plazaola,7
and F. J. Teran4,5
1Physics and Material Sciences Research Unit, University of Luxembourg, L-1511 Luxembourg, Luxembourg2Univ. Bordeaux, LCPO UMR 5629, ENSCBP 16 Avenue Pey Berland, F-33600 Pessac, France3CNRS, Laboratoire de Chimie des Polymeres Organiques, UMR 5629, F-33600 Pessac, France4iMdea-Nanociencia, Campus Universitario de Cantoblanco, 28049 Madrid, Spain5Nanobiotecnolog�ıa (IMDEA-Nanociencia), Unidad Asociada al Centro Nacional de Biotecnolog�ıa (CSIC),Madrid 28049, Spain6Institute of Biomedical Engineering, University College London, Gower Street, London WC1E 6BT,United Kingdom7Elektrizitatea eta Elektronika Saila, UPV/EHU, P.K. 644, Bilbao, Spain
(Received 24 April 2015; accepted 8 October 2015; published online 30 November 2015)
Nowadays, magnetic hyperthermia constitutes a complementary approach to cancer treatment. The
use of magnetic particles as heating mediators, proposed in the 1950s, provides a novel strategy for
improving tumor treatment and, consequently, patient’s quality of life. This review reports a broad
overview about several aspects of magnetic hyperthermia addressing new perspectives and the
progress on relevant features such as the ad hoc preparation of magnetic nanoparticles, physical
modeling of magnetic heating, methods to determine the heat dissipation power of magnetic
colloids including the development of experimental apparatus and the influence of biological
matrices on the heating efficiency. VC 2015 AIP Publishing LLC.
[http://dx.doi.org/10.1063/1.4935688]
TABLE OF CONTENTS
NOMENCLATURE . . . . . . . . . . . . . . . . . . . . . . . . . . . . . 1
I. INTRODUCTION . . . . . . . . . . . . . . . . . . . . . . . . . . . . 2
II. PREPARATION OF IRON OXIDE-BASED
MAGNETIC NANOPARTICLES,
FUNCTIONALIZATION, AND
CHARACTERIZATION . . . . . . . . . . . . . . . . . . . . . . 3
A. Synthesis of iron oxide nanocrystals . . . . . . . 3
1. Co-precipitation method . . . . . . . . . . . . . . . 4
2. Nano-template methods . . . . . . . . . . . . . . . 4
3. Hydrothermal method . . . . . . . . . . . . . . . . . 5
4. Thermal decomposition method . . . . . . . . 5
5. Polyol method . . . . . . . . . . . . . . . . . . . . . . . 7
6. Combustion methods. . . . . . . . . . . . . . . . . . 8
B. Surface modification of iron oxide MNPs . . 9
III. PROGRESS IN MAGNETIC
HYPERTHERMIA PHYSICAL MODELS. . . . . . 10
A. Modeling heat dissipation in MNPs. . . . . . . . 10
B. Modeling in vivo heat transfer . . . . . . . . . . . . 13
C. Current trends: Modeling interparticle
interactions . . . . . . . . . . . . . . . . . . . . . . . . . . . . . 17
IV. PHYSICAL CHARACTERIZATION OF MNPS
AND ITS TECHNICAL APPROACH . . . . . . . . . 18
A. SAR measurement. . . . . . . . . . . . . . . . . . . . . . . 21
1. Calorimetric methods for SAR
measurement. . . . . . . . . . . . . . . . . . . . . . . . . 21
2. Magnetometric methods for SAR
measurement. . . . . . . . . . . . . . . . . . . . . . . . . 23
V. INFLUENCE OF BIOLOGICAL MATRICES
ON THE MAGNETIC HEATING EFFICIENCY 24
A. Protein adsorption onto MNP surface . . . . . . 24
B. MNP cellular processing . . . . . . . . . . . . . . . . . 25
C. MNP biotransformation . . . . . . . . . . . . . . . . . . 28
VI. FINAL REMARKS AND OUTLOOK . . . . . . . . . 29
NOMENCLATURE
A Area enclosed by the hysteresis loop
AMF Alternating magnetic field
B Weighting coefficient
B Magnetic density flux
c Nanoparticles mass concentration
C Heat capacity
f Frequency
Fo Fourier number
H0 Maximum magnetic field intensity
IN Damaged normal tissue volume above the pre-
defined necrosis temperature
IT Tumor volume with a temperature above a pre-
defined threshold temperature
ILP Intrinsic loss power
Jo Joule number
K Uniaxial anisotropy constant (J m�3)a)Author to whom correspondence should be addressed. Electronic mail:
[email protected]. Tel.: 352 46 66 44 6992. Fax: 352 46 66 44 6330.
1931-9401/2015/2(4)/041302/35/$30.00 VC 2015 AIP Publishing LLC2, 041302-1
APPLIED PHYSICS REVIEWS 2, 041302 (2015)
This article is copyrighted as indicated in the article. Reuse of AIP content is subject to the terms at: http://scitation.aip.org/termsconditions. Downloaded to IP:
158.64.77.122 On: Tue, 01 Dec 2015 08:52:59

kB Boltzmann constant
Ks Surface anisotropy constant (J m�2)
L(n) Langevin equation
LRM Linear response model
m Mass of nanoparticles
M(t) Dynamic magnetization
Ms Saturation magnetization
MH Magnetic hyperthermia
(M)NP(s) (Magnetic) nanoparticle (s)
MRI Magnetic resonance imaging
Qmet, Qext Heat flows from metabolism and spatial heat-
ing, respectively
SAR Specific absorption rate
SHP Specific heat power
SLP Specific loss power
SPM Superparamagnetic
SWM Stoner-Wohlfarth model
TGA Thermogravimetric analysis
V Particle volume
l Magnetic moment
l0 Magnetic permeability of vacuum
n Langevin’s parameter
qb, xb, Tb Arterial blood density, perfusion rate, and
temperature
s Effective relaxation time
s0 Attempt time
sB Brown relaxation time
sN N�eel relaxation time
C Ratio of the Fourier number to the Joule
number
u Volume fraction of the particles in the colloidal
suspension
/ Magnetic flux that crosses the pick-up coil
X Electromagnetic-to-thermal energy efficiency
parameter
x Angular frequency of the alternating magnetic
field
v0 Steady susceptibility
I. INTRODUCTION
In medical oncology, the term hyperthermia refers to a
therapeutic modality by which a given region of interest is
subjected to a temperature (T) increased above 40 �C.1,2
Historically, it is believed that the oldest description about
the use of hyperthermia is in Edwin Smith’s surgical papyrus
indicating the treatment of breast cancer.3 A more recent mo-
dality is the magnetic hyperthermia (MH), where the temper-
ature increase is produced by applying an alternating
magnetic field (AMF) to a magnetic material, typically iron
oxide. As in many other areas—namely, materials science,4
energy,5 or health6-the progresses made in nanotechnology
have taken MH to a much higher degree of development. For
example, the application of magnetic nanoparticles (MNPs)
in medicine is moving towards targeting body regions other-
wise difficult to reach, and chemical manipulation at the
nanoscale has conferred the ability to conjugate biomole-
cules like antibodies for a more effective therapy or to ac-
complish specific targeting. In this manner, MNPs may
simultaneously combine several theranostic functionalities
such as drug-carriers,7 contrast agents for magnetic reso-
nance imaging (MRI),8 and/or magnetic heating agents.9
Considering the extent of the treated region, hyperther-
mia can be classified into three types: (a) whole body hyper-
thermia (achieved by using thermal chambers or blankets),
(b) partial hyperthermia (applied to treat locally advanced
cancer by perfusion or microwaves), and (c) local hyperther-
mia (mainly for smaller volumes than organs). The tempera-
ture increase in local hyperthermia—the one most frequently
evaluated—might be accomplished by distinct approaches
based on the use of ultrasound, microwaves, or near-infrared
radiation.10,11 Even though these modalities have been incor-
porated into the clinical practice to treat a relatively wide
range of cancer types, nowadays MH has some fundamental
advantages over these when locally dealing with solid
tumors: (i) the AMF penetration depth higher than any other
activation mechanism (light or acoustic waves), allowing to
reach deeper tissues; (ii) administration of MNPs in a wide
concentration range and sustained may stay at the tumor site
for repeated therapy sessions; (iii) size-driven magnetic
properties at the nanoscale determining the heating capabil-
ities; (iv) precise control of size and morphology as well as
surface modification for diverse goals including biocompati-
bility, providing chemical groups for attaching biomolecules,
and minimizing blood proteins adsorption.
The use of MNPs as a minimally invasive agent was ini-
tially addressed by Gilchrist et al. in 1957 (Refs. 12 and 13)
giving rise to MH. This seminal work pointed out some chal-
lenges which are still under discussion by the scientific com-
munity concerning the application of MH in living beings:
(i) the heat release should be the highest possible at the low-
est particles dose; (ii) safety of AMF (with high voltages pro-
ducing eddy currents in conducting media14); (iii) reliability
for providing a precisely controlled intratumoral heat expo-
sure mediated by MNPs.14
With the proposition of MH as a potential cancer treat-
ment, the establishment of new materials and devices has
been addressed with a continuous effort. A brief analysis
about MH literature illustrated in Fig. 1 shows that in the pe-
riod 1973–2013, more than 3000 scientific manuscripts were
FIG. 1. Number of published scientific manuscripts during the period
1973–2013 using the search term “magnetic hyperthermia.” Copyright ISI.
041302-2 P�erigo et al. Appl. Phys. Rev. 2, 041302 (2015)
This article is copyrighted as indicated in the article. Reuse of AIP content is subject to the terms at: http://scitation.aip.org/termsconditions. Downloaded to IP:
158.64.77.122 On: Tue, 01 Dec 2015 08:52:59

published about MH, followed by an exponential growth as
of the beginning of XXIst century. As can be seen, MH has
never been so much in the spotlight as now.
Understanding MH, in a broad sense, requires the con-
sideration of distinct perspectives. Thus, this review will
address the physical, chemical, engineering, technological,
and biological aspects of MH discussing fundamental fea-
tures about material synthesis (basically iron oxide nanopar-
ticles—Section II), MH physical models (Section III),
instrumental aspects of the physical characterization of
MNPs (Section IV), and the influence of biological matrices
on the heating efficiency (Section V). At last, final remarks
and perspectives will raise some key aspects that deserve fur-
ther clarifications.
II. PREPARATION OF IRON OXIDE-BASED MAGNETICNANOPARTICLES, FUNCTIONALIZATION, ANDCHARACTERIZATION
The choice of the magnetic material to be employed in
MH is virtually infinite since, in principle, every magnetic
compound can be synthesized under nanoparticulate form by
chemical or physical procedures. However, a set of factors
has to be taken into account for accomplishing safety
requirements, especially biocompatibility. In this sense, iron
oxides become the most prominent candidates and are
reviewed next in further details.
Iron is the fourth most common element in the Earth’s
crust, existing in oxidation states from �2 to þ6 with com-
mon oxidation states of þ2 and þ3. Ochre composed of anti-
ferromagnetic iron oxo-hydroxide MNPs (acicular haematite
nano-spindles, goethite nano-laths, w€ustite nanospheres) are
used as a natural pigment from the early ages of mankind
and thus can be seen as the forerunners of manufactured and
environmental MNPs.15 Iron oxide-based MNPs combine
several physicochemical aspects leading to attractive proper-
ties. These MNPs typically have two or three dimensions
under 100 nm, which brings a high surface-to-volume ratio
and different properties than those from bulk iron oxide ma-
terial. Human metabolism maintains the homeostasis of iron,
controlling this necessary (but potentially toxic in excess)
element. The human body is able to tolerate the oral adminis-
tration of iron at 5 mg per kg of body mass,16 well below the
limit of acute toxicity in the range of 300–600 mg/kg of
body mass as determined on Wistar rats with FeSO4 as the
source of iron.17 This “iron pool” of the organism consists of
both molecular iron ions (hemoglobin) and in a nanoparticu-
late form—ferritin, which is a protein capside encapsulating
an antiferromagnetic ferrihydrite core. This unique biocom-
patibility feature, along with its magnetic properties, makes
the iron oxide MNPs excellent candidates for biomedical
applications such as contrast agents for MRI, cell labeling,
magnetic separation, and drug delivery assisted by DC or
AC magnetic fields or magnetic heating mediators.18,19
However, the discussion will be focused on MH in this docu-
ment, and the considered materials will mostly consist in ei-
ther pure iron oxides or ferrites of the general formula
MFe2O4, where M stands for another transition metal, or two
different metals in the case of either mixed ferrites
(M,M0)Fe2O4 or core-shells MFe2O4@M0Fe2O4.
Frenkel and Dorfman were the first to predict in 1930
that a particle of a ferromagnetic material below a critical
size consists of a single magnetic domain.20 It is accepted
that a ferromagnetic particle of iron oxide with a radius
under 30 nm is a single domain particle,21 meaning that
under any magnetic field it will maintain a state of uniform
magnetization (i.e., all the magnetic moments within the par-
ticles are pointing towards the same direction). A colloidal
assembly of this type of nanoparticles suspended in a liquid
is considered “ferrofluid” as long as it stays in a monophasic
state (no sedimentation or aggregation). At thermal equilib-
rium and under no external magnetic field applied, there is
no net magnetization of the ferrofluid due to thermal agita-
tion leading to random orientation of the grains and thus of
their magnetic moments when considering the whole popula-
tion of MNPs. The magnetization of single domains particles
in thermodynamic equilibrium is identical to that of para-
magnetic atoms or ions, except that extremely large
moments are involved, of several hundred to thousand Bohr
magnetons.22 Such thermal equilibrium named superpara-magnetism follows the so-called Langevin’s theory of para-
magnetism when the MNPs are in a dilute state where
dipolar interactions can be neglected.23 The properties exhib-
ited by iron oxide MNPs make them good candidates for ei-
ther diagnosis or therapy as MRI contrast agents to assist
diagnosis and for radiofrequency MH to remove cancerous
cells by applying a thermal shock mediated by the MNPs. It
is possible to engineer theranostic systems in which both of
these applications are integrated in the same nanostructure
for simultaneous detection and treatment of diseases.24
A. Synthesis of iron oxide nanocrystals
Superparamagnetic (SPM) MNPs can be obtained by
various physical or chemical methods. Among others, the
physical ones consist in top-down processes such as laser-
induced ablation of macroscopic targets of iron or iron
oxides25 giving polycrystalline MNPs with wide size distri-
butions, mechanical milling of bulk iron oxide26 with subse-
quent mechano-chemical effect reducing the degree of
crystallinity compared to the starting material (also existent
in other compounds27). Moskowitz and Rosensweig, in col-
laboration with NASA, were the first in 1965 to prepare fer-
rofluids intended to prepare magnetically driven pumps in
the Explorer-17 satellites, by a grinding procedure of iron
oxide powders for several weeks in the presence of surfac-
tants.28 Twelve years later, the 1st International Advanced
Course on the Thermomechanics of Magnetic Fluids took
place in 1977 in Italy, gathering experimentalists and theo-
rists from both sides of “the iron curtain,” launching the
cycle of the International Conference on Magnetic Fluids
that since then was repeated worldwide on a regular basis.
Bottom-up processes consisting in the synthesis of iron
oxide MNPs from iron ions or molecular precursors offer the
great advantage of controlling the composition, size, and
shape to tune the desired properties by means of the control
of the synthesis conditions. The most described synthesis
041302-3 P�erigo et al. Appl. Phys. Rev. 2, 041302 (2015)
This article is copyrighted as indicated in the article. Reuse of AIP content is subject to the terms at: http://scitation.aip.org/termsconditions. Downloaded to IP:
158.64.77.122 On: Tue, 01 Dec 2015 08:52:59

routes comprise the aqueous ferrous and ferric salts alkaline
co-precipitation, the thermal decomposition of organometal-
lic complexes, the alkaline hydrolysis in a polyol solvent,
and the post-synthesis hydrothermal treatment (i.e., under
high pressure). These methods will be described in further
details in the following part. In all synthesis methods, the so-
called “LaMer model” is often evoked to interpret the size
distributions of the synthesized MNPs: originally built to
describe the mechanism of formation of monodisperse
hydrosols,29 it was extensively used to explain the formation
of any type of MNPs from (poly)atomic precursors. This
model states that different processes are involved during the
precipitation of MNPs: nucleation, crystal growth, and
Ostwald ripening. Ideally nucleation and crystal growth steps
are separated, meaning that a burst of nucleation occurs at
the early synthesis stage, followed by crystal growth through
diffusion of the reactants to the nuclei. Because the physical
properties of the nanocrystals are strongly dependent upon
their shape, size, and size distributions, many publications
have reported different synthetic pathways in order to pro-
duce good quality materials with narrower size distributions,
leading to controlled magnetic behaviors. Some of these
findings are described below.
1. Co-precipitation method
The alkaline co-precipitation of ferrous and ferric salts
is widely used because it is a convenient and reproducible
pathway to synthesize MNPs and obtain them directly dis-
persed in aqueous media. It is commonly referred to as
“Massart’s method,” as Massart reported it first in 1981.30 A
variant was proposed quite simultaneously by Molday and
Mackenzie in presence of a polysaccharide (Dextran).31 This
aqueous route to colloidal magnetite can be scaled-up to pro-
duce even kilograms of iron oxide MNPs; thus, it is the
method used by industries to produce commercial iron oxide
contrast agents with well-adjusted parameters such as the
mixing and addition rates of reactants to produce perfectly
calibrated and reproducible batches. The precursors used are
ferric (Fe3þ) and ferrous (Fe2þ) chlorides, sulfates, or
nitrates, first dissolved in an acidic aqueous solution to pre-
vent the individual precipitation of hydroxides whose solu-
bility products are very high, respectively, pKs¼ 34 for
Fe(OH)2 and pKs¼ 44 for Fe(OH)3, respectively.32 Then,
they are “co-precipitated” (meaning the two valences of iron
ions together) under the addition of a strong base (commonly
NH4OH or NaOH), according to the reaction
2 Fe3þ þ Fe2þ þ 8 OH� ! Fe3O4 þ 4 H2O: (2.1)
Controlling the salt metathesis of iron precursors into
iron hydroxides followed by sol-gel reaction is not a straight-
forward task because it occurs instantaneously upon mixing;
thus, the conditions have to be adequately set. The Fe3þ/
Fe2þ ratio, the nature of the anions in the salts, along with
the final pH of the solution (dictated by the molar ratio R of
OH� ions to total iron ions compared to the stoichiometric
value R¼ 8/3), temperature, mixing rates, ionic strength and
optional presence of ligands (citrate, tartrate, etc.) greatly
affects the nature of the nanocrystals obtained, including
their size and shape. Magnetite (Fe3O4) is commonly synthe-
sized this way, but an inadequate procedure can also lead to
another non-magnetic iron oxo-hydroxide phase (goethite a-
FeOOH or akaganeite Fe8O8OH8Cl1.35) or oxide (hematite
a-Fe2O3) phase.32 Maghemite (c-Fe2O3) can be obtained
from magnetite by simple oxidation in an acidic medium
with Fe3þ nitrate salts, or by leaving magnetite nanocrystals
in contact with oxygen from ambient air, accelerating the
formation of the thermodynamically favored maghemite
compound.
The use of stabilizers during the co-precipitation process
has been reported as a way to produce good quality materials
with a narrower size distribution. Efficient stabilizers include
polyvinyl alcohol (PVA), tri-sodium salt citrate, tartrate, or
other multivalent carboxylate ions. An important criterion to-
ward the selection of these organic additives is their hydro-
philic or lipophilic affinity, which determines the final
dispersability of the MNPs in organic or aqueous solvents.
For biomedical applications, hydrophilic ligands are used to
ease the dispersion of the resulting particles in aqueous sys-
tems. Regarding shape and size control, co-precipitated sam-
ples under electron microscope usually exhibit “rock-like”
MNPs with broad size-dispersity, corresponding to diameters
ranging from 5 to 15 nm. As a post-synthesis process, a size-
grading procedure based on the addition of an electrolyte
allows to obtain narrow size-dispersities. The addition of an
electrolyte in excess screens out the electrostatic repulsions
between the iron oxide MNPs and leads to a liquid-liquid
phase separation in two fractions, respectively, named S
(“supernatant”) and C (“culot”), which are enriched with the
lower sizes (respectively, larger sizes) fractions of the initial
distribution as shown in Fig. 2. This was the method
employed in one of the first articles describing the size
effects on magnetic heating efficiency,33 in agreement with
Rosensweig’s linear relaxation model.34
2. Nano-template methods
Several template synthesis methods have been described
in the literature in order to orient the particles’ geometry and
to narrow the size distribution, as compared to co-
precipitation in batch leading to a broad range of diameters.
The use of pre-existing nanostructures as nano-molds was
recently reviewed for organic templates, i.e., surfactants and
polymers.35 Inorganic templates such as mesoporous silica
matrixes synthesized by the sol-gel route have also been tried
out, since they enable to perform combustion synthesis at
temperatures as high as 400 �C while avoiding the issue of
aggregation and sintering of the nanocrystals.36 Regarding
micro-emulsions, these are composed of a nano-sized, ther-
modynamically stable dispersion of two immiscible solvents
(water/oil) stabilized with a surfactant (dodecyl sulfate,
Triton X-100, etc.) that can be used as a medium to produce
MNPs. In water-in-oil micro-emulsions, the iron precursor is
solubilized in the water droplets forming confined reactors.
The molar ratio of water-to-surfactant determines the size of
the reverse micelles. Upon addition of a strong base, co-
precipitation is initiated. The precipitating agent can be
041302-4 P�erigo et al. Appl. Phys. Rev. 2, 041302 (2015)
This article is copyrighted as indicated in the article. Reuse of AIP content is subject to the terms at: http://scitation.aip.org/termsconditions. Downloaded to IP:
158.64.77.122 On: Tue, 01 Dec 2015 08:52:59

introduced directly in the emulsion of precursors or as a stabi-
lized emulsion. In the latter case, the droplets containing the
iron salts and the droplets containing the base collide and coa-
lesce together, allowing the formation of MNPs. Since the
size of the micelles is in the nanometer range, MNPs as small
as 7.4 nm can be produced.37 However, this method requires
large amounts of solvents for small yields with a relatively
low control of shape, crystallinity, and monodispersity.
3. Hydrothermal method
Single crystals can be synthesized from aqueous solu-
tions at mild temperature and then transferred into a Teflon-
lined stainless autoclave to perform a hydrothermal treatment.
Combining a high temperature (usually around 200 �C) and a
high vapor pressure, such treatment favors the Ostwald ripen-
ing, by which the smallest crystallites are dissolved into the
largest ones, increasing the average size and the crystallinity.
This cost-effective and environmentally friendly route ini-
tially developed by von Schafh€autl in 1845 to grow micro-
scopic quartz crystals has been used to produce various
ferrites,38,39 magnetite,40,41 and maghemite42 nanocrystals
with good water solubility and high crystallinity. Typically
ferric and ferrous salts are mixed with a controlled molar ratio
in an aqueous solution and precipitated upon addition of a
base, similar as in the co-precipitation method. The MNPs are
then transferred into an autoclave for further aging at temper-
atures ranging from 150 �C to 200 �C under pressure. Starting
with nanocrystals of 12 nm, the hydrothermal treatment leads
to particles of 39 nm with ferrimagnetic behavior at room
temperature.40 The hydrothermal method leads to MNPs with
very large sizes, good crystallinity, and high saturation mag-
netization. However, although the nucleation and growth
steps are well separated (different conditions of temperature
and pressure), the particles after hydrothermal treatment ex-
hibit rounded (as opposed to faceted) yet rather ill-defined
shapes as depicted in Fig. 3. Therefore, this method still needs
adjustments to limit the growth at the step of quasi-spherical
particles of intermediate sizes (e.g., 20 nm).
4. Thermal decomposition method
Originally introduced by Heyon43 and concomitantly by
Sun,44 the thermal decomposition of various organometallic
complexes (iron pentacarbonyl,43 acetylacetonate,44 oleate,45
or stearate46) in apolar organic solvents in the presence of
ligands (oleic acid and/or oleyl amine) was reported as a syn-
thesis path leading to the best geometrically defined nanocrys-
tals. These syntheses are performed at reflux of high boiling
point solvents, commonly 1-octadecene (Teb¼ 318 �C), octyl
ether (Teb¼ 288 �C), or diphenyl ether (Teb¼ 258 �C). Several
morphologies can be obtained from perfectly spherical43–46 to
slightly polyhedral46 or prismatic47 and cubic48–50 by control-
ling the synthesis parameters. As seen on Fig. 4, the nanocube
morphology decreases the surface disorder and/or spin canting
effect, which was interpreted as the origin of the observed
decrease of the magnetic anisotropy constant as compared to a
spherical particle of same volume,51 and possibly of the over-
all magnetic heating properties of the dispersions.48,52 For all
these syntheses, the reactants can be introduced following
a “hot injection” protocol at the high reaction temperature,
leading to a rapid formation of nuclei called “burst,” caused
by the sudden supersaturation of the solution with precursors.
Alternatively, reactants can be introduced following a
“heating-up” protocol: the solvent, the precursors, and the
ligands are mixed at a lower temperature before being heated
at a controlled rate up to the reaction temperature, leading to
the formation of nanocrystals. Compared to the other routes,
the thermal decomposition method has the superior advantage
to dissociate the nucleation step and crystal-growth step which
occur at different temperatures (ca. 200–240 �C for the
decomposition of the organometallic complex leading to pre-
cursors and up to 300 �C for the growth, respectively).
Whatever the source of iron (FeCO5, Fe(acac)3, FeCl3, etc.), it
has been hypothesized that at the temperature at which pyroly-
sis occurred, iron carboxylate salts of the ligand used (e.g.,
iron oleate) were the real precursors.53 Iron oleate complex
can be produced before reaction from the inexpensive
FeCl3�6H2O chemical,49 but it has to be purified beforehand
in order to remove chlorine anions from the medium. Fatty
acids such as oleic, decanoic, or lauric acid, possibly mixed
FIG. 2. Transmission electron microscopy images of iron oxide nanopar-
ticles synthesized by aqueous alkaline co-precipitation followed by a size-
sorting method based on ionic force induced phase-separation of (1)
5.3 6 1.0 nm, (2) 6.7 6 1.4 nm, (3) 8 6 1.7 nm, (4) 10.2 6 2.9 nm, and (5)
16.5 6 7.5 nm.33 Reproduced with permission from Fortin et al., J. Am.
Chem. Soc. 129(9), 2628 (2007). Copyright 2007 American Chemical
Society.
041302-5 P�erigo et al. Appl. Phys. Rev. 2, 041302 (2015)
This article is copyrighted as indicated in the article. Reuse of AIP content is subject to the terms at: http://scitation.aip.org/termsconditions. Downloaded to IP:
158.64.77.122 On: Tue, 01 Dec 2015 08:52:59

with fatty amines like oleylamine or hexadecylamine, are
used as surfactants chemisorbed on the surface of the MNPs:
First, they can orient towards a specific morphology of the
MNPs by blocking the growth of certain crystallographic fac-
ets compared to others; then, at the end of reaction, they assist
the MNPs’ dispersion in organic solvents and prevent aggre-
gation by pointing outside into the solvent their non-polar
chains. It should be noted, however, that the seed-and-growth
technique consisting in adding more precursors to initially
synthesized seeds enables to increase the sizes, but an imper-
fect epithaxial growth (i.e., internal defects existing within the
crystals) can result in a poor magnetic response.54
In principle, the ratio of organometallic reagents, surfac-
tant(s), and solvent drives the morphology and sizes
obtained, but also other parameters like increasing the reac-
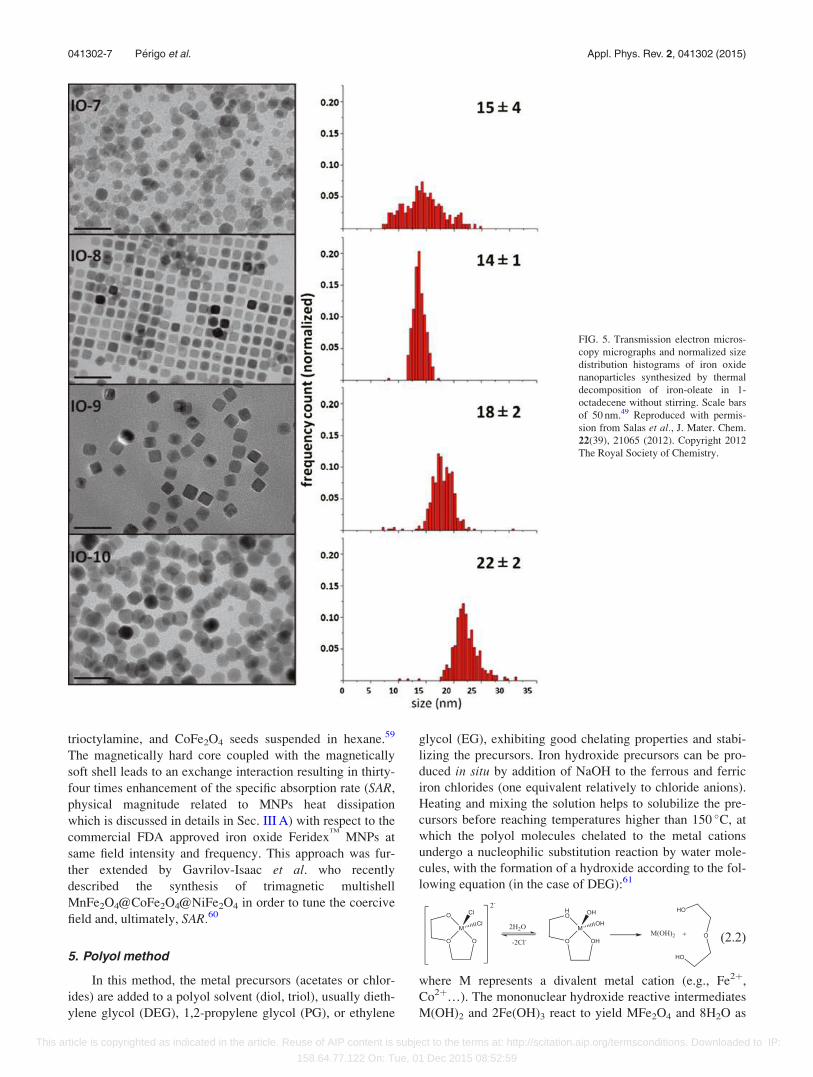
tion time in absence of stirring as indicated in Fig. 5.49 In
some cases, further oxidation improves the crystallinity of
the nanograins,43 as it is also the case by applying a magnetic
hyperthermia treatment that acts as an annealing process.54
MNPs obtained this way are dispersible in polar solvents and
are not water miscible, which is a limitation for biological
applications. Following a ligand-exchange strategy, fatty
acids can be exchanged with polar molecules, such as tetra-
methylammonium hydroxide (TMAOH) followed by adsorp-
tion of a synthetic polypeptide with a poly(aspartic acid)
block,55 or chemical grafting of charged organosilanes.56
Amphiphilic polymers can also be used as phase transfer
agents while keeping a good size-dispersity and colloidal
dispersion, such as poly-(maleic anhydride alt-1-octade-
cene).57 The use of multidendate ligands such as meso-2,3-
dimercaptosuccinic acid has also been reported.49,58
Lee et al. described the synthesis of ferrite@ferrite core-
shell MNPs by thermal decomposition of MnCl2 and
Fe(acac)3 in the presence of oleic acid, oleylamine,
FIG. 4. Transmission electron microscopy images of iron oxide nanocubes
synthesized by thermal decomposition of iron acetylacetonate, for cube edge
lengths of (a) 12 6 1 nm, (b) 19 6 3 nm, (c) 25 6 4 nm, and (d) 38 6 9 nm.
Panels (e) to (h) (scale bars of 50 nm) are the higher magnifications of sam-
ples shown in panels (a) to (d) (scale bar of 100 nm).48 Reproduced with per-
mission from Guardia et al., ACS Nano 6(4), 3080 (2012). Copyright 2012
American Chemical Society.
FIG. 3. Transmission electron micros-
copy images of maghemite (c-Fe2O3)
nanoparticles obtained by hydrother-
mal treatment (T¼ 200 �C, ratio of
Fe2þ/(Fe2þþFe3þ)¼ 0.7) for different
duration and pH: (a) 2 h, pH¼ 12 (par-
ticles that are re-dissolved at pH¼ 3);
(b) 2 h, pH¼ 12 (insoluble fraction);
(c) 24 h, pH¼ 12; (d) 2 h, pH¼ 14.42
Average diameters by TEM are: (a)
13 nm; (b) 22 nm; (c) 55 nm; and (d)
52 nm. Reproduced with permission
from Horner et al., J. Nanopart. Res.
11(5), 1247 (2009). Copyright 2009
Springer.
041302-6 P�erigo et al. Appl. Phys. Rev. 2, 041302 (2015)
This article is copyrighted as indicated in the article. Reuse of AIP content is subject to the terms at: http://scitation.aip.org/termsconditions. Downloaded to IP:
158.64.77.122 On: Tue, 01 Dec 2015 08:52:59
trioctylamine, and CoFe2O4 seeds suspended in hexane.59
The magnetically hard core coupled with the magnetically
soft shell leads to an exchange interaction resulting in thirty-
four times enhancement of the specific absorption rate (SAR,
physical magnitude related to MNPs heat dissipation
which is discussed in details in Sec. III A) with respect to the
commercial FDA approved iron oxide FeridexTM
MNPs at
same field intensity and frequency. This approach was fur-
ther extended by Gavrilov-Isaac et al. who recently
described the synthesis of trimagnetic multishell
MnFe2O4@CoFe2O4@NiFe2O4 in order to tune the coercive
field and, ultimately, SAR.60
5. Polyol method
In this method, the metal precursors (acetates or chlor-
ides) are added to a polyol solvent (diol, triol), usually dieth-
ylene glycol (DEG), 1,2-propylene glycol (PG), or ethylene
glycol (EG), exhibiting good chelating properties and stabi-
lizing the precursors. Iron hydroxide precursors can be pro-
duced in situ by addition of NaOH to the ferrous and ferric
iron chlorides (one equivalent relatively to chloride anions).
Heating and mixing the solution helps to solubilize the pre-
cursors before reaching temperatures higher than 150 �C, at
which the polyol molecules chelated to the metal cations
undergo a nucleophilic substitution reaction by water mole-
cules, with the formation of a hydroxide according to the fol-
lowing equation (in the case of DEG):61
(2.2)
where M represents a divalent metal cation (e.g., Fe2þ,
Co2þ…). The mononuclear hydroxide reactive intermediates
M(OH)2 and 2Fe(OH)3 react to yield MFe2O4 and 8H2O as
FIG. 5. Transmission electron micros-
copy micrographs and normalized size
distribution histograms of iron oxide
nanoparticles synthesized by thermal
decomposition of iron-oleate in 1-
octadecene without stirring. Scale bars
of 50 nm.49 Reproduced with permis-
sion from Salas et al., J. Mater. Chem.
22(39), 21065 (2012). Copyright 2012
The Royal Society of Chemistry.
041302-7 P�erigo et al. Appl. Phys. Rev. 2, 041302 (2015)
This article is copyrighted as indicated in the article. Reuse of AIP content is subject to the terms at: http://scitation.aip.org/termsconditions. Downloaded to IP:
158.64.77.122 On: Tue, 01 Dec 2015 08:52:59
in the co-precipitation reaction, the difference being that the
organic ligands are coordinating the iron oxide surface. The
equation also shows the necessity of a small amount of
water, thus of heating at reflux rather that in an open vessel.
After cooling down to room temperature, nanocrystals are
extracted before being dispersed in water. The approach is
similar to the thermal decomposition method previously
described, except that the as-produced MNPs have a polar
surface and are readily dispersible in aqueous solvents. The
oxidized products of the polyol still attached as a corona
wrapping the magnetic cores can be removed by extensive
washings for further functionalization of the iron oxide sur-
face. Magnetite, maghemite, nickel ferrite, and cobalt ferrite
have been reported to be synthesized this way with adjusta-
ble sizes and hyperthermic response at industrial scale.62
It has also been reported that the reaction of iron (II)
and (III) chloride salts in NaHDEG with traces of water pro-
duce well-defined nanocrystals later dispersible in water.63
NaHDEG is prepared by reaction of metallic sodium with
DEG. This synthesis produces small crystals between 3 and
8 nm, thus more interesting as MRI contrast agents than as
heat mediators. Cobalt ferrite (CoFe2O4) MNPs of different
size grades from 5.4 to 40 nm were also synthesized in DEG
from Co2þ and Fe3þ acetate complexes and further made
hydrophilic or lipophilic with suitable phosphonic and
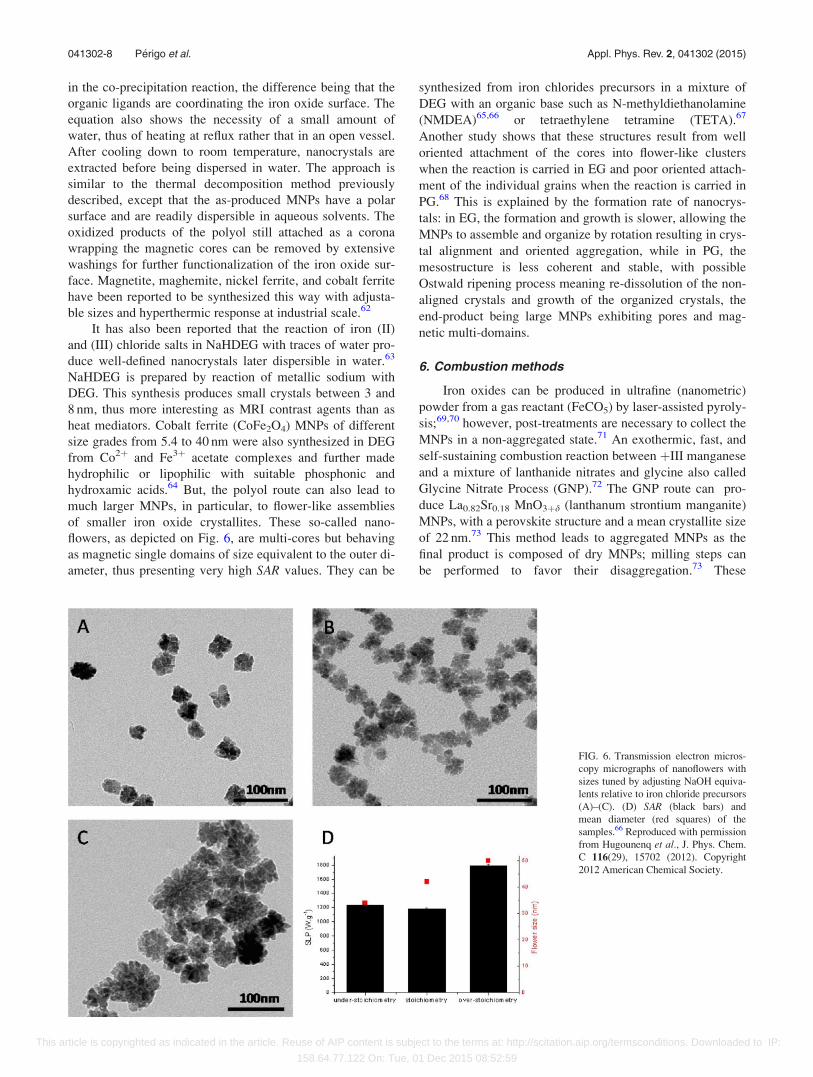
hydroxamic acids.64 But, the polyol route can also lead to
much larger MNPs, in particular, to flower-like assemblies
of smaller iron oxide crystallites. These so-called nano-
flowers, as depicted on Fig. 6, are multi-cores but behaving
as magnetic single domains of size equivalent to the outer di-
ameter, thus presenting very high SAR values. They can be
synthesized from iron chlorides precursors in a mixture of
DEG with an organic base such as N-methyldiethanolamine
(NMDEA)65,66 or tetraethylene tetramine (TETA).67
Another study shows that these structures result from well
oriented attachment of the cores into flower-like clusters
when the reaction is carried in EG and poor oriented attach-
ment of the individual grains when the reaction is carried in
PG.68 This is explained by the formation rate of nanocrys-
tals: in EG, the formation and growth is slower, allowing the
MNPs to assemble and organize by rotation resulting in crys-
tal alignment and oriented aggregation, while in PG, the
mesostructure is less coherent and stable, with possible
Ostwald ripening process meaning re-dissolution of the non-
aligned crystals and growth of the organized crystals, the
end-product being large MNPs exhibiting pores and mag-
netic multi-domains.
6. Combustion methods
Iron oxides can be produced in ultrafine (nanometric)
powder from a gas reactant (FeCO5) by laser-assisted pyroly-
sis;69,70 however, post-treatments are necessary to collect the
MNPs in a non-aggregated state.71 An exothermic, fast, and
self-sustaining combustion reaction between þIII manganese
and a mixture of lanthanide nitrates and glycine also called
Glycine Nitrate Process (GNP).72 The GNP route can pro-
duce La0.82Sr0.18 MnO3þd (lanthanum strontium manganite)
MNPs, with a perovskite structure and a mean crystallite size
of 22 nm.73 This method leads to aggregated MNPs as the
final product is composed of dry MNPs; milling steps can
be performed to favor their disaggregation.73 These
FIG. 6. Transmission electron micros-
copy micrographs of nanoflowers with
sizes tuned by adjusting NaOH equiva-
lents relative to iron chloride precursors
(A)–(C). (D) SAR (black bars) and
mean diameter (red squares) of the
samples.66 Reproduced with permission
from Hugounenq et al., J. Phys. Chem.
C 116(29), 15702 (2012). Copyright
2012 American Chemical Society.
041302-8 P�erigo et al. Appl. Phys. Rev. 2, 041302 (2015)
This article is copyrighted as indicated in the article. Reuse of AIP content is subject to the terms at: http://scitation.aip.org/termsconditions. Downloaded to IP:
158.64.77.122 On: Tue, 01 Dec 2015 08:52:59
ferromagnetic particles are of particular interest for MH as
their Curie temperature can be well adjusted by the lantha-
nide composition, thereby leading to “self-limited” nano-
heaters. However, the high toxicity of lanthanides and man-
ganese cations leads to the necessary coating of these MNPs
by an inert shell such as silica in order to be used in biomedi-
cal applications.
To complete this short brief overview of synthesis routes
towards MNPs and, more particularly, iron oxide MNPs,
some of them in this panel have been optimized to achieve
larger scale. With this goal of scale-up in mind, microwave
heating has been tried out instead of conventional heating in
order to perform a homogeneous heating even with a large
batch, as for the thermal decomposition of Fe(acac)3 (Ref.
74) and the alkaline co-precipitation.75 Overall, all these syn-
theses present various advantages and limitations, and a
compromise must be chosen between the amount of MNPs
produced and the degree of control of sizes and/or shapes
and, of utmost importance for MH, of their magnetic proper-
ties. One more aspect needing to be highlighted in this part
deals with the coating methods of MNPs. This is not only
important to disperse them in hydrophilic media for biologi-
cal applications but also on the physical point of view, to
tune the average distance between the MNPs in the disper-
sion: the ratio of mean particle diameter to their average
center-to-center distance indeed controls the amplitude of
their magnetic dipolar interaction, scaling like the 3rd power
of this ratio for ferri- or ferromagnetic MNPs, and the 6th
power for SPM MNPs.76 As will be developed in Section
III C, these dipolar interactions that are weak in dilute indi-
vidually dispersed MNPs, and on the contrary very high in
densely clustered MNPs, have a non-negligible impact on
the MH efficiency by slowing down the relaxation dynamics
of the moments and/or increasing the shape component of
the magnetic anisotropy and the hysteresis losses.
B. Surface modification of iron oxide MNPs
Several natural and synthetic polymers have been tested
to modify the surface of MNPs to improve their colloidal sta-
bility first in vitro (in pH buffers, then in cell culture media
supplemented with serum proteins) and eventually in vivo (in
blood circulation), while being biocompatible: polysaccha-
rides (e.g., Dextran31), poly(vinylpyrrolidone) (PVP) or
poly(ethylene glycol)s (PEG), poly(ethers) (e.g., poly(ethyl-
ene oxide), poly(oxazoline) (POxa), or poly(glycidol)) have
been investigated for giving “stealth” properties to MNPs,
i.e., repulsion towards certain proteins of blood serum (opso-
nins), whose role is to mark foreign bodies by strongly
adsorbing onto their surface so that they are recognized by
white blood cells and go through elimination pathways.
Once the circulation half-life is improved, it is possible to
graft ligands with a specific affinity toward target sites, or to
direct them near the tumor site with an external static or
AMF gradient. The classical methods to accomplish the
hydrophilic coating steps will be presented thereafter, while
the topic of bio-conjugations will be addressed further in
Section V.
Iron oxide-based MNPs must be stabilized in aqueous
media in order to be used in MH applications, i.e., they must
exhibit and keep a proper state of dispersion under given
physicochemical conditions (pH, ionic strength, adsorbing
proteins, etc.) and under an applied static field or AMF,
whatever the field strength. One way is the coating with
polyelectrolytes such as polyacrylic acid (PAA) in order to
provide strong adsorption (resisting to dilution) and electro-
steric repulsion between the MNPs, overcoming van der
Waals and magnetic dipole-dipole attractive forces.
Compared to smaller multivalent ligands like citric acid, the
PAA coating offers superior stability, especially in high sa-
linity buffers77 and impedes the adsorption of blood plasma
proteins.78 In practical terms, PAA chains are adsorbed at
acidic pH on the positively charged MNPs before modifying
the pH to neutral or basic values, a process referred to as
“precipitation-redispersion.” Strong polyelectrolytes such as
poly(4-vinylbenzenesulfonate sodium) (PSS) can also be
used.79 In that case, the resulting negatively charged MNPs
are stabilized by an electro-steric repulsion provided by the
grafted chains whatever the pH value.
Polysaccharides such as heparin, starch, hyaluronan,
dextran, carboxydextran, and chitosan can also be adsorbed
on MNPs to provide steric or electro-steric stabilization.
Instead of adsorbing polymer chains at multiple sites but
through weak bonds, other authors used molecules present-
ing a catechol function at one chain-end. This function
derived from mussel adhesive protein can bind to the surface
of iron oxide MNPs through direct chelating bond of the sur-
face ferric irons. Dopamine is a natural molecule that
presents a catechol function, and, through chemical modifi-
cation of its primary amine, other molecules can be chemi-
cally grafted onto the MNPs.80 Another option for efficient
grafting on the iron oxide MNPs is to combine strong iron-
complexing ligands and multivalence, as with a copolymer
of PEG, poly(ethyleneimine), and poly(L-dopamine),81 a
graft copolymer with PEG pendants groups and phosphonate
moieties that enable to make PEG coating very resistant to
blood protein adsorption with outstanding stability in cell
culture media supplemented with serum,82 or PEG oligomers
with dendritic architecture strongly anchored to the iron ox-
ide surface through a phosphonate ligand, thereby bringing
outstanding stealth properties in vivo.83
Several chemical moieties can be added through surface
modification of the MNPs with surface-complexing agents.
Condensation of alkoxysilanes directly on the MNPs or after
silica coating with tetraethylorthosilicate (TEOS) can pro-
duce a dense outer layer on the MNPs, following the St€ober
process in acidic or alkali media.84 The alkoxysilanes
undergo hydrolysis forming silanols, which can polymerize
and condense on the surface of the MNPs presenting
hydroxyl groups (either the original Fe-OH moieties of the
raw iron oxide surface or the Si-OH brought by an intermedi-
ate silica shell). Although thick, the grown silica layer can
be made mesoporous and its permeability to water can be
adjusted using a sacrificial organic template, leading to func-
tional nanoparticles for sustained drug-delivery85 or as MRI
contrast agents where the accessibility of water molecules is
important.86 The MNPs resulting from sol-gel coating are
041302-9 P�erigo et al. Appl. Phys. Rev. 2, 041302 (2015)
This article is copyrighted as indicated in the article. Reuse of AIP content is subject to the terms at: http://scitation.aip.org/termsconditions. Downloaded to IP:
158.64.77.122 On: Tue, 01 Dec 2015 08:52:59
water-dispersible and exhibit different moieties such as
amino, cyano, isocyanate, aldehyde, or carboxylic depending
on the silane ligand chosen, as a first step toward further
functionalization.56 Once these chemical moieties are intro-
duced on the surface of MNPs, further modification can take
place following “orthogonal” coupling reactions. One possi-
bility is amide coupling chemistry via formation of
N-hydroxysuccinimide (NHS) ester after carboxylic acid acti-
vation by a carbodiimide, e.g., 1-ethyl-3-(3-dimethylamino-
propyl)carbodiimide (EDC). As an example, amine functions
are introduced this way, e.g., from 3-amino-propyltriethoxysi-
lane (APTES) and then covalently attached to molecules of
interest such as carboxy-dextran through classical amide
bond formation coupling.87 Another possibility to covalently
graft dextran chains is reductive amination, using the alde-
hyde end-function presented by any polysaccharide.88 A mal-
eimide function can also be introduced in MNPs for further
reaction with thiol groups of biomolecules (protein, antibody,
etc.), either preexisting (such as a cysteine aminoacid)89 or
introduced by the so-called Traut reaction.90
To conclude on this part, the various syntheses and func-
tionalizations of iron oxide MNPs developed in the last deca-
des have provided nanocrystals with optimal physical and
chemical properties of interest for MH. Crystallinity that
determines the magnetic order of the magnetic moments
within the particles and hence their magnetization is a pa-
rameter to consider, along with size-distribution. To avoid
the clustering of MNPs and dipolar interactions between the
magnetic moments leading to demagnetization effect, mole-
cules of interest can be grafted on the surface of the MNPs to
keep them individually dispersed by providing steric, elec-
trostatic or electro-steric repulsions. Finally, a parameter that
needs to be taken into account when going for biological
tests is the availability of a sufficient amount of MNPs
(meaning a few grams) in order to perform all the control
experiments, especially when experimenting on animals.
More precisely, one can estimate that 1 mg nanoparticles are
sufficient and safe (ten-fold lower than the toxic dose) for an
injection to a mouse (20 g average body weight), but 25 mg
is required for a rat (500 g) and 100 mg for a rabbit (2 kg).
Considering that dozens of animals are needed to obtain a
significant statistics of tumor decrease results, one comes to
the conclusion that between several tens and hundred grams
of well-defined iron oxide cores must be synthesized, in a re-
producible way. In the case of a clinical assay on humans,
the need is even at the kg level. This is crucial to obtain the
authorization of a magnetic nanoparticle system on market,
as it has been already delivered in the past for iron oxide
based contrast agents (e.g., ResovistTM
, EndoremTM
).
III. PROGRESS IN MAGNETIC HYPERTHERMIAPHYSICAL MODELS
Physical models do not only constitute a key element in
revealing the most relevant parameters for developing better
MNPs for MH but also help to draw general behaviors from
the acquired in vitro and in vivo experimental data. Once
validated, these models may result in more reliable particle
post-production benchmarking or treatment planning and
monitoring.
From a physical point of view, the phenomenology
related to MH consists of the electromagnetic energy conver-
sion into heat when MNPs are subjected to AMF, the subse-
quent heat transmission to the surrounding medium and the
heat flow through it. The last decade has witnessed a signifi-
cant increase in theoretical research related to magnetic
hyperthermia. Of particular note is the effort made in adapt-
ing the existing models or even proposing new ones for heat
distribution in tumors. This situation has been possible—
thanks to the research made in understanding the physics
related to magnetic heating mediated by MNPs from both
theoretical and experimental points of view, as well as the
instrumental development.
A number of review articles and book chapters have al-
ready dealt with the many facets of the physical aspects of
MH from its early days with special emphasis, as appropriate
in each case, on the magnetic properties of the MNPs used in
this technique, the associated heating mechanisms or the
existing modalities.91–96 In this section, we will concentrate
just on those aspects standing in the way of more reliable
MH models for treatment planning, mainly those published
within the last five-year period.
A. Modeling heat dissipation in MNPs
Before going through any biological testing, the heating
power of MNPs intended to be used in MH needs to be quan-
tified as accurately as possible. This is usually accomplished
by measuring SAR, or their equivalents/complementary
parameters—specific loss power (SLP) and specific heatingpower (SHP)—under controlled conditions. In view of the
evident uncertainty around the nomenclature, it has also
been recommended the use of the intrinsic loss power (ILP)
parameter when reporting MH measurements, as its value is
virtually independent from the AMF frequency and intensity
used during the experiments97,98 (the reader is referred to
consult Section IV for a more complete description about
measurement setups). Power losses in MNPs under an AMF
are roughly given by the area enclosed by the corresponding
hysteresis loop. Taking into account the nanoparticle size
range typically considered in MH—tens of nanometers, even
though in distinct cases the size has reached a few
hundred—two models are usually employed to describe the
hysteresis loop of a system of MNPs from a theoretical per-
spective: the so-called linear response model (LRM) and the
Stoner-Wohlfarth model (SWM). The LRM is better suited
for single-domain MNPs in the SPM regime, whereas those
models derived from the SWM are valid for single-domain
MNPs with blocked magnetic moments (either ferro- or fer-
rimagnetic). A more detailed treatment of both can be found
elsewhere.92,99 Even though LRM and SWM may explain
the behavior observed at low fields, they do not cover the
whole range and further approaches are needed for relatively
high fields.100
As already noted by Carrey et al.,99 there has been some
confusion regarding the nomenclature and the origin of the
power losses in MNPs. Following is a brief description of
041302-10 P�erigo et al. Appl. Phys. Rev. 2, 041302 (2015)
This article is copyrighted as indicated in the article. Reuse of AIP content is subject to the terms at: http://scitation.aip.org/termsconditions. Downloaded to IP:
158.64.77.122 On: Tue, 01 Dec 2015 08:52:59
key concepts that may help to clarify this matter. The total
energy E of a magnetic particle is given by the sum of the
Zeeman and the anisotropy energy terms, which, in a simpli-
fied form, reads101
E ¼ KV sin2h� lH0 sin ð2pf � tÞ cos u; (3.1)
where K is the anisotropy constant (with several contributions:
magneto-crystalline energy, surface disorder, or shape anisot-
ropy), V is the particle volume, l is the magnetic moment, h is
the angle between l and the anisotropy axis, u the angle
between l and the external field, t is the time, and H0 is the in-
tensity of the AMF. At zero field, SPM MNPs undergo a mag-netic relaxation process, also known as N�eel relaxation (with
a characteristic time given by sN ¼ so exp ðKV=kBTÞ, where
s0 is the attempt time �10�9–10�13 s and kB is the Boltzmann
constant), due to thermally driven continuous fluctuations of
their magnetic moments. Thermal energy (kBT) can surpass
the anisotropy energy barrier that separates orientation states
(local minima) of the magnetic moments. As opposed to SPM
MNPs, both multi-domain and single-domain MNPs that have
their moment(s) blocked do not show N�eel relaxation, as their
anisotropy energy cannot be overcome by the thermal energy.
Nevertheless, both blocked and SPM MNPs present Brownianrelaxation, whose characteristic time sB is strictly associated
to their random hydrodynamic interaction with molecules of
the liquid medium and their corresponding rotational diffusion
time92
sB ¼3gVH
kBT; (3.2)
where g is the dynamic viscosity of the medium and VH is
the hydrodynamic diameter of the suspended MNPs. It can
be seen from Eq. (3.2) that sB is not directly related to the
magnetism of the SPM MNPs but it can also increasingly
modulate it as the particle diameter increases within the
SPM range. A number of models exist for Brownian relaxa-
tion in MNPs, their corresponding comparison with experi-
mental data and measuring protocols having been published
during the past years.102–104 Both relaxation processes are
related by Shliomis’ equation to give the effective relaxation
time s105
s ¼ sBsN
sB þ sN: (3.3)
Eq. (3.3) may lead to think that Brown and N�eel relaxations
are decoupled, but they are not.106 At non-zero fields, for
blocked and SPM MNPs, the balance between both terms in
Eq. (3.1) will dictate the magnetization reversal of the
MNPs and hence the shape of the corresponding hysteresis
loop. At a constant temperature, the anisotropy barrier will
remain the same and any variations in the applied field will
introduce an imbalance in the total energy (Eq. (3.1)). If this
imbalance is large enough, it will overcome the anisotropy
barrier/energy of the system and the magnetization will
reverse. Upon cycling this process for different field values
with opposite signs, one obtains the hysteresis loop of the
system. This means that the N�eel relaxation, per se, is not a
power loss mechanism. In other words, relaxation drives the
magnetization dynamics towards equilibrium and, at the
same time, somehow modulates the processes that shape the
hysteresis loop of the system in the presence of an external
field, but it is not the only driving force behind the power
losses.
New approaches to work out the possible relevance of
Brown and N�eel relaxations for a particular nanoparticle sys-
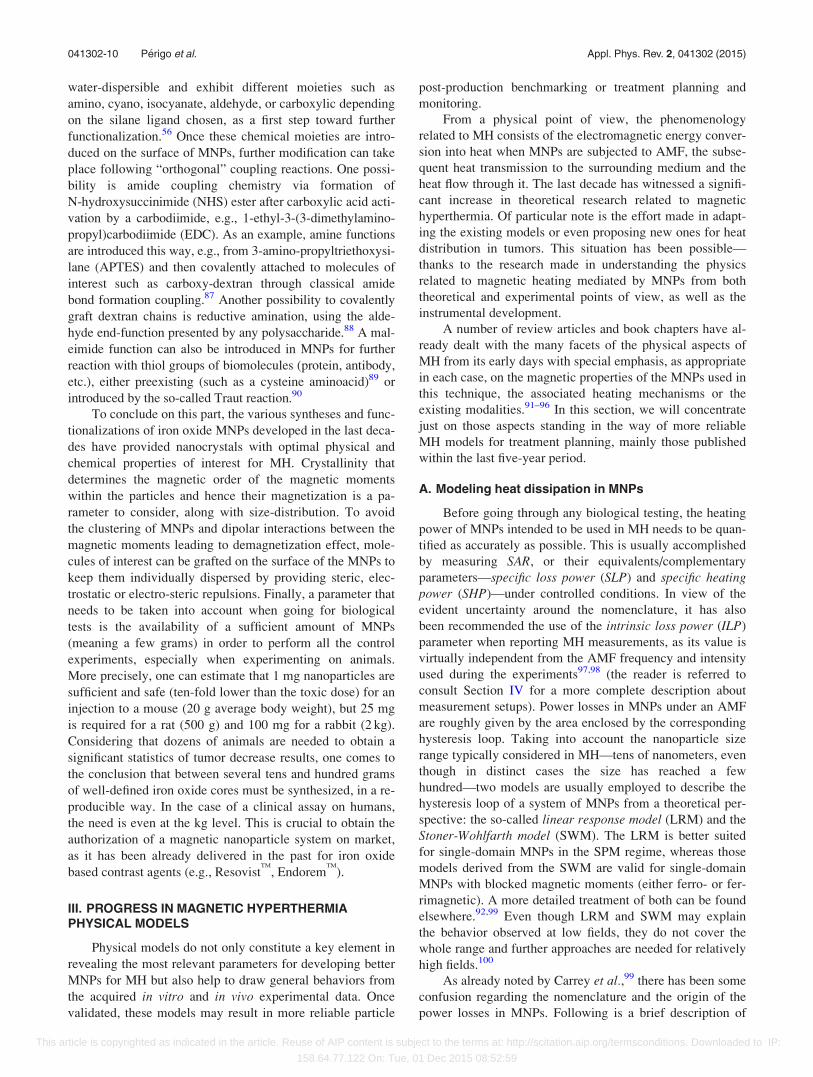
tem are still been devised. One of the latest approaches is the
construction of SAR equipotential diagrams that would help
in finding out the reigning relaxation mechanism and the SARvalues for a given field frequency and amplitude.107 The main
idea is to plot the magnetic energy term against a viscous
energy term (both proportional to the respective relaxation
mechanism) and then plot also a set of distinct curves, some
acting as regime limits. The result is a diagram depicting the
prevalence domain of N�eel and Brown processes, as well as
the coexistence region as shown on Fig. 7. From here, the
equipotential lines are calculated using LRM and therefore
inheriting the limitations of the latter. A very recent experi-
mental in vitro study aimed at demonstrating that the preva-
lence of Brown/N�eel processes has been carried out by
Soukup et al. in MG-63 osteoblasts loaded with iron oxide
MNPs.108 Using AC magnetometry to detect any variations
of relaxational processes, blocked MNPs showed no
Brownian relaxation upon cell internalization due to either
aggregation or immobilization. Nonetheless, when MNPs
were released to the medium again by cell lysis, Brownian
relaxation reappeared. In the case of SPM MNPs, susceptibil-
ity curves remained invariable despite the changes in their
environment, reflecting the invariability of N�eel relaxation in
SPM MNPs with respect to their environment inside cells.
These results are along the same research line that those
previously reported for in vitro tests of MNPs inside human
FIG. 7. Proposed diagram where y and x axes correspond to the dimension-
less quantities KeffVmag/kBT (proportional to ln(sN/s0)) and gVhyd/kBT (pro-
portional to sB), respectively. Black, blue, and red lines correspond to
sN¼ sB, sN< 0.1 sB, and sN> 10 sB, respectively, when considering
s0¼ 10�9 and 10�12 s (dashed and solid lines, respectively).107 Reproduced
with permission from Lima, Jr., et al., J. Nanopart. Res. 16, 1 (2014).
Copyright 2014 Springer.
041302-11 P�erigo et al. Appl. Phys. Rev. 2, 041302 (2015)
This article is copyrighted as indicated in the article. Reuse of AIP content is subject to the terms at: http://scitation.aip.org/termsconditions. Downloaded to IP:
158.64.77.122 On: Tue, 01 Dec 2015 08:52:59
adenocarcinoma cells,109 where a systematic decay of the
heating capabilities of MNPs were observed upon interaction
with the cellular membrane and/or cell internalization.
The different methods for calculating AC hysteresis
loops and their areas have been thoroughly described99,110
and analytical expressions have been proposed. Mamiya
reviewed the theoretical criteria to choose the proper field in-
tensity and frequency that maximize the power losses and
hence increase the heat release by MNPs.110 In blocked
MNPs, H0 has to be adjusted above the anisotropy field (HK)
value of the system, given by HK ¼ 2K=ðl0MSÞ, where Ms is
the saturation magnetization, and f, the field frequency, has
to be maximized because the heating power is given by the
product of the hysteresis loop surface area by p�f. For MH
with SPM MNPs, H0 has to be maximized, while f has to be
set to s�1.
A more recent model has delved deeper into the non-
linear behavior in the dynamical susceptibility in magnetic
colloids by considering the field dependence of relaxation
times. Raikher and Stepanov obtained an exact expression
for the dynamic susceptibility of MNPs forming a colloid
under the action of an AMF field considering the LRM and
the low-frequency approximation, the latter implying that
f � s�1D , where sD is the characteristic time of the rotational
diffusion of the particle magnetic moments.111 The obtained
exact expression for the dynamic susceptibility is
v ¼ v0
B
1þ ixsþ 1� Bð Þ
� �; (3.4)
where B is a weighting coefficient.
Considering a log-normal particle size distribution g(d),
Eq. (3.4) reads
�v ¼ v0 1� ixd6
ðsBd6
1þ ixsg dð Þdd
� �; with v0 ¼
puM2s
18kBT
d6
d3;
(3.5)
where MS is the saturation magnetization, d is the diameter
distributed along a probability function g(d), x is the angular
frequency of AMF (x¼ 2pf), v0 is the steady susceptibility,
and u is the volume fraction of the particles in the colloid. It
is shown that the heat dissipation caused by the particle rota-
tion in the solvent distinctly contributes to the SAR in the
considered sample
SAR ¼ xH20
2q
!�v: (3.6)
SAR values obtained with (Eq. (3.4)), the exact expression,
are compared to those calculated following other two
approaches, designated by the authors as the plain heuristicmodel (PHM, Eq. (3.7)) and the modified heuristic model(MHM, Eq. (3.8))
v ¼ v0½1þ ixs��1; (3.7)
v¼ ½v0 �3LðnÞ=n�½1þ ixt��1; with
n¼ l0lH=kBT defined as the Langevin’s parameter; (3.8)
where L(n) is the Langevin equation and l¼MV is the mag-
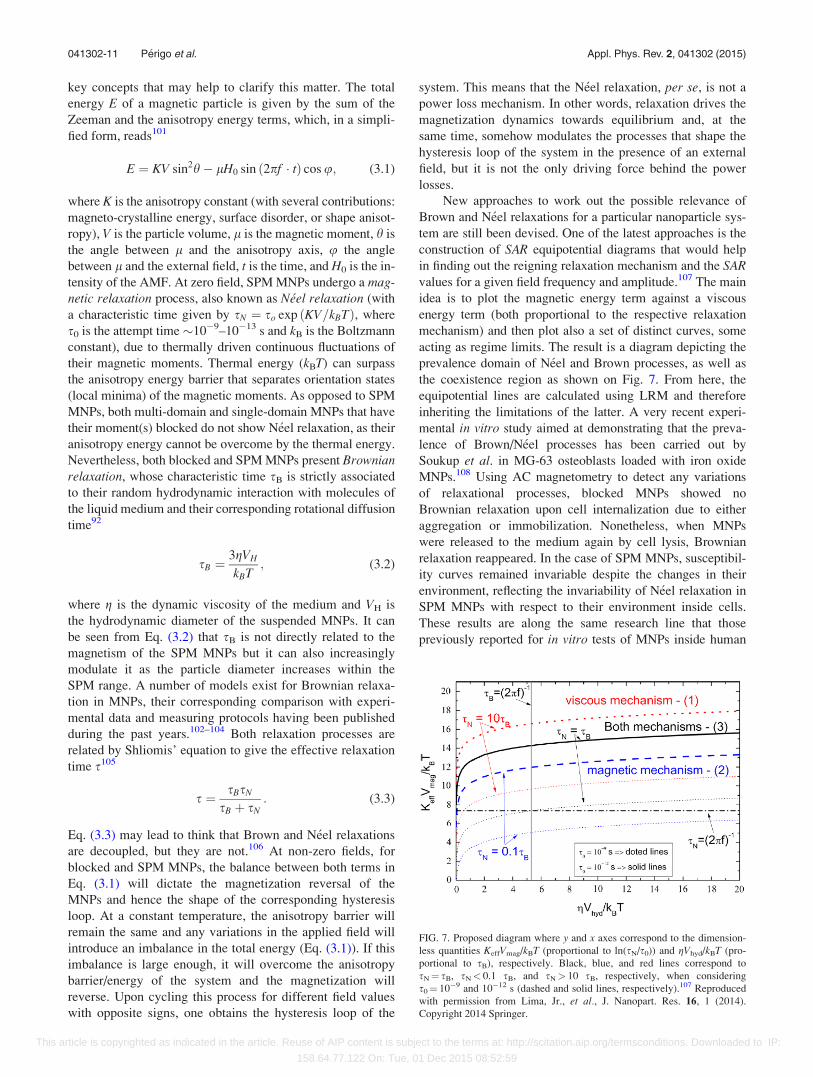
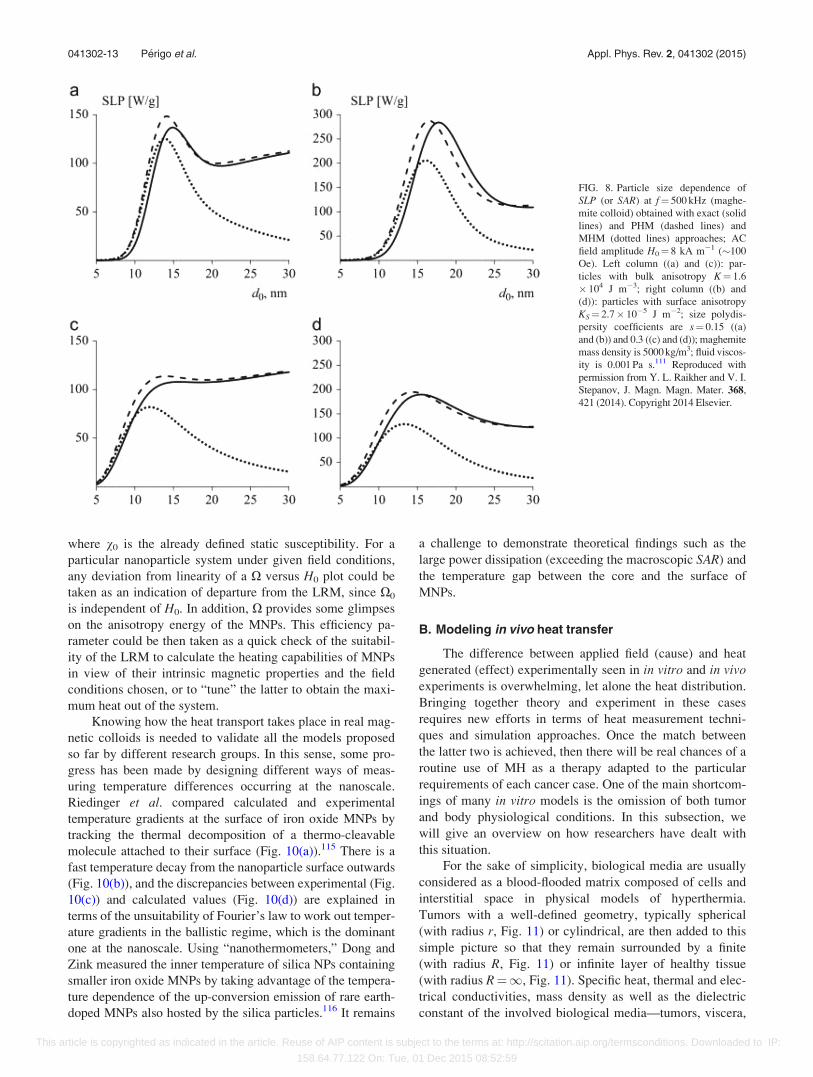
netic moment.112 They discuss the influence of the type of
anisotropy (magnetocrystalline, K and surface, Ks) and poly-
dispersity (r) on SAR values as depicted in Fig. 8. There is a
relatively noticeable discrepancy between exact and PHM
approaches, and an even larger departure of these two from
the MHM approach towards higher particle sizes, especially
in the cases with bulk anisotropy, i.e., discarding surface
effects, as depicted in Figs. 8(a) and 8(c). Unlike the case of
MNPs with just bulk anisotropy, SAR maxima are better
defined when considering surface anisotropy (see Figs. 8(b)
and 8(d)). In all cases, r tends to broaden the SAR maxima,
as expected. The model comparison seems to capture a dis-
tinct feature frequently overlooked by many of the heat dissi-
pation models published so far: N�eel and Brown relaxations
become comparable for a given average particle size, and
from that value onwards, SAR becomes almost independent
from particle size. Several years before, Carrey et al. dis-
cussed in further detail the field dependency of SAR for dif-
ferent particle sizes based on the comparison of physical
models with experimental data.99 After carrying out numeri-
cal simulations of hysteresis loops for MNPs with either ran-
dom orientation of anisotropy axes or parallel to the external
field, they fitted the corresponding areas to a power law of
SAR versus H0 with different exponents depending on the
range of particle sizes, as shown on Fig. 9(a). The results
reveal a radically different trend wherever a substantial
change in the relevant magnetic behavior arises from
increasing particle size. Starting from a square power for the
lowest size, the exponent decreases within the 3.5–9 nm par-
ticle size range, where MNPs are superparamagnetic and the
LRM is valid. Then at larger sizes, the power law exponent
values abruptly increase for a threshold diameter, above
which MNPs enter the ferromagnetic state and exit the LRM
validity range.
In addition to particle size, particle concentration also
affects SAR (see also Section III C), even though the positive
or negative character of the effect depends on the intensity
of the applied field; less concentrated samples show lower
SAR values at the lower field end, whereas the trend reverses
for increasing fields,113 showing a linear relationship for the
most concentrated samples. The most interesting finding is
that regardless the concentration, all the SAR curves tend to
saturate to a given value as depicted in Fig. 9(b).
Transforming electromagnetic energy (applied AC field)
into thermal energy (heat dissipated by the MNPs) lies at the
heart of MH, but not so many models consider the efficiency
of a system in doing so. Within the framework of a model
based on the Landau-Lifshitz equation, Landi and Bakuzis
introduced an electromagnetic-to-thermal energy efficiency
parameter X of the form114
X ¼ A
H20
; (3.9)
where A is the area enclosed by the hysteresis loop. In the
LRM, X is given by the equation
X0 ¼ pv0
xs
1þ xsð Þ2; (3.10)
041302-12 P�erigo et al. Appl. Phys. Rev. 2, 041302 (2015)
This article is copyrighted as indicated in the article. Reuse of AIP content is subject to the terms at: http://scitation.aip.org/termsconditions. Downloaded to IP:
158.64.77.122 On: Tue, 01 Dec 2015 08:52:59
where v0 is the already defined static susceptibility. For a
particular nanoparticle system under given field conditions,
any deviation from linearity of a X versus H0 plot could be
taken as an indication of departure from the LRM, since X0
is independent of H0. In addition, X provides some glimpses
on the anisotropy energy of the MNPs. This efficiency pa-
rameter could be then taken as a quick check of the suitabil-
ity of the LRM to calculate the heating capabilities of MNPs
in view of their intrinsic magnetic properties and the field
conditions chosen, or to “tune” the latter to obtain the maxi-
mum heat out of the system.
Knowing how the heat transport takes place in real mag-
netic colloids is needed to validate all the models proposed
so far by different research groups. In this sense, some pro-
gress has been made by designing different ways of meas-
uring temperature differences occurring at the nanoscale.
Riedinger et al. compared calculated and experimental
temperature gradients at the surface of iron oxide MNPs by
tracking the thermal decomposition of a thermo-cleavable
molecule attached to their surface (Fig. 10(a)).115 There is a
fast temperature decay from the nanoparticle surface outwards
(Fig. 10(b)), and the discrepancies between experimental (Fig.
10(c)) and calculated values (Fig. 10(d)) are explained in
terms of the unsuitability of Fourier’s law to work out temper-
ature gradients in the ballistic regime, which is the dominant
one at the nanoscale. Using “nanothermometers,” Dong and
Zink measured the inner temperature of silica NPs containing
smaller iron oxide MNPs by taking advantage of the tempera-
ture dependence of the up-conversion emission of rare earth-
doped MNPs also hosted by the silica particles.116 It remains
a challenge to demonstrate theoretical findings such as the
large power dissipation (exceeding the macroscopic SAR) and
the temperature gap between the core and the surface of
MNPs.
B. Modeling in vivo heat transfer
The difference between applied field (cause) and heat
generated (effect) experimentally seen in in vitro and in vivoexperiments is overwhelming, let alone the heat distribution.
Bringing together theory and experiment in these cases
requires new efforts in terms of heat measurement techni-
ques and simulation approaches. Once the match between
the latter two is achieved, then there will be real chances of a
routine use of MH as a therapy adapted to the particular
requirements of each cancer case. One of the main shortcom-
ings of many in vitro models is the omission of both tumor
and body physiological conditions. In this subsection, we
will give an overview on how researchers have dealt with
this situation.
For the sake of simplicity, biological media are usually
considered as a blood-flooded matrix composed of cells and
interstitial space in physical models of hyperthermia.
Tumors with a well-defined geometry, typically spherical
(with radius r, Fig. 11) or cylindrical, are then added to this
simple picture so that they remain surrounded by a finite
(with radius R, Fig. 11) or infinite layer of healthy tissue
(with radius R¼1, Fig. 11). Specific heat, thermal and elec-
trical conductivities, mass density as well as the dielectric
constant of the involved biological media—tumors, viscera,
FIG. 8. Particle size dependence of
SLP (or SAR) at f¼ 500 kHz (maghe-
mite colloid) obtained with exact (solid
lines) and PHM (dashed lines) and
MHM (dotted lines) approaches; AC
field amplitude H0¼ 8 kA m�1 (�100
Oe). Left column ((a) and (c)): par-
ticles with bulk anisotropy K¼ 1.6
� 104 J m�3; right column ((b) and
(d)): particles with surface anisotropy
KS¼ 2.7� 10�5 J m�2; size polydis-
persity coefficients are s¼ 0.15 ((a)
and (b)) and 0.3 ((c) and (d)); maghemite
mass density is 5000 kg/m3; fluid viscos-
ity is 0.001 Pa s.111 Reproduced with
permission from Y. L. Raikher and V. I.
Stepanov, J. Magn. Magn. Mater. 368,
421 (2014). Copyright 2014 Elsevier.
041302-13 P�erigo et al. Appl. Phys. Rev. 2, 041302 (2015)
This article is copyrighted as indicated in the article. Reuse of AIP content is subject to the terms at: http://scitation.aip.org/termsconditions. Downloaded to IP:
158.64.77.122 On: Tue, 01 Dec 2015 08:52:59

muscle, fat, skin, etc.…—must be also included in models
and simulations. In the case of deep-seated tumors, the per-
turbing effects of bones (with low dielectric constant and
thermal conductivity) are usually neglected due to the added
complexity and its relatively limited influence on the heat
transfer. Another important element is the vascularization.
The heat transfer process greatly depends on blood perfu-
sion, which in turn is different for tumors and normal tissue.
Moreover, bifurcations in vessels have an impact on the
cooling effect of blood.117 Finally, the heat sources, i.e.,
MNPs, must be included to complete the basic tumor model
of MH. These may exhibit size distribution, which influence
their magnetic properties and hence the heat generation pro-
cess, and spatial distribution, which determines the forma-
tion of “hot spots” and the uniformity of heat deposition in
the tissue where the MNPs are infused.91,118
Leaving aside for now the role of MNPs as heat sources
in our basic model above, the heat exchange processes
involved in any hyperthermia treatment can be initially mod-
eled using the bioheat transfer equation-sometimes referred
as parabolic bioheat equation or simply Pennes’ equation—
described by Pennes in his seminal paper on the tissue and
blood temperature of the human forearm.119 The general
modern form of this equation reads
dtsqC@T
@tþr � �krTð Þ ¼ qbCbxb Tb � Tð Þ þ Qmet þ Qext;
(3.11)
where dts is a time-scaling coefficient (typically equals to 1),
q is the tissue mass density, C is the tissue’s specific heat
and k is the thermal conductivity, qb is the blood’s density,
Cb is the blood’s specific heat, xb is the perfusion rate, Tb
the arterial blood temperature, Qmet and Qext are the heat
sources from metabolism and spatial heating, respectively.
The terms on the left of Eq. (3.11) represent the thermal
energy storage and the thermal energy diffusion, respec-
tively. At the right, there are the terms referred to blood per-
fusion, metabolic heat, and external heat, respectively. The
original Pennes’ equation makes some assumptions that limit
its applicability to biological tissues. For example, thermal
equilibrium is only attained at capillaries, neglecting any
heat transfer between skin and larger blood vessels.
Eq. (3.11) assumes an infinite heat propagation rate, because
it is based on the Fourier’s law of thermal conduction.
Additionally, it presupposes a homogeneous and isotropic
sample volume (and blood flow). These conditions are rarely
met in real tissues, and heterogeneities make them exhibit a
non-Fourier behavior that results in a thermal response lag
upon a temperature change. In other words, there is a heat
relaxation time of the tissue, which may reach values of
�100 s for certain biological materials,120 due to the differ-
ence between the occurrence of temperature gradient (cause)
and heat propagation processes (effect). This is taken into
account in the dual-phase-lag equation of the namesake
model, or hyperbolic bioheat equation
qC s@2T
@t2þ @T
@t
� �þr � �krTð Þ
¼ qbcb Tb � Tð Þ þ Qext þ Qmet
þ s xbCb@T
@tþ @Qmet
@tþ @Qext
@t
� �: (3.12)
Note that when s ! 0, Eq. (3.12) reduces to Eq. (3.11) but
for the time-scaling coefficient dts. Despite its limitations,
Equation (3.11) has been validated in the ensuing years for
different types of living tissue using experimental data,121
and has also been through subsequent corrections for the iso-
tropic blood perfusion term,122 and small-scale microvascu-
lar contributions to the overall temperature,123 among others.
Some comprehensive compendia of classical and modern
heat transfer models in vascularized tissues have been
reviewed by Charny, Arkin, and Bhowmik.120,124,125
Considering again the role of MNPs as heat sources, a
great deal of the specific models for MH derives from the
aforementioned bioheat models or improved versions.
Frequently, the corresponding equations cannot be analyti-
cally solved for the imposed boundary conditions, and a
range of numerical methods already employed in fluid dy-
namics may be used instead (Monte Carlo, finite element
method (FEM),126 finite difference time domain method127).
In some cases, simulated data are then compared with tissue
phantom models made of materials that mimic the actual
FIG. 9. (a) Exponent of the best power law fit to numerical simulations of
hysteresis loop areas for nanoparticles with random orientation of anisotropy
axes (full circles) and parallel to the external field (full squares).99 When
there was an inflection point in the curve, the fit was performed only up to
this point. Reproduced with permission from J. Appl. Phys. 109, 083921
(2011). Copyright 2011 AIP Publishing LLC. (b) Field-dependence of the
SAR for different nanoparticle concentrations (c¼ 0.007, 0.070, 0.150).113
Reproduced with permission from J. Appl. Phys.108, 073918 (2010).
Copyright 2010 AIP Publishing LLC.
041302-14 P�erigo et al. Appl. Phys. Rev. 2, 041302 (2015)
This article is copyrighted as indicated in the article. Reuse of AIP content is subject to the terms at: http://scitation.aip.org/termsconditions. Downloaded to IP:
158.64.77.122 On: Tue, 01 Dec 2015 08:52:59

physical properties of biological tissues (thermal conductiv-
ity, heat capacity, etc.) as close as possible.128 Further, it has
been stated that the most sought-after properties in a phan-
tom for evaluating MH are:129 (i) homogeneous structure,
(ii) long-term stability, (iii) thermal stability up to 100 �C,
and (iv) immobilization of magnetic particles in the material.
A word of caution regarding the last point: MNPs in tissues
are not immobilized to the same extent as in a polymer phan-
tom model. Nanoparticle distribution inside tissues tends to
be inhomogeneous due to the presence of many different bio-
logical media (cells, interstitial space, blood vessels, etc.);
these tissue changes are hardly reproducible inside a phan-
tom even in the case of tissue equivalent materials.130 A
phantom model made of magnetite MNPs dispersed in a
polyurethane matrix is shown in Figs. 12(a) and 12(b).
Temperature is measured with thermocouples inserted
through the phantom (Fig. 12(c)).
Yamada et al. compared simulations and experimental
data to find out suitable heat doses to treat cell pellets—as tu-
mor models—from three different pancreatic cancer cell
lines, namely, SUIT-2, BxPC-3, and AsPC-1.131 Simulations
are performed by solving the bioheat equation using a finite
element method. Since the hepatic blood flow can be par-
tially interrupted by the so-called Pringle’s maneuver, heat
losses should be minimized and it follows that only the static
thermal diffusion is regarded in this model for pancreatic
tumors. As expected, simulations show that the induced tem-
perature difference between tumor center and periphery is
FIG. 10. (a) Sketch of the readily functionalized iron oxide nanoparticles bearing FA (fluoresceineamine) connected through VA057 azo molecule to the tails
of PEG spacers of different molecular weights. An increase in temperature results in increased cleavage of the azo group and release of the dye from the par-
ticles. The released FA is separated from the nanoparticles by centrifugation, and the PL spectra of the downstreams are recorded. (b) Experimental tempera-
ture gradients for all field amplitudes: significant local-to-global temperature differences can be found at distances shorter than 3 nm. (c) Temperature
gradients calculated by applying the Fourier law for three different shell thicknesses (PEG500, PEG1500, and PEG8000). (d) Comparison of DT values at 0,
0.47, 0.83, and 1.9 nm. The discrepancy between experimental data and the diffusive heat transport model at this nanoscale regime can be observed and is
increasing with distance.115 Reproduced with permission from Riedinger et al., Nano Lett. 13(6), 2399 (2013). Copyright 2013 American Chemical Society.
FIG. 11. Typical concentric tumor model, where r is the tumor radius and Rthe radius of the sample body region. Blood perfusion is considered homoge-
neous throughout both the tumor and healthy tissue. Magnetic nanoparticles
are homogeneously distributed only inside the tumor. Tumor own microvas-
culature is not depicted.
041302-15 P�erigo et al. Appl. Phys. Rev. 2, 041302 (2015)
This article is copyrighted as indicated in the article. Reuse of AIP content is subject to the terms at: http://scitation.aip.org/termsconditions. Downloaded to IP:
158.64.77.122 On: Tue, 01 Dec 2015 08:52:59

larger for larger tumors (�18%), three times that found for
smaller tumors (�6%).
The Lattice Boltzmann method (LBM), which is a com-
putational method to simulate Newtonian fluids, has been
lately applied to solve the bioheat equation for the first
time132 and subsequently study heat transfer in MH.133,134
The representation of the system is very similar to that in
Fig. 11. In essence, LBM computes the temperature and heat
flux through the internal energy evolution considering the
probabilities of finding a particle at a certain position and at
a given time along the directions of a predefined lattice.
Using the LBM, Golneshan and Lahonian133 have matched
the results obtained by Lin and Liu135 for 9 nm FePt MNPs
and 19 nm magnetite MNPs employing a hybrid numerical
method. They also show how the type of nanoparticle vol-
ume distribution (see Table I) inside tumors affects their
temperature profile. Whereas the temperature of the sur-
rounding healthy tissue remains unchanged in all the cases, a
nanoparticle concentration profile decreasing linearly with
radius from the center allows the highest temperature at the
tumor center under a field of H0¼ 10 kA m�1 (�125 Oe) at
100 kHz as compared to other spatial distributions of the
MNPs in the tumor. Under the same conditions, a homogene-
ous distribution reaches a lower maximal temperature at the
tumor center. Despite the advantages of this approach to
study temperature distributions in tissues considering nano-
particle volume distributions, tissue discontinuities are not
considered and, like for many other models, the ability to
accommodate them in future improvements will determine
its usability in preclinical and/or clinical MH.
Liangruksa et al. proposed a model of a spherical tumor
similar to the generic one depicted in Fig. 11, with radius rinside a portion of isotropic tissue (R¼1) and taking into
account the blood perfusion rate.136 Three parameters are
deemed crucial for optimal MH conditions in this model
based on the solutions of the bioheat equation for both steady
and transient states: the P�eclet number (Pe), which is the rate
between convective and conductive transport in fluids, the
Fourier number (Fo), here taken as the ratio between
“thermal” time (thermal conduction rate) to magnetic relaxa-
tion time, and the Joule number (Jo), which represents the ra-
tio between Joule heating to the magnetic energy. In
practical terms, those two parameters containing the mag-
netic contribution from the MNPs are combined into a new
single parameter, namely, “capital gamma” (C¼Fo/Jo), in
such a way that most of the estimations are actually made on
the basis of Pe and C. Inside the tumor, C is given by
C ¼ pl0fR2xsv0H20
ktTb 1þ xsð Þ2h i ; (3.13)
where l0 is the magnetic permeability of vacuum, x the
angular frequency of the AMF, v0 the static magnetic suscep-
tibility of a nanoparticle-containing tumor, kt the thermal
conductivity of the tumor, and Tb the basal temperature.
Predictions from the model correlate well with the experi-
mental tumor temperature values measured for different
nanoparticle concentrations by Moroz et al. (see Fig. 13(a))
in a previous in vivo embolization hyperthermia study.137
Perhaps, one of the most interesting points of this model
compared to others is that the authors propose two quality
parameters for MH treatments, namely, the tumor volume
with a temperature above a pre-defined threshold tempera-
ture (IT) and the damaged normal tissue volume above the
pre-defined necrosis temperature (IN). According to Fig.
13(b), a tumor is treated when C¼ 1 and Pe¼ 1, since C< 1
implies longer treatment times and C> 1 is associated to
IN 6¼ 0 values, i.e., damaging the healthy tissue. Since the
aim of the therapy is to achieve the therapy temperature as
quick as possible (IT ! 1) while inducing the least possible
damage (IN ! 0), IT should be around 1 for at least 30 min.
Regarding the influence of the particle size distribution on
the therapy efficacy at steady state, the model predicts that a
homogeneous distribution would reach a higher maximum
temperature at the tumor center than a Gaussian one,
whereas an exponential distribution would induce more dam-
age to the surrounding healthy tissue. Even though this
model suffers from the aforementioned drawbacks of assum-
ing an infinite isotropic tissue surrounding the tumor and do
not contemplate a multi-layer tumor-tissue interface (fat,
muscle, etc.), it succeeds in proposing interesting design pa-
rameters for planning MH treatments different than those
TABLE I. Nanoparticle volume distributions across a generic tumor consid-
ered by Lahonian and Golneshan.133 Notation: UH is the homogeneous vol-
ume fraction, mNP is the nanoparticle mass, qNP the nanoparticle density, mt
the tumor mass, and qt the tumor density.
Homogeneous : / rð Þ ¼ /H
Linear : / rð Þ ¼ 4/H 1� r þ R
r
� �
Parabolic : / rð Þ ¼ 5
2/H 1� r þ R
r
� �2 !
9>>>>>>=>>>>>>;
where /H ¼
mNP
qNPmt
qt
FIG. 12. Pictures of polyurethane with suspended magnetic particles: (a) an
un-foamed solid gel consisting of a section enriched with MNPs at the bot-
tom, and pure polyurethane at the top and (b) a polyurethane foam created
using a biocompatible MNPs. (c) Cross section of a tomogram reconstructed
from 720 radiographs taken with an angular resolution of 0.5�. The spatial
resolution of the tomogram allows a precise determination of the thermocou-
ple positions.129 Reproduced with permission from Henrich et al., J. Magn.
Magn. Mater. 351, 1 (2014). Copyright 2014 Elsevier.
041302-16 P�erigo et al. Appl. Phys. Rev. 2, 041302 (2015)
This article is copyrighted as indicated in the article. Reuse of AIP content is subject to the terms at: http://scitation.aip.org/termsconditions. Downloaded to IP:
158.64.77.122 On: Tue, 01 Dec 2015 08:52:59

encountered in the majority of the models, even allowing an
estimation of the exposure time to attain a full tumor treat-
ment for a given set of conditions.
Most of the models described in this section and many
others found in the literature usually consider well defined
boundaries between tumor and healthy tissue—very likely to
simplify the computational complexity and to reduce the
computation time. Since the real tumor/healthy tissue inter-
face is diffuse, with variable extension, and often causes tu-
mor relapse if not properly removed, improving the existing
biophysical methods to model that intricate interface is a
priority for advancing the applicability of MH in cancer
therapy.
C. Current trends: Modeling interparticle interactions
Until very recently, the influence of dipole interactions
between particles has been almost systematically ignored.
This situation may have been motivated by the lack of exper-
imental evidences supporting their prominent role in earlier
studies or their difficult implementation depending on the
physical model of choice. During the last few years signifi-
cant progresses have been made both theoretically and
experimentally,135,138–141 but a clear consensus on this issue
is yet to be reached.
The reported efficacy on some in vivo MH experiments
have been ascribed to the interplay of several factors that
leads to a collective behavior of MNPs,142 where the contri-
bution from dipole interactions has been considered espe-
cially relevant. Although other dedicated works share a
similar vision on the need of having a collective behavior to
achieve a therapeutic effect, many others find dissimilar evi-
dences on the precise role of interactions. The primary effect
of interactions is the decrease of the external AMF strength
“seen” by the particles, also called “demagnetization effect,”
giving place to an effective field with lower intensity. In
addition, strong interactions occurring in a concentrated
nanoparticles colloidal suspension may result in a collective
behavior closer to the system as a whole rather than the sum
of the properties of the individual MNPs. Gudoshnikov
et al.143 found that strongly interacting systems can be repre-
sented by a single demagnetizing factor of the whole sample.
More specifically, SAR decreases more than four times when
the sample aspect ratio goes from 11.4 to 1. The aggregation
degree and the local spatial arrangement of MNPs have been
also a focus of debate. Nanoparticle concentration in mag-
netic colloids is known to profoundly affect SAR values,144
often in a detrimental way; however, the mean inter-particle
distance may not only decrease from just an increase in the
average number-concentration of MNPs in the colloidal sus-
pension but also from an increase of the local volume frac-
tion u, induced by a partial aggregation degree. The so-
called multicore structures—nanoparticle clusters of variable
size—have been presented as an alternative to single MNPs
in biomedical applications due to stability reasons, as the lat-
ter are more likely to show unspecific aggregation and
clumping.145 This controlled clustering also keeps rema-
nence at a minimum without increasing the average particle
size too much. Multicores show a noticeable magnetoviscous
effect,146 which influences the way magnetic colloids flow
through and interact with biological media. However, are
multicores necessarily better heaters than single MNPs?
Monte Carlo simulations by Serantes et al. have shown the
heat dissipation enhancement in magnetic colloids for MH
introduced by a controlled assembly of MNPs through dipole
interactions.147 Different geometries were explored, and the
formation of linear chains of individual MNPs were found to
be the most efficient heaters due to the gain in anisotropy
energy, which supports the high SAR values presented by
biogenic magnetite MNPs in magnetostatic bacteria.148
Reported Monte Carlo simulations support experimental data
linking chain formation and chain length with a generalized
SAR decrease.131 Going beyond this general trend, Mehdaoui
et al. proposed in a more categorical fashion that the only
way one can get the highest possible SAR from a particular
material is to have chains of MNPs with uniaxial
anisotropy.149
The type of magnetic interactions (i.e., dipolar and
exchange) between MNPs is also an important aspect in
determining the heat dissipation in multicore structures.
Recently, SAR measurements of citric acid coated iron oxide
MNPs have shown better heating capabilities in smaller mul-
ticore structures composed of bigger MNPs than in larger
multicore structures with smaller MNPs.75 Data from Henkel
FIG. 13. Comparison between model predictions (solid lines) and a previous
experimental investigation of ferromagnetic embolization hyperthermia.136
The scattered symbols represent the mean tumor temperature monitored
over the five subjects in each treatment group receiving different doses of
ferrous particles, while the lines represent the corresponding results from the
model. (b) Temporal evolution of IT and IN for varying C at Pe¼ 1. The
dots represent IT and the crosses IN. See Ref. 136 for further information.
Reproduced with permission from Liangruksa et al., J. Magn. Magn. Mater.
323, 708 (2011). Copyright 2011 Elsevier.
041302-17 P�erigo et al. Appl. Phys. Rev. 2, 041302 (2015)
This article is copyrighted as indicated in the article. Reuse of AIP content is subject to the terms at: http://scitation.aip.org/termsconditions. Downloaded to IP:
158.64.77.122 On: Tue, 01 Dec 2015 08:52:59
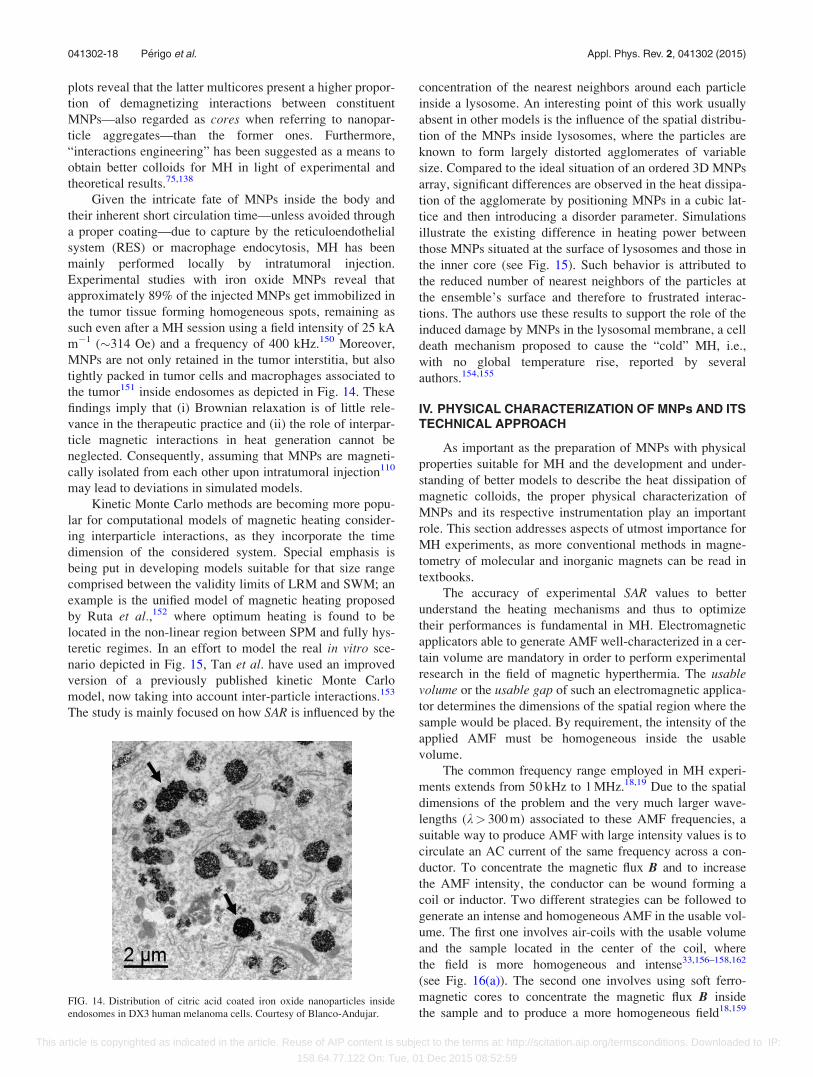
plots reveal that the latter multicores present a higher propor-
tion of demagnetizing interactions between constituent
MNPs—also regarded as cores when referring to nanopar-
ticle aggregates—than the former ones. Furthermore,
“interactions engineering” has been suggested as a means to
obtain better colloids for MH in light of experimental and
theoretical results.75,138
Given the intricate fate of MNPs inside the body and
their inherent short circulation time—unless avoided through
a proper coating—due to capture by the reticuloendothelial
system (RES) or macrophage endocytosis, MH has been
mainly performed locally by intratumoral injection.
Experimental studies with iron oxide MNPs reveal that
approximately 89% of the injected MNPs get immobilized in
the tumor tissue forming homogeneous spots, remaining as
such even after a MH session using a field intensity of 25 kA
m�1 (�314 Oe) and a frequency of 400 kHz.150 Moreover,
MNPs are not only retained in the tumor interstitia, but also
tightly packed in tumor cells and macrophages associated to
the tumor151 inside endosomes as depicted in Fig. 14. These
findings imply that (i) Brownian relaxation is of little rele-
vance in the therapeutic practice and (ii) the role of interpar-
ticle magnetic interactions in heat generation cannot be
neglected. Consequently, assuming that MNPs are magneti-
cally isolated from each other upon intratumoral injection110
may lead to deviations in simulated models.
Kinetic Monte Carlo methods are becoming more popu-
lar for computational models of magnetic heating consider-
ing interparticle interactions, as they incorporate the time
dimension of the considered system. Special emphasis is
being put in developing models suitable for that size range
comprised between the validity limits of LRM and SWM; an
example is the unified model of magnetic heating proposed
by Ruta et al.,152 where optimum heating is found to be
located in the non-linear region between SPM and fully hys-
teretic regimes. In an effort to model the real in vitro sce-
nario depicted in Fig. 15, Tan et al. have used an improved
version of a previously published kinetic Monte Carlo
model, now taking into account inter-particle interactions.153
The study is mainly focused on how SAR is influenced by the
concentration of the nearest neighbors around each particle
inside a lysosome. An interesting point of this work usually
absent in other models is the influence of the spatial distribu-
tion of the MNPs inside lysosomes, where the particles are
known to form largely distorted agglomerates of variable
size. Compared to the ideal situation of an ordered 3D MNPs
array, significant differences are observed in the heat dissipa-
tion of the agglomerate by positioning MNPs in a cubic lat-
tice and then introducing a disorder parameter. Simulations
illustrate the existing difference in heating power between
those MNPs situated at the surface of lysosomes and those in
the inner core (see Fig. 15). Such behavior is attributed to
the reduced number of nearest neighbors of the particles at
the ensemble’s surface and therefore to frustrated interac-
tions. The authors use these results to support the role of the
induced damage by MNPs in the lysosomal membrane, a cell
death mechanism proposed to cause the “cold” MH, i.e.,
with no global temperature rise, reported by several
authors.154,155
IV. PHYSICAL CHARACTERIZATION OF MNPs AND ITSTECHNICAL APPROACH
As important as the preparation of MNPs with physical
properties suitable for MH and the development and under-
standing of better models to describe the heat dissipation of
magnetic colloids, the proper physical characterization of
MNPs and its respective instrumentation play an important
role. This section addresses aspects of utmost importance for
MH experiments, as more conventional methods in magne-
tometry of molecular and inorganic magnets can be read in
textbooks.
The accuracy of experimental SAR values to better
understand the heating mechanisms and thus to optimize
their performances is fundamental in MH. Electromagnetic
applicators able to generate AMF well-characterized in a cer-
tain volume are mandatory in order to perform experimental
research in the field of magnetic hyperthermia. The usablevolume or the usable gap of such an electromagnetic applica-
tor determines the dimensions of the spatial region where the
sample would be placed. By requirement, the intensity of the
applied AMF must be homogeneous inside the usable
volume.
The common frequency range employed in MH experi-
ments extends from 50 kHz to 1 MHz.18,19 Due to the spatial
dimensions of the problem and the very much larger wave-
lengths (k> 300 m) associated to these AMF frequencies, a
suitable way to produce AMF with large intensity values is to
circulate an AC current of the same frequency across a con-
ductor. To concentrate the magnetic flux B and to increase
the AMF intensity, the conductor can be wound forming a
coil or inductor. Two different strategies can be followed to
generate an intense and homogeneous AMF in the usable vol-
ume. The first one involves air-coils with the usable volume
and the sample located in the center of the coil, where
the field is more homogeneous and intense33,156–158,162
(see Fig. 16(a)). The second one involves using soft ferro-
magnetic cores to concentrate the magnetic flux B inside
the sample and to produce a more homogeneous field18,159FIG. 14. Distribution of citric acid coated iron oxide nanoparticles inside
endosomes in DX3 human melanoma cells. Courtesy of Blanco-Andujar.
041302-18 P�erigo et al. Appl. Phys. Rev. 2, 041302 (2015)
This article is copyrighted as indicated in the article. Reuse of AIP content is subject to the terms at: http://scitation.aip.org/termsconditions. Downloaded to IP:
158.64.77.122 On: Tue, 01 Dec 2015 08:52:59
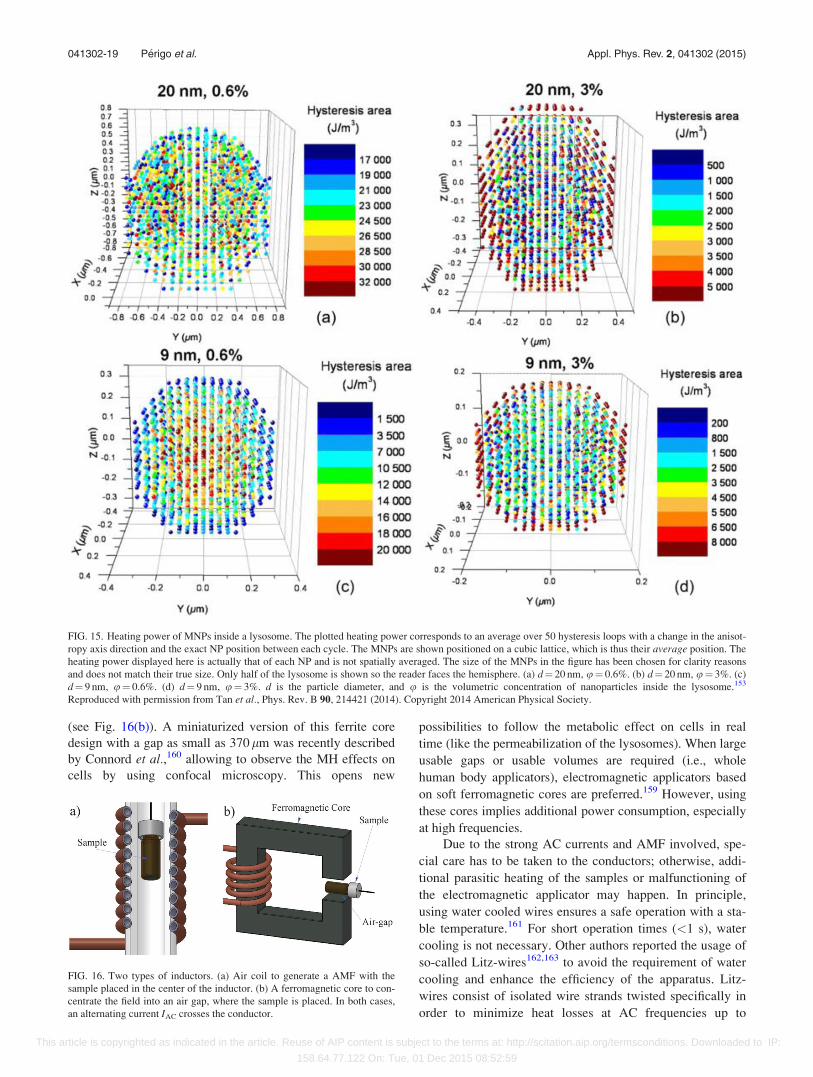
(see Fig. 16(b)). A miniaturized version of this ferrite core
design with a gap as small as 370 lm was recently described
by Connord et al.,160 allowing to observe the MH effects on
cells by using confocal microscopy. This opens new
possibilities to follow the metabolic effect on cells in real
time (like the permeabilization of the lysosomes). When large
usable gaps or usable volumes are required (i.e., whole
human body applicators), electromagnetic applicators based
on soft ferromagnetic cores are preferred.159 However, using
these cores implies additional power consumption, especially
at high frequencies.
Due to the strong AC currents and AMF involved, spe-
cial care has to be taken to the conductors; otherwise, addi-
tional parasitic heating of the samples or malfunctioning of
the electromagnetic applicator may happen. In principle,
using water cooled wires ensures a safe operation with a sta-
ble temperature.161 For short operation times (<1 s), water
cooling is not necessary. Other authors reported the usage of
so-called Litz-wires162,163 to avoid the requirement of water
cooling and enhance the efficiency of the apparatus. Litz-
wires consist of isolated wire strands twisted specifically in
order to minimize heat losses at AC frequencies up to
FIG. 16. Two types of inductors. (a) Air coil to generate a AMF with the
sample placed in the center of the inductor. (b) A ferromagnetic core to con-
centrate the field into an air gap, where the sample is placed. In both cases,
an alternating current IAC crosses the conductor.
FIG. 15. Heating power of MNPs inside a lysosome. The plotted heating power corresponds to an average over 50 hysteresis loops with a change in the anisot-
ropy axis direction and the exact NP position between each cycle. The MNPs are shown positioned on a cubic lattice, which is thus their average position. The
heating power displayed here is actually that of each NP and is not spatially averaged. The size of the MNPs in the figure has been chosen for clarity reasons
and does not match their true size. Only half of the lysosome is shown so the reader faces the hemisphere. (a) d¼ 20 nm, u¼ 0.6%. (b) d¼ 20 nm, u¼ 3%. (c)
d¼ 9 nm, u¼ 0.6%. (d) d¼ 9 nm, u¼ 3%. d is the particle diameter, and u is the volumetric concentration of nanoparticles inside the lysosome.153
Reproduced with permission from Tan et al., Phys. Rev. B 90, 214421 (2014). Copyright 2014 American Physical Society.
041302-19 P�erigo et al. Appl. Phys. Rev. 2, 041302 (2015)
This article is copyrighted as indicated in the article. Reuse of AIP content is subject to the terms at: http://scitation.aip.org/termsconditions. Downloaded to IP:
158.64.77.122 On: Tue, 01 Dec 2015 08:52:59

1 MHz. The rationale of this approach is that, according to
Maxwell equations, the current density is confined in a thin
layer at the surface of the conducting medium (skin effect),
therefore having multiple strands rather than a single wire
offer a higher cross sectional area and thus a lower current
density, minimizing heating by Joule effect.
An AC electrical current (IAC) has to flow across the
coil in order to generate the AMF. When IAC flows across
the coil, it dissipates a power W expressed by
W ¼ 1
2RI2
AC; (4.1)
where R is the equivalent series resistance of the inductor. In
any case, the power W must be provided by a power ampli-
fier. Given the inductive character of the coil, LC resonant
circuits connected to power amplifiers are a plausible
approach. Basically, two different circuit topologies can be
used: series and parallel resonant circuits (as shown in Fig.
17). These circuits must be fed by radiofrequency power
amplifiers. The output characteristics of the amplifiers
depend on the resonant circuit used: the output impedance
must match the circuit impedance in order to transmit the
maximum power to the circuit.161 The power matching can
also be achieved using transformers,162 although they con-
sume an additional power and hence may reduce the effi-
ciency of the electromagnetic applicator.
In recent years, an increasing number of works have
been published about SAR measurements of different MNPs,
as well as magnetic hyperthermia experiments performed
in vitro and in vivo. However, few of them give detail about
electromagnetic applicators used to generate the required
magnetic field. Tai and Chen164 reported an electromagnetic
applicator based on a series resonant circuit fed by two
MOSFET switchers in half-bridge inverter configuration.
The inductor consisted of a Litz-wire coil and a ferrite core.
Cano et al.165 constructed an induction heater device for
studies of magnetic hyperthermia and specific absorption
rate measurements based on a series resonant circuit fed by
four MOSFET switchers in full-bridge inverter configura-
tion. The device worked at a single frequency of 206 kHz
and it was able to generate H0¼ 11.9 kA m�1 (�150 Oe)
within the usable volume of 0.6� 0.5 cm, centered inside the
air-coil.
The amplifiers based in MOSFET switchers apply a
pulsed output signal to the resonant LRC circuit (see Fig.
18(a)), which filters a part of high-order harmonics, and the
resultant AC current across the main inductor is nearly sinu-
soidal. Other types of electromagnetic applicators fed by lin-
ear amplifiers have been also reported161–163,166 (see Fig.
18(b)). In this case, the input signal that feeds the resonant
circuit is almost sinusoidal, and hence, the resulting AC cur-
rent has a smaller component of high-order harmonics. In
general, power linear amplifiers have more restricted power
limitations, chiefly because the transistors have to dissipate
more energy (unlike MOSFET switchers).
Although MH experiments are strongly frequency de-
pendent, few applicators with adjustable magnetic field fre-
quency have been reported in the literature. Indeed, due to
the frequency dependent skin effects and the resistance of
magnetic applicators, the building of systems with the avail-
ability of frequency scan is technically challenging in this
broad frequency range. Lacroix et al.162 described a cost-
effective device based on a series LC circuit able to generate
AMF with intensities up to 3.82 kA m�1 (48 Oe) and with
frequencies ranging from 100 to 500 kHz in a useful gap
within the ferrite core of 1.1 cm. In this case, a Litz-wire was
used as conductor. Garaio et al.161 built an electromagnetic
applicator working in the 149–1030 kHz frequency range
with AMF amplitude up to 35 kA m�1 (�440 Oe) at the low-
est frequencies. The air core coil was able to apply the AMF
to a cylindrical usable volume of 31 mm in height and
18 mm in diameter. Bekovic et al.166 reported an electromag-
netic applicator able to apply a rotational AMF of H0¼ 4.1
kA m�1 (�52 Oe) intensity in the 20–160 kHz frequency
FIG. 18. (a) Example of a half h-
bridge amplifier with two MOSFET
transistors as switchers. The amplifier
feeds a series resonant circuit. (b) A
linear power amplifier connected to a
parallel resonant circuit. Note that the
output signal (Vout) of the h-bridge am-
plifier is pulsed, whereas the output
signal of the linear amplifier is nearly
sinusoidal.
FIG. 17. LC resonant circuits: (a) series and (b) parallel.
041302-20 P�erigo et al. Appl. Phys. Rev. 2, 041302 (2015)
This article is copyrighted as indicated in the article. Reuse of AIP content is subject to the terms at: http://scitation.aip.org/termsconditions. Downloaded to IP:
158.64.77.122 On: Tue, 01 Dec 2015 08:52:59

range. In all the cases, the multi-frequency feature was
achieved using variable capacitors that modify the resonant
frequency of the LCR circuits.
Electromagnetic applicators for experiments with large
laboratory animals have been also presented. D€urr et al.167
designed an AMF generator based on a parallel LC circuit
fed by a 50 X output impedance power amplifier. The animal
is placed between two flat pancake coils with variable dis-
tance (40–100 mm) and a maximum AMF intensity of 6.76
kA m�1 (�85 Oe). This applicator also worked at a single-
frequency (200 kHz). The first human-sized prototype
(MFHWVR
300F) was made by Jordan and coworkers.159 The
device works at an AMF frequency of 100 kHz and a vari-
able intensity from 2.5 to 18 kA m�1 (32–226 Oe), using a
soft ferromagnetic core to concentrate the field lines and to
produce a homogeneous AMF intensity in the gap.159
The AMF intensity has to be controlled during magnetic
hyperthermia experiments. Garaio et al.161 proposed the use
of an external control coil electromagnetically coupled with
the inductor that generates AMF. This coil is placed out of
the inductor, leaving free space for the sample inside it.
Bekovic et al.166 and Connord et al.163 proposed a control
coil with the same purpose but located inside the inductor
that generates the AMF. The electromotive force induced in
these coils is proportional to the product of AMF intensity
and frequency; it is thus possible to obtain the magnetic field
intensity with a data acquisition system. To insure non-
invasive measurement, the conducting wire of a scout coil
must be narrow (usually a diameter less than 250 lm) in
order to avoid heating by eddy currents induced by the AMF.
In addition, the AMF phase can be obtained from the phase
of the induced signal. A summary of the cited electromag-
netic applicators is listed in Table II.
A. SAR measurement
SAR is one of the most important parameters in the
design of MNPs for MH. This parameter is defined as the
absorbed power, normalized by the mass of MNPs, under an
applied AMF of certain frequency and intensity H0 (see Eq.
(4.2)). In other words, SAR quantifies the efficiency of MNPs
colloids to transform magnetic energy into heat
SAR ¼ Absorbed power
Mass of MNPs: (4.2)
SAR units are sometimes referred to watts per gram of
iron because it is the parameter related to MNPs mass which
can be most directly calculated from the molar concentration
[Fe] determined by spectroscopic assays titrating elemental
iron (UV-visible, ICP-MS, ICP-AES…) or relaxometric
methods using the molar mass of Fe (55.845 g mol�1).
However, a better suited way (although leading to lower nu-
merical values than the previous) is to express SAR in watts
per gram of MNPs (including oxygen) as from thermo-
gravimetric analysis (TGA). SAR can be related to the vol-
ume power density (Pvd) by
Pvd ¼ SAR � c; (4.3)
where c is the nanoparticle mass concentration: mass per
unit volume. In any case, SAR is a crucial parameter to deter-
mine Pvd and hence the tissue temperature during hyperther-
mia treatments. Overheating the tumor may result in serious
damage to the surrounding healthy cells or in uncontrolled
necrosis. On the contrary, the desired therapeutic effect can-
not be achieved if the temperature rise is not high enough.
SAR in MNPs strongly depends on the frequency and inten-
sity of AMF as well as on the chemical, physical, and mag-
netic properties of the material.33,156,168 Moreover, it also
depends on the dispersion media and the agglomeration
degree.34,169 SAR for the same nanoparticle batch can be dif-
ferent in a colloidal dispersion, powder sample or inserted
into a biological tissue; therefore, more reliable protocols for
measuring SAR in MNPs need to be established before MH
becomes a feasible cancer therapy. There are currently two
main groups under which SAR measurements methods can
be classified: calorimetric and magnetometric methods.
1. Calorimetric methods for SAR measurement
MNPs placed into an AMF absorb energy from the field
which is subsequently transformed into heat. If the field is
strong enough, and also thermal losses are small enough,
the generated heat rises the sample temperature. SAR is cal-
culated from the temperature derivative over time at instant
t ¼ 0 as
SAR ¼ Cp;s
mMNPs
���� dT
dt
����t¼0
; (4.4)
where Cp;s is the heat capacity of the sample and mNP is the
mass of the MNPs present in the sample. When MNPs are
dispersed in a medium, Cp;s in Eq. (4.4) is related to the
TABLE II. Cited electromagnetic applicators.
Description Inductor Field parameters
Jordan et al.159 Human-sized prototype Ferromagnetic core 100 kHz up to 18 kA m�1
Connord et al.160 Coupled with confocal microscopy Ferromagnetic core …
Garaio et al.161 Parallel LCC resonator Air-coil 149–1030 kHz up to 35 kA m�1
Lacroix et al.162 Series LC resonator Ferromagnetic core. Litz-wire 100–500 kHz up to 3.8 kA m�1
Tai and Chen164 Half-bridge inverter configuration Ferromagnetic core …
Cano et al.165 Full-bridge inverter configuration Air-coil 206 kHz. up to 12 kA m�1
Bekovic et al.166 Rotational magnetic field Air-coil 20–160 kHz up to 4.1 kA m�1
D€urr et al.167 Experiments with small animals 2 flat pancake coils 200 kHz up to 6.76 kA m�1
041302-21 P�erigo et al. Appl. Phys. Rev. 2, 041302 (2015)
This article is copyrighted as indicated in the article. Reuse of AIP content is subject to the terms at: http://scitation.aip.org/termsconditions. Downloaded to IP:
158.64.77.122 On: Tue, 01 Dec 2015 08:52:59
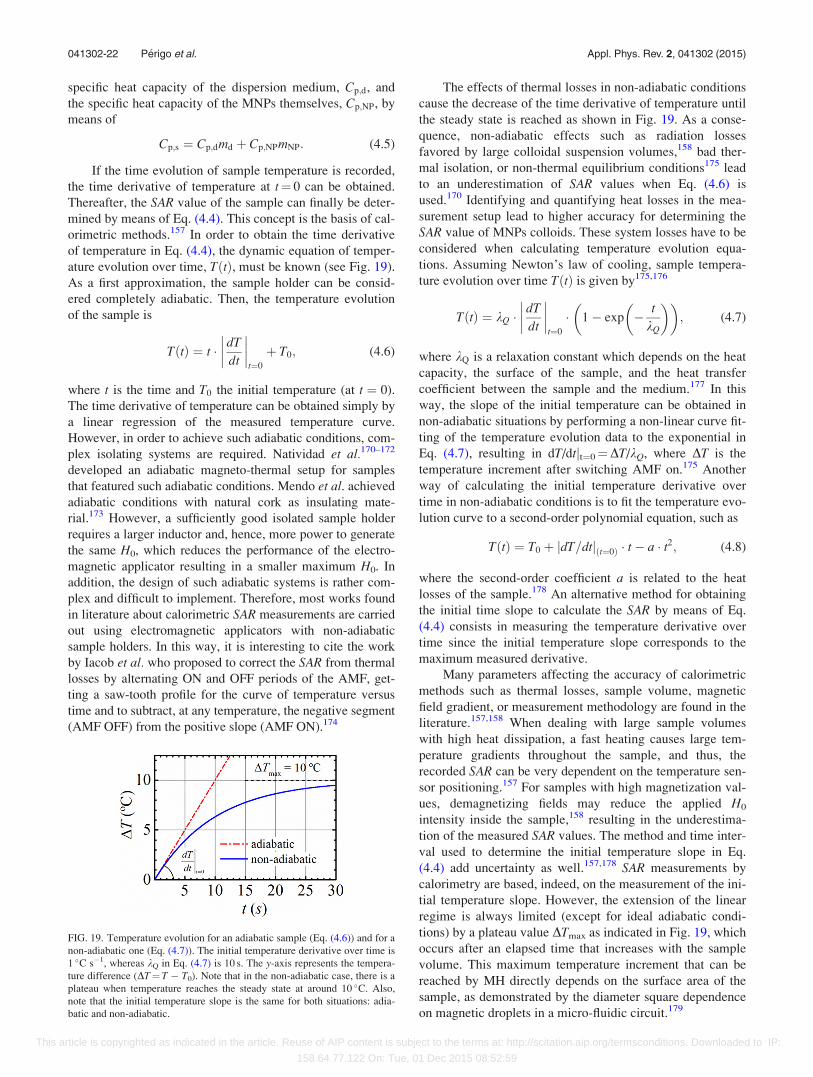
specific heat capacity of the dispersion medium, Cp;d, and
the specific heat capacity of the MNPs themselves, Cp;NP, by
means of
Cp;s ¼ Cp;dmd þ Cp;NPmNP: (4.5)
If the time evolution of sample temperature is recorded,
the time derivative of temperature at t¼ 0 can be obtained.
Thereafter, the SAR value of the sample can finally be deter-
mined by means of Eq. (4.4). This concept is the basis of cal-
orimetric methods.157 In order to obtain the time derivative
of temperature in Eq. (4.4), the dynamic equation of temper-
ature evolution over time, TðtÞ, must be known (see Fig. 19).
As a first approximation, the sample holder can be consid-
ered completely adiabatic. Then, the temperature evolution
of the sample is
T tð Þ ¼ t ����� dT
dt
����t¼0
þ T0; (4.6)
where t is the time and T0 the initial temperature (at t ¼ 0).
The time derivative of temperature can be obtained simply by
a linear regression of the measured temperature curve.
However, in order to achieve such adiabatic conditions, com-
plex isolating systems are required. Natividad et al.170–172
developed an adiabatic magneto-thermal setup for samples
that featured such adiabatic conditions. Mendo et al. achieved
adiabatic conditions with natural cork as insulating mate-
rial.173 However, a sufficiently good isolated sample holder
requires a larger inductor and, hence, more power to generate
the same H0, which reduces the performance of the electro-
magnetic applicator resulting in a smaller maximum H0. In
addition, the design of such adiabatic systems is rather com-
plex and difficult to implement. Therefore, most works found
in literature about calorimetric SAR measurements are carried
out using electromagnetic applicators with non-adiabatic
sample holders. In this way, it is interesting to cite the work
by Iacob et al. who proposed to correct the SAR from thermal
losses by alternating ON and OFF periods of the AMF, get-
ting a saw-tooth profile for the curve of temperature versus
time and to subtract, at any temperature, the negative segment
(AMF OFF) from the positive slope (AMF ON).174
The effects of thermal losses in non-adiabatic conditions
cause the decrease of the time derivative of temperature until
the steady state is reached as shown in Fig. 19. As a conse-
quence, non-adiabatic effects such as radiation losses
favored by large colloidal suspension volumes,158 bad ther-
mal isolation, or non-thermal equilibrium conditions175 lead
to an underestimation of SAR values when Eq. (4.6) is
used.170 Identifying and quantifying heat losses in the mea-
surement setup lead to higher accuracy for determining the
SAR value of MNPs colloids. These system losses have to be
considered when calculating temperature evolution equa-
tions. Assuming Newton’s law of cooling, sample tempera-
ture evolution over time TðtÞ is given by175,176
T tð Þ ¼ kQ ����� dT
dt
����t¼0
� 1� exp � t
kQ
� �� �; (4.7)
where kQ is a relaxation constant which depends on the heat
capacity, the surface of the sample, and the heat transfer
coefficient between the sample and the medium.177 In this
way, the slope of the initial temperature can be obtained in
non-adiabatic situations by performing a non-linear curve fit-
ting of the temperature evolution data to the exponential in
Eq. (4.7), resulting in dT/dtjt¼0¼DT/kQ, where DT is the
temperature increment after switching AMF on.175 Another
way of calculating the initial temperature derivative over
time in non-adiabatic conditions is to fit the temperature evo-
lution curve to a second-order polynomial equation, such as
TðtÞ ¼ T0 þ jdT=dtjðt¼0Þ � t� a � t2; (4.8)
where the second-order coefficient a is related to the heat
losses of the sample.178 An alternative method for obtaining
the initial time slope to calculate the SAR by means of Eq.
(4.4) consists in measuring the temperature derivative over
time since the initial temperature slope corresponds to the
maximum measured derivative.
Many parameters affecting the accuracy of calorimetric
methods such as thermal losses, sample volume, magnetic
field gradient, or measurement methodology are found in the
literature.157,158 When dealing with large sample volumes
with high heat dissipation, a fast heating causes large tem-
perature gradients throughout the sample, and thus, the
recorded SAR can be very dependent on the temperature sen-
sor positioning.157 For samples with high magnetization val-
ues, demagnetizing fields may reduce the applied H0
intensity inside the sample,158 resulting in the underestima-
tion of the measured SAR values. The method and time inter-
val used to determine the initial temperature slope in Eq.
(4.4) add uncertainty as well.157,178 SAR measurements by
calorimetry are based, indeed, on the measurement of the ini-
tial temperature slope. However, the extension of the linear
regime is always limited (except for ideal adiabatic condi-
tions) by a plateau value DTmax as indicated in Fig. 19, which
occurs after an elapsed time that increases with the sample
volume. This maximum temperature increment that can be
reached by MH directly depends on the surface area of the
sample, as demonstrated by the diameter square dependence
on magnetic droplets in a micro-fluidic circuit.179
FIG. 19. Temperature evolution for an adiabatic sample (Eq. (4.6)) and for a
non-adiabatic one (Eq. (4.7)). The initial temperature derivative over time is
1 �C s�1, whereas kQ in Eq. (4.7) is 10 s. The y-axis represents the tempera-
ture difference (DT¼T � T0). Note that in the non-adiabatic case, there is a
plateau when temperature reaches the steady state at around 10 �C. Also,
note that the initial temperature slope is the same for both situations: adia-
batic and non-adiabatic.
041302-22 P�erigo et al. Appl. Phys. Rev. 2, 041302 (2015)
This article is copyrighted as indicated in the article. Reuse of AIP content is subject to the terms at: http://scitation.aip.org/termsconditions. Downloaded to IP:
158.64.77.122 On: Tue, 01 Dec 2015 08:52:59

A “thermal inertia” on the measuring system is
observed in the initial temperature increment as depicted in
Fig. 20, where the temperature initially rises up slowly and it
starts to increase rapidly after a few seconds.158,178 Due to
this uncertainty about the initial time, SAR values obtained
by calorimetric methods can be underestimated. In addition,
SAR variation with temperature may also increase the error
of calorimetric methods, for example, if, due to the slowness
of calorimetric experiments, several SAR measurements are
averaged, although not having the same starting temperature.
When deducing Eqs. (4.6)–(4.8) for the temperature evolu-
tion, SAR is assumed temperature independent. However,
SAR values of self-regulated MNPs have strong temperature
dependence in the 300–330 K range due to their low Curie
temperature (�27 �C). Temperature variations of SAR up to
40% were also found in iron oxide MNPs in the 10–50 �Crange.166,180,181 Clearly, calorimetry-based methods are not
suitable to measure the temperature dependence of SAR val-
ues. The thermal dependence can be measured only when the
setup is perfectly adiabatic.171,172 In this case, the slope cor-
responds to the initial time slope in Eqs. (4.4) and (4.6) at
any time and temperature. In addition, precise measurements
of the heat capacity of the sample are necessary to achieve
an accurate SAR by means of Eq. (4.4).
2. Magnetometric methods for SAR measurement
The second approach to SAR measurement consists in
measuring the dynamic magnetization M(t) of the sample.
SAR values are subsequently obtained by integrating the
dynamic magnetization with respect to the magnetic field181
SAR ¼ f
cl0
þM tð Þ � dH0: (4.9)
The integral in Eq. (4.9) is performed over one period
(2p/f). Note that in order to solve the integral in Eq. (4.9),
the applied AMF intensity H0 has to be measured during the
corresponding period. It follows that SAR is proportional to
the area of the AC hysteresis loop as indicated in Fig. 21.
There are different methods to measure M(t) in the fre-
quency range of MH. The electromagnetic method based on
Faraday’s law of induction is the most direct and used one.
Experimentally, M(t) (as well as the applied AMF) is
measured by different pick-up coil systems. According to
Faraday’s law of induction, the following voltage e is
induced in the pick-up coil:
e ¼ � @/@t; (4.10)
where / is the magnetic flux that crosses the pick-up coils.
Hence, using Eq. (4.10), / across the sample can be obtained
by measuring the voltage induced in the pick-up coils sur-
rounding the MNPs sample, as shown in Fig. 22. However,
the magnetic flux density (B) is the sum of the AMF intensity
and the magnetization of the sample
B ¼ l0ðH0 þMðtÞÞ: (4.11)
Therefore, the voltage signal e is caused by the combination
of the applied AMF and the magnetization of the sample. In
FIG. 21. AC hysteresis loops obtained plotting the dynamic magnetization
M(t) as function of the applied field. The absorbed power is proportional to
the area of the loop.
FIG. 20. Time evolution of sample’s temperature increment for different
measured Pvd in Wc m�3. The inset displays the temperature evolution dur-
ing the first second.178 Reproduced with permission from E. Garaio et al., J.
Magn. Magn. Mater. 368, 432 (2014). Copyright 2014 Elsevier.
FIG. 22. Diagram of the pick–up coil together with the compensation coil.
Because the two coils are symmetric, the total induced voltage is null
(e1þ e2¼ 0) when the sample is absent.163,166 The drawings in this figure
are adapted with permission from Refs. 163 and 166.
041302-23 P�erigo et al. Appl. Phys. Rev. 2, 041302 (2015)
This article is copyrighted as indicated in the article. Reuse of AIP content is subject to the terms at: http://scitation.aip.org/termsconditions. Downloaded to IP:
158.64.77.122 On: Tue, 01 Dec 2015 08:52:59
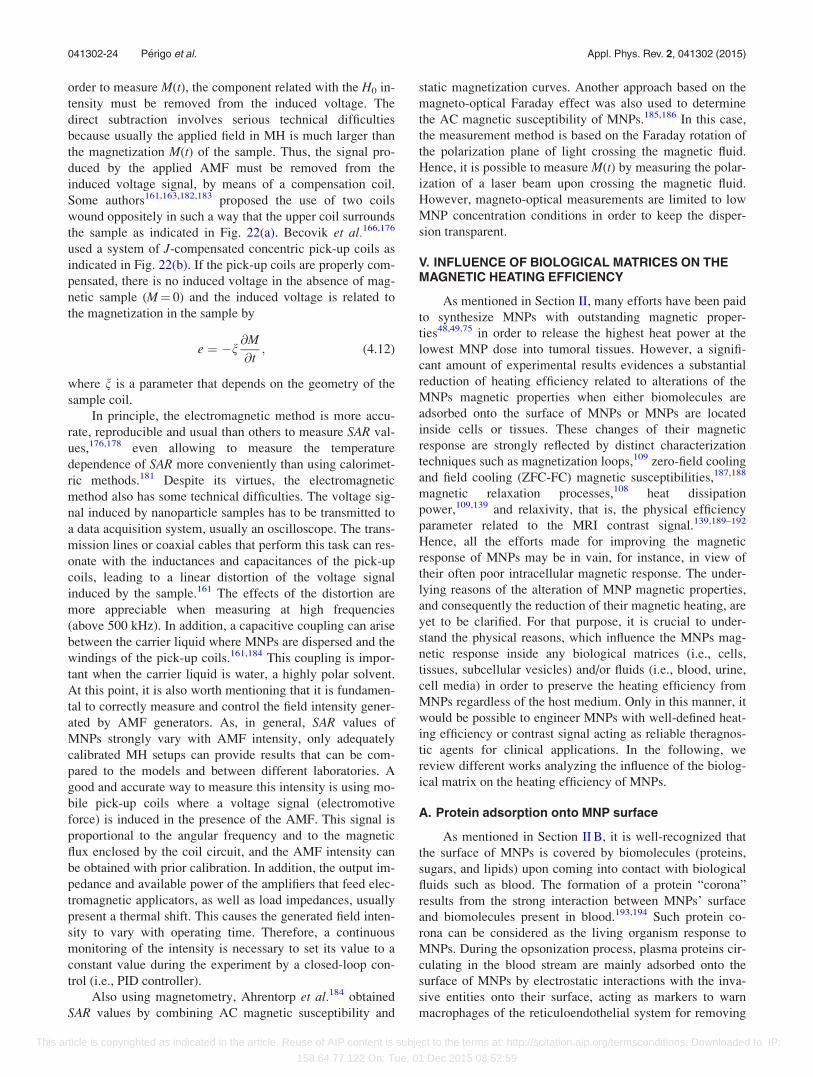
order to measure M(t), the component related with the H0 in-
tensity must be removed from the induced voltage. The
direct subtraction involves serious technical difficulties
because usually the applied field in MH is much larger than
the magnetization M(t) of the sample. Thus, the signal pro-
duced by the applied AMF must be removed from the
induced voltage signal, by means of a compensation coil.
Some authors161,163,182,183 proposed the use of two coils
wound oppositely in such a way that the upper coil surrounds
the sample as indicated in Fig. 22(a). Becovik et al.166,176
used a system of J-compensated concentric pick-up coils as
indicated in Fig. 22(b). If the pick-up coils are properly com-
pensated, there is no induced voltage in the absence of mag-
netic sample (M¼ 0) and the induced voltage is related to
the magnetization in the sample by
e ¼ �n@M
@t; (4.12)
where n is a parameter that depends on the geometry of the
sample coil.
In principle, the electromagnetic method is more accu-
rate, reproducible and usual than others to measure SAR val-
ues,176,178 even allowing to measure the temperature
dependence of SAR more conveniently than using calorimet-
ric methods.181 Despite its virtues, the electromagnetic
method also has some technical difficulties. The voltage sig-
nal induced by nanoparticle samples has to be transmitted to
a data acquisition system, usually an oscilloscope. The trans-
mission lines or coaxial cables that perform this task can res-
onate with the inductances and capacitances of the pick-up
coils, leading to a linear distortion of the voltage signal
induced by the sample.161 The effects of the distortion are
more appreciable when measuring at high frequencies
(above 500 kHz). In addition, a capacitive coupling can arise
between the carrier liquid where MNPs are dispersed and the
windings of the pick-up coils.161,184 This coupling is impor-
tant when the carrier liquid is water, a highly polar solvent.
At this point, it is also worth mentioning that it is fundamen-
tal to correctly measure and control the field intensity gener-
ated by AMF generators. As, in general, SAR values of
MNPs strongly vary with AMF intensity, only adequately
calibrated MH setups can provide results that can be com-
pared to the models and between different laboratories. A
good and accurate way to measure this intensity is using mo-
bile pick-up coils where a voltage signal (electromotive
force) is induced in the presence of the AMF. This signal is
proportional to the angular frequency and to the magnetic
flux enclosed by the coil circuit, and the AMF intensity can
be obtained with prior calibration. In addition, the output im-
pedance and available power of the amplifiers that feed elec-
tromagnetic applicators, as well as load impedances, usually
present a thermal shift. This causes the generated field inten-
sity to vary with operating time. Therefore, a continuous
monitoring of the intensity is necessary to set its value to a
constant value during the experiment by a closed-loop con-
trol (i.e., PID controller).
Also using magnetometry, Ahrentorp et al.184 obtained
SAR values by combining AC magnetic susceptibility and
static magnetization curves. Another approach based on the
magneto-optical Faraday effect was also used to determine
the AC magnetic susceptibility of MNPs.185,186 In this case,
the measurement method is based on the Faraday rotation of
the polarization plane of light crossing the magnetic fluid.
Hence, it is possible to measure M(t) by measuring the polar-
ization of a laser beam upon crossing the magnetic fluid.
However, magneto-optical measurements are limited to low
MNP concentration conditions in order to keep the disper-
sion transparent.
V. INFLUENCE OF BIOLOGICAL MATRICES ON THEMAGNETIC HEATING EFFICIENCY
As mentioned in Section II, many efforts have been paid
to synthesize MNPs with outstanding magnetic proper-
ties48,49,75 in order to release the highest heat power at the
lowest MNP dose into tumoral tissues. However, a signifi-
cant amount of experimental results evidences a substantial
reduction of heating efficiency related to alterations of the
MNPs magnetic properties when either biomolecules are
adsorbed onto the surface of MNPs or MNPs are located
inside cells or tissues. These changes of their magnetic
response are strongly reflected by distinct characterization
techniques such as magnetization loops,109 zero-field cooling
and field cooling (ZFC-FC) magnetic susceptibilities,187,188
magnetic relaxation processes,108 heat dissipation
power,109,139 and relaxivity, that is, the physical efficiency
parameter related to the MRI contrast signal.139,189–192
Hence, all the efforts made for improving the magnetic
response of MNPs may be in vain, for instance, in view of
their often poor intracellular magnetic response. The under-
lying reasons of the alteration of MNP magnetic properties,
and consequently the reduction of their magnetic heating, are
yet to be clarified. For that purpose, it is crucial to under-
stand the physical reasons, which influence the MNPs mag-
netic response inside any biological matrices (i.e., cells,
tissues, subcellular vesicles) and/or fluids (i.e., blood, urine,
cell media) in order to preserve the heating efficiency from
MNPs regardless of the host medium. Only in this manner, it
would be possible to engineer MNPs with well-defined heat-
ing efficiency or contrast signal acting as reliable theragnos-
tic agents for clinical applications. In the following, we
review different works analyzing the influence of the biolog-
ical matrix on the heating efficiency of MNPs.
A. Protein adsorption onto MNP surface
As mentioned in Section II B, it is well-recognized that
the surface of MNPs is covered by biomolecules (proteins,
sugars, and lipids) upon coming into contact with biological
fluids such as blood. The formation of a protein “corona”
results from the strong interaction between MNPs’ surface
and biomolecules present in blood.193,194 Such protein co-
rona can be considered as the living organism response to
MNPs. During the opsonization process, plasma proteins cir-
culating in the blood stream are mainly adsorbed onto the
surface of MNPs by electrostatic interactions with the inva-
sive entities onto their surface, acting as markers to warn
macrophages of the reticuloendothelial system for removing
041302-24 P�erigo et al. Appl. Phys. Rev. 2, 041302 (2015)
This article is copyrighted as indicated in the article. Reuse of AIP content is subject to the terms at: http://scitation.aip.org/termsconditions. Downloaded to IP:
158.64.77.122 On: Tue, 01 Dec 2015 08:52:59
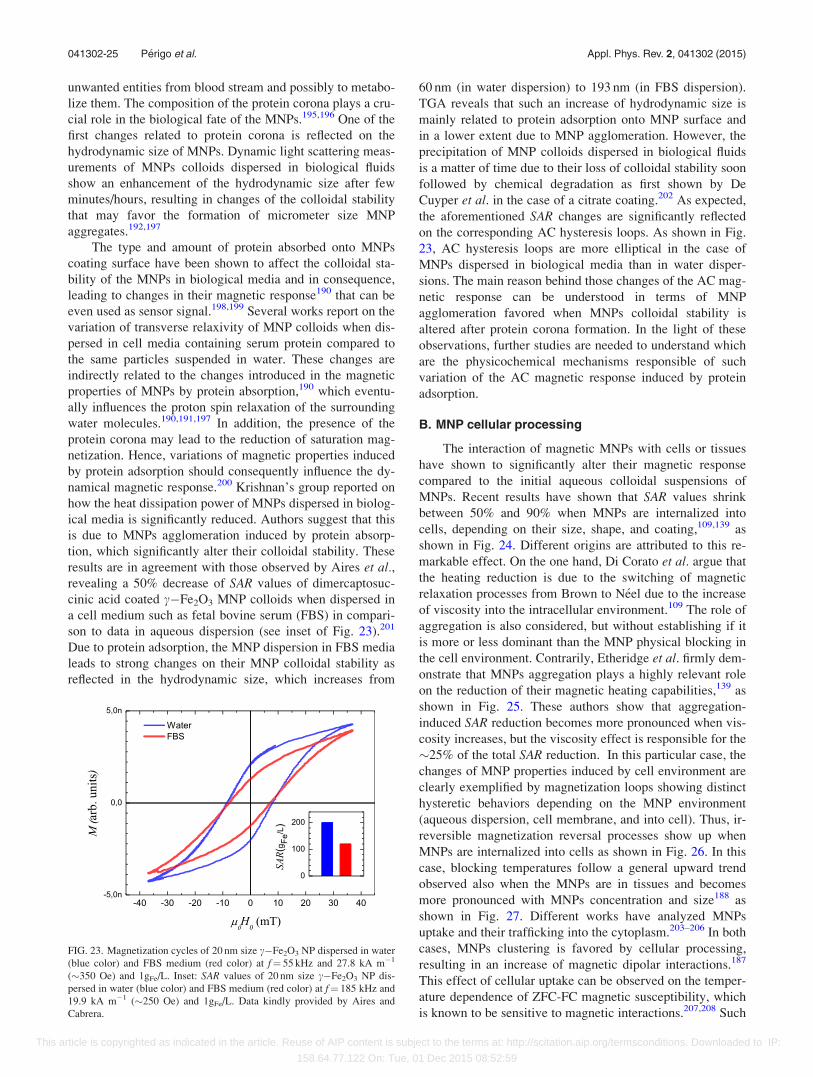
unwanted entities from blood stream and possibly to metabo-
lize them. The composition of the protein corona plays a cru-
cial role in the biological fate of the MNPs.195,196 One of the
first changes related to protein corona is reflected on the
hydrodynamic size of MNPs. Dynamic light scattering meas-
urements of MNPs colloids dispersed in biological fluids
show an enhancement of the hydrodynamic size after few
minutes/hours, resulting in changes of the colloidal stability
that may favor the formation of micrometer size MNP
aggregates.192,197
The type and amount of protein absorbed onto MNPs
coating surface have been shown to affect the colloidal sta-
bility of the MNPs in biological media and in consequence,
leading to changes in their magnetic response190 that can be
even used as sensor signal.198,199 Several works report on the
variation of transverse relaxivity of MNP colloids when dis-
persed in cell media containing serum protein compared to
the same particles suspended in water. These changes are
indirectly related to the changes introduced in the magnetic
properties of MNPs by protein absorption,190 which eventu-
ally influences the proton spin relaxation of the surrounding
water molecules.190,191,197 In addition, the presence of the
protein corona may lead to the reduction of saturation mag-
netization. Hence, variations of magnetic properties induced
by protein adsorption should consequently influence the dy-
namical magnetic response.200 Krishnan’s group reported on
how the heat dissipation power of MNPs dispersed in biolog-
ical media is significantly reduced. Authors suggest that this
is due to MNPs agglomeration induced by protein absorp-
tion, which significantly alter their colloidal stability. These
results are in agreement with those observed by Aires et al.,revealing a 50% decrease of SAR values of dimercaptosuc-
cinic acid coated c�Fe2O3 MNP colloids when dispersed in
a cell medium such as fetal bovine serum (FBS) in compari-
son to data in aqueous dispersion (see inset of Fig. 23).201
Due to protein adsorption, the MNP dispersion in FBS media
leads to strong changes on their MNP colloidal stability as
reflected in the hydrodynamic size, which increases from
60 nm (in water dispersion) to 193 nm (in FBS dispersion).
TGA reveals that such an increase of hydrodynamic size is
mainly related to protein adsorption onto MNP surface and
in a lower extent due to MNP agglomeration. However, the
precipitation of MNP colloids dispersed in biological fluids
is a matter of time due to their loss of colloidal stability soon
followed by chemical degradation as first shown by De
Cuyper et al. in the case of a citrate coating.202 As expected,
the aforementioned SAR changes are significantly reflected
on the corresponding AC hysteresis loops. As shown in Fig.
23, AC hysteresis loops are more elliptical in the case of
MNPs dispersed in biological media than in water disper-
sions. The main reason behind those changes of the AC mag-
netic response can be understood in terms of MNP
agglomeration favored when MNPs colloidal stability is
altered after protein corona formation. In the light of these
observations, further studies are needed to understand which
are the physicochemical mechanisms responsible of such
variation of the AC magnetic response induced by protein
adsorption.
B. MNP cellular processing
The interaction of magnetic MNPs with cells or tissues
have shown to significantly alter their magnetic response
compared to the initial aqueous colloidal suspensions of
MNPs. Recent results have shown that SAR values shrink
between 50% and 90% when MNPs are internalized into
cells, depending on their size, shape, and coating,109,139 as
shown in Fig. 24. Different origins are attributed to this re-
markable effect. On the one hand, Di Corato et al. argue that
the heating reduction is due to the switching of magnetic
relaxation processes from Brown to N�eel due to the increase
of viscosity into the intracellular environment.109 The role of
aggregation is also considered, but without establishing if it
is more or less dominant than the MNP physical blocking in
the cell environment. Contrarily, Etheridge et al. firmly dem-
onstrate that MNPs aggregation plays a highly relevant role
on the reduction of their magnetic heating capabilities,139 as
shown in Fig. 25. These authors show that aggregation-
induced SAR reduction becomes more pronounced when vis-
cosity increases, but the viscosity effect is responsible for the
�25% of the total SAR reduction. In this particular case, the
changes of MNP properties induced by cell environment are
clearly exemplified by magnetization loops showing distinct
hysteretic behaviors depending on the MNP environment
(aqueous dispersion, cell membrane, and into cell). Thus, ir-
reversible magnetization reversal processes show up when
MNPs are internalized into cells as shown in Fig. 26. In this
case, blocking temperatures follow a general upward trend
observed also when the MNPs are in tissues and becomes
more pronounced with MNPs concentration and size188 as
shown in Fig. 27. Different works have analyzed MNPs
uptake and their trafficking into the cytoplasm.203–206 In both
cases, MNPs clustering is favored by cellular processing,
resulting in an increase of magnetic dipolar interactions.187
This effect of cellular uptake can be observed on the temper-
ature dependence of ZFC-FC magnetic susceptibility, which
is known to be sensitive to magnetic interactions.207,208 Such
FIG. 23. Magnetization cycles of 20 nm size c�Fe2O3 NP dispersed in water
(blue color) and FBS medium (red color) at f¼ 55 kHz and 27.8 kA m�1
(�350 Oe) and 1gFe/L. Inset: SAR values of 20 nm size c�Fe2O3 NP dis-
persed in water (blue color) and FBS medium (red color) at f¼ 185 kHz and
19.9 kA m�1 (�250 Oe) and 1gFe/L. Data kindly provided by Aires and
Cabrera.
041302-25 P�erigo et al. Appl. Phys. Rev. 2, 041302 (2015)
This article is copyrighted as indicated in the article. Reuse of AIP content is subject to the terms at: http://scitation.aip.org/termsconditions. Downloaded to IP:
158.64.77.122 On: Tue, 01 Dec 2015 08:52:59
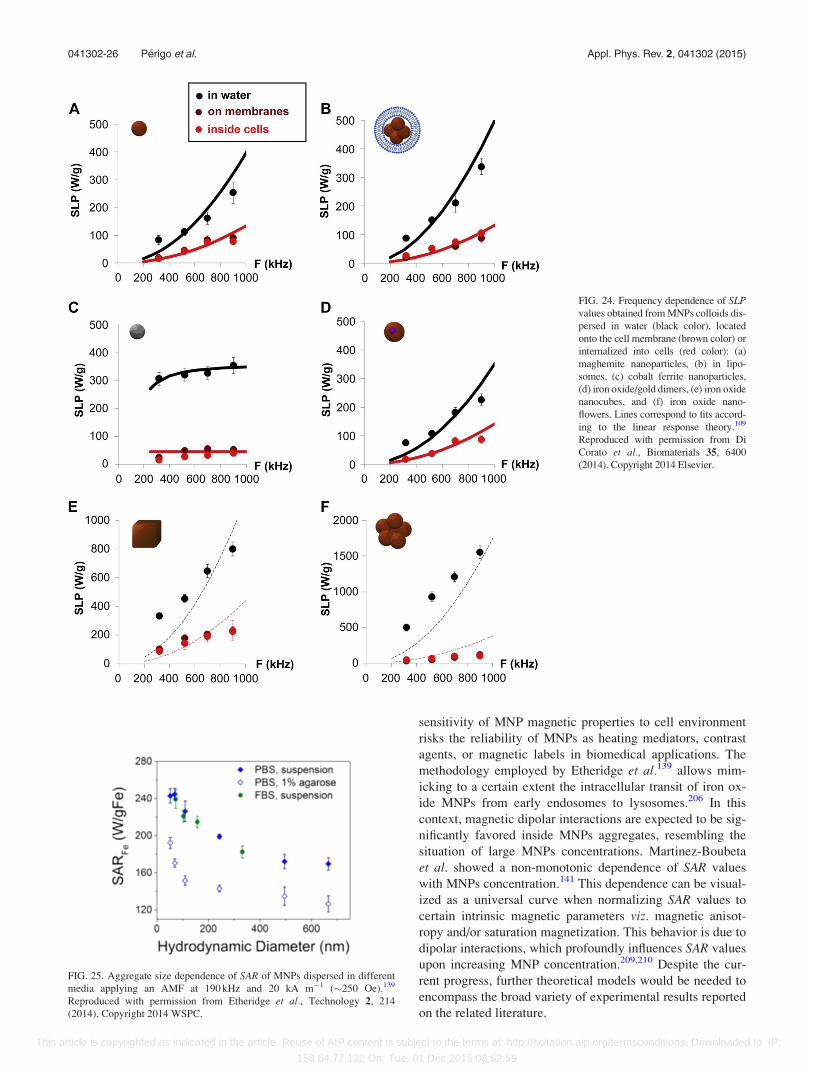
sensitivity of MNP magnetic properties to cell environment
risks the reliability of MNPs as heating mediators, contrast
agents, or magnetic labels in biomedical applications. The
methodology employed by Etheridge et al.139 allows mim-
icking to a certain extent the intracellular transit of iron ox-
ide MNPs from early endosomes to lysosomes.206 In this
context, magnetic dipolar interactions are expected to be sig-
nificantly favored inside MNPs aggregates, resembling the
situation of large MNPs concentrations. Martinez-Boubeta
et al. showed a non-monotonic dependence of SAR values
with MNPs concentration.141 This dependence can be visual-
ized as a universal curve when normalizing SAR values to
certain intrinsic magnetic parameters viz. magnetic anisot-
ropy and/or saturation magnetization. This behavior is due to
dipolar interactions, which profoundly influences SAR values
upon increasing MNP concentration.209,210 Despite the cur-
rent progress, further theoretical models would be needed to
encompass the broad variety of experimental results reported
on the related literature.
FIG. 24. Frequency dependence of SLPvalues obtained from MNPs colloids dis-
persed in water (black color), located
onto the cell membrane (brown color) or
internalized into cells (red color): (a)
maghemite nanoparticles, (b) in lipo-
somes, (c) cobalt ferrite nanoparticles,
(d) iron oxide/gold dimers, (e) iron oxide
nanocubes, and (f) iron oxide nano-
flowers. Lines correspond to fits accord-
ing to the linear response theory.109
Reproduced with permission from Di
Corato et al., Biomaterials 35, 6400
(2014). Copyright 2014 Elsevier.
FIG. 25. Aggregate size dependence of SAR of MNPs dispersed in different
media applying an AMF at 190 kHz and 20 kA m�1 (�250 Oe).139
Reproduced with permission from Etheridge et al., Technology 2, 214
(2014). Copyright 2014 WSPC.
041302-26 P�erigo et al. Appl. Phys. Rev. 2, 041302 (2015)
This article is copyrighted as indicated in the article. Reuse of AIP content is subject to the terms at: http://scitation.aip.org/termsconditions. Downloaded to IP:
158.64.77.122 On: Tue, 01 Dec 2015 08:52:59

The viscosity of the medium is another important pa-
rameter also linked to magnetic dipolar interactions, but it
has not received the attention it deserves. In a first approach,
it is widely accepted that medium viscosity may strongly
influence the magnetic relaxation processes governing the
heat generation by MNPs.33 In the case of SPM MNPs, mag-
netic moment relaxation processes follow Brown and N�eel
mechanisms.211 Fortin et al. reported on SAR values of iron
oxide MNPs dispersed in solvents with different viscosity to
discern the contributions from N�eel and Brownian mecha-
nisms to heat generation.33 Recent AC susceptometry results
show the in situ magnetic response of model systems of
blocked and SPM NP, following their cellular internalization
and subsequent release by freeze-thaw lysis.108 The AC sus-
ceptibility signal from internalized MNP in live cells showed
only N�eel relaxation, consistent with measurements of a sus-
pension of immobilized nanoparticles. However, Brownian
relaxation was restored after cell lysis, indicating that the
immobilization effect was reversible and that MNP integrity
was maintained inside cells. In addition, the role of the AMF
intensity on modifying those relaxation processes is not
totally clear, especially in the case of the Brownian one.
Besides its influence on determining the effective magnetic
relaxation times, medium viscosity also affects magnetic
dipolar interparticle interactions in ferromagnetic and SPM
MNPs.147,212 This is usually ascribed to the alignment degree
between the particle magnetic moment direction and its ani-
sotropy easy axis. The degree of this alignment strongly
influences the shape of the MNPs hysteresis loops140 and
hence the associated SAR values.140,147 Indeed, decreasing
SAR values in viscous MNPs colloids needs further explana-
tion. Considering that SAR¼A�f (Ref. 99)—where A is the
area of the hysteresis loop—one may expect strong varia-
tions in the shape, coercive field, and/or remanence of the
with MNPs concentration and viscosity of the medium.
Preliminary studies indicate that the shape of the hysteresis
FIG. 26. Magnetic properties of differ-
ent MNPs colloids dispersed in solu-
tion, located on the cell membrane, and
internalized inside cells. Magnetization
cycles measured at T¼ 300 K (left),
ZFC-FC magnetic susceptibility, meas-
ured at 4 kA m�1 (50 Oe) (right).109
Reproduced with permission from Di
Corato et al., Biomaterils 35, 6400
(2014). Copyright 2014 Elsevier.
041302-27 P�erigo et al. Appl. Phys. Rev. 2, 041302 (2015)
This article is copyrighted as indicated in the article. Reuse of AIP content is subject to the terms at: http://scitation.aip.org/termsconditions. Downloaded to IP:
158.64.77.122 On: Tue, 01 Dec 2015 08:52:59

loops becomes more elliptical when viscosity increases. This
viscosity-induced shape variation can be understood in terms
of the alignment between the particle magnetization and its
anisotropy easy axis, as proposed by Landi and Serantes
et al.140,147 Also, the variation of the coercive fields and
magnetization values at the highest field amplitude plays a
crucial role for defining the hysteretic area and consequently
the heat dissipation under AMF. Further experimental stud-
ies are required in order to verify how the shape of AC hys-
teresis loops (i.e., coercive field and remanence) of MNPs
colloids varies with the particle concentration and viscosity
media. Explaining this variation would place us in a position
to clarify the magnetic phenomena occurring inside cells or
tissues, which is mandatory to engineer the nanostructures
based on MNPs for heating with controlled energy release
independently of the biological matrix where MNPs are
hosted.
C. MNP biotransformation
In Sec. V B, we have discussed on the phenomenology
related to NP cell uptake, i.e., the enhancement of MNPs
clustering and media viscosity, which seems to be responsi-
ble of the drastic reduction of the heat dissipated from MNPs
inside biological matrices. Other important effect altering
the MNP magnetic response is related to the exposure to acid
environments and/or biochemical reactions into subcellular
vesicles (endosomes and/or lysosomes) or at the interstitial
extracellular location. Such conditions in biological environ-
ments lead to the MNP transformation, which can be totally
metabolized inside living organisms.213–215 In general, the
latter takes place when different types of proteins (such as
iron storage proteins) or enzymes (such as lysosomal diges-
tive enzymes) act to decide MNP fate, which is tightly de-
pendent on their surface properties/coating, charge, size, and
morphology. MNPs’ biodegradation processes in living
organisms216 have been proven to modify the MNPs atomic
structure resulting in a size reduction and therefore, resulting
in unavoidable changes of their magnetic proper-
ties,187,188,214,217 as shown in Fig. 27. The structural degrada-
tion of individual MNPs is driven by a stochastic corrosion
process that proceeds depending on the nature and the distri-
bution of particle coating, which controls surface reactivity
with chelating agents. Indeed, the availability of chelating
agents and their accessibility to the nanoparticle core are the
key factors regulating degradation kinetics. Lartigue et al.hypothesize that cells could timely orchestrate the redistribu-
tion of a nanoparticle from a dense assembly in early endo-
somes to a more dispersed and exposed state into lysosomal
compartments.216 This intracellular trafficking mechanism
results in reducing MNP size and increasing polydispersity.
In consequence, the magnetic properties of biodegraded
MNPs are significantly altered with time under acidic condi-
tions as shown in Table III.217 On the one hand, biodegrada-
tion leads to large presence of defects onto the MNPs
surface, which significantly contribute to increase spin disor-
der218 at the particle surface and values of surface magnetic
anisotropy constant Ks.212,214 On the other hand, the mag-
netic MNPs size polydispersity implies unsuitable magnetic
properties and, in consequence, tends to lower their heating
efficiency.49,219
FIG. 27. Upper (a) ZFC/FC magnetiza-
tion curves from AMNP dispersed in
water (black dots) and internalized into
macrophages at different iron loads per
cell (color dots) or with Sinerem_ MNP
(green dots, right). Lower (a) ZFC/FC
magnetization curves of spleen at dif-
ferent times after high dose or low
MNP dose injection of P904.188
Reproduced with permission from
L�evy et al., Nanoscale 3, 4402 (2011).
Copyright 2014 Royal Society of
Chemistry.
041302-28 P�erigo et al. Appl. Phys. Rev. 2, 041302 (2015)
This article is copyrighted as indicated in the article. Reuse of AIP content is subject to the terms at: http://scitation.aip.org/termsconditions. Downloaded to IP:
158.64.77.122 On: Tue, 01 Dec 2015 08:52:59
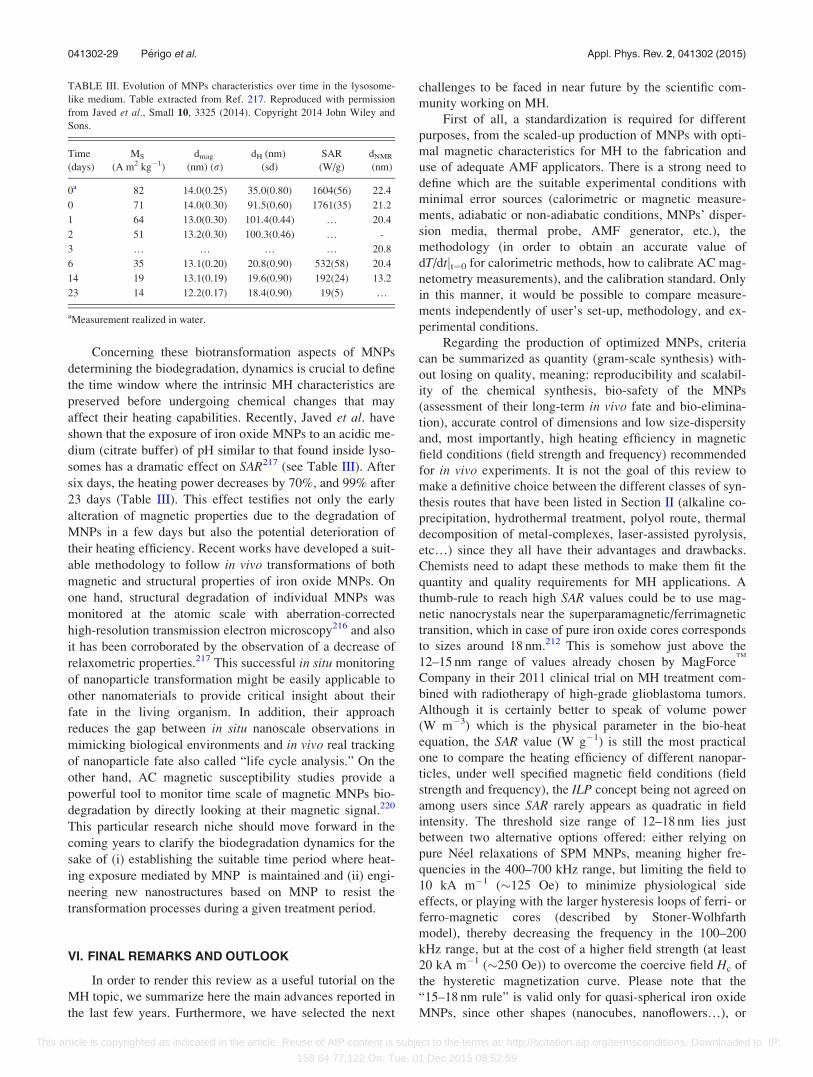
Concerning these biotransformation aspects of MNPs
determining the biodegradation, dynamics is crucial to define
the time window where the intrinsic MH characteristics are
preserved before undergoing chemical changes that may
affect their heating capabilities. Recently, Javed et al. have
shown that the exposure of iron oxide MNPs to an acidic me-
dium (citrate buffer) of pH similar to that found inside lyso-
somes has a dramatic effect on SAR217 (see Table III). After
six days, the heating power decreases by 70%, and 99% after
23 days (Table III). This effect testifies not only the early
alteration of magnetic properties due to the degradation of
MNPs in a few days but also the potential deterioration of
their heating efficiency. Recent works have developed a suit-
able methodology to follow in vivo transformations of both
magnetic and structural properties of iron oxide MNPs. On
one hand, structural degradation of individual MNPs was
monitored at the atomic scale with aberration-corrected
high-resolution transmission electron microscopy216 and also
it has been corroborated by the observation of a decrease of
relaxometric properties.217 This successful in situ monitoring
of nanoparticle transformation might be easily applicable to
other nanomaterials to provide critical insight about their
fate in the living organism. In addition, their approach
reduces the gap between in situ nanoscale observations in
mimicking biological environments and in vivo real tracking
of nanoparticle fate also called “life cycle analysis.” On the
other hand, AC magnetic susceptibility studies provide a
powerful tool to monitor time scale of magnetic MNPs bio-
degradation by directly looking at their magnetic signal.220
This particular research niche should move forward in the
coming years to clarify the biodegradation dynamics for the
sake of (i) establishing the suitable time period where heat-
ing exposure mediated by MNP is maintained and (ii) engi-
neering new nanostructures based on MNP to resist the
transformation processes during a given treatment period.
VI. FINAL REMARKS AND OUTLOOK
In order to render this review as a useful tutorial on the
MH topic, we summarize here the main advances reported in
the last few years. Furthermore, we have selected the next
challenges to be faced in near future by the scientific com-
munity working on MH.
First of all, a standardization is required for different
purposes, from the scaled-up production of MNPs with opti-
mal magnetic characteristics for MH to the fabrication and
use of adequate AMF applicators. There is a strong need to
define which are the suitable experimental conditions with
minimal error sources (calorimetric or magnetic measure-
ments, adiabatic or non-adiabatic conditions, MNPs’ disper-
sion media, thermal probe, AMF generator, etc.), the
methodology (in order to obtain an accurate value of
dT/dtjt¼0 for calorimetric methods, how to calibrate AC mag-
netometry measurements), and the calibration standard. Only
in this manner, it would be possible to compare measure-
ments independently of user’s set-up, methodology, and ex-
perimental conditions.
Regarding the production of optimized MNPs, criteria
can be summarized as quantity (gram-scale synthesis) with-
out losing on quality, meaning: reproducibility and scalabil-
ity of the chemical synthesis, bio-safety of the MNPs
(assessment of their long-term in vivo fate and bio-elimina-
tion), accurate control of dimensions and low size-dispersity
and, most importantly, high heating efficiency in magnetic
field conditions (field strength and frequency) recommended
for in vivo experiments. It is not the goal of this review to
make a definitive choice between the different classes of syn-
thesis routes that have been listed in Section II (alkaline co-
precipitation, hydrothermal treatment, polyol route, thermal
decomposition of metal-complexes, laser-assisted pyrolysis,
etc…) since they all have their advantages and drawbacks.
Chemists need to adapt these methods to make them fit the
quantity and quality requirements for MH applications. A
thumb-rule to reach high SAR values could be to use mag-
netic nanocrystals near the superparamagnetic/ferrimagnetic
transition, which in case of pure iron oxide cores corresponds
to sizes around 18 nm.212 This is somehow just above the
12–15 nm range of values already chosen by MagForceTM
Company in their 2011 clinical trial on MH treatment com-
bined with radiotherapy of high-grade glioblastoma tumors.
Although it is certainly better to speak of volume power
(W m�3) which is the physical parameter in the bio-heat
equation, the SAR value (W g�1) is still the most practical
one to compare the heating efficiency of different nanopar-
ticles, under well specified magnetic field conditions (field
strength and frequency), the ILP concept being not agreed on
among users since SAR rarely appears as quadratic in field
intensity. The threshold size range of 12–18 nm lies just
between two alternative options offered: either relying on
pure N�eel relaxations of SPM MNPs, meaning higher fre-
quencies in the 400–700 kHz range, but limiting the field to
10 kA m�1 (�125 Oe) to minimize physiological side
effects, or playing with the larger hysteresis loops of ferri- or
ferro-magnetic cores (described by Stoner-Wolhfarth
model), thereby decreasing the frequency in the 100–200
kHz range, but at the cost of a higher field strength (at least
20 kA m�1 (�250 Oe)) to overcome the coercive field Hc of
the hysteretic magnetization curve. Please note that the
“15–18 nm rule” is valid only for quasi-spherical iron oxide
MNPs, since other shapes (nanocubes, nanoflowers…), or
TABLE III. Evolution of MNPs characteristics over time in the lysosome-
like medium. Table extracted from Ref. 217. Reproduced with permission
from Javed et al., Small 10, 3325 (2014). Copyright 2014 John Wiley and
Sons.
Time
(days)
MS
(A m2 kg�1)
dmag
(nm) (r)
dH (nm)
(sd)
SAR
(W/g)
dNMR
(nm)
0a 82 14.0(0.25) 35.0(0.80) 1604(56) 22.4
0 71 14.0(0.30) 91.5(0.60) 1761(35) 21.2
1 64 13.0(0.30) 101.4(0.44) … 20.4
2 51 13.2(0.30) 100.3(0.46) … -
3 … … … … 20.8
6 35 13.1(0.20) 20.8(0.90) 532(58) 20.4
14 19 13.1(0.19) 19.6(0.90) 192(24) 13.2
23 14 12.2(0.17) 18.4(0.90) 19(5) …
aMeasurement realized in water.
041302-29 P�erigo et al. Appl. Phys. Rev. 2, 041302 (2015)
This article is copyrighted as indicated in the article. Reuse of AIP content is subject to the terms at: http://scitation.aip.org/termsconditions. Downloaded to IP:
158.64.77.122 On: Tue, 01 Dec 2015 08:52:59
other magnetic materials of different values of the magnetic
anisotropy, have a shifted magnetic transition of different
MNPs sizes.
Many physical parameters are known to affect the heat-
ing capabilities of MNPs, but from some recent results, it is
clear that magnetic anisotropy is key-one: MNPs with high
anisotropy are less sensitive to dipolar interaction effects,
and larger SAR values are obtained when increasing H0
above a threshold field. Equally, most of the predicted
behaviors for selected MNPs have been derived for AMF pa-
rameters producing major hysteresis loops, indicating that
field conditions lead to different hysteretic behaviors. In any
case, more effort should be put in further exploring the non-
linear region between SPM and hysteretic regimes, where
the most popular models may behave unpredictably and, at
the same time, most of the experimental data have been
obtained.
Physical models should be seen as complementary to
real-time imaging and other ancillary techniques for treat-
ment planning and monitoring, since they could hardly
model—at least for now—biochemical reactions like the
immunological call effect of heat in tissues or the activation
of heat-shock proteins under changing conditions. Moreover,
there is an unpredictable and complex relationship between
the different physical properties of biological entities, which
further complicates the task of bridging the gap between
theory and experiments. Depending on the body region or
tissue to be modeled, a proper multi-layer interface has to be
set in order to choose the appropriate boundary conditions.
Neglecting abrupt variations of physical properties across bi-
ological tissues (bones, blood vessels, etc.) leads to results
with little applicability; this also applies to the patient condi-
tion: for instance, it is known that diabetes cause a different
heat transfer depending on the body region. Other important
point to follow up during the ensuing years is tuning the
magnetic interparticle interactions, an aspect that is still
being neglected in a good deal of the new physical MH mod-
els. Despite the advances made so far in computing interpar-
ticle interactions towards modeling heat dissipation in MNPs
systems, more realistic in vivo simulations are yet to come
through their progressive integration into the existing (more)
physiological models. Finally, there is still a lack of system-
atic comparison between simulated and in vivo data to vali-
date the proposed physical models instead of also being
checked for other datasets, which seems to confirm that a
“one-fits-all” approach is not a realistic option for treating
different cancer types by MH.
Special attention has also to be paid to the spatial distri-
bution of the H0 intensity. Ideally, the experiments need a
homogeneous field. A suitable way to calculate the spatial
distribution of AMF is using FEM. There are several soft-
ware packages that implement this method for electromag-
netic field simulations. Axial symmetry can be assumed
when calculating the fields produced by coils, which reduces
the computational cost dramatically. It is recommended to
compare the theoretically obtained H0 values with the exper-
imental ones.
Regarding the SAR measurements of MNPs, special
attention has to be paid to the thermal losses when using
calorimetric methods. In this case, adiabatic sample holders
are preferred. Furthermore, the thermal dependence of SARhas to be taken into account when using these magneto-
thermal approaches. In general, the electromagnetic methods
like AC susceptibility and AC magnetometry are more accu-
rate methods than calorimetry. Although not discussed in the
present article, thermometry is one of the MH aspects requir-
ing more attention in the near future. Besides the typical
invasive methods based on the use of inserted thermal
probes, there are promising non-invasive methods, among
which MRI and computerized tomography are the most pop-
ular choices. Taking advantage of the temperature depend-
ence of some physical parameters (longitudinal relaxation
time, proton resonance frequency shift, diffusion constant of
water),221 MRI thermometry methods currently offer a sub-
millimeter spatial resolution but less precision on tempera-
ture and scan rate than when using a matrix (yet invasive) of
inserted thermal probes. Another promising bio-imaging
method that can potentially enable non-invasive thermome-
try is magnetic particle imaging (MPI) which is specific to
the presence of the MNPs in tissues: the thermal variation of
the high-order harmonics of AC magnetization was recently
proposed to monitor temperature.222,224 The calibration pro-
cess is very important for the development of better tempera-
ture measurement techniques, as different tissues/organs will
show different calibration curves for the same patient. New
thermometry methods are focused on taking advantage of the
nanoscale, more specifically on the use of “nano-
thermometers” that consist in quantum dots or lanthanide
complexes whose fluorescent emission depends on the tem-
perature.223 When coupled to the MNPs, such luminescent
probes can improve spatial resolution and offer a reliable
means to monitor temperature during MH treatments at a
subcellular scale, potentially solving the paradox of “cold
hyperthermia” (cellular death in the absence of a perceptible
rise of the macroscopic temperature of the medium).
We have also gathered experimental evidences on the
influence of the biological matrices and fluids on the magnetic
heating capabilities of MNPs. On the one hand, the formation
of a protein corona onto the MNP surface leads to changes in
the magnetic heating efficiency explained by the deterioration
of the MNP colloidal stability. In this respect, future chal-
lenges will require to engineer the MNP surface to avoid or
minimize protein adsorption into blood stream resulting in
changes of their magnetic response. Simultaneously, MNP
surface will be mandatory kept hydrophilic and neutral to pro-
vide biocompatibility and provided with chemical groups
favoring biomolecule conjugation. On the other hand, the
magnetic properties and response of MNPs inside cells and
tissues may be strongly altered due to MNP cellular process-
ing and biotransformation. Understanding of the influence of
the protein corona, intracellular nanoparticle transit, and the
transformation on the MNP magnetic properties is a key issue
for the efficient use of MNP in MH, as well as many other bio-
medical applications. For that reason, it is recommended to
check the actual magnetic response of MNP colloids in true
biological environments and physiological conditions in order
to engineer MNPs with robust and reliable magnetic heating
capabilities.
041302-30 P�erigo et al. Appl. Phys. Rev. 2, 041302 (2015)
This article is copyrighted as indicated in the article. Reuse of AIP content is subject to the terms at: http://scitation.aip.org/termsconditions. Downloaded to IP:
158.64.77.122 On: Tue, 01 Dec 2015 08:52:59

Finally, a word of caution must be raised regarding the
AMF generation technologies, specially, concerning the tol-
erance and/or safety limits of AMF exposure. Since both H0
and f play a relevant role in the magnetic heating capabilities
of MNP, the range of tolerable or adequate field amplitudes/
frequencies for humans needs to be established. In the last
20 years, there has been a remarkable technological progress
in the use of high performance AMF generators delivering
AC magnetic fields of high frequency (up to tens of MHz)
and intensity (up to 310 kA m�1) as shown in Fig. 28(a).
Comparing the experimental H0 and f values for different
magnetic heating studies—namely, SAR measurement as
well as in vitro and in vivo MH—reported in the analyzed
set of references, there is around three times more variation
in f than in H0. On the one hand, most of the reported H0 val-
ues are below 50 kA m�1, with a median of �16 kA m�1,
and the highest intensities achieved have increased almost
monotonically from the second half of the 2000s towards the
present. On the other hand, the most popular f values are
within the 100–400 kHz range, with a median of �233 kHz.
Considering the type of experiment carried out, the number
of in vitro MH experiments has remained approximately
constant throughout the last 20 years. However, there is a no-
ticeable concentration of articles concerning SAR measure-
ments during the second half of 2000s, whereas those
dealing with in vivo experiments became ubiquitous since
2010 (Fig. 28(b)).
The only reliable tolerance limit for AMF exposure in
MH treatments that is available to date was suggested by
Brezovich, who experimentally estimated three decades ago
that the H0�f product should not go beyond 4.85� 108
A(ms)�1 for a safe AMF use in humans.14 However, this ex-
perimental finding sometimes quoted “Brezovich limit” must
be revised considering the underlying premises and also the
current technologies for AMF generation for clinical applica-
tions. First, and most importantly, it relates to the treatment
of an entire human thorax using a coil wrapped around it. In
many practical cases, the tumors to be treated are localized
in a particular region that by no means requires such an
extensive application. In addition, this particular configura-
tion is known to favor the occurrence of eddy currents and
therefore non-specific heating, unlike other systems that pro-
ject the field into the body.159 Although these limitations
make the Brezovich criterion to be taken as a mere upper ex-
posure limit, yet 45% of the experimental H0�f values exceed
it (Fig. 28(a)). Remarkably, many of them were reported
well after the Berzovich criterion was first published.
Whatever the cause may be—impetus for getting well posi-
tioned in the race for the MNPs with the highest SAR value,
inadequate experimental setup, or simply ignorance of the
limit—this observation evidences the lack of tolerance limits
specific to MH, which in turn hinders the design of clinical
trials. Therefore, a consensus must be urgently reached by
the MH research community to make real progresses towards
its acceptance as a recognized treatment method in the clini-
cal practice.
ACKNOWLEDGMENTS
The authors thank the European COST action TD1402
(RADIOMAG). This work has been partially supported by
European Commission (MULTIFUN, No. 262943), Spanish
Ministry of Economy and Competitiveness (MAT2013-
47395-C4-3-R), and Madrid Regional Government
(NANOFRONTMAG-CM S2013/MIT-2850). F. J. Teran
acknowledges financial support from Ramon y Cajal
subprogram (RYC-2011-09617). Dr. Antonio Aires and
David Cabrera are deeply acknowledged for kindly
supplying data shown in Fig. 23. D. Ortega is grateful for the
support received through the AMAROUT-II Marie Curie
Action under the European Commission’s FP7 PEOPLE-
COFUND Program and a Research Fund grant from the
Royal Society of Chemistry. E. Garaio and F. Plazaola
FIG. 28. (a) 3D scatter plot showing the main experimental conditions
reported in a set of 120 publications on MH spanning over the last 25 years.
Scatter size is proportional to the H0�f product. Green dots of different inten-
sities are the 2D projection of the central scatter over the XY, XZ, and YZ
planes. The color code of the spheres is related to the type of assay described
in the corresponding publication: red refers to in vivo tests, yellow to in vitrotests, blues to combined in vivo/in vitro tests, and cyan to SAR measure-
ments. The dashed black curve superimposed to the field intensity vs maxi-
mum frequency plane indicates the “Brezovich” or H0�f criterion, along
which the H0�f¼ 4.8� 108 A(ms)�1 condition is fulfilled [note that the
experiments complying with this criterion are those below the curve]. (b)
Zoom of the most populated region of (a), where the concentration of SARmeasurements in the 2005–2009 period an in vivo tests in the 2010–2015 pe-
riod is shown.
041302-31 P�erigo et al. Appl. Phys. Rev. 2, 041302 (2015)
This article is copyrighted as indicated in the article. Reuse of AIP content is subject to the terms at: http://scitation.aip.org/termsconditions. Downloaded to IP:
158.64.77.122 On: Tue, 01 Dec 2015 08:52:59

acknowledge the Basque Government for financial support
under Grant No. IT-443–10. O. Sandre thanks the
department of Science and Technology of Univ. Bordeaux
for supporting G. Hemery’s Ph.D. thesis grant. E. A. P�erigo
acknowledges the financial support from the National
Research Fund of Luxembourg (ATTRACT Project No.
FNR/A09/01) and from the University of Luxembourg
(INTERFACE 2012 Project).
1O. Dahl and J. Overgaard, Acta Oncol. 34(8), 1075 (1995).2B. Hildebrandt, P. Wust, O. Ahlers, A. Dieing, G. Sreenivasa, T. Kerner,
R. Felix, and H. Riess, Crit. Rev. Oncol. Hematol. 43(1), 33 (2002).3J. Overgaard, “History and heritage,” Hyperthermic Oncology, edited by
J. Overgaard (Taylor & Francis, London, 1985), Vol. 2.4J. Lee, S. Mahendra, and P. J. J. Alvarez, ACS Nano 4, 3580 (2010).5A. Lenert, D. M. Bierman, Y. Nam, W. R. Chan, I. Celanovic, M.
Soljacic, and E. N. Wang, Nat. Nanotechnol. 9, 126 (2014).6K. Riehemann, S. W. Schneider, T. A. Luger, B. Godin, M. Ferrari, and
H. Fuchs, Angew. Chem. Int. Ed. 48, 872 (2009).7R. Mej�ıas, S. P�erez-Yag€ue, L. Guti�errez, L. I. Cabrera, R. Spada, P.
Acedo, C. J. Serna, F. J. L�azaro, �A. Villanueva, M. del Puerto Morales,
and D. F. Barber, Biomaterials 32, 2938 (2011).8P. Hahn, D. Stark, J. Lewis, S. Saini, G. Elizondo, R. Weissleder, C.
Fretz, and J. Ferrucci, Radiology 175, 695 (1990).9K. Maier-Hauff, F. Ulrich, D. Nestler, H. Niehoff, P. Wust, B. Thiesen,
H. Orawa, V. Budach, and A. Jordan, J. Neurooncol. 103, 317 (2011).10E. Moros, Physics of Thermal Therapy. Fundamentals and Clinical
Applications (Taylor & Francis, 2012).11X. Liu, H.-J. Chen, X. Chen, Y. Alfadhl, J. Yu, and D. Wen, Appl. Phys.
Rev. 2, 011103 (2015).12R. K. Gilchrist, R. Medal, W. D. Shorey, R. C. Hanselman, J. C. Parrot,
and C. B. Taylor, J. Ann. Surg. 146, 596 (1957).13R. Ivkov, Int. J. Hypertens. 29(8), 703 (2013).14I. A. Brezovich, Med. Phys. Monogr. 16, 82–111 (1988).15M. Cornell and U. Schwertmann, The Iron Oxides: Structure, Properties,
Reactions, Occurrence and Uses (Wiley-VCH, Weinheim, 1996).16H. F. Gomez, H. H. McClafferty, D. Flow, J. Brent, and R. C. Dart, Ann.
Ernerg. Med. 30, 587 (1997).17M. Berkovitch, A. Livne, G. Lushkov, M. Segal, C. Talmor, Y. Bentur, J.
Klein, and G. Koren, Am. J. Emerg. Med. 18, 36 (2000).18Q. A. Pankhurst, J. Connolly, S. K. Jones, and J. Dobson, J. Phys. D:
Appl. Phys. 36, R167 (2003).19S. Mornet, S. Vasseur, F. Grasset, and E. Duguet, Mater. Chem. 14, 2161
(2004).20J. Frenkel and J. Dorfman, Nature 126, 274 (1930).21M. Andr�es Verg�es, R. Costo, A. G. Roca, J. F. Marco, G. F. Goya, C. J.
Serna, and M. P. Morales, J. Phys. D: Appl. Phys. 41(13), 134003 (2008).22R. A. Ortega and T. D. Giorgio, J. Nanopart. Res. 14(12), 1282 (2012).23C. P. Bean and J. D. Livingston, J. Appl. Phys. 30(4), S120 (1959).24D. Yoo, J.-H. Lee, T.-H. Shin, and J. Cheon, Acc. Chem. Ress. 44(10),
863 (2011).25T. Iwamoto and T. Ishigaki, J. Phys.: Conf. Ser. 441, 012034 (2013).26R. Arbain, M. Othman, and S. Palaniandy, Min. Eng. 24(1), 1 (2011).27E. A. P�erigo, S. C. Silva, E. M. B. de Sousa, A. A. Freitas, R. Cohen, L.
C. C. M. Nagamine, H. Takiishi, and F. J. G. Landgraf, Nanotechnology
23(17), 175704 (2012).28R. Moskowitz and R. E. Rosensweig, Appl. Phys. Lett. 11, 301 (1967).29V. K. LaMer and R. H. Dinegar, J. Am. Chem. Soc. 72(11), 4847 (1950).30R. Massart, IEEE Trans. Magn. 17(2), 1247 (1981).31R. S. Molday and D. Mackenzie, J. Immunol. Methods 52(3), 353 (1982).32A. Abou-Hassan, O. Sandre, and V. Cabuil, “Microfluidics for the
synthesis of iron oxide nanoparticles,” in Microfluidic Devices inNanotechnology: Applications, edited by C. S. S. R. Kumar (John Wiley
& Sons, Inc., Hoboken, NJ, 2010), Chap. 9, pp. 323–360.33J.-P. Fortin, C. Wilhelm, J. Servais, C. M�enager, J.-C. Bacri, and F.
Gazeau, J. Am. Chem. Soc. 129(9), 2628 (2007).34R. E. Rosensweig, J. Magn. Magn. Mater. 252, 370 (2002).35V. T. A. Nguyen, M. Gauthier, and O. Sandre, Nanomaterials 4(3), 628
(2014).36F. Monte, M. P. Morales, D. Levy, A. Fernandez, M. Ocana, A. Roig, E.
Molins, K. O’Grady, and C. J. Serna, Langmuir 13, 3627 (1997).37N. Feltin and M. P. Pileni, Langmuir 13(15), 3927 (1997).
38S. Komarneni, E. Fregeau, E. Breval, and R. Roy, J. Am. Ceram. Soc.
71(1), C26 (1988).39V. Cabuil, V. Dupuis, D. Talbot, and S. Neveu, J. Magn. Magn. Mater.
323(10), 1238 (2011).40T. J. Daou, G. Pourroy, S. B�egin-Colin, J. M. Greneche, C. Ulhaq-
Bouillet, P. Legar�e, P. Bernhardt, C. Leuvrey, and G. Rogez, Chem.
Mater. 18(18), 4399 (2006).41S. Xuan, L. Hao, W. Jiang, X. Gong, Y. Hu, and Z. Chen, J. Magn. Magn.
Mater. 308(2), 210 (2007).42O. Horner, S. Neveu, S. de Montredon, J.-M. Siaugue, and V. Cabuil,
J. Nanopart. Res. 11(5), 1247 (2009).43T. Hyeon, S. S. Lee, J. Park, Y. Chung, and H. B. Na, J. Am. Chem. Soc.
123(51), 12798 (2001).44S. Sun and H. Zeng, J. Am. Chem. Soc. 124(28), 8204 (2002).45J. Park, K. An, Y. Hwang, J. G. Park, H. J. Noh, J. Y. Kim, J. H. Park, N.
M. Hwang, and T. Hyeon, Nat. Mater. 3, 891 (2004).46W. Baaziz, B. P. Pichon, S. Fleutot, Y. Liu, C. Lefevre, J.-M. Greneche, M.
Toumi, T. Mhiri, and S. Begin-Colin, J. Phys. Chem. C 118, 3795 (2014).47Y. Ramaye, S. Neveu, and V. Cabuil, J. Magn. Magn. Mater. 289, 28
(2005).48P. Guardia, R. Di Corato, L. Lartigue, C. Wilhelm, A. Espinosa, M.
Garcia-Hernandez, F. Gazeau, L. Manna, and T. Pellegrino, ACS Nano
6(4), 3080 (2012).49G. Salas, C. Casado, F. J. Teran, R. Miranda, C. J. Serna, and M. P.
Morales, J. Mater. Chem. 22(39), 21065 (2012).50B. P. Pichon, O. Gerber, C. Lefevre, I. Florea, S. Fleutot, W. Baaziz, M.
Pauly, M. Ohlmann, C. Ulhaq, O. Ersen, V. Pierron-Bohnes, P. Panissod,
M. Drillon, and S. Begin-Colin, Chem. Mater. 23, 2886 (2011).51G. Salazar-Alvarez, J. Qin, V. S�epelak, I. Bergmann, M. Vasilakaki, K.
N. Trohidou, J. D. Ardisson, W. A. A. Macedo, M. Mikhaylova, M.
Muhammed, M. D. Baro, and J. Nogu�es, J. Am. Chem. Soc. 130, 13234
(2008).52C. Martinez-Boubeta, K. Simeonidis, A. Makridis, M. Angelakeris, O.
Iglesias, P. Guardia, A. Cabot, L. Yedra, S. Estrade, F. Peiro, Z. Saghi, P.
A. Midgley, I. Conde-Leboran, D. Serantes, and D. Baldomir, Sci. Rep. 3,
1652 (2013).53W. W. Yu, J. C. Falkner, C. T. Yavuz, and V. L. Colvin, Chem.
Commun. 20, 2306 (2004).54M. Levy, A. Quarta, A. Espinosa, A. Figuerola, C. Wilhelm, M. Garcia-
Hernandez, A. Genovese, A. Falqui, D. Alloyeau, R. Buonsanti, P. D.
Cozzoli, M. A. Garcia, F. Gazeau, and T. Pellegrino, Chem. Mater. 23,
4170 (2011).55L. E. Euliss, S. G. Grancharov, S. O’Brien, T. J. Deming, G. D. Stucky,
C. B. Murray, and G. A. Held, Nano Lett. 3(11), 1489 (2003).56R. D. Palma, S. Peeters, M. J. V. Bael, H. V. d. Rul, K. Bonroy, W.
Laureyn, J. Mullens, G. Borghs, and G. Maes, Chem. Mater. 19(7), 1821
(2007).57T. Pellegrino, L. Manna, S. Kudera, T. Liedl, D. Koktysh, A. L. Rogach,
S. Keller, J. R€adler, G. Natile, and W. J. Parak, Nano Lett. 4(4), 703
(2004).58Z. P. Chen, Y. Zhang, S. Zhang, J. G. Xia, J. W. Liu, K. Xu, and N. Gu,
Colloids Surf. 316(1–3), 210 (2008).59J. H. Lee, J. T. Jang, J. S. Choi, S. H. Moon, S. H. Noh, J. W. Kim, J. G.
Kim, I. S. Kim, K. I. Park, and J. Cheon, Nat. Nanotechnol. 6(7), 418
(2011).60V. Gavrilov-Isaac, S. Neveu, V. Dupuis, D. Taverna, A. Gloter, and V.
Cabuil, Small 11, 2614 (2015).61D. Caruntu, Y. Remond, N. H. Chou, M.-J. Jun, G. Caruntu, J. He, G.
Goloverda, C. O’Connor, and V. L. Kolesnichenko, Inorg. Chem. 41,
6137 (2002).62G. Baldi, D. Bonacchi, F. Innocenti, G. Lorenzi, M. Bitossi, P. Ferruti,
E. Ranucci, A. Ricci, and F. M. Comes, Intl. patent WO 2008/074804 A2
(June 26, 2008).63P. Kucheryavy, J. He, V. T. John, P. Maharjan, L. Spinu, G. Z.
Goloverda, and V. L. Kolesnichenko, Langmuir 29(2), 710 (2013).64G. Baldi, D. Bonacchi, M. C. Franchini, D. Gentili, G. Lorenzi, A. Ricci,
and C. Ravagli, Langmuir 23(7), 4026 (2007).65D. Caruntu, G. Caruntu, Y. Chen, C. J. O’Connor, G. Goloverda, and V.
L. Kolesnichenko, Chem. Mater. 16, 5527 (2004).66P. Hugounenq, M. Levy, D. Alloyeau, L. Lartigue, E. Dubois, V. Cabuil,
C. Ricolleau, S. Roux, C. Wilhelm, F. Gazeau, and R. Bazzi, J. Phys.
Chem. C 116(29), 15702 (2012).67R. Ramesh, M. Rajalakshmi, C. Muthamizhchelvan, and S. Ponnusamy,
Mater. Lett. 70, 73 (2012).
041302-32 P�erigo et al. Appl. Phys. Rev. 2, 041302 (2015)
This article is copyrighted as indicated in the article. Reuse of AIP content is subject to the terms at: http://scitation.aip.org/termsconditions. Downloaded to IP:
158.64.77.122 On: Tue, 01 Dec 2015 08:52:59

68C. Cheng, F. Xua, and H. Gu, New J. Chem. 35, 1072 (2011).69X.-X. Bi, B. Granguly, G. P. Huffman, F. E. Huggins, M. Endo, and P. C.
Ecklund, J. Mater. Res. 8, 1666 (1993).70S. Veintemillas-Verdaguer, M. P. Morales, and C. J. Serna, Mater. Lett.
35, 227 (1998).71E. Popovici, F. Dumitrache, I. Morjan, R. Alexandrescu, V. Ciupina, G.
Prodan, L. Vekas, D. Bica, O. Marinica, and E. Vasile, Appl. Surf. Sci.
254, 1048–1052 (2007).72D. Markovic, V. Kusigerski, M. Tadic, J. Blanusa, M. V. Antisari, and V.
Spasojevic, Scr. Mater 59, 35 (2008).73R. Epherre, E. Duguet, S. Mornet, E. Pollert, S. Louguet, S.
Lecommandoux, C. Schatz, and G. Goglio, J. Mater. Chem. 21(12), 4393
(2011).74I. Bilecka, M. Kubli, E. Amstad, and M. Niederberger, J. Sol-Gel Sci.
Technol. 57, 313 (2011).75C. Blanco-Andujar, D. Ortega, P. Southern, Q. A. Pankhurst, and N. T. K.
Thanh, Nanoscale 7, 1768 (2015).76M. E. van Leeuwen and B. Smit, Phys. Rev. Lett. 71, 3991–3994 (1993).77M. Safi, H. Sarrouj, O. Sandre, N. Mignet, and J.-F. Berret,
Nanotechnology 21(14), 145103 (2010).78A. Jedlovszky-Hajd�u, F. B. Bombelli, M. P. Monopoli, E. Tomb�acz, and
K. A. Dawson, Langmuir 28, 14983–14991 (2012).79Y.-W. Choi, H. Lee, Y. Song, and D. Sohn, J. Colloid Interface Sci. 443,
8 (2015).80C. Xu, K. Xu, H. Gu, R. Zheng, H. Liu, X. Zhang, Z. Guo, and B. Xu,
J. Am. Chem. Soc. 126(32), 9938 (2004).81D. Ling, W. Park, Y. I. Park, N. Lee, F. Li, C. Song, S.-C. Yang, S. H.
Choi, K. Na, and T. Hyeon, Angew. Chem. Int. Ed. 50, 11360 (2011).82V. Torrisi, A. Graillot, L. Vitorazi, Q. Crouzet, G. Marletta, C. Loubat,
and J.-F. Berret, Biomacromolecules 15, 3171 (2014).83A. Walter, C. Billotey, A. Garofalo, C. Ulhaq-Bouillet, C. Lefevre, J.
Taleb, S. Laurent, L. Vander Elst, R. N. Muller, L. Lartigue, F. Gazeau,
D. Felder-Flesch, and S. Begin-Colin, Chem. Mater. 26(18), 5252–5264
(2014).84W. St€ober, A. Fink, and E. Bohn, J. Colloid Interface Sci. 26(1), 62
(1968).85J. Kim, H. S. Kim, N. Lee, T. Kim, H. Kim, T. Yu, I. C. Song, W. K.
Moon, and T. Hyeon, Angew. Chem. Int.-Ed. 47, 8438 (2008).86F. Ye, S. Laurent, A. Fornara, L. Astolfi, J. Qina, A. Roch, A. Martini, M.
S. Toprak, R. N. Muller, and M. Muhammed, Contrast Media Mol.
Imaging 7, 460 (2012).87M. Marciello, V. Connord, S. Veintemillas-Verdaguer, M. A. Verg�es, J.
Carrey, M. Respaud, C. J. Serna, and M. P. Morales, J. Mater. Chem. B 1,
5995 (2013).88S. Mornet, J. Portier, and E. Duguet, J. Magn. Magn. Mater. 293,
127–134 (2005).89C. Sanchez, D. El Hajj Diab, V. Connord, P. Clerc, E. Meunier, B. Pipy,
B. Payr�e, R. P. Tan, M. Gougeon, J. Carrey, V. Gigoux, and D. Fourmy,
ACS Nano 8, 1350–1363 (2014).90L. Pourtau, H. Oliveira, J. Thevenot, Y. Wan, A. Brisson, O. Sandre, S.
Miraux, E. Thiaudiere, and S. Lecommandoux, Adv. Healthcare Mater. 2,
1420–1424 (2013).91S. Dutz and R. Hergt, Int. J. Hyperthermia 29, 790 (2013).92S. Dutz and R. Hergt, Nanotechnology 25, 452001 (2014).93R. Hergt and W. Andr€a, in Magnetism in Medicine. A Handbook, edited
by W. Andr€a and H. Nowack (John Wiley & Sons, 2007), p. 550.94B. Kozissnik, A. C. Bohorquez, J. Dobson, and C. Rinaldi, Int. J.
Hyperthermia 29, 706 (2013).95A. E. Deatsch and B. A. Evans, J. Magn. Magn. Mater. 354, 163 (2014).96P. Moroz, S. K. Jones, and B. N. Gray, Int. J. Hyperthermia 18, 267 (2002).97M. Kallumadil, M. Tada, T. Nakagawa, M. Abe, P. Southern, and Q. A.
Pankhurst, J. Magn. Magn. Mater. 321, 1509 (2009).98R. R. Wildeboer, P. Southern, and Q. A. Pankhurst, J. Phys. D: Appl.
Phys. 47, 495003 (2014).99J. Carrey, B. Mehdaoui, and M. Respaud, J. Appl. Phys. 109, 083921
(2011).100H. Mamiya and B. Jeyadevan, Sci. Rep. 1, 157 (2011).101S. Mørup and E. Tronc, Phys. Rev. Lett. 72, 3278 (1994).102M. A. Martens, R. J. Deissler, Y. Wu, L. Bauer, Z. Yao, R. Brown, and
M. Griswold, Med. Phys. 40, 022303 (2013).103I. M. Perreard, D. B. Reeves, X. Zhang, E. Kuehlert, E. R. Forauer, and J.
B. Weaver, Phys. Med. Biol. 59, 1109 (2014).104M. Jeun, Y. Kim, K. Park, S. Paek, and S. Bae, J. Nanosc.
Nanotechnology 13, 5719 (2013).
105M. I. Shliomis and V. I. Stepanov, in Relaxation Phenomena inCondensed Matter, edited by W. T. Coffey (Wiley, New York, 1994).
106R. J. Deissler, Y. Wu, and M. A. Martens, Med. Phys. 41(1), 012301
(2014).107E. Lima, Jr., E. de Biasi, R. D. Zysler, M. M. Vasquez, M. L. M-Pisciotti,
T. E. Torres, M. P. Calatayud, C. Marquina, M. R. Ibarra, and G. F.
Goya, J. Nanopart. Res. 16, 2791 (2014).108D. Soukup, S. Moise, E. C�espedes, J. Dobson, and N. D. Telling, ACS
Nano 9, 231 (2015).109R. Di Corato, A. Espinosa, L. Lartigue, M. Tharaud, S. Chat, T.
Pellegrino, C. Menager, F. Gazeau, and C. Wilhelm, Biomaterials 35,
6400 (2014).110H. Mamiya, J. Nanomater. 2013, 752973.111Y. L. Raikher and V. I. Stepanov, J. Magn. Magn. Mater. 368, 421
(2014).112W. T. Coffey, Y. P. Kalmykov, and J. T. Waldron, The Langevin
Equation (World Scientific, 2004).113D. Serantes, D. Baldomir, C. Martinez-Boubeta, K. Simeonidis, M.
Angelakeris, E. Natividad, M. Castro, A. Mediano, D.-X. Chen, A.
Sanchez, L. Balcells, and B. Mart�ınez, J. Appl. Phys. 108, 073918 (2010).114G. T. Landi and A. F. Bakuzis, J. Appl. Phys. 111, 083915 (2012).115A. Riedinger, P. Guardia, A. Curcio, M. Garcia, R. Cingolani, L. Manna,
and T. Pellegrino, Nano Lett. 13(6), 2399 (2013).116J. Dong and J. I. Zink, ACS Nano 8, 5199 (2014).117K. Yue, C. Yu, Q. Lei, Y. Luo, and X. Zhang, Appl. Therm. Eng. 69, 11
(2014).118D. Ortega and Q. A. Pankhurst, in Nanoscience: Volume 1:
Nanostructures Through Chemistry, edited by P. O’Brien (Royal Society
of Chemistry, Cambridge, 2012), Vol. 1, p. 60.119H. H. Pennes, J. Appl. Physiol. 1, 93 (1948).120A. Bhowmik, R. Singh, R. Repaka, and S. C. Mishra, J. Therm. Biol. 38,
107 (2013).121E. H. Wissler, J. Appl. Physiol. 85, 35 (1998).122S. Weinbaum and L. M. Jiji, J. Biomech. Eng. 107, 131 (1985).123M. M. Chen and K. R. Holmes, Ann. N. Y. Acad. Sci. 335, 137 (1980).124C. Charny, Adv. Heat Transfer 22, 19 (1992).125H. Arkin, L. X. Xu, and K. R. Holmes, IEEE Trans. Biomed. Eng. 41, 97
(1994).126A. Candeo and F. Dughiero, IEEE Trans. Magn. 45, 1658 (2009).127G. Sreenivasa, J. Gellermann, B. Rau, J. Nadobny, P. Schlag, P.
Deuflhard, R. Felix, and P. Wust, Int. J. Radiat. Oncol. Biol. Phys. 55,
407 (2003).128A. Dabbagh, B. J. J. Abdullah, C. Ramasindarum, and N. H. Abu Kasim,
Ultrason. Imag. 36, 291 (2014).129F. Henrich, H. Rahn, and S. Odenbach, J. Magn. Magn. Mater. 351, 1
(2014).130P. Wust, H. F€ahling, J. Berger, A. Jordan, G. M€onich, and R. Felix, Int. J.
Hyperthermia 14, 183 (1998).131K. Yamada, T. Oda, S. Hashimoto, T. Enomoto, N. Ohkohchi, H. Ikeda,
H. Yanagihara, M. Kishimoto, E. Kita, A. Tasaki, M. Satake, Y. Ikehata,
H. Nagae, I. Nagano, T. Takagi, and T. Kanamori, Int. J. Hyperthermia
26, 465 (2010).132H. Zhang, Phys. Med. Biol. 53, N15 (2008).133A. Golneshan and M. Lahonian, Int. J. Hyperthermia 27, 266 (2011).134M. Lahonian and A. A. Golneshan, IEEE Trans. Nanobiosci. 10, 262
(2011).135C.-T. Lin and K.-C. Liu, Int. Cent. Heat Mass Transfer 36, 241 (2009).136M. Liangruksa, R. Ganguly, and I. K. Puri, J. Magn. Magn. Mater. 323,
708 (2011).137P. Moroz, S. Jones, J. Winter, and B. Gray, J. Surg. Oncol. 78, 22 (2001).138L. C. Branquinho, M. S. Carri~ao, A. S. Costa, N. Zufelato, M. H. Sousa,
R. Miotto, R. Ivkov, and A. F. Bakuzis, Sci. Rep. 3, 2887 (2013).139M. L. Etheridge, K. R. Hurley, J. Zhang, S. Jeon, H. L. Ring, C. Hogan,
C. L. Haynes, M. Garwood, and J. C. Bischof, Technology 2, 214
(2014).140G. T. Landi, Phys. Rev. B-Condens. Matter Mater. Phys. 89, 014403
(2014).141C. Martinez-Boubeta, K. Simeonidis, D. Serantes, I. C. Lebor�an, I.
Kazakis, G. Sefanou, L. Pena, R. Galceran, L. Balcells, C. Monty, D.
Baldomir, M. Mitrakas, and M. Angelakeris, Adv. Funct. Mater. 22, 3737
(2012).142C. L. Dennis, A. J. Jackson, Borchers, P. J. Hoopes, Strawbridge, A. R.
Foreman, J. Van Lierop, C. Grutner, and R. Ivkov, Nanotechnology 20,
395103 (2009).
041302-33 P�erigo et al. Appl. Phys. Rev. 2, 041302 (2015)
This article is copyrighted as indicated in the article. Reuse of AIP content is subject to the terms at: http://scitation.aip.org/termsconditions. Downloaded to IP:
158.64.77.122 On: Tue, 01 Dec 2015 08:52:59
143S. A. Gudoshnikov, B. Y. Liubimov, A. V. Popova, and N. A. Usov,
J. Magn. Magn. Mater. 324, 3690 (2012).144A. Cervadoro, C. Giverso, R. Pande, S. Sarangi, L. Preziosi, J. Wosik, A.
Brazdeikis, and P. Decuzzi, PLoS One 8, e57332 (2013).145S. Dutz, J. H. Clement, D. Eberbeck, T. Gelbrich, R. Hergt, R. M€uller, J.
Wotschadlo, and M. Zeisberger, J. Magn. Magn. Mater. 321, 1501
(2009).146J. Nowak, F. Wiekhorst, L. Trahms, and S. Odenbach, J. Phys: Condens.
Matter 26, 176004 (2014).147D. Serantes, K. Simeonidis, M. Angelakeris, O. Chubykalo-Fesenko, M.
Marciello, M. Del Puerto Morales, D. Baldomir, and C. Martinez-
Boubeta, J. Phys. Chem. C 118, 5927 (2014).148E. Alphand�ery, I. Chebbi, F. Guyot, and M. Durand-Dubief, Int. J.
Hyperthermia 29, 801 (2013).149B. Mehdaoui, R. P. Tan, A. Meffre, J. Carrey, S. Lachaize, B. Chaudret,
and M. Respaud, Phys. Rev. B 87, 174419 (2013).150S. Dutz, M. Kettering, I. Hilger, R. M€uller, and M. Zeisberger,
Nanotechnology 22, 265102 (2011).151A. Moore, E. Marecos, A. Bogdanov, and R. Weissleder, Radiology 214,
568 (2000).152S. Ruta, O. Hovorka, and R. Chantrell, Scientific Rept. 5, 9090 (2015).153R. P. Tan, J. Carrey, and M. Respaud, Phys. Rev. B 90, 214421 (2014).154M. Creixell, A. C. Boh�orquez, M. Torres-Lugo, and C. Rinaldi, ACS
Nano 5, 7124 (2011).155L. As�ın, G. Goya, A. Tres, and M. Ibarra, Cell Death Dis. 4, e596 (2013).156M. Ma, Y. Wu, J. Zhou, Y. Sun, Y. Zhang, and N. Gu, J. Magn. Magn.
Mater. 268, 33 (2004).157S.-Y. Wang, S. Huang, and D.-A. Borca-Tasciuc, IEEE Trans. Magn. 49,
255 (2013).158S. Huang, S.-Y. Wang, A. Gupta, D.-A. Borca-Tasciuc, and S. J. Salon,
Meas. Sci. Technol. 23, 035701 (2012).159U. Gneveckow, A. Jordan, R. Scholz, V. Br€uss, N. Wald€ofner, J. Ricke,
A. Feussner, B. Hildebrandt, B. Rau, and P. Wust, Med. Phys. 31, 1444
(2004).160V. Connord, P. Clerc, N. Hallali, D. El Hajj Diab, D. Fourmy, V. Gigoux,
and J. Carrey, Small 11, 2437 (2015).161E. Garaio, J. M. Collantes, F. Plazaola, J. A. Garcia, and I. Castellanos-
Rubio, Meas. Sci. Technol. 25, 115702 (2014).162L.-M. Lacroix, J. Carrey, and M. Respaud, Rev. Sci. Instrum. 79, 093909
(2008).163V. Connord, B. Mehdaoui, R. P. Tan, J. Carrey, and M. Respaud, Rev.
Sci. Instrum. 85, 093904 (2014).164C.-C. Tai and C.-C. Chen, in PIERS 2008 Hangzhou (2008), pp.
610–614.165M. E. Cano, A. Barrera, J. C. Estrada, A. Hernandez, and T. Cordova,
Rev. Sci. Instrum. 82, 114904 (2011).166M. Bekovic, M. Trlep, M. Jesenik, V. Gorican, and A. Hamler, J. Magn.
Magn. Mater. 331, 264 (2013).167S. D€urr, W. Schmidt, C. Janko, H. P. Kraemer, P. Tripal, F. Eiermann, R.
Tietze, S. Lyer, and C. Alexiou, Biomed. Tech. 58, 2 (2013).168R. Hergt, S. Dutz, R. M€uller, and M. Zeisberger, J. Phys.: Condens.
Matter 18, S2919 (2006).169Y. Pineiro-Redondo, M. Banobre-L�opez, I. Pardinas-Blanco, G. Goya,
M. Arturo L�opez-Quintela, and J. Rivas, Nanoscale Res. Lett. 6, 383
(2011).170E. Natividad, M. Castro, and A. Mediano, J. Magn. Magn. Mater. 321,
1497 (2009).171E. Natividad, M. Castro, G. Goglio, I. Andreu, R. Epherre, E. Duguet,
and A. Mediano, Nanoscale 4, 3954 (2012).172E. Natividad, M. Castro, and A. Mediano, Appl. Phys. Lett. 98, 243119
(2011).173S. G. Mendo, A. F. Alves, L. P. Ferreira, M. M. Cruz, M. H. Mendonca,
M. Godinho, and M. D. Carvalho, New J. Chem. 39, 7182 (2015).174N. Iacob, G. Schinteie, P. Palade, C. M. Ticos, and K. Kuncser, Eur.
Phys. J. E 38, 6 (2015).175F. J. Teran, C. Casado, N. Mikuszeit, G. Salas, A. Bollero, M. P. Morales,
J. Camarero, and R. Miranda, Appl. Phys. Lett. 101, 062413 (2012).176M. Bekovic and A. Hamler, IEEE Trans. Magn. 46, 552 (2010).177E. A. P�erigo, F. A. Sampaio, and M. F. de Campos, Appl. Phys. Lett.
103(26), 264107 (2013).178E. Garaio, J. M. Collantes, J. A. Garcia, F. Plazaola, S. Mornet, F.
Couillaud, and O. Sandre, J. Magn. Magn. Mater. 368, 432 (2014).179D. Habault, A. D�ery, J. Leng, S. Lecommandoux, J.-F. L. Meins, and O.
Sandre, IEEE Trans. Magn. 49, 182 (2013).
180R. Regmi, A. Naik, J. S. Thakur, P. P. Vaishnava, and G. Lawes, J. Appl.
Phys. 115, 17B301 (2014).181E. Garaio, O. Sandre, J.-M. Collantes, J. A. Garcia, S. Mornet, and F.
Plazaola, Nanotechnology 26, 015704 (2015).182S. A. Gudoshnikov, B. Y. Liubimov, and N. A. Usov, AIP Adv. 2,
012143 (2012).183B. Mehdaoui, J. Carrey, M. Stadler, A. Cornejo, C. Nayral, F.
Delpech, B. Chaudret, and M. Respaud, Appl. Phys. Lett. 100, 052403
(2012).184F. Ahrentorp, A. P. Astalan, C. Jonasson, J. Blomgren, B. Qi, O. T.
Mefford, M. Yan, J. Courtois, J.-F. Berret, J. Fresnais, O. Sandre, S.
Dutz, R. Muller, and C. Johansson, AIP Conf. Proc. 1311, 213 (2010).185L. Delaunay, S. Neveu, G. Noyel, and J. Monin, J. Magn. Magn. Mater.
149, L239 (1995).186S. Vandendriessche, W. Brullot, D. Slavov, V. K. Valev, and T. Verbiest,
Appl. Phys. Lett. 102, 161903 (2013).187M. L�evy, F. Gazeau, J.-C. Bacri, C. Wilhelm, and M. Devaud, Phys. Rev.
B 84, 075480 (2011).188M. L�evy, C. Wilhelm, N. Luciani, V. Deveaux, F. Gendron, A. Luciani,
M. Devaud, and F. Gazeau, Nanoscale 3, 4402 (2011).189M. L�evy, C. Wilhelm, M. Devaud, P. Levitz, and F. Gazeau, Contrast
Media Mol. Imaging 7, 373 (2012).190H. Amiri, L. Bordonali, A. Lascialfari, S. Wan, M. P. Monopoli, I.
Lynch, S. Laurent, and M. Mahmoudi, Nanoscale 5, 8656 (2013).191H. T. R. Wiogo, M. Lim, V. Bulmus, L. Guti�errez, R. C. Woodward, and
R. Amal, Langmuir 28, 4346 (2012).192J. B. Haun, T. J. Yoon, H. Lee, and R. Weissleder, Wiley Interdiscip.
Rev.: Nanomed. Nanobiotechnol. 2, 291 (2010).193T. Cedervall, I. Lynch, M. Foy, T. Berggard, S. C. Donnelly, G.
Cagney, S. Linse, and K. A. Dawson, Angew. Chem., Int. Ed. 46, 5754
(2007).194U. Sakulkhu, M. Mahmoudi, L. Maurizi, J. Salaklang, and H. Hofmann,
Sci. Rep. 4, 5020 (2014).195A. Salvati et al., Nature Nanotechnology 8, 137 (2013).196M. Mahmoudi, A. M. Abdelmonem, S. Behzadi, J. H. Clement, S. Dutz,
M. R. Ejtehadi, R. Hartmann, K. Kantner, U. Linne, P. Maffre, S.
Metzler, M. K. Moghadam, C. Pfeiffer, M. Rezaei, P. Ruiz-Lozano, V.
Serpooshan, M. A. Shokrgozar, G. U. Nienhaus, and W. J. Parak, ACS
Nano 7, 6555 (2010).197D. Eberbeck, M. Kettering, C. Bergemann, P. Zirpel, I. Hilger, and L.
Trahms, J. Phys. D: Appl. Phys. 43, 405002 (2010).198J. M. Perez, F. J. Simeone, A. Tsourkas, L. Josephson, and R. Weissleder,
Nano Lett. 4, 119 (2004).199M. Donolato, P. Antunes, R. S. Bejhed, T. Zard�an G�omez de la Torre, F.
W. Østerberg, M. Str€omberg, M. Nilsson, M. Strømme, P. Svedlindh, M.
F. Hansen, and P. Vavassori, Anal. Chem. 87, 1622 (2015).200A. P. Khandhar, R. M. Ferguson, and K. M. Krishnan, J. Appl. Phys. 109,
07B310 (2011).201A. Aires, D. Cabrera, S. M. Ocampo, L. de la Cueva, G. Salas, F. J.
Teran, and A. L. Cortajarena, J. Mater. Chem. B 3, 6239 (2015).202S. J. H. Soenen, U. Himmelreich, N. Nuytten, T. R. Pisanic II, A. Ferrari,
and M. De Cuyper, Small 6, 2136 (2010).203S. E. A. Gratton, P. A. Ropp, P. D. Pohlhaus, J. C. Luft, V. J. Madden, M.
E. Napier, and J. M. DeSimone, Proc Natl. Acad. Sci. U. S. A. 105,
11613 (2008).204W. Rimas et al., Biomaterials 34, 181 (2013).205A. Panariti, G. Miserocchi, and I. Rivoltam, Nanotechnol. Sci. Appl. 5,
87 (2012).206H. Hillaireau and P. Couvreur, Cell. Mol. Life Sci. 66, 2873 (2009).207J. Garc�ıa-Otero, M. Porto, J. Rivas, and A. Bunde, Phys. Rev. Lett. 84,
167 (2000).208M. Knobel, W. C. Nunes, H. Winnischofer, T. C. R. Rocha, L. M.
Socolovsky, C. L. Mayorga, and D. Zanchet, J. Non-Cryst. Solids 353,
743 (2007).209P. de la Presa, Y. Luengo, M. Multigner, R. Costo, M. P. Morales, G.
Rivero, and A. Hernando, J. Phys. Chem. C 116, 25602 (2012).210M. A. Verg�es, R. Costo, A. G. Roca, J. F. Marco, G. F. Goya, C. J. Serna,
and M. P. Morales, J. Phys. D: Appl. Phys. 41, 134003 (2008).211W. T. Coffey and Y. P. Kalmykov, J. Appl. Phys. 112, 121301 (2012).212G. Salas, J. Camarero, D. Cabrera, H. Takacs, M. Varela, R. Ludwig, H.
Da€uhring, I. Hilger, R. Miranda, M. del Puerto Morales, and F. J. Teran,
J. Phys. Chem. C 118, 19985 (2014).213K. Briley-Saebo, A. Bjørnerud, D. Grant, H. Ahlstrom, T. Berg, and G.
M. Kindberg, Cell Tissue Res. 316, 315 (2004).
041302-34 P�erigo et al. Appl. Phys. Rev. 2, 041302 (2015)
This article is copyrighted as indicated in the article. Reuse of AIP content is subject to the terms at: http://scitation.aip.org/termsconditions. Downloaded to IP:
158.64.77.122 On: Tue, 01 Dec 2015 08:52:59

214M. L�evy, N. Luciani, D. Alloyeau, D. Elgrabli, V. Deveaux, C. Pechoux,
S. Chat, G. Wang, N. Vats, F. Gendron, C. Factor, S. Lotersztajn, A.
Luciani, C. Wilhelm, and F. Gazeau, Biomaterials 32, 3988 (2011).215R. Mej�ıas, L. Guti�errez, G. Salas, S. P�erez-Yag€ue, T. M. Zotes, F. J.
L�azaro, M. P. Morales, and D. F. Barber, J. Controlled Release 171, 225
(2013).216L. Lartigue, D. Alloyeau, J. Kolosbaj-Tabi, Y. Javed, P. Guardia, A. Riedinger,
T. Pellegrino, C. Wilhelm, and F. Gazeau, ACS Nano 7(5), 3939 (2013).217Y. Javed, L. Lartigue, P. Hugounenq, Q. L. Vuong, Y. Gossuin, R. Bazzi,
C. Wilhelm, C. Ricolleau, F. Gazeau, and D. Alloyeau, Small 10, 3325
(2014).218M. P. Morales, S. Veintemillas-Verdaguer, M. I. Montero, C. J. Serna, A.
Roig, L. Casas, B. Mart�ınez, and F. Sandiumenge, Chem. Mater. 11, 3058
(1999).
219R. Hergt, S. Dutz, and M. R€oder, J. Phys.: Condens. Matter. 20, 385214
(2008).220L. Guti�errez, M. P. Morales, and F. J. L�azaro, Phys. Chem. Chem. Phys.
16, 4456 (2014).221A. Hannecart, D. Stanicki, L. Vander Elst, R. N. Muller, S.
Lecommandoux, J. Th�evenot, C. Bonduelle, A. Trotier, P. Massot, S.
Miraux, O. Sandre, and S. Laurent, Nanoscale 7, 3754 (2015).222E. Garaio, J.-M. Collantes, J. A. Garcia, F. Plazaola, and O. Sandre, Appl.
Phys. Lett. 107, 123103 (2015).223R. Pi~nol, C. D. S. Brites, R. Bustamante, A. Mart�ınez, N. J. O. Silva, J. L.
Murillo, R. Cases, J. Carrey, C. Estepa, C. Sosa, F. Palacio, L. D. Carlos,
and A. Millan, ACS Nano 9, 3134 (2015).224J. B. Weaver, A. M. Rauwerdink, and E. W. Hansen, Med. Phys. 36(5),
1822–1829 (2009).
041302-35 P�erigo et al. Appl. Phys. Rev. 2, 041302 (2015)
This article is copyrighted as indicated in the article. Reuse of AIP content is subject to the terms at: http://scitation.aip.org/termsconditions. Downloaded to IP:
158.64.77.122 On: Tue, 01 Dec 2015 08:52:59