funding public safety · pdf file funding public safety realignment 7 ... we begin with an...
TRANSCRIPT


http://www.ppic.org Funding Public Safety Realignment 2
Summary
California’s recent public safety realignment transferred substantial authority and funds from the state to the counties to manage lower-level felon populations. The success or failure of this experiment will have profound implications throughout the state, beyond just the realm of public safety. If counties are able to handle these new populations and improve upon the state’s record of reducing recidivism, the results could include declining crime rates, lower-cost supervision of offenders, and the liberation of state resources to devote to other concerns. If the counties’ efforts are insufficient or misdirected, crime rates could stagnate or grow worse, prompting more costly measures such as jail capacity expansion or more intensive supervision, while also shifting the prison overcrowding problem from the state to the county level with all of the attendant implications for county budget priorities.
Each county’s experience with realignment will depend, in part, on whether it has sufficient resources to carry out its plan. That is the subject of this report: the state’s provision of realignment funds to the counties, the changing allocations of those funds among the counties, and our own proposal for a funding allocation model to use in the future. Our aim is to illuminate the development of the initial and current funding models, to carefully consider their key elements and their shortcomings, and to propose a new model that addresses these shortcomings.
We begin with an examination of the state’s mechanism for funding public safety realignment, including the overall funding level, state revenue sources, and the categories of state funding streams. We then turn to our main topic—the allocation of realignment funds across counties.
We explain the initial model developed by the Realignment Allocation Committee to determine the share of total funding for realignment that each county would receive. The Year 1 model allocated funding based primarily on the projected increase in counties’ offender populations that realignment would induce. The committee balanced the model somewhat by also considering each county’s estimated overall adult population and the county’s success in reducing returns to prison for probation revocations under SB 678. However, concerns emerged among some county officials that this model rewarded counties with high pre-realignment prison use.
In the Year 2–3 model, the committee attempted to address that concern by introducing greater flexibility into the formula—as a result, counties with low levels of state prison use prior to realignment received relatively large increases in their allocations. Nonetheless, questions about the fairness and efficacy of the allocation persist as the committee continues to work on the development of a permanent allocation model.
We argue that the ideal components of such a model must include differences across counties in the burden of realignment, differences in the capacities of counties to manage their realignment populations, and the inclusion of recidivism reduction bonuses to incentivize state goals.
Finally, as a practical consideration, we recognize that developing and using such a funding model requires access to appropriate, high-quality data. To this end, we identify publicly available data to measure these components and use them to calculate recommended allocation shares, which we compare with the allocations from previous years’ models.
Our proposed Year 4 model consists of a base allocation, adjustments for county characteristics, and incentive bonuses for reductions in recidivism. We believe that our model will prove useful to policymakers—not only as they develop their Year 4 strategies for distributing realignment allocations to the counties, but also as a sound foundation for building a permanent allocation model.

Contents
Summary 2
Figures 4
Tables 4
Glossary 5
Introduction 6
Overview of Realignment Funding 8
How was Funding Allocated to Counties in Year 1? 10
How Did the County Allocation Model Change in Year 2? 14 Year 3 Allocation Shares 16
Criteria for the Development of a Permanent Funding Allocation Model 17
Key Components of a Permanent Funding Allocation Model 18 Capturing Differences in the Realignment Burden 18 Capturing Differences in County Capacities 19 Incentivizing State Goals 19
Proposed Year 4 Model 21 Realignment Burden: The Base Allocation 21 Capacity Adjustments: Differences in County Characteristics 22 Incentive Bonuses: Recidivism Reduction 23 County Allocations Under Our Proposed Year 4 Model 23
Conclusion 26
References 28
About the Authors 29
Acknowledgments 29
A technical appendix to this paper is available on the PPIC website: www.ppic.org/content/pubs/other/1113MBR_appendix.pdf
http://www.ppic.org Funding Public Safety Realignment 4
Figures
1. Prison incarceration rates by county 13
2. Average change in funding share by model type 16
3. Scatterplot of poverty rates and pre-realignment state prison incarceration rates, 2011 22
Tables
1. Statewide initial realignment funding levels, Years 1–3 (in millions) 9
2. Year 1 realignment allocations by funding category 11
3. Changes in share of programmatic funding allocations from Year 1 to Year 2 14
4. Proposed Year 4 model: County allocation shares compared with past allocation shares 24

http://www.ppic.org Funding Public Safety Realignment 5
Glossary
1170(h) The penal code designation for felony offenders convicted of non-violent, non-serious, non-sexual crimes. Under realignment, these offenders will serve their sentences in county jails rather than state prison. The term “1170(h)s” is often used colloquially to refer to these offenders.
AB 109 The California state law passed in 2011 mandating the implementation of public safety realignment beginning on October 1, 2011
ADP Average Daily Population
BSCC Board of State and Community Corrections
CAOAC County Administrative Officers Association of California
CBP California Budget Project
CCP Community Corrections Partnership
CDCR California Department of Corrections and Rehabilitation
CPOC Chief Probation Officers of California
CSAC California State Association of Counties
DOF (California) Department of Finance
DOJ (California) Department of Justice
LAO Legislative Analyst’s Office
PRCS Post-Release Community Supervision, the county-based supervision of offenders released from state prison that, under realignment, replaces the state-based parole program for a majority of released prisoners
SB 678 The law passed in 2009 encouraging counties to reduce the number of offenders returned to state prison for violation of probation rules

http://www.ppic.org Funding Public Safety Realignment 6
Introduction
On October 1, 2011, California began to implement the most significant change in its corrections policy in a generation. Months earlier, the U.S. Supreme Court had upheld a federal court order that California reduce its prison population to 137.5 percent of design capacity within two years. The state’s most significant response to this directive was Assembly Bill 109, or as it has become known colloquially, “public safety realignment.”
The state’s realignment efforts began with reducing the prison population by transferring authority and supervision over lower-level felons from the state to the counties. Specifically, realignment made the following three changes to the way lower-level felons are managed in the criminal justice system:
1. Individuals newly convicted of felonies deemed “non-serious, non-violent, and non-sexual” (and who have no prior convictions for a serious, violent, or sexual offense) are now sent to county jail rather than state prison.
2. Parole violators are now returned to county jurisdiction rather than state prison for detention following a revocation.
3. Individuals sent to prison for non-violent, non-serious, and non-sexual offenses are now released to county probation departments (rather than to the state parole system) for supervision under a program known as post-release community supervision (PRCS).1
Each of these elements has clear implications for the state’s 58 counties. First, counties are now responsible for housing new populations of felony offenders, potentially for much longer terms than the counties are accustomed to. The responsibility for these offenders (known colloquially as 1170(h)s after the penal code section that governs their sentencing) will pose a particular challenge for counties experiencing capacity constraints (Lofstrom and Raphael, 2013). Second, under PRCS, counties are responsible for monitoring newly released prisoners and guiding them through the battery of available county-level rehabilitation programs. And finally, county resources will be further stretched by the need to house released offenders whose state parole term is revoked or who violate the terms of their PRCS (Lofstrom and Raphael, 2013).
The rationale espoused by proponents of realignment is that counties are better positioned than the state to manage these populations. The realignment program also encourages the use of alternatives to incarceration, including “evidence-based practices” designed to improve rehabilitative efforts and reduce recidivism. Proponents argue that by keeping offenders in their own communities and leveraging county-level programs (e.g., drug treatment, job training, and other social services), the counties will be able to better address the needs of current and former prisoners and will also be able to achieve better community reentry outcomes (and at a lower cost) than the state.
The state provides funding to compensate counties for these new responsibilities: The legislature provided nearly $400 million to be distributed among the counties during the first nine months of realignment and more than doubled that figure for the following full year. Proposition 30, approved by the voters in the November 2012 election, guarantees the counties a continuing source of realignment funding.
However, realignment costs will vary across counties, given differences in the size and composition of the realigned population and differences in the demographic, economic, and geographic characteristics of the
1 Individuals assessed as High Risk Sex Offenders, Mentally Disordered Offenders, or who are convicted of a “third strike”—even if their third offense is non-serious or non-violent—are still released to state parole instead of PRCS.

http://www.ppic.org Funding Public Safety Realignment 7
counties. The degree to which counties utilize traditional incarceration, alternative sanctioning, or rehabilitative programming tools to manage this population may also affect costs.
Now well into the third funding year of realignment, debate persists about the inter-county allocation of available funding, and that is the subject of this report. What was the rationale behind the allocation of realignment funding in the first year? How has that rationale changed as the allocation formula was amended for the second and third years? And finally, how might we arrive at a long-term funding allocation model that is efficacious, reliable, transparent, politically feasible, and responsive to changes in county circumstances over time? The centerpiece of this paper is a proposed allocation funding model that satisfies these criteria. This new model considers both realignment and general populations, makes adjustments for county characteristics, and includes incentives for reductions in recidivism. Our model uses publicly available data and could be used to generate allocations for the fourth funding year and beyond.
We begin with an overview of the sources of state funding and the categories of realignment funding streams, including a discussion of the initial funding level, subsequent increases, and the measures designed to guarantee counties’ access to funding. We then look more closely at the first year’s formula for allocating funding among the counties: its rationale and composition, the resulting allocations, and the counties’ responses to their allotment. This leads us into a discussion of the changes implemented in the second and third years’ formula and an examination of the results of the most recent formula. Finally, we propose a fourth-year model that addresses some of the perceived shortcomings of the early formulas, discuss the results of the new model, and consider the challenges confronting its implementation as a permanent allocation formula.

http://www.ppic.org Funding Public Safety Realignment 8
Overview of Realignment Funding
At the outset of realignment, the California State Legislature directed a portion of the state sales tax to the counties to help them implement public safety realignment (Misczynski, 2011). This arrangement provided nearly $400 million to the counties during the first nine months of realignment (referred to in this report as the Year 1 allocation). However, county officials worried that while realignment was here to stay, a future governor or legislature might amend or rescind the associated revenue stream, leaving the responsibility for realignment in place while cutting off the funding necessary to support it. Proposition 30, passed by the voters in November 2012, addressed this concern. It created a constitutional amendment that ensured the state-to-county funding for corrections realignment would continue; and to support this objective, it temporarily increased the state sales tax and the income tax on high-income Californians (California Budget Project, 2012a). In addition to these dedicated funding sources, Prop 30 provided protections for the counties against future changes in realignment funding (California Budget Project, 2012b).
Because realignment began three months into fiscal year 2011–12, the Year 1 allocation only covered nine
months. The allocations for Year 2 (July 2012–June 2013) and Year 3 (July 2013–June 2014) cover 12-month periods. The state’s realignment funding model anticipates natural caseload growth as counties incrementally assume the corrections responsibilities transferred under realignment. Undistributed growth is projected for the program for at least the next three fiscal years. The state is currently in the process of finalizing the growth fund allocation for Years 2 and 3.
Although the state has dedicated substantial amounts of funding to its counties (nearly $2.3 billion over the first three years of realignment), a comparison of this funding level to annual spending prior to realignment reveals net savings in each year of realignment (California Budget Project, 2013). The CBP estimates that state spending on adult corrections in FY 2013–14 will be approximately $500 million less than in FY 2010–11, the year prior to realignment.2 The California Department of Corrections and Rehabilitation (CDCR) uses projections of state spending in the absence of realignment, rather than pre-realignment spending levels, to calculate its budget comparisons. Using this method, CDCR finds general fund savings of more than $1 billion in Year 2 of realignment and $1.3 billion in Year 3. When compared with realignment expenditures during those years (see Table 1), these projections suggest ongoing annual net savings in the hundreds of millions of dollars under realignment (California Department of Corrections and Rehabilitation, 2012).
Table 1 summarizes funding levels by category for the first three years of realignment. The Realignment Allocation Committee (the decisionmaking body responsible for determining the initial allocation of realignment funding among counties) divides funding across four categories:
1. Programmatic costs associated with managing the realigned adult offender populations
2. Revocation costs due to hearings for offenders violating the terms of their prison release (these funds are split between the public defender and district attorney offices in each county)
3. Start-up costs involved in building the necessary capacity for implementing realignment in each county (these were conceived of as one-time costs associated with activities such as hiring, training, staff retention, improving data capacity, contracting, and capacity planning)
4. Community Corrections Partnership (CCP) grants to develop plans for implementing realignment
2 See “A Mixed Picture: State Corrections Spending After the 2011 Realignment,” California Budget Project, 2013.

http://www.ppic.org Funding Public Safety Realignment 9
TABLE 1 Statewide initial realignment funding levels, Years 1–3 (in millions)
Programmatic
funding ($) Revocation funding ($)
Start-up funding ($)
CCP grants ($)
Total ($)
Year 1 (Oct. 2011–June 2012) 354.3 12.7 25.0 7.9 399.9
Year 2 (July 2012–June 2013) 842.9 14.6 – 7.9 865.4
Year 3 (July 2013–June 2014) 998.9 17.1 – 7.9 1,023.9
SOURCE: Funding amounts provided by CSAC.
The committee allocated CCP planning grants according to a simple formula based on county population size. Large counties (more than 750,000 residents) received $200,000; medium-sized counties received $150,000; and small counties (up to 200,000 residents) received $100,000 (McIntosh, 2011). Small counties typically received a large share of their total funding through the CCP funding stream to support planning efforts. In larger counties, the CCP funding stream represented a relatively small share of funding when compared to the allocations received through the other three funding streams—programmatic, revocation,3 and start-up funds. In the first year, the committee allocated these three funding streams based on the Year 1 funding allocation model, as we explain in more detail in the following section.
3 In the first year, the committee allocated revocation funds using the same formula as used for the programmatic funds. For the second and third years, it employed a different formula for the revocation funds than for the programmatic funds.

http://www.ppic.org Funding Public Safety Realignment 10
How Was Funding Allocated to Counties in Year 1?
At the request of the governor, the task of determining the initial allocation of programmatic funding among the counties fell to the California State Association of Counties (CSAC). CSAC requested that the County Administrative Officers Association of California (CAOAC) convene a Realignment Allocation Committee, which consisted of three urban, three suburban, and three rural county administrative officers (Jett and Hancock, 2013). A CSAC memo details the following principles established by the Realignment Allocation Committee to guide the development of the first year model:
The Year 1 allocation for 2011–12 would apply only for the first year of the AB 109 population shift, given the significance of realignment policy changes and the sense of “unknown.”
The Year 2 and subsequent year allocation formula(s) would be open for discussion and would be informed by additional data and actual programmatic experience.
The allocation formula should be simple in its approach. (McIntosh, 2012: p.2)
At the outset, the committee recognized the first-year model would be temporary. Over time, as realignment rolled out, the committee would have access to more information about realignment populations and their outcomes across counties. Under the constraints of limited experience and data, the committee arrived at the model they used to produce the allocation share of each county (Table 2). The model was composed of the following three key components, weighted to reflect the relative importance of each component:
1. A county’s projected full roll-out realignment population (weighted at 60%)4
2. A county’s adult population, ages 18–64 (weighted at 30%)
3. A county’s performance under the implementation of SB 678 (weighted at 10%)5
In addition, the committee established a minimum funding level of $76,833 for the three least populous counties—Alpine, Sierra, and Modoc. The committee also enhanced the funding level for the largest county, Los Angeles. As explained in the previous section, the committee used a different model for the CCP planning allocations.
4 The full roll-out realignment population, as projected by the Department of Finance, was an estimate of the population counties would need to manage at full implementation of realignment. Implementation was assumed to be complete at the end of Year 4. 5 The California Community Corrections Performance Incentives Act of 2009, or SB 678, established a system that rewarded county probation offices with funding tied to measured decreases in recidivism—specifically, the number of commitments to prison for probation violations.

http://www.ppic.org Funding Public Safety Realignment 11
TABLE 2 Year 1 realignment allocations by funding category
County Programmatic ($)
Revocation (PD/DA)*
($) Start-up funding
($) CCP planning
($) Total
($)
Alameda 9,221,012 330,530 650,650 200,000 10,402,192 Alpine 76,883 2,756 5,425 100,000 185,064 Amador 543,496 19,482 38,350 100,000 701,328 Butte 2,735,905 98,069 193,050 150,000 3,177,024 Calaveras 350,757 12,573 24,750 100,000 488,080 Colusa 214,352 7,684 15,125 100,000 337,160 Contra Costa 4,572,950 163,919 322,675 200,000 5,259,544 Del Norte 221,438 7,938 15,625 100,000 345,000 El Dorado 1,210,643 43,396 85,425 100,000 1,439,464 Fresno 8,838,368 316,814 623,650 200,000 9,978,832 Glenn 331,271 11,875 23,375 100,000 466,520 Humboldt 1,526,679 54,724 107,725 100,000 1,789,128 Imperial 1,296,384 46,469 91,475 100,000 1,534,328 Inyo 190,968 6,845 13,475 100,000 311,288 Kern 10,834,140 388,353 764,475 200,000 12,186,968 Kings 2,862,035 102,591 201,950 100,000 3,266,576 Lake 820,913 29,426 57,925 100,000 1,008,264 Lassen 384,770 13,792 27,150 100,000 525,712 Los Angeles 112,558,276 4,034,688 7,942,300 200,000 124,735,264 Madera 1,688,240 60,516 119,125 100,000 1,967,880 Marin 1,304,178 46,749 92,025 150,000 1,592,952 Mariposa 165,458 5,931 11,675 100,000 283,064 Mendocino 993,812 35,624 70,125 100,000 1,199,560 Merced 2,498,524 89,560 176,300 150,000 2,914,384 Modoc 76,883 2,756 5,425 100,000 185,064 Mono 100,267 3,594 7,075 100,000 210,936 Monterey 3,846,989 137,897 271,450 150,000 4,406,336 Napa 1,051,917 37,706 74,225 100,000 1,263,848 Nevada 515,152 18,466 36,350 100,000 669,968 Orange 23,078,393 827,253 1,628,450 200,000 25,734,096 Placer 2,986,395 107,048 210,725 150,000 3,454,168 Plumas 153,766 5,512 10,850 100,000 270,128 Riverside 21,074,473 755,421 1,487,050 200,000 23,516,944 Sacramento 13,140,278 471,018 927,200 200,000 14,738,496 San Benito 547,748 19,634 38,650 100,000 706,032 San Bernardino 25,785,600 924,293 1,819,475 200,000 28,729,368 San Diego 25,105,698 899,922 1,771,500 200,000 27,977,120 San Francisco 5,049,838 181,013 356,325 200,000 5,787,176 San Joaquin 6,785,908 243,243 478,825 150,000 7,657,976 San Luis Obispo 2,200,557 78,880 155,275 150,000 2,584,712 San Mateo 4,222,902 151,371 297,975 150,000 4,822,248 Santa Barbara 3,878,876 139,040 273,700 150,000 4,441,616 Santa Clara 12,566,312 450,444 886,700 200,000 14,103,456 Santa Cruz 1,662,730 59,601 117,325 150,000 1,989,656 Shasta 2,988,875 107,137 210,900 100,000 3,406,912 Sierra 76,883 2,756 5,425 100,000 185,064

http://www.ppic.org Funding Public Safety Realignment 12
County Programmatic ($)
Revocation (PD/DA)*
($) Start-up funding
($) CCP planning
($) Total
($)
Siskiyou 445,001 15,951 31,400 100,000 592,352 Solano 3,807,662 136,487 268,675 150,000 4,362,824 Sonoma 3,240,428 116,154 228,650 150,000 3,735,232 Stanislaus 6,010,700 215,456 424,125 150,000 6,800,280 Sutter 1,167,419 41,847 82,375 100,000 1,391,640 Tehama 1,212,415 43,459 85,550 100,000 1,441,424
Trinity 144,554 5,182 10,200 100,000 259,936
Tulare 5,657,817 202,806 399,225 150,000 6,409,848 Tulare 5,657,817 202,806 399,225 150,000 6,409,848 Tuolumne 598,767 21,463 42,250 100,000 762,480 Ventura 5,696,790 204,203 401,975 200,000 6,502,968 Yolo 2,974,703 106,629 209,900 150,000 3,441,232 Yuba 1,005,858 36,055 70,975 100,000 1,212,888 Total 354,300,000 12,700,000 25,000,000 7,850,000 399,850,000
*Revocation funds are split between the public defender and district attorney offices in each county.
SOURCE: Funding allocations provided by CSAC.
The Year 1 funding allocation model has a number of advantages, including its transparency and simplicity. The rationale behind the Year 1 approach is straightforward: The model primarily allocates funding among counties based on projected differences in expected growth of the populations they manage, with a substantial adjustment for county population size and a slight adjustment for efforts on the part of counties to reduce prison incarceration prior to realignment. In the first year (i.e., nine months) of realignment, the committee emphasized the new burden counties would experience in allocating funding.
County responses to the Year 1 funding were mixed. In general, counties expressed concerns about whether the total funding available for the first year of realignment would be adequate to effectively manage realignment. Counties were also concerned about the stability of funding over time.
In Year 2, the total funding level would be increased to reflect the longer funding period (12 months) and to recognize the expected caseload growth stemming from the implementation of realignment sentencing changes. To some extent, this increase in total funding eased concerns about funding adequacy. Further, Proposition 30, approved by voters in November 2012, would solidify the funding source for public safety realignment, largely putting this concern to rest.
In addition to these shared concerns, a select group of counties questioned the fairness of the initial allocation. Those counties with low pre-realignment state prison incarceration rates made the case that the Year 1 model unfairly disadvantaged them by tying funding to the relative size of pre-realignment prison populations. Figure 1 shows the variation across counties in prison incarceration rates prior to realignment. We see a wide range, with some counties sending relatively few offenders to state prison. These counties, the argument goes, had taken the initiative and borne the cost of reducing their contributions to the state prison population prior to realignment and, as a result, received less funding due to the heavy weight on realignment population projections in the Year 1 model.
Table 2 (continued)

http://www.ppic.org Funding Public Safety Realignment 13
FIGURE 1 Prison incarceration rates by county
SOURCE: Center on Juvenile and Criminal Justice (2010).
The argument made by counties with low prison incarceration rates rested on the method used by the Department of Finance (DOF) to project realignment populations. A few words about the construction of this component of the Year 1 model are in order. First, the realignment population projections are expressed in terms of an Average Daily Population (ADP). Instead of estimating counts of lower-level felony offenders entering (and exiting) the county system, the ADP captures the equivalent of one inmate in one jail space for one year (McIntosh, 2011). Second, the DOF, relying on available data, made these projections based on the population of offenders housed in state prison in 2010. As a result, those counties that had sent a high share of their felony convictions to state prison were projected to have large realignment populations, while those counties that had retained a high share of their felony convictions at the local level were projected to have relatively small realignment populations.
Calculated as such, the DOF projections capture the shift in the burden from the state to counties at the time of realignment, rather than the total burden counties bear in managing the lower-level felon population. As a result, allocations made based on the projected realignment population would be widely divergent from allocations based on the county adult population, a challenge recognized by the committee at the outset (McIntosh, 2012). In crafting the Year 2 allocation model, the committee attempted to address this concern by introducing greater flexibility into the model components.

http://www.ppic.org Funding Public Safety Realignment 14
How Did the County Allocation Model Change in Year 2?
Given the speed with which realignment legislation was passed and implemented, the Realignment Allocation Committee had limited time to determine the initial allocation model, but committed to revisit the issue in the second funding year (McIntosh, 2012). Partly in response to concerns about the fairness of the initial allocation, the committee introduced flexibility into the Year 2 allocation model for the largest funding component, the programmatic funding. The Year 2 model ensured that each county would receive a minimum programmatic-funding level equal to twice its Year 1 allocation. An increase this large was possible because the total statewide allocation had more than doubled due to the longer coverage period in Year 2 (12 months compared to 9 months in Year 1) as well as stronger revenue and stabilized revenue sources. The Year 2 model allowed each county to receive the best programmatic allocation from the following four possible models:
1. A model that doubled the Year 1 allocation
2. A model that applied the Year 1 formula to updated population and SB 678 data
3. A model based entirely on the size of the projected realignment population6 or
4. A model based entirely on the size of the county adult population
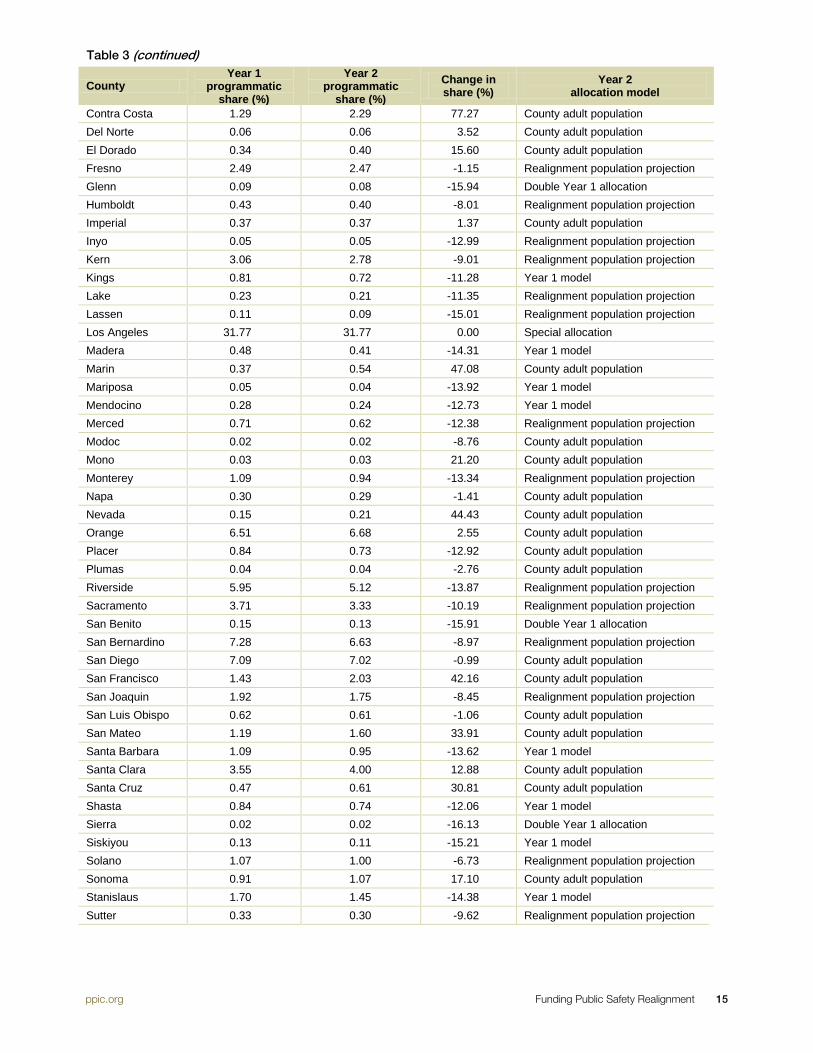
Table 3 summarizes the resulting changes in the programmatic funding shares from Year 1 to Year 2 by county.7 While the dollar value of the allocation increased for all counties in Year 2 due to the increase in total funding for realignment, counties experienced substantial shifts in the share of the total funding they received. Some counties received a greater share than they had in Year 1 (as much as a 77% greater share) and other counties received a smaller share (as much as 16% smaller). Table 3 shows the percent change in the share received resulting from the change in the allocation formula in Year 2 and indicates the model used to arrive at the Year 2 allocation for each county.
Counties that received their best allocation under model 4 (the model based entirely on adult population size) experienced, on average, a relative increase in the share of total programmatic funding they received. In contrast, counties that received their best allocation under one of the other models experienced relative declines in their programmatic shares.
TABLE 3 Changes in share of programmatic funding allocations from Year 1 to Year 2
County Year 1
programmatic share (%)
Year 2 programmatic
share (%)
Change in share (%)
Year 2 allocation model
Alameda 2.60 3.47 33.20 County adult population Alpine 0.02 0.02 -16.13 Double Year 1 allocation Amador 0.15 0.13 -12.58 Year 1 model Butte 0.77 0.66 -13.93 Year 1 model Calaveras 0.10 0.09 -4.75 County adult population Colusa 0.06 0.05 -15.21 Year 1 model
6 The committee drew on DOF realignment population projections but made slight adjustments to these projections for counties with extremely high state prison incarceration rates prior to realignment. 7 Elizabeth Howard Espinosa (CSAC) provided allocation and model information to the authors.
http://www.ppic.org Funding Public Safety Realignment 15
County Year 1
programmatic share (%)
Year 2 programmatic
share (%)
Change in share (%)
Year 2 allocation model
Contra Costa 1.29 2.29 77.27 County adult population Del Norte 0.06 0.06 3.52 County adult population El Dorado 0.34 0.40 15.60 County adult population Fresno 2.49 2.47 -1.15 Realignment population projection Glenn 0.09 0.08 -15.94 Double Year 1 allocation Humboldt 0.43 0.40 -8.01 Realignment population projection Imperial 0.37 0.37 1.37 County adult population Inyo 0.05 0.05 -12.99 Realignment population projection Kern 3.06 2.78 -9.01 Realignment population projection Kings 0.81 0.72 -11.28 Year 1 model Lake 0.23 0.21 -11.35 Realignment population projection Lassen 0.11 0.09 -15.01 Realignment population projection Los Angeles 31.77 31.77 0.00 Special allocation Madera 0.48 0.41 -14.31 Year 1 model Marin 0.37 0.54 47.08 County adult population Mariposa 0.05 0.04 -13.92 Year 1 model Mendocino 0.28 0.24 -12.73 Year 1 model Merced 0.71 0.62 -12.38 Realignment population projection Modoc 0.02 0.02 -8.76 County adult population Mono 0.03 0.03 21.20 County adult population Monterey 1.09 0.94 -13.34 Realignment population projection Napa 0.30 0.29 -1.41 County adult population Nevada 0.15 0.21 44.43 County adult population Orange 6.51 6.68 2.55 County adult population Placer 0.84 0.73 -12.92 County adult population Plumas 0.04 0.04 -2.76 County adult population Riverside 5.95 5.12 -13.87 Realignment population projection Sacramento 3.71 3.33 -10.19 Realignment population projection San Benito 0.15 0.13 -15.91 Double Year 1 allocation San Bernardino 7.28 6.63 -8.97 Realignment population projection San Diego 7.09 7.02 -0.99 County adult population San Francisco 1.43 2.03 42.16 County adult population San Joaquin 1.92 1.75 -8.45 Realignment population projection San Luis Obispo 0.62 0.61 -1.06 County adult population San Mateo 1.19 1.60 33.91 County adult population Santa Barbara 1.09 0.95 -13.62 Year 1 model Santa Clara 3.55 4.00 12.88 County adult population Santa Cruz 0.47 0.61 30.81 County adult population Shasta 0.84 0.74 -12.06 Year 1 model Sierra 0.02 0.02 -16.13 Double Year 1 allocation Siskiyou 0.13 0.11 -15.21 Year 1 model Solano 1.07 1.00 -6.73 Realignment population projection Sonoma 0.91 1.07 17.10 County adult population Stanislaus 1.70 1.45 -14.38 Year 1 model Sutter 0.33 0.30 -9.62 Realignment population projection
Table 3 (continued)

http://www.ppic.org Funding Public Safety Realignment 16
County Year 1
programmatic share (%)
Year 2 programmatic
share (%)
Change in share (%)
Year 2 allocation model
Tehama 0.34 0.30 -11.40 Year 1 model Trinity 0.04 0.04 -13.48 Year 1 model Tulare 1.60 1.39 -12.96 Year 1 model Tuolumne 0.17 0.14 -15.86 Year 1 model Ventura 1.61 1.79 11.20 County adult population Yolo 0.84 0.72 -14.70 Double Year 1 allocation Yuba 0.28 0.25 -12.40 Realignment population projection
SOURCE: Information provided by CSAC.
Figure 2 summarizes the average change in county allocation shares by model type for the Year 2 allocation. Note that Los Angeles County continued to receive a special allocation and thus experienced no change in its share of programmatic funding between Year 1 and Year 2.
FIGURE 2 Average change in funding share by model type
SOURCE: Information provided by CSAC (see Table 3).
Year 3 Allocation Shares
The Realignment Allocation Committee recommended that the Year 2 (FY 2012–13) allocation shares remain in place for Year 3 (FY 2013–14) to provide counties with stability and certainty for planning purposes. As a result, counties are receiving the same relative share of programmatic funding in the current year as they received in FY 2012–13. However, the committee is in the process of developing a new, and potentially permanent, programmatic funding model and will recommend a model for Year 4 funding allocations to the governor for consideration during the FY 2014–15 budget process.
As the committee develops these recommendations, we, along with other outside groups, hope to provide analysis to inform the process. The remaining sections of this report offer criteria for the development of a permanent model, outline key model components that flow from those criteria, and propose a Year 4 funding allocation model based on those components.
16.4%
-10.2% -13.5%
-15.8%
0.0%
-20%
-15%
-10%
-5%
0%
5%
10%
15%
20%
County adultpopulation
Realignmentpopulationprojection
Year 1model
Double Year 1allocation
Special allocation(Los Angeles)
Perc
ent c
hang
e
Table 3 (continued)

http://www.ppic.org Funding Public Safety Realignment 17
Permanent Funding Allocation Model
We use the term “criteria” here to refer to the principles that we believe should guide the development of the funding allocation model. Before presenting our model, we review the criteria we used to guide our analysis.
1. Efficacy. The overriding goal of a funding allocation model is efficacy: The resulting allocation of funds should incentivize and empower counties to successfully implement their plans for realignment. The additional criteria listed below are largely in the service of this goal. As defined here, an efficacious allocation of funds would enable counties to take on the burden of realignment, while accounting for differences in the counties’ capacities to manage the realigned population and incorporate further incentives for reducing recidivism.
2. Reliability. The permanent funding allocation model should produce allocations that are reliable over time. Swings in year-to-year allocations impede the ability of counties to plan and commit resources to policy goals. There are two primary reasons for funding instability: changes in the underlying model and poor quality data, which can lead to measurement error that produces year-to-year swings in key model components. To achieve reliability, the underlying model must be consistent over time, and the model must be able to rely upon high-quality data.
3. Responsiveness. The permanent funding allocation model should be responsive to genuine changes in the burden of realignment over time and in county capacities to manage that burden. Thus, the data underlying our model need to be selected to reflect both current circumstances and changes over time. Currently, the projected realignment population—the estimate of the burden of realignment—is based on 2010 prison incarceration levels and is therefore unresponsive to changes in the burden over time.
4. Transparency. The permanent funding allocation model should be publicly accessible and easily understood. The complexity of past models, along with challenges to accessing model documentation, has limited transparency.
5. Political Feasibility. The permanent funding allocation model must be politically feasible. Currently, the Realignment Allocation Committee consists of county representatives. This group must arrive at an allocation model that is perceived as fair and acceptable to committee members. However, the committee must also strive to maintain the trust of other stakeholders—the governor, legislators, and the public—in order to continue in this role.
In the next section, we highlight the key components of a permanent funding model that meet the criteria outlined here.

http://www.ppic.org Funding Public Safety Realignment 18
Key Components of a Permanent Funding Allocation Model
If a permanent funding model is to satisfy the criteria outlined in the previous section, it must include certain key components. We highlight those components here and describe how the Realignment Allocation Committee might incorporate them into an allocation model.
Capturing Differences in the Realignment Burden A permanent funding model needs to resolve past controversies over how the model captures the realignment burden. Changes in how the burden is measured have driven the swings we have seen in funding allocations. Initially, the committee emphasized DOF projections of the full roll-out realignment population. These projections varied by county, based on the extent to which counties sent lower-level felons to prison prior to realignment. In the early years of realignment, there was a clear rationale for measuring the burden of realignment in this way—counties that sent high shares of their lower-level felon population to state prison would experience large increases in their locally managed populations relative to counties that had retained large shares of lower-level felons prior to realignment. This realignment-induced change in the locally managed population in the early years may have been particularly difficult to cope with and may have required additional resources. However, in a permanent funding model, the overall size and composition of the counties’ lower-level felon populations becomes more important than the changes they experienced in the early stages of realignment. An accurate assessment of differences in the realignment burden across counties is essential to producing an effective and responsive allocation.
While the committee emphasized realignment projections by weighting them at 60 percent in the Year 1 model, they also gave some weight (half as much) to an alternative measure—the size of the county adult population. The committee used these measures together to approximate the size of the realignment population and the burden the counties were undertaking in managing this group. In the face of controversy, the Year 2 allocations based the entire allocation for some counties on realignment projections and the entire allocation for other counties on adult population, resulting in large swings in the share of total funding received by counties. Furthermore, while the adult population varies over time, the original 2010 realignment projections are fixed in time and unresponsive to changes in the size of lower-level felon populations. Appropriately capturing differences in the realignment burden across counties should be an essential component of a permanent funding model.
The key challenges in capturing the realignment population are the availability and quality of data. In the ideal case, a permanent funding allocation model would include prior year counts of 1170(h), PRCS, and parole violator populations.8 In addition, information on the risk compositions of these populations would be helpful in understanding how the burden of realignment varies across counties. The CDCR currently tracks prison releases, capturing both the PRCS and parole populations returning to counties; and the DOJ receives data from counties capturing convictions, which may allow for the identification of the 1170(h) population. Taken together, these data would allow for an improvement on current projections of the size
8 The distinction between offender counts and jail ADP is important here. A model that captured jail ADP, rather than offender counts, would privilege (and thus incentivize) the incarceration response relative to the use of alternative sanctions and rehabilitative interventions.

http://www.ppic.org Funding Public Safety Realignment 19
of the realignment population by county, dispelling some of the controversy surrounding the weighting of realignment projections and county population size in the allocation model.
While it is theoretically possible to identify the realignment population through state data sources, the state may need to rely on county data collection efforts. Counties individually track these populations through various data collection systems. If counties could be motivated and supported in integrating these systems so as to provide standardized collections of essential data, the state could draw on county data to determine the burden of realignment. Some efforts in this direction are currently under way. For example, the BSCC is working to collect population counts through the AB 109 supplement to the Jail Profile Survey. CPOC is engaging in complementary efforts to collect realignment population data by county. With increased resources to ensure the quality and improve the timeliness and consistency of reporting, these efforts could provide estimates of the size of the realigned population over time that are free of ties to the state prison incarceration histories of counties.
Capturing Differences in County Capacities
In addition to differences in the realignment burden across counties, differences in the demographic, economic, and geographic characteristics of counties should also be considered in determining the equitable allocation of funding. These characteristics reflect differences across counties in their capacity to manage realignment and the relative costs associated with this responsibility. Consideration of these differences may also improve perceptions of fairness on the part of the counties, which may lead to easier acceptance of the resulting allocations.
Data describing county demographic, economic, and geographic characteristics are typically high quality, reliable, and publicly available through state and national data sources. The key challenge to capturing differences in county capacities will be to select a limited number of relevant characteristics. Measures within categories are often correlated, allowing for simplification without much loss of information.
Incentivizing State Goals The state has a particular interest in recidivism outcomes, both in terms of how many realigned offenders end up back in state prison and in terms of how realignment affects public safety. Given these interests, the permanent funding model should incentivize reductions in recidivism. We recommend that such reductions be rewarded in two ways. First, the funding model could reward those counties that achieve relatively low levels of returns to prison. Additional rewards for reductions in the rates at which counties return offenders to state prison would allow even high-recidivism counties to respond to this incentive.
Second, the funding model could reward counties for reducing the reconviction rates of realigned offenders who commit new crimes. While realignment significantly enhanced the incentive each county faced to reduce the recidivism level of the locally managed population, tying funding to the size of the realigned population (as proposed above) may diminish this incentive because funding will increase proportionally with 1170(h) convictions. A recidivism reduction bonus would balance these incentives by rewarding counties for the reductions in convictions they are able to achieve among this population. This recidivism bonus could reward both counties that achieve low levels of reconvictions and counties that show significant improvement over time in their reconviction rates.
While the Realignment Allocation Committee expressed an early interest in rewarding counties based on recidivism outcomes, high-quality recidivism data have only recently become available because of the

http://www.ppic.org Funding Public Safety Realignment 20
timeframe required to allow for recidivism outcomes to unfold. Recidivism data, much like the population count and composition data described above, are theoretically available for the full realignment population through state data sources. CDCR collects data on returns to prison custody for all PRCS and parole releases, and the DOJ collects data on all convictions and thus may be able to identify the reconviction rates of realigned offenders. If CDCR data were combined with DOJ data, we could potentially achieve a full picture of county recidivism levels and improvements over time under realignment. Alternatively, the state may need to rely on recidivism data collected at the county level to capture the impact of realignment.
While we approach the possibilities of these new data sources with optimism, the fact remains that the Realignment Allocation Committee will likely need to offer recommendations for the Year 4 allocation model before new data sources become available. Given these constraints, we apply the key components described here to the Year 4 allocation using currently available public data. The next section describes our proposed model in detail.

http://www.ppic.org Funding Public Safety Realignment 21
Proposed Year 4 Model
As the Realignment Allocation Committee works toward a recommendation for a Year 4 funding model, it will be challenging to balance the range of perspectives and concerns brought to the table by state, county, and community stakeholders. This section describes our proposed Year 4 allocation model. In developing this model, we drew upon the key components presented in the previous section and evaluated the model based on the criteria outlined earlier in the report. We also drew upon recommendations from our colleagues.
The Legislative Analyst’s Office (LAO) has mentioned its concerns about past allocations and offered a possible model for the future (Taylor, 2012). The LAO is particularly concerned with establishing a model that appropriately estimates the realignment population and changes over time with changes in the burden of realignment. The LAO suggests the best approach would be to base funding allocations on two factors: the size of the at-risk (ages 18–35) county population and the number of felony dispositions within a county, adjusting for dispositions that result in prison incarceration. This proposal is promising because it would simplify the current (Year 2) allocation model and apply the same model to all counties. While obtaining reliable felony disposition data may be challenging in the near term, resulting in less transparent allocations, it may become easier in the long term. While the LAO model is better than the current method at capturing the realignment burden, the trade-off to its simplicity is that it omits consideration of county differences in the capacity to manage realignment and offers only limited incentives for county performance.
Using the LAO model as a starting point, we propose a possible Year 4 model that uses currently available data (rather than the ideal data described in the previous section) to estimate the burden of realignment and construct a base funding allocation. We then adjust this base allocation for relevant differences in county characteristics and introduce bonuses to the base allocation for county reductions in recidivism. Finally, we assess the degree to which our proposed Year 4 model meets the criteria we have outlined for a permanent funding model. While this model has its limitations, due primarily to the availability of data, we recommend its adoption because it substantially improves upon past models and provides a foundation for a permanent model.
Realignment Burden: The Base Allocation
We propose a Year 4 base allocation that captures the burden counties bear in managing their lower-level felon population. The base allocation would consist of the following elements:
1. The county share of the total projected full roll-out realignment population (weighted at 40%)
2. The county share of the total high-risk population, males ages 18–29 (weighted at 60%)
The proposed base allocation reconciles the Year 1 and Year 2–3 models by rebalancing the weighting of both the projected realignment population and the county adult population. In this case, however, we have refined the adult population measure to capture only the high-risk population, identified in the literature as males ages 18–29, rather than the full adult population (Laub and Sampson, 2001; Piquero et al., 2003). Projected increases in this population vary across counties over time. As a result, the model is designed to adapt along with this indicator to changes in the underlying public safety risk. These changes provide a more accurate assessment of the realignment burden over time, improving the responsiveness of the allocation.

http://www.ppic.org Funding Public Safety Realignment 22
While the approach outlined here balances and refines past measures, it still falls short of the ideal described in the previous section. Should data become available that capture the full realigned population, the base allocation could be adjusted accordingly. We explain the proposed base allocation in more detail in the Technical Appendix.
Capacity Adjustments: Differences in County Characteristics Our proposed model allows for adjustments to the base allocation to capture differences in county characteristics that may affect a county’s capacity to manage the realigned population. While no indicators will perfectly capture relevant differences in county characteristics, this model does bring key indicators of economic and geographic difference into the allocation decision. Because the most critical difference in county demographics—the relative size of the high-risk adult population—is included in the base allocation to capture the realignment burden, we have not included it here. We propose the following adjustments to capture relevant economic and geographic differences:
1. Poverty Rate. The poverty rate is a key indicator of the overall level of resources in a county.9 High-poverty counties typically have lower tax bases and serve higher-need populations than low-poverty counties. Local resource constraints likely played an important role in the tendency of relatively poor counties to shift their criminal justice problems to the state prison system prior to realignment. Figure 3 demonstrates the positive relationship between county poverty rates and pre-realignment prison incarceration rates. Poverty rates are also correlated with other common indicators of local economic status, such as the unemployment rate and median income.10 In our model, counties receive adjustments of up to 10 percent of their base allocation depending on their level of poverty. This adjustment is explained in more detail in the Technical Appendix.
FIGURE 3 Scatterplot of poverty rates and pre-realignment state prison incarceration rates, 2011
SOURCES: Poverty rates are from the United States Department of Agriculture (2011); state prison incarceration rates are from the Center on Juvenile and Criminal Justice (2010).
9 We recognize that the federal poverty measure is not ideal because there exist substantial differences in the cost of living across the state. Alternative poverty measures are available for California (see Bohn et al. 2013), but we have elected to use the federal poverty measure because it is available for all counties and updated annually. 10 County poverty rates are positively correlated with county unemployment rates (r = 0.62) and negatively correlated with county median income (r = -0.76).
0
200
400
600
800
1,000
1,200
1,400
1,600
1,800
0.0% 5.0% 10.0% 15.0% 20.0% 25.0% 30.0%
Pre-
real
ignm
ent s
tate
pris
on
inca
rcer
atio
n ra
te p
er 1
00,0
00 a
dult
popu
latio
n
(age
s 18
–69)
Percent of total population in poverty (2011)

http://www.ppic.org Funding Public Safety Realignment 23
2. Rural Population. The percent of the county population living in rural areas is a key indicator of the challenge of managing and supervising the realigned population. Counties with significant rural populations may be limited in their capacity to reach these populations with services and supervision. Residents of rural areas may also face barriers to accessing services because service providers are concentrated in urban areas and transportation options are more limited in rural areas. Given these additional barriers to actualizing the community supervision and rehabilitation vision of realignment, we increase the base allocation of sparsely populated counties by up to 10 percent, depending on the share of the population living in rural areas. This adjustment is explained in more detail in the Technical Appendix.
The inclusion of adjustments for differences in county characteristics expands the model to include additional factors, as well as allowing allocation shares to adapt along with changes in the circumstances counties face over time.
Incentive Bonuses: Recidivism Reduction Achieving lower rates of recidivism is a key goal for the state because the share of individuals returning to crime has a direct bearing on the state’s ability to reduce prison crowding. It is equally important at the county level because it reflects the degree to which counties are able to mitigate the effects of realignment on public safety. Our proposed Year 4 model includes two types of incentive bonuses:
1. Low Rates of Return to Prison. Our proposed model offers a 5 percent bonus to the base allocation of counties that achieve low levels of recidivism, as measured by the share of realigned offenders returned to prison. Counties also receive a 5 percent bonus if they achieve a relatively high reduction in rates of recidivism, as measured by the year-over-year change in the share of realigned offenders returned to prison.
2. Low Rates of Conviction. Our proposed model also offers a 5 percent bonus to the base allocation of counties that achieve low levels of recidivism, as measured by the reconviction levels of realigned offenders. Counties that achieve relatively high recidivism reduction rates, as measured by the year-over-year change in the share of realigned offenders who are convicted of new crimes, also receive a 5 percent bonus.
Bonuses for counties with low recidivism levels reward high-performing counties, while bonuses for counties that show strong reductions in their recidivism rates allow for counties that begin realignment with relatively high levels of recidivism to receive rewards for improvement over time. These incentive bonuses are explained in more detail in the Technical Appendix.
County Allocations under Our Proposed Year 4 Model
Under our Year 4 model, the majority of counties would receive an allocation share that falls somewhere between their Year 1 and Year 2–3 share. For those counties that would receive a lower allocation share under this model than in past years, we include a minimum allocation rule to ensure they receive at least their minimum past year allocation. We include this rule because it improves the political feasibility of the model and because we recognize we have made a strong case for the importance of additional data to appropriately capture the burden of realignment. While we view the proposed Year 4 model as an improvement on past models, it is still an incremental step toward a permanent allocation model. Given the history of shifting allocations over time and the less-than-ideal data available for some of the key components in the model, it seems reasonable to provide the stability of a minimum allocation in Year 4.

http://www.ppic.org Funding Public Safety Realignment 24
Table 4 indicates where the proposed allocation is based on our Year 4 model, as presented above, and where the share relies on the minimum allocation rule.
TABLE 4 Proposed Year 4 model: County allocation shares compared with past allocation shares
County Year 1
allocation share (%)
Year 2–3 allocation share
(%)
Proposed year 4 allocation share
(%) Year 4
allocation model
Alameda 2.60 3.47 2.86 Proposed model Alpine 0.02 0.02 0.02 Minimum rule Amador 0.15 0.13 0.13 Minimum rule Butte 0.77 0.66 0.85 Proposed model Calaveras 0.10 0.09 0.09 Minimum rule Colusa 0.06 0.05 0.07 Proposed model Contra Costa 1.29 2.29 1.50 Proposed model Del Norte 0.06 0.06 0.08 Proposed model El Dorado 0.34 0.40 0.34 Minimum rule Fresno 2.49 2.47 2.62 Proposed model Glenn 0.09 0.08 0.09 Proposed model Humboldt 0.43 0.40 0.42 Proposed model Imperial 0.37 0.37 0.43 Proposed model Inyo 0.05 0.05 0.05 Minimum rule Kern 3.06 2.78 2.85 Proposed model Kings 0.81 0.72 0.72 Proposed model Lake 0.23 0.21 0.22 Proposed model Lassen 0.11 0.09 0.17 Proposed model Los Angeles 31.77 31.77 31.77 Minimum rule Madera 0.48 0.41 0.46 Proposed model Marin 0.37 0.54 0.37 Minimum rule Mariposa 0.05 0.04 0.04 Proposed model Mendocino 0.28 0.24 0.24 Proposed model Merced 0.71 0.62 0.76 Proposed model Modoc 0.02 0.02 0.02 Proposed model Mono 0.03 0.03 0.03 Proposed model Monterey 1.09 0.94 1.11 Proposed model Napa 0.30 0.29 0.29 Minimum rule Nevada 0.15 0.21 0.15 Minimum rule Orange 6.51 6.68 6.51 Minimum rule Placer 0.84 0.73 0.79 Proposed model Plumas 0.04 0.04 0.04 Proposed model Riverside 5.95 5.12 5.36 Proposed model Sacramento 3.71 3.33 3.57 Proposed model San Benito 0.15 0.13 0.15 Proposed model San Bernardino 7.28 6.63 6.74 Proposed model San Diego 7.09 7.02 7.90 Proposed model San Francisco 1.43 2.03 1.71 Proposed model San Joaquin 1.92 1.75 1.75 Minimum rule San Luis Obispo 0.62 0.61 0.76 Proposed model San Mateo 1.19 1.60 1.23 Proposed model

http://www.ppic.org Funding Public Safety Realignment 25
County Year 1
allocation share (%)
Year 2–3 allocation share
(%)
Proposed year 4 allocation share
(%) Year 4
allocation model
Santa Barbara 1.09 0.95 1.27 Proposed model Santa Clara 3.55 4.00 3.80 Proposed model Santa Cruz 0.47 0.61 0.57 Proposed model Shasta 0.84 0.74 0.74 Proposed model Sierra 0.02 0.02 0.02 Minimum rule Siskiyou 0.13 0.11 0.11 Proposed model Solano 1.07 1.00 1.00 Proposed model Sonoma 0.91 1.07 1.01 Proposed model Stanislaus 1.70 1.45 1.50 Proposed model Sutter 0.33 0.30 0.30 Minimum rule Tehama 0.34 0.30 0.31 Proposed model Trinity 0.04 0.04 0.04 Minimum rule Tulare 1.60 1.39 1.40 Proposed model Tuolumne 0.17 0.14 0.16 Proposed model Ventura 1.61 1.79 1.61 Proposed model Yolo 0.84 0.72 0.89 Proposed model Yuba 0.28 0.25 0.27 Proposed model
SOURCES: Years 1–3: information provided by CSAC; Year 4: allocations resulting from the proposed model.
In some cases, counties receive their minimum allocation under this model, but there is no need to impose this minimum allocation level. This is particularly true of counties with the same allocation share under all model years.
Table 4 (continued)

http://www.ppic.org Funding Public Safety Realignment 26
Conclusion
As the Realignment Allocation Committee works on its recommendations for the Year 4 model, it faces the challenge of incorporating the range of perspectives and concerns brought to the table by state, county, and community stakeholders. We offer one possible allocation model as a demonstration of how past models could be reconciled and how additional factors could be incorporated into future allocations.
Our proposed model starts with a base allocation that takes into account both the projected realignment population and the county high-risk adult population to capture the realignment burden. The model then allows for capacity adjustments to this base to capture differences in county economic and geographic characteristics. Finally, the model incorporates incentive bonuses to reward counties for working toward state recidivism goals. The inclusion of these capacity adjustments and incentive bonuses enrich the model to reflect genuine variation in the circumstances and achievements of counties over time.
Under our proposed Year 4 model, the majority of counties would receive an allocation share that falls somewhere between their Year 1 and Year 2–3 shares. For those counties that would receive a lower allocation share under the proposed model than in past years, we impose a “minimum past allocation” rule.
Although funding allocation processes are notoriously contentious, reconciling the Year 1 and Year 2–3 approaches may go a long way toward improving perceptions of fairness across counties. In addition to the question of how realignment population projections should be balanced against county population size, counties have also pointed to differences in economic and geographic characteristics as relevant factors in the allocation decision. Economic characteristics, such as the poverty rate, may signal differences in the underlying level of available resources and the ease with which county economies can absorb their realignment populations. Similarly, geographic characteristics, such as the share of the population residing in rural areas, may indicate the feasibility and cost associated with providing supervision and services to this population. Considering these factors in allocating funding may improve county perceptions of fairness.
Our proposed model also reflects the state’s interest in improving recidivism outcomes. Low recidivism rates among realigned offenders mean that fewer low-level offenders will be returning to prison, directly affecting the state’s ability to reduce crowding to a level acceptable under the current court ruling. In addition, recidivism rates reflect the degree to which counties are able to mitigate the effects of realignment on public safety. Given these interests, the state may want to include rewards for recidivism reduction in the funding allocation model.
The ideal permanent allocation model would include many of the features of our proposed Year 4 model but would replace the base allocation with an accurate measure of the realignment population. Although the state has not yet identified the full realignment population, it may be feasible to do so using state- or county-level data sources. It may also be feasible to use these data to capture recidivism outcomes for the full realignment population. However, in the meantime the committee will need to arrive at a Year 4 allocation model using available data.
The cost of realignment is one of the fundamental challenges facing every one of California’s 58 counties. Our work here focuses on how the state might improve the funding allocation model to compensate counties for their additional burden, while also enabling them to achieve recidivism and public safety goals. However, funding is only one of the resources the state may provide to counties. The state is also in a position to assist

http://www.ppic.org Funding Public Safety Realignment 27
counties in identifying cost-effective practices, and it has created a Board of State and Community Corrections to channel this kind of implementation assistance to counties. Through the BSCC, the state has the opportunity to support data collection, research, and evaluation efforts that will help counties draw upon each other’s early experiences under realignment to identify best practices. The BSCC can then serve as a medium through which these best practices can be shared statewide, encouraging and enabling counties to prioritize cost-effective strategies, thereby reducing overall costs and improving recidivism and public safety outcomes.

http://www.ppic.org Funding Public Safety Realignment 28
References
Bohn, Sarah, Caroline Danielson, Matt Levin, Marybeth Mattingly, and Christopher Wimer. 2013. The California Poverty Measure: A New Look at the Social Safety Net. Public Policy Institute of California. Available at www.ppic.org/main/publication.asp?i=1070.
California Budget Project. 2012a. “What Would Proposition 30 Mean for California?” Budget Brief. Available at www.cbp.org/pdfs/2012/120911_Proposition_30_BB.pdf.
California Budget Project. 2012b. “Finishing the Job: Moving Realignment toward Completion in 2012.” Budget Brief. Available at www.cbp.org/pdfs/2012/120607_Realignment_BB.pdf.
California Budget Project. 2013. “A Mixed Picture: State Corrections Spending after the 2011 Realignment.” Budget Brief. Available at www.cbp.org/pdfs/2013/130625_A_Mixed_Picture_Corrections.pdf.
California Department of Corrections and Rehabilitation. 2012. The Future of California Corrections: A Blueprint to Save Billions of Dollars, End Federal Oversight, and Improve the Prison System. Available at www.cdcr.ca.gov/2012plan/docs/plan/complete.pdf.
California Department of Corrections and Rehabilitation. 2013. Realignment Report. Available at www.cdcr.ca.gov/realignment/docs/Realignment%206%20Month%20Report%20Final_5%2016%2013%20v1.pdf.
California Department of Finance. 2010. Projections of the Realignment Population. Available at www.cdcr.ca.gov/realignment/docs/Realignment-Population-Projections-Final.pdf.
Center on Juvenile and Criminal Justice. 2010. Adult Sentencing Statistics, Calendar Year 2010. Data available at http://casi.cjcj.org/Adult/2010.
Jett, Kathryn, and Joan Hancock. 2013. “Realignment in the Counties.” Federal Sentencing Reporter 25 (4): 236–240. Available at www.jstor.org/stable/10.1525/fsr.2013.25.4.236.
Laub, John, and Robert Sampson. 2001. “Understanding Desistance from Crime.” Crime and Justice, 28, 1–69.
Lofstrom, Magnus, and Steven Raphael. 2013. Impact of Realignment on County Jail Populations. Public Policy Institute of California. Available at www.ppic.org/main/publication.asp?i=1063.
McIntosh, Paul. 2011. “Allocation/Caseload Information on AB 109/AB 117,” CSAC memo to Chairs of the County Boards of Supervisors and County Administrative Officers. Available at www.cmhda.org/go/portals/0/cmhda%20files/committees/forensics/1107_forensics/csac_memo_re_allocation-caseload_info_on_ab_109_%287-8-11%29.pdf.
McIntosh, Paul. 2012. “Update on Realignment Fiscal Matters,” CSAC memo to County Administrative Officers and Auditor Controllers. Available at www.csac.counties.org/sites/main/files/file-attachments/12.02.06_memo_to_caoa-cs_on_realignment_fiscal_matters_020812_final.pdf.
Misczynski, Dean. 2011. Rethinking the State-Local Relationship: Corrections. Public Policy Institute of California. Available at www.ppic.org/content/pubs/report/R_811DMR.pdf.
Piquero, Alex, David Farrington, and Alfred Blumstein. 2003. “The Criminal Career Paradigm.” Crime and Justice, 30, 83–142.
Taylor, Mac. 2012. The 2012–13 Budget: The 2011 Realignment of Adult Offenders—An Update. California Legislative Analyst’s Office. Available at www.cdcr.ca.gov/Reports/docs/External-Reports/2011-realignment-of-adult-offenders-022212.pdf.
United States Department of Agriculture, Economic Research Service. 2011. Poverty Rates by County. Available at www.ers.usda.gov/data-products/county-level-data-sets/poverty.aspx#.UejP56wQMkg.

http://www.ppic.org Funding Public Safety Realignment 29
About the Authors
Mia Bird is a research fellow at the Public Policy Institute of California, where she focuses on corrections and health and human services policy. Her current projects evaluate the effects of public safety realignment on reentry and recidivism outcomes and develop models to allocate realignment funding. Before joining PPIC, Mia served as a research and evaluation consultant with the San Francisco Office of the Public Defender and the San Francisco Superior Court. She holds a Ph.D. in public policy and an M.A. in demography from the University of California, Berkeley.
Joseph Hayes is a research associate at the Public Policy Institute of California, where he studies population change and corrections issues. Recent projects have focused on inter-regional migration, estimates of the undocumented immigrant population, and the changing composition of the prison population. He holds an M.S. in agricultural economics from the University of Wisconsin, Madison.
Acknowledgments
The authors would like to acknowledge and thank our external reviewers, Drew Soderborg (Legislative Analyst’s Office) and Steve Raphael (University of California, Berkeley), who enhanced this report with their comments and constructive feedback. The authors would also like to extend their appreciation to our internal reviewers, Magnus Lofstrom and Laurel Beck, for their support of this project and very helpful comments. We would like to especially thank Diane Cummins (California Department of Finance), who graciously shared information relevant to this report. This project also required communication with government staff, and we thank Dave Lesher, our director of governmental affairs, for facilitating those communications. This report greatly benefited from the editorial expertise of our communications staff, Lynette Ubois and Gary Bjork. Any errors in this work are the authors’ responsibility alone.

PUBLIC POLICY INSTITUTE OF CALIFORNIA
Board of Directors
Donna Lucas, Chair Chief Executive Officer Lucas Public Affairs
Mark Baldassare President and CEO Public Policy Institute of California
Ruben Barrales President and CEO GROW Elect
María Blanco Vice President, Civic Engagement California Community Foundation
Brigitte Bren Attorney
Walter B. Hewlett Chair, Board of Directors William and Flora Hewlett Foundation
Phil Isenberg Chair Delta Stewardship Council
Mas Masumoto Author and farmer
Steven A. Merksamer Senior Partner Nielsen, Merksamer, Parrinello, Gross & Leoni, LLP
Kim Polese Chairman ClearStreet, Inc.
Thomas C. Sutton Retired Chairman and CEO Pacific Life Insurance Company

The Public Policy Institute of California is dedicated to informing and improving public policy in California through independent, objective, nonpartisan research on major economic, social, and political issues. The institute’s goal is to raise public awareness and to give elected representatives and other decisionmakers a more informed basis for developing policies and programs.
The institute’s research focuses on the underlying forces shaping California’s future, cutting across a wide range of public policy concerns, including economic development, education, environment and resources, governance, population, public finance, and social and health policy.
PPIC is a public charity. It does not take or support positions on any ballot measures or on any local, state, or federal legislation, nor does it endorse, support, or oppose any political parties or candidates for public office. PPIC was established in 1994 with an endowment from William R. Hewlett.
Mark Baldassare is President and Chief Executive Officer of PPIC. Donna Lucas is Chair of the Board of Directors.
Short sections of text, not to exceed three paragraphs, may be quoted without written permission provided that full attribution is given to the source.
Research publications reflect the views of the authors and do not necessarily reflect the views of the staff, officers, or Board of Directors of the Public Policy Institute of California.
Copyright © 2013 Public Policy Institute of California All rights reserved. San Francisco, CA
PUBLIC POLICY INSTITUTE OF CALIFORNIA 500 Washington Street, Suite 600 San Francisco, California 94111 phone: 415.291.4400 fax: 415.291.4401 www.ppic.org
PPIC SACRAMENTO CENTER Senator Office Building 1121 L Street, Suite 801 Sacramento, California 95814 phone: 916.440.1120 fax: 916.440.1121