fus-1315*;m-0099xxxx.o; quarterly … · web viewdocket number: m-2018-2641241 bureau of technical...
TRANSCRIPT

PENNSYLVANIA PUBLIC UTILITY COMMISSION
Public Meeting held January 18, 2018
Docket Number: M-2018-2641241
BUREAU OF TECHNICAL UTILITY SERVICES
REPORT ON THE QUARTERLY EARNINGS
OF JURISDICTIONAL UTILITIES
FOR THE YEAR ENDED
September 30, 2017
Gladys M. Brown, ChairmanAndrew G. Place, Vice Chairman, Statement, dissentingNorman J. Kennard, CommissionerDavid W. Sweet, CommissionerJohn F. Coleman, Jr., Commissioner

TABLE OF CONTENTS Page No.
Introduction..................................................................................................... 4* UGI Penn Natural Gas, Inc., and Pennsylvania American Water Company have pending rate filings at Docket Nos. R-2016-2580030, and R-2017-2595853, respectively, and filed a letter with the Secretary in place of a report in accordance with 52 Pa. Code § 71.4.
Attachment A – Summary of Equity Returns……………………………… 5
Attachment B – Summary of Returns............................................................ 12This chart depicts the overall and equity returns (actual and adjusted) for the filing utilities for the current quarter. The last authorized equity return and the year authorized is also shown.
Attachment C – Allowed Rates of Return on Common Equity.................... 14This is a historical chart that shows the most recent fully litigated rate cases for select companies in electric, gas, and water. A docket number followed by their final return on equity and year is also given.
Attachment D – Distribution System Improvement Charge Return on Equity 15Compares utility adjusted return on equity to Commission authorized return on equity for utilities with a Distribution System Improvement Charge.
Attachment E – Explanation of Return on Equity Methods........................ 16Criteria for determining the industry barometer groups used in ROE calculations. Also, provides details of the Discounted Cash Flow equation and Capital Asset Pricing Model equation.
Attachment F – Market Based Returns on Equity – Electric....................... 18The market indicated common equity cost rate range consists of data used from the electric barometer groups and is based on a series of calculations to average the DCF methods. Also, indicates Distribution System Improvement Charge Return.
Attachment F – Historic DCF and CAPM – Electric.................................... 19Historic barometer group DCF and CAPM average ROEs, including a linear trend line graph.
Attachment F – Electric Barometer Group Calculation of a Current and 52 Week Average Dividend Yield..................................................................................................................................................................................................................................20
Electric barometer companies are used to calculate a current DCF in the first chart. The second chart demonstrates the companies 52 week average DCF. A final average of the two calculations is also shown at the bottom.
Attachment F – Development of a Representative Dividend Growth Rate…………………………………………………..........
........................................................................................ 21Multiple sources of the gas barometer companies projected 5 year Earnings Per Share are used to calculate the Group Average Dividend Growth Estimate.
Attachment G – Market Based Returns on Equity – Gas.........................................................................................................................................................................................................................22
The market indicated common equity cost rate range consists of data used from the gas barometer groups and is based on a series of calculations to average the DCF methods. Also, indicates Distribution System Improvement Charge Return.
2

Attachment G – Historic DCF and CAPM – Gas.......................................... 23Historic barometer group DCF and CAPM average ROEs, including a linear trend line graph.
Attachment G – Gas Barometer Group Calculation of a Current and 52 Week Average Dividend Yield.......................................................................................................................................................................................................................................24
Gas barometer companies are used to calculate a current DCF in the first chart. The second chart demonstrates the companies 52 week average DCF. A final average of the two calculations is also shown at the bottom.
Attachment G – Development of a Representative Dividend Growth Rate…………………………………………………..........
........................................................................................ 25Multiple sources of the gas barometer companies projected 5 year Earnings Per Share are used to calculate the Group Average Dividend Growth Estimate.
Attachment H – Market Based Returns on Equity – Water....................................................................................................................................................................................................................26
The market indicated common equity cost rate range consists of data used from the water barometer groups and is based on a series of calculations to average the DCF methods. Also, indicates Distribution System Improvement Charge Return.
Attachment H – Historic DCF and CAPM – Water...................................... 27Historic barometer group DCF and CAPM average ROEs, including a linear trend line graph.
Attachment H – Water Barometer Group Calculation of a Current and 52 Week Average Dividend Yield..................................................................................................................................................................................................................................28
Water barometer companies are used to calculate a current DCF in the first chart. The second chart demonstrates the companies 52 week average DCF. A final average of the two calculations is also shown at the bottom.
Attachment H – Development of a Representative Dividend Growth Rate…………………………………………………..........
........................................................................................ 29Multiple sources of the water barometer companies projected 5 year Earnings Per Share are used to calculate the Group Average Dividend Growth Estimate.
3

Introduction:
On September 20, 1991, the Commission initiated a rulemaking at L-00910061 pertaining to earnings disclosures by the public utilities subject to its jurisdiction. At that docket, the Commission stated that the submission of accurate, reliable and complete earnings disclosure reports, at regular intervals, is essential to the fulfillment of the broad regulatory oversight responsibilities entrusted to the Commission by the Legislature in the Public Utility Code. The earnings disclosure regulations promulgated by the Commission were adopted October 1, 1992, and published January 23, 1993, at 23 Pa.B. 463. Based upon those regulations, codified at 52 Pa. Code, Chapter 71, a reporting format was developed and distributed to the jurisdictional fixed utilities of Pennsylvania.
All fixed utilities having jurisdictional revenues of $1,000,000 or more, for a calendar year, are required to file the report by March 31 of each year. Such reports are to be based upon the results of operations for the 12-month period ending December 31 of the prior year. Utilities having more than $10,000,000 in jurisdictional revenues are also required to file reports for the 12 months ending on March 31, June 30, and September 30 of each year. On November 30, 2004, however, the Pennsylvania General Assembly signed into law Act 183 concerning alternative telecommunications regulation and broadband deployment. As a result of Act 183, the reporting requirements for the PUC jurisdictional telecommunications companies of Pennsylvania have been streamlined at section 3015(e) of the Public Utility Code. A quarterly earnings report is not listed among those reports now required of PUC jurisdictional telecommunications utilities in Pennsylvania and, therefore, this report does not address telephone company earnings.
The reports have been filed for the period ended September 30, 2017.1 The Finance Staff of the Bureau of Technical Utility Services has reviewed the reports and has prepared this summary report for public release. This report sets forth the achieved return on equity for each company, the last allowed return for that utility, a market return as determined through the analysis of the barometer group data and the most recent returns allowed, per industry, by the Pennsylvania Public Utility Commission and by other regulatory bodies. Where a utility has not filed a report, the reasons for not filing are indicated.
Questions pertaining to the preparation and contents of this Report should be directed to Ms. Erin Laudenslager, Manager - Finance, Bureau of Technical Utility Services, at (717) 705-4364.
1 UGI Penn Natural Gas, Inc., and Pennsylvania American Water Company have pending rate filings at Docket Nos. R-2016-2580030, and R-2017-2595853, respectively, and filed a letter with the Secretary in place of a report in accordance with 52 Pa. Code § 71.4.
4

Attachment A
The equity return summaries that follow in Attachment A are, for each quarter;
ACTUAL1. Based on actual results of operations
and
ADJUSTED2. Based on company proposed pro forma and ratemaking adjustments
5

Attachment A
ELECTRIC UTILITIESEQUITY RETURNS BY QUARTER
QTREND
PECO PPL Duq W Penn PaPwr UGI Penelec MetEdACT ADJ ACT ADJ ACT ADJ ACT ADJ ACT ADJ ACT ADJ ACT ADJ ACT ADJ
2011 4 13.41 11.38 10.21 9.97 13.33 11.58 5.91 7.60 14.60 9.79 6.45 8.43 4.24 5.232012 1 12.89 11.26 10.95 10.71 11.66 13.16 5.78 7.02 15.04 8.42 5.76 7.54 3.90 4.64
2 12.63 12.01 10.81 10.42 10.61 9.15 8.95 8.95 14.61 8.53 6.48 8.08 3.44 4.013 13.14 12.66 10.33 9.92 10.63 10.45 9.69 9.54 15.85 9.48 7.34 8.58 5.72 6.284 11.55 11.56 6.02 4.88 10.27 9.24 9.54 9.54 8.41 8.27 14.60 8.98 5.41 7.74 5.39 6.81
2013 1 11.92 11.27 7.56 6.24 10.12 9.74 9.23 9.23 8.89 8.74 12.77 9.84 5.30 7.67 5.01 6.472 11.40 10.74 7.80 7.37 12.34 12.34 8.85 8.70 11.53 10.49 5.86 8.21 5.36 6.793 11.09 10.96 8.67 8.38 9.13 9.13 8.49 8.34 10.74 10.65 -0.77 2.07 -12.43 -10.434 11.97 10.52 10.01 9.79 13.73 13.73 14.49 14.30 14.25 11.99 4.85 2.99 -6.06 -7.87
2014 1 9.97 10.34 10.02 10.04 11.58 9.45 15.28 15.04 13.36 10.25 5.17 3.34 -6.40 -8.132 10.05 10.08 9.50 10.09 9.77 9.29 12.64 9.213 8.93 9.25 10.07 9.99 9.97 9.48 8.76 9.224 8.23 9.58 9.77 9.40 9.01 10.00
2015 1 10.08 9.65 10.88 10.392 9.80 9.42 13.57 9.493 10.11 9.73 6.45 6.45 5.77 5.77 15.93 7.57 2.94 2.94 3.69 3.694 10.74 8.84 8.89 8.48 9.73 9.36 8.09 8.09 5.13 5.13 9.74 9.21 5.45 5.45 7.04 7.04
2016 1 10.86 9.74 7.75 6.94 9.87 9.89 10.41 8.692 11.46 10.15 9.15 8.51 9.57 9.47 8.29 8.103 13.42 11.44 10.15 9.59 10.12 9.46 19.18 6.994 12.52 10.65 10.45 10.29 9.71 9.01 26.07 7.30
2017 1 13.01 11.40 9.76 8.49 9.53 8.99 22.86 6.812 12.98 11.40 10.71 9.70 9.86 9.24 8.23 7.38 7.32 7.97 21.96 6.74 9.23 9.20 9.74 9.353 12.84 10.52 10.15 9.30 9.53 9.23 7.63 7.24 8.32 9.08 16.13 5.22 9.61 9.50 11.37 10.97
6

Attachment A
7

Attachment A
GAS UTILITIESEQUITY RETURNS BY QUARTER
QTR Columbia Peoples Natural
PECO UGI Peoples-Equitable
NFG UGI Penn PeoplesGas
END ACT ADJ ACT ADJ ACT ADJ ACT ADJ ACT ADJ ACT ADJ ACT ADJ ACT ADJ
2011 4 11.69 12.06 16.55 9.18 7.99 8.89 19.62 12.34 14.01 9.35 6.75 5.562012 1 8.65 11.24 8.98 12.09 15.71 8.95 2.29 8.05 15.76 10.51 13.22 9.63 5.24 3.39
2 9.00 10.17 8.72 12.03 13.60 9.90 5.51 7.51 14.10 10.06 13.63 10.40 4.57 6.433 9.27 8.88 6.21 9.35 9.98 13.48 13.79 10.05 5.84 7.79 13.88 10.39 13.16 10.66 7.02 7.414 11.24 9.57 12.42 15.10 13.68 9.44 7.27 8.05 15.11 10.17 13.31 10.63 5.05 6.94
2013 1 12.49 9.89 14.63 15.13 14.65 10.27 12.42 8.40 19.33 10.25 13.28 10.582 10.85 7.15 16.59 8.35 14.43 14.40 13.02 10.21 10.40 8.92 20.18 10.25 10.98 10.273 9.36 9.86 17.39 8.72 14.14 14.01 12.60 9.38 9.84 9.48 19.61 10.72 10.59 10.764 10.60 10.78 16.33 10.02 14.35 13.97 16.08 9.20 10.52 9.76 20.51 10.07 13.41 10.49 7.21 12.23
2014 1 14.68 9.94 15.23 13.52 16.81 8.35 12.00 8.73 23.11 9.78 16.67 10.06 12.19 11.872 13.05 9.78 15.32 13.24 16.71 8.39 13.54 8.49 22.97 12.00 15.30 10.90 14.06 12.323 13.43 9.16 15.45 13.21 16.63 8.64 14.41 9.15 21.36 11.03 13.77 10.15 15.07 12.624 9.71 9.97 11.85 7.89 13.86 12.59 15.00 7.93 14.52 12.46 20.40 10.79 15.64 9.82 16.91 11.83
2015 1 14.22 7.90 14.60 13.01 15.76 7.87 15.36 12.14 20.17 10.31 15.57 9.52 16.36 11.232 14.37 8.88 13.89 12.32 14.07 7.62 14.08 11.26 18.82 10.39 13.76 8.90 16.15 12.903 13.55 8.14 13.29 11.77 15.67 6.51 11.30 10.87 16.41 10.27 13.16 8.32 15.69 12.584 9.75 9.73 8.80 9.83 12.50 12.70 10.60 10.00 15.01 10.59 9.17 7.25 12.71 12.14
2016 1 7.01 10.02 10.73 13.58 8.98 10.20 12.60 10.97 7.85 8.85 8.54 10.482 6.24 9.99 11.55 13.85 8.29 10.40 12.31 11.08 9.41 8.37 9.20 10.433 6.93 9.34 12.09 14.40 13.05 10.82 13.00 10.34 6.47 8.81 9.07 12.024 8.90 9.26 10.11 11.03 11.39 12.37 16.42 11.07 14.18 9.58 12.47 11.87
2017 1 10.52 10.17 9.96 9.27 11.45 12.55 21.08 10.09 15.85 10.58 12.84 9.26 11.82 12.342 9.15 9.81 9.41 9.71 10.87 12.17 19.16 9.44 15.66 10.30 13.33 10.53 11.89 13.473 8.15 8.77 6.69 6.40 11.26 10.92 13.34 9.03 12.59 9.85 10.92 10.00 12.04 13.36
8

Attachment A
9

Attachment A
10

Attachment A
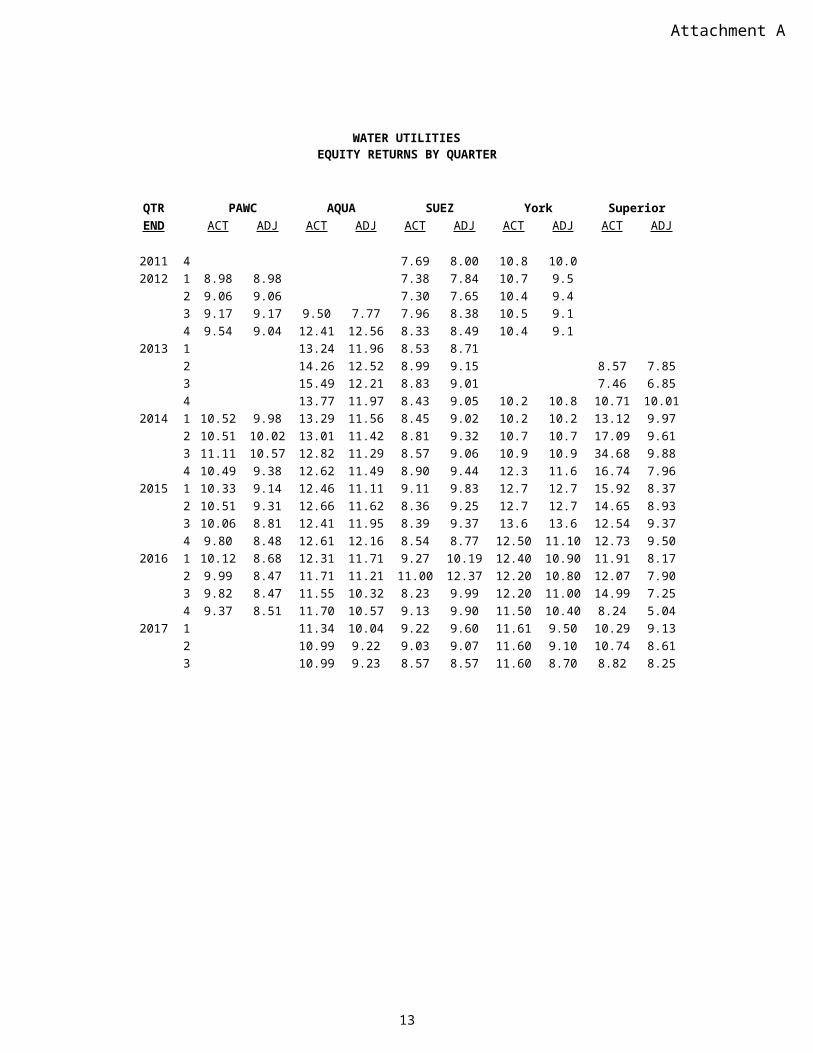
WATER UTILITIESEQUITY RETURNS BY QUARTER
QTR PAWC AQUA SUEZ York SuperiorEND ACT ADJ ACT ADJ ACT ADJ ACT ADJ ACT ADJ
2011 4 7.69 8.00 10.8 10.02012 1 8.98 8.98 7.38 7.84 10.7 9.5
2 9.06 9.06 7.30 7.65 10.4 9.43 9.17 9.17 9.50 7.77 7.96 8.38 10.5 9.14 9.54 9.04 12.41 12.56 8.33 8.49 10.4 9.1
2013 1 13.24 11.96 8.53 8.712 14.26 12.52 8.99 9.15 8.57 7.853 15.49 12.21 8.83 9.01 7.46 6.854 13.77 11.97 8.43 9.05 10.2 10.8 10.71 10.01
2014 1 10.52 9.98 13.29 11.56 8.45 9.02 10.2 10.2 13.12 9.972 10.51 10.02 13.01 11.42 8.81 9.32 10.7 10.7 17.09 9.613 11.11 10.57 12.82 11.29 8.57 9.06 10.9 10.9 34.68 9.884 10.49 9.38 12.62 11.49 8.90 9.44 12.3 11.6 16.74 7.96
2015 1 10.33 9.14 12.46 11.11 9.11 9.83 12.7 12.7 15.92 8.372 10.51 9.31 12.66 11.62 8.36 9.25 12.7 12.7 14.65 8.933 10.06 8.81 12.41 11.95 8.39 9.37 13.6 13.6 12.54 9.374 9.80 8.48 12.61 12.16 8.54 8.77 12.50 11.10 12.73 9.50
2016 1 10.12 8.68 12.31 11.71 9.27 10.19 12.40 10.90 11.91 8.172 9.99 8.47 11.71 11.21 11.00 12.37 12.20 10.80 12.07 7.903 9.82 8.47 11.55 10.32 8.23 9.99 12.20 11.00 14.99 7.254 9.37 8.51 11.70 10.57 9.13 9.90 11.50 10.40 8.24 5.04
2017 1 11.34 10.04 9.22 9.60 11.61 9.50 10.29 9.132 10.99 9.22 9.03 9.07 11.60 9.10 10.74 8.613 10.99 9.23 8.57 8.57 11.60 8.70 8.82 8.25
11

Attachment A
12
Attachment B
Attachment B includes:
A. Overall Returns on rate base1. Actual
2. Company proposed pro forma and ratemaking adjustments
and
B. Equity Returns1. Actual
2. Company proposed pro forma and ratemaking adjustments
13

Attachment B
Summary of ReturnsFor the Year Ended September 30, 2017OVERALL RETURN EQUITY RETURN ROE YEAR
COMPANY NAME ACTUAL ADJ ACTUAL ADJ AUTH AUTH
ELECTRIC$10,000,000 RevenuesPECO Energy - Electric Operations 8.88 7.56 12.84 10.52 Settled 2015PPL Electric Utilities Corp. 7.62 7.16 10.15 9.30 Settled 2015Duquesne Light Company 7.40 7.19 9.53 9.23 Settled 2014West Penn Power Company 6.24 6.04 7.63 7.24 Settled 2017Pennsylvania Power Company 7.12 7.54 8.32 9.08 Settled 2017UGI Utilities, Inc. - Electric Division 10.61 4.94 16.13 5.22 Settled 1996Pennsylvania Electric Company 7.44 7.37 9.61 9.50 Settled 2017Metropolitan Edison Company 8.42 8.21 11.37 10.97 Settled 2017
GAS$10,000,000 RevenuesColumbia Gas of PA, Inc. 6.54 6.94 8.15 8.77 Settled 2016Peoples Natural Gas Company LLC 6.69 6.40 9.42 9.18 Settled 2012PECO Energy - Gas Operations 7.97 7.67 11.26 10.92 Settled 2010UGI Utilities, Inc. - Gas Division 9.14 7.00 13.34 9.03 Settled 2016Peoples Nat’l - Equitable Division 8.17 6.70 12.59 9.85 Settled 2008National Fuel Gas Distribution Co. 7.95 7.40 10.92 10.00 Settled 2006UGI Penn Natural Gas, Inc.* Settled 2009Peoples Gas Company, LLC 7.64 8.25 12.04 13.36 Settled 2013UGI Central Penn Gas, Inc. 9.74 6.75 13.91 8.57 Settled 2009
WATER$10,000,000 RevenuesPA American Water Company* Settled 2013AQUA Pennsylvania 7.99 6.89 10.99 9.23 Settled 2012York Water Company 9.40 7.60 11.60 8.70 Settled 2014SUEZ Water Pennsylvania, Inc. 7.06 7.06 8.57 8.57 Settled 2015
* UGI Penn Natural Gas, Inc., and Pennsylvania American Water Company have pending rate filings at Docket Nos. R-2016-2580030, and R-2017-2595853, respectively, and filed a letter with the Secretary in place of a report in accordance with 52 Pa. Code § 71.4.
14

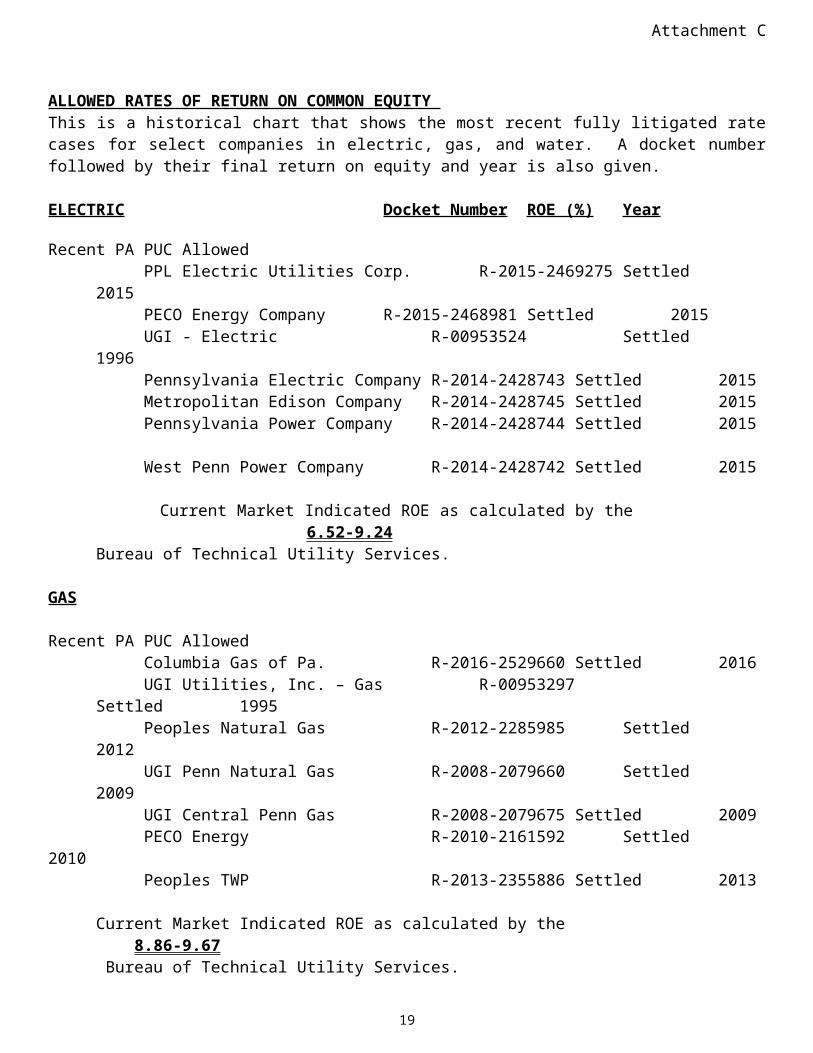
Attachment C
ALLOWED RATES OF RETURN ON COMMON EQUITY This is a historical chart that shows the most recent fully litigated rate cases for select companies in electric, gas, and water. A docket number followed by their final return on equity and year is also given.
ELECTRIC Docket Number ROE (%) Year
Recent PA PUC AllowedPPL Electric Utilities Corp. R-2015-2469275 Settled 2015PECO Energy Company R-2015-2468981 Settled 2015UGI - Electric R-00953524 Settled 1996Pennsylvania Electric Company R-2014-2428743 Settled 2015Metropolitan Edison Company R-2014-2428745 Settled 2015Pennsylvania Power Company R-2014-2428744 Settled 2015West Penn Power Company R-2014-2428742 Settled 2015
Current Market Indicated ROE as calculated by the 6.52-9.24Bureau of Technical Utility Services.
GAS
Recent PA PUC AllowedColumbia Gas of Pa. R-2016-2529660 Settled 2016UGI Utilities, Inc. – Gas R-00953297 Settled 1995Peoples Natural Gas R-2012-2285985 Settled 2012UGI Penn Natural Gas R-2008-2079660 Settled 2009UGI Central Penn Gas R-2008-2079675 Settled 2009PECO Energy R-2010-2161592 Settled 2010Peoples TWP R-2013-2355886 Settled 2013
Current Market Indicated ROE as calculated by the 8.86-9.67 Bureau of Technical Utility Services.
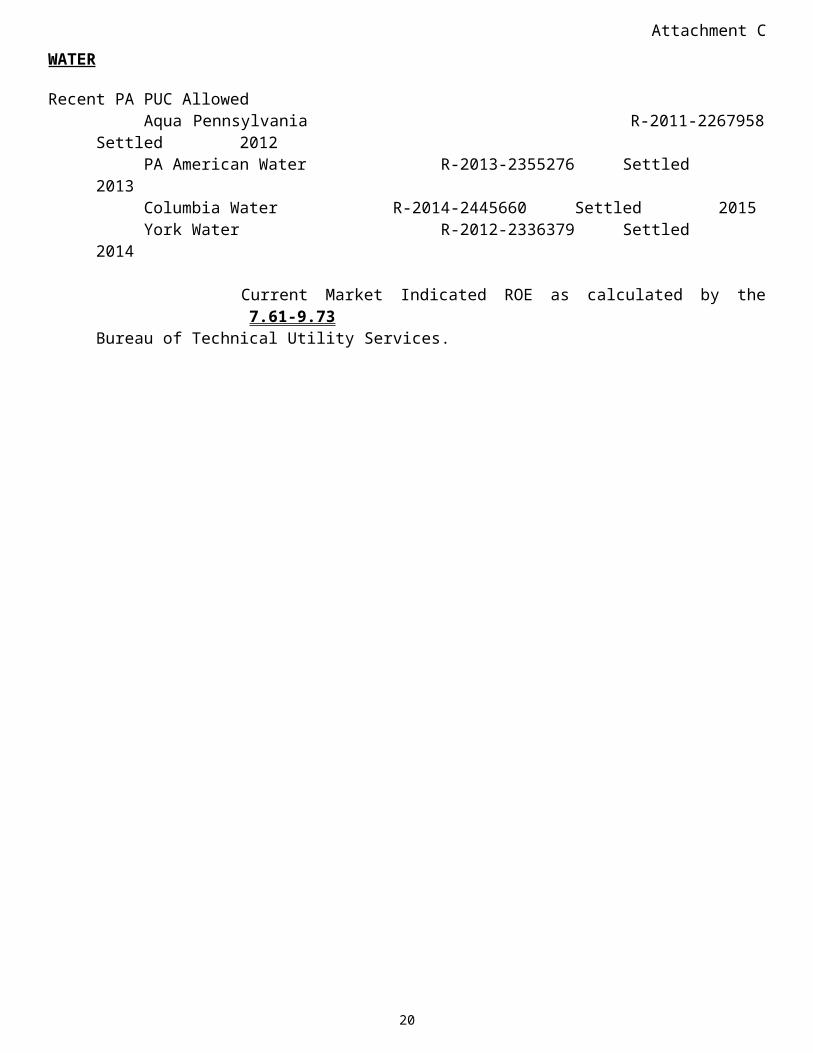
WATER
Recent PA PUC AllowedAqua Pennsylvania R-2011-2267958 Settled 2012PA American Water R-2013-2355276 Settled 2013Columbia Water R-2014-2445660 Settled 2015York Water R-2012-2336379 Settled 2014
Current Market Indicated ROE as calculated by the 7.61-9.73Bureau of Technical Utility Services.
15

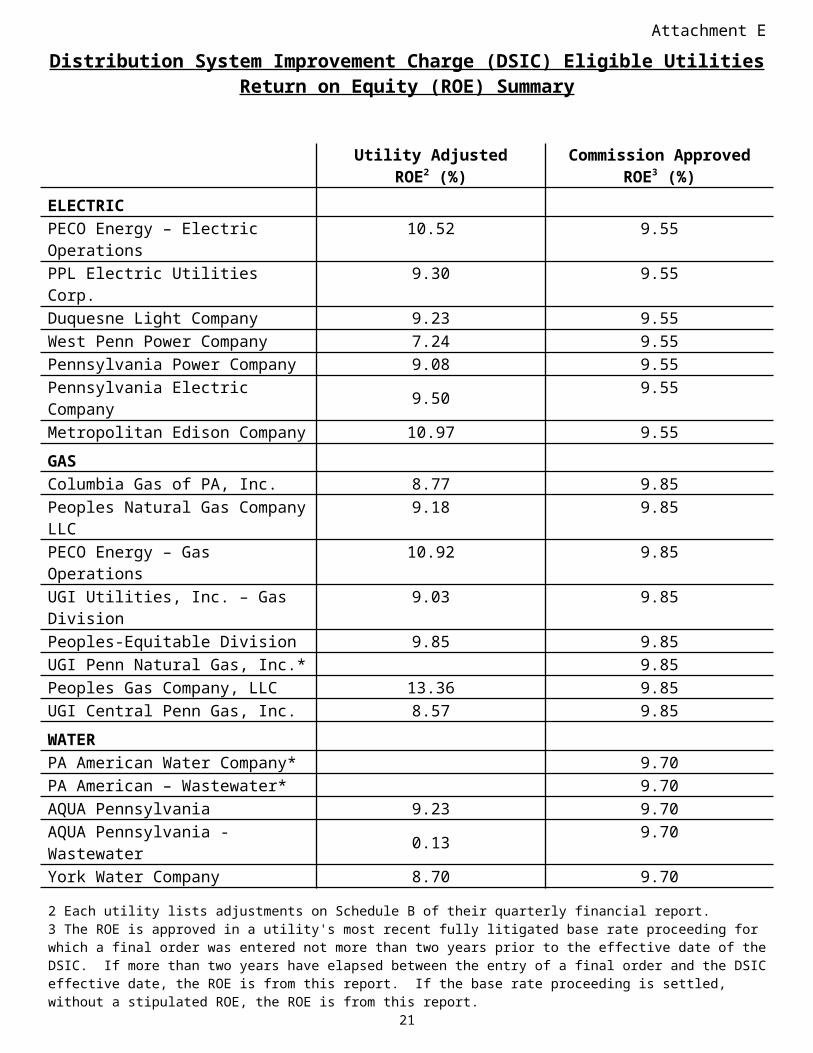
Attachment E
Distribution System Improvement Charge (DSIC) Eligible UtilitiesReturn on Equity (ROE) Summary
Utility AdjustedROE2 (%)
Commission ApprovedROE3 (%)
ELECTRICPECO Energy – Electric Operations 10.52 9.55PPL Electric Utilities Corp. 9.30 9.55Duquesne Light Company 9.23 9.55West Penn Power Company 7.24 9.55Pennsylvania Power Company 9.08 9.55Pennsylvania Electric Company 9.50 9.55Metropolitan Edison Company 10.97 9.55
GASColumbia Gas of PA, Inc. 8.77 9.85Peoples Natural Gas Company LLC 9.18 9.85PECO Energy – Gas Operations 10.92 9.85UGI Utilities, Inc. – Gas Division 9.03 9.85Peoples-Equitable Division 9.85 9.85UGI Penn Natural Gas, Inc.* 9.85Peoples Gas Company, LLC 13.36 9.85UGI Central Penn Gas, Inc. 8.57 9.85
WATERPA American Water Company* 9.70PA American – Wastewater* 9.70AQUA Pennsylvania 9.23 9.70AQUA Pennsylvania - Wastewater 0.13 9.70York Water Company 8.70 9.70SUEZ Water Pennsylvania Inc. 8.57 9.70Columbia Water Company* 9.70Newtown Artesian Water 9.26 9.70Superior Water 8.25 9.70
* UGI Penn Natural Gas, Inc., Pennsylvania American Water Company, and Columbia Water Company have pending rate filings at Docket Nos. R-2016-2580030, R-2017-2595853, and R-2017-2598203, respectively, and filed a letter with the Secretary in place of a report in accordance with 52 Pa. Code § 71.4.
Explanation of Discounted Cash Flow (DCF) and Capital Asset Pricing Model (CAPM)
2 Each utility lists adjustments on Schedule B of their quarterly financial report.3 The ROE is approved in a utility's most recent fully litigated base rate proceeding for which a final order was entered not more than two years prior to the effective date of the DSIC. If more than two years have elapsed between the entry of a final order and the DSIC effective date, the ROE is from this report. If the base rate proceeding is settled, without a stipulated ROE, the ROE is from this report.
16

Attachment E
Barometer Group Criteria
The criteria used for determining the industry barometer groups used to calculate ROEs in this report are as follows:
50% or more of the company’s assets must be related to the jurisdictional utility industry; The company’s stock must be publicly traded; Companies involved in merger & acquisition activity will be excluded; Investment information for the company must be available to the Commission from more than
one source; and Geographic Regions:
EDCs: Value Line East Group Electric Utility companies;NGDCs: Value Line Investment Survey’s Natural Gas Utility industry group companies;Water/Waste water: Value Line Investment Survey’s Water Utility industry group companies.
The barometer group companies are reviewed by staff on a quarterly basis and make any changes to these companies based upon the criteria above.
ROE Calculations
The Commission consistently uses the DCF model to determine the appropriate cost of equity for utilities. In this report, the DSIC ROE is calculated using two DCF models. TUS uses the following formula to calculate the current dividend DCF: K = D1/P0 + G TUS uses the following formula to calculate the 52-week average dividend DCF: K = D1/Pa + G
Definitions:K = Cost of equityD1 = Dividend expected during the year
= D0 + ½gD0 = Latest indicated dividend, obtained from Yahoo! Financeg = Expected 5-year dividend growth rate of barometer group
obtained from Value Line Investment Survey.P0 = Current price of the stock, obtained from Yahoo! FinancePa = Average of high and low stock price over the latest 52-week
period, obtained from Yahoo! FinanceG = Average of 5-year expected earnings growth rate forecasts obtained from Value
Line Investment Survey, Zacks Investment Survey, Yahoo! Finance, Morningstar and/or Reuters.
17

Attachment E
The CAPM uses the yield of a risk-free interest bearing obligation plus a rate of return premium that is proportional to the systematic risk of an investment.
TUS uses the following formula to calculate CAPM: K = β(Rm-Rf)
Three components are necessary to calculate the CAPM cost of equity:
β = Beta, a measure of systematic risk for each stock
Rf = The risk-free rate of return, 10-year U.S. Treasury yields are used for Rf . Yields are taken from the previous two quarters and forecasted next four quarters.
Rm = Total return of the equity market as determined by the SBBI Yearbook
The Commission determines the ROE used for DSIC purposes based on the range of reasonableness from the DCF barometer group data, CAPM data, recent ROEs adjudicated by the Commission, and informed judgment.
18
Attachment F
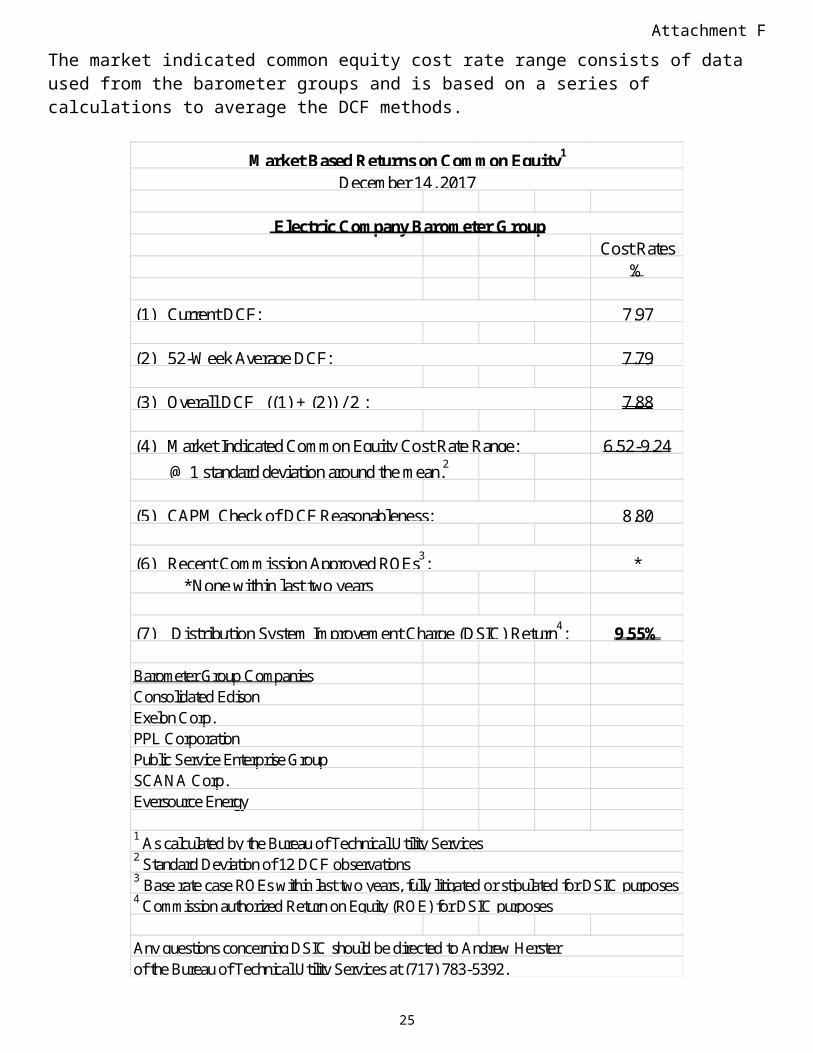
The market indicated common equity cost rate range consists of data used from the barometer groups and is based on a series of calculations to average the DCF methods.
Electric Company Barometer GroupCost Rates
%
7.97
7.79
7.88
6.52-9.24 @ 1 standard deviation around the mean.2
8.80
**None within last two years
9.55%
Barometer Group CompaniesConsolidated EdisonExelon Corp.PPL CorporationPublic Service Enterprise GroupSCANA Corp.Eversource Energy
(7) Distribution System Improvement Charge (DSIC) Return4:
of the Bureau of Technical Utility Services at (717) 783-5392.
1 As calculated by the Bureau of Technical Utility Services2 Standard Deviation of 12 DCF observations
Market Based Returns on Common Equity1
December 14, 2017
Any questions concerning DSIC should be directed to Andrew Herster
3 Base rate case ROEs within last two years, fully litigated or stipulated for DSIC purposes 4 Commission authorized Return on Equity (ROE) for DSIC purposes
(1) Current DCF:
(2) 52-Week Average DCF:
(3) Overall DCF ((1) + (2)) / 2 :
(4) Market Indicated Common Equity Cost Rate Range:
(5) CAPM Check of DCF Reasonableness:
(6) Recent Commission Approved ROEs3:
19
Attachment F
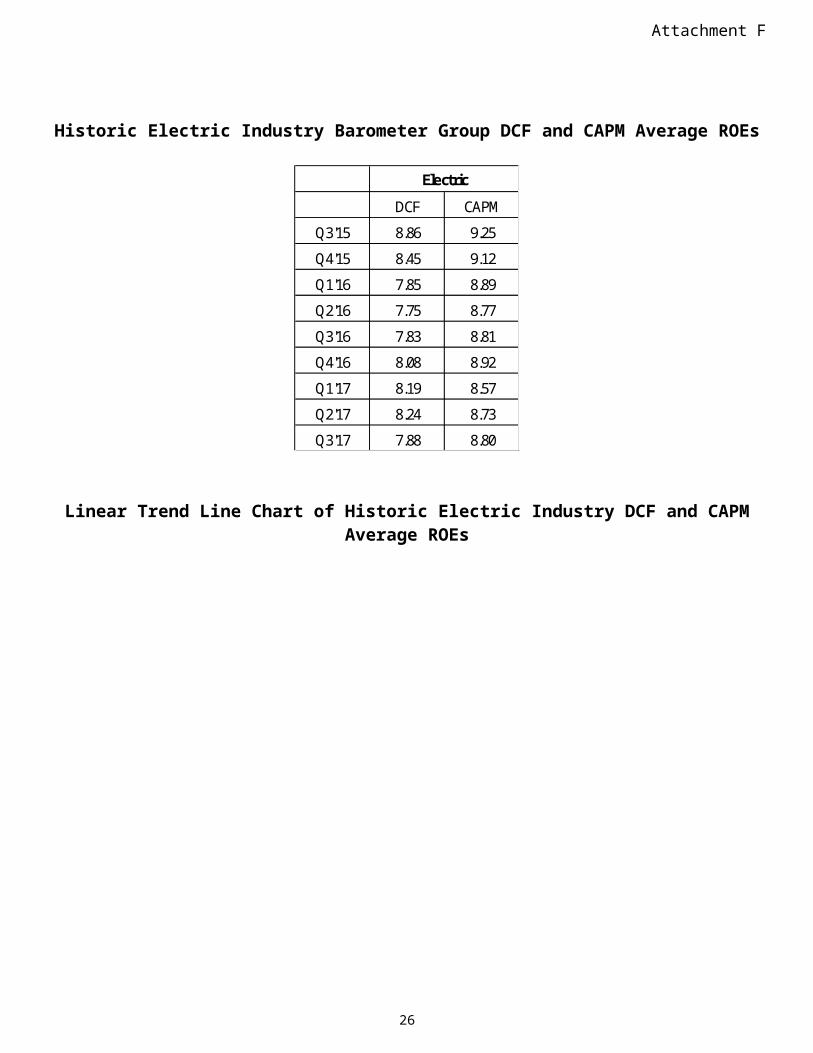
Historic Electric Industry Barometer Group DCF and CAPM Average ROEs
DCF CAPM
Q3'15 8.86 9.25
Q4'15 8.45 9.12
Q1'16 7.85 8.89
Q2'16 7.75 8.77
Q3'16 7.83 8.81
Q4'16 8.08 8.92
Q1'17 8.19 8.57
Q2'17 8.24 8.73
Q3'17 7.88 8.80
Electric
Linear Trend Line Chart of Historic Electric Industry DCF and CAPM Average ROEs
20
Attachment F
Barometer electric companies are used to calculate a current DCF in the first chart. The second chart demonstrates the companies 52 week average DCF. A final average of the two calculations is also shown at the bottom.
Closing Latest Ind. Div.Market Indicated Plus 1/2 Current
Price (Po) Dividend Div. Growth Dividend12/15/2017 Do Rate (D1) Yield(D1/Po) DCF
($) ($) ($) (%) (%)Consolidated Edison 88.24 2.76 2.80 3.17 6.38Exelon Corp. 40.74 1.31 1.35 3.30 7.60PPL Corporation 33.97 1.58 1.60 4.72Public Service Enterprise Group 52.30 1.72 1.76 3.37 6.00SCANA Corp. 44.42 2.45 2.49 5.60 9.76Eversource Energy 64.62 1.90 1.96 3.03 9.04Group Average D1/Po 3.87Group Average G 4.10DCF 7.97
Latest AverageIndicated Dividend
High Low Average (Pa) Dividend (Do) Yield (Do/Pa) DCF($) ($) ($) ($) (%) (%)
Consolidated Edison 89.70 72.13 80.92 2.76 3.41 6.62Exelon Corp. 42.67 33.30 37.99 1.31 3.45 7.75PPL Corporation 40.20 33.22 36.71 1.58 4.30Public Service Enterprise Group 53.28 41.67 47.48 1.72 3.62 6.25SCANA Corp. 74.99 41.15 58.07 2.45 4.22 8.39Eversource Energy 66.15 54.08 60.12 1.90 3.16 9.17Group Average Do / Pa 3.69Group Average G 4.10DCF 7.79
7.88Average of Current and 52-Week
Electric Company Barometer GroupCalculation of a Current Dividend Yie ld
Electric Company Barometer Group52-week Average Dividend Yie ld Calculation
21

Attachment F
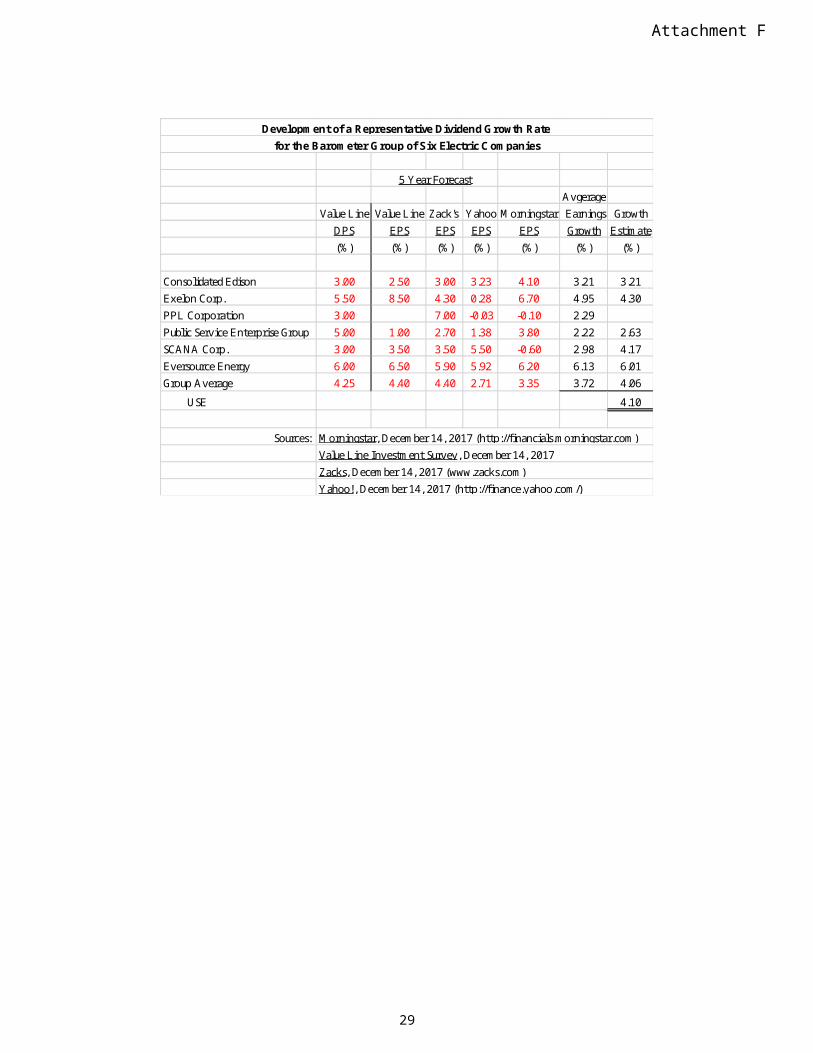
Multiple sources of the Barometer companies projected 5 year Earnings Per Share are used to calculate the Group Average Dividend Growth Estimate.
AvgerageValue Line Value Line Zack's Yahoo Morningstar Earnings Growth
DPS EPS EPS EPS EPS Growth Estimate(%) (%) (%) (%) (%) (%) (%)
Consolidated Edison 3.00 2.50 3.00 3.23 4.10 3.21 3.21Exelon Corp. 5.50 8.50 4.30 0.28 6.70 4.95 4.30PPL Corporation 3.00 7.00 -0.03 -0.10 2.29Public Service Enterprise Group 5.00 1.00 2.70 1.38 3.80 2.22 2.63SCANA Corp. 3.00 3.50 3.50 5.50 -0.60 2.98 4.17Eversource Energy 6.00 6.50 5.90 5.92 6.20 6.13 6.01Group Average 4.25 4.40 4.40 2.71 3.35 3.72 4.06
USE 4.10
Sources:
Development of a Representative Dividend Growth Rate for the Barometer Group of Six Electric Companies
5 Year Forecast
Yahoo!, December 14, 2017 (http://finance.yahoo.com/)Zacks, December 14, 2017 (www.zacks.com)Value Line Investment Survey, December 14, 2017Morningstar, December 14, 2017 (http://financials.morningstar.com)
22

Attachment G
The market indicated common equity cost rate range consists of data used from the barometer groups and is based on a series of calculations to average the DCF methods.
Cost Rates%
9.23
9.30
9.27
8.86-9.67 @ 1 standard deviation around the mean.2
9.44
**None within last two years
9.85%
Barometer Group CompaniesAtmos EnergyNew Jersey Resources Northwest Natural Gas CompanyChesapeake Utilities CorporationSouth Jersey IndustriesNiSource Inc.
Market Based Returns on Common Equity1
Gas Distribution Company Barometer Group
December 14, 2017
Any questions concerning DSIC should be directed to Andrew Herster of the Bureau of Technical Utility Services at (717) 783-5392.
1 As calculated by the Bureau of Technical Utility Services2 Standard Deviation of 12 DCF observations
(1) Current DCF:
(2) 52-Week Average DCF:
(3) Overall DCF ((1) + (2)) / 2 :
(4) Market Indicated Common Equity Cost Rate Range:
(5) CAPM Check of DCF Reasonableness:
(6) Recent Commission Approved ROEs3:
(7) Distribution System Improvement Charge (DSIC) Return4:
4 Commission authorized Return on Equity (ROE) for DSIC purposes
3 Base rate case ROEs within last two years, fully litigated or stipulated for DSIC
23

Attachment G
Historic Gas Industry DCF and CAPM Average ROEs
DCF CAPM
Q3'15 9.11 9.49
Q4'15 8.74 9.54
Q1'16 8.96 9.32
Q2'16 9.44 9.28
Q3'16 9.39 9.39
Q4'16 8.89 9.52
Q1'17 9.37 9.37
Q2'17 9.42 9.53
Q3'17 9.27 9.44
Gas
Linear Trend Line Graph of Historic Gas Industry DCF and CAPM Average ROEs
24
Attachment G
Barometer gas companies are used to calculate a current DCF in the first chart. The second chart demonstrates the companies 52 week average DCF. A final average of the two calculations is also shown at the bottom.
Closing Latest Ind. Div.Market Indicated Plus 1/2 Current
Price (Po) Dividend Div. Growth Dividend12/15/2017 Do Rate (D1) Yield(D1/Po) DCF
($) ($) ($) (%) (%)Atmos Energy 89.37 1.94 2.00 2.24 8.99New Jersey Resources 40.95 1.09 1.11 2.71 8.71Northwest Natural Gas 65.05 1.89 1.90 2.92 9.92Chesapeake Utilit ies Corporation 81.65 1.30 1.34 1.64 9.19South Jersey Industries 32.34 1.12 1.14 3.53 9.28NiSource Inc. 26.51 0.70 0.72 2.73 9.38
Group Average D1 / Po 2.63Group Average G 6.60DCF 9.23
Latest AverageIndicated Dividend
High Low Average (Pa) Dividend (D1) Yield (D1/Pa) DCF($) ($) ($) ($) (%) (%)
Atmos Energy 93.56 72.54 83.05 2.00 2.41 9.16New Jersey Resources 45.45 33.70 39.58 1.11 2.80 8.80Northwest Natural Gas 69.50 56.53 63.02 1.90 3.01 10.01Chesapeake Utilit ies Corporation 86.35 63.00 74.68 1.34 1.79 9.34South Jersey Industries 38.40 31.33 34.87 1.14 3.28 9.03NiSource Inc. 27.76 21.65 24.71 0.72 2.93 9.58
Group Average Do / Pa 2.70Group Average G 6.60DCF 9.30
9.27Average of Current and 52-Week
Gas Company Barometer GroupCalculation of a Current Dividend Yie ld
Gas Company Barometer Group52-week Average Dividend Yie ld Calculation
25
Attachment G
Multiple sources of the Barometer companies projected 5 year Earnings Per Share are used to calculate the Group Average Dividend Growth Estimate.
AvgerageValue Line Value Line Zack's Yahoo Morningstar Earnings Growth
DPS EPS EPS EPS EPS Growth Estimate(%) (%) (%) (%) (%) (%) (%)
Atmos Energy 6.50 6.00 7.00 6.50 7.50 6.75 6.75New Jersey Resources 3.50 2.00 6.00 6.00 8.80 5.70 6.00Northwest Natural Gas 1.00 7.00 4.50 4.00 5.17 7.00Chesapeake Utilities Corporation 5.50 8.00 6.00 8.10 8.10 7.55 7.55South Jersey Industries 4.00 5.50 10.00 6.00 10.00 7.88 5.75NiSource Inc. 6.50 5.50 5.90 7.70 7.50 6.65 6.65
Group Average 4.50 5.67 6.57 6.38 8.38 6.62 6.62 USE 6.60
Sources:
Development of a Representative Dividend Growth Rate for the Barometer Group of Gas Companies
5 Yr Forecast
Morningstar, December 14, 2017 (ht tp://financials.morningstar.com)Value Line Investment Survey, December 14, 2017Zacks, December 14, 2017 (www.zacks.com)Yahoo!, December 14, 2017 (ht tp://finance.yahoo.com/)
26

Attachment H
The market indicated common equity cost rate range consists of data used from the barometer groups and is based on a series of calculations to average the DCF methods.
Cost Rates%
8.61
8.73
8.67
7.61-9.73 @ 1 standard deviation around the mean.2
9.55
**None within last two years
9.70%
Barometer Group CompaniesAmerican States Water CompanyConnecticut Water Service, Inc.Middlesex Water CompanyCalifornia Water Service GroupSJW CorporationAqua America , Inc.American Water Works Co., Inc.
(4) Market Indicated Common Equity Cost Rate Range
(5) CAPM Check of DCF Reasonableness
(6) Recent Commission Approved ROEs3:
Market Based Returns on Common Equity ¹December 14, 2017
(1) Current DCF
(2) 52-Week Average DCF
(3) Average DCF
Water Company Barometer Group
of the Bureau of Technical Utility Services at (717) 783-5392.
1 As calculated by the Bureau of Technical Utility Services2 Standard Deviation of 14 DCF observations
Any questions concerning DSIC should be directed to Andrew Herster
3 ROEs from base rate cases within last two years, fully litigated or stipulated for DSIC purposes
(7) Distribution System Improvement Charge (DSIC) Return4:
4 Commission authorized Return on Equity (ROE) for DSIC purposes
27

Attachment H
Historic Water Industry DCF and CAPM Average ROEs
DCF CAPM
Q3'15 8.39 9.38
Q4'15 8.79 9.27
Q1'16 8.28 9.21
Q2'16 9.00 8.95
Q3'16 8.92 9.28
Q4'16 9.65 9.30
Q1'17 8.82 9.28
Q2'17 8.96 9.21
Q3"17 8.67 9.55
Water
Linear Trend Line Chart of Historic Water Industry DCF and CAPM Average ROEs
28
Attachment H
Barometer water companies are used to calculate a current DCF in the first chart. The second chart demonstrates the companies 52 week average DCF. A final average of the two calculations is also shown at the bottom.
Closing Latest Ind. Div.Market Indicated Plus 1/2 Current
Price (Po) Dividend Div. Growth Dividend12/15/2017 Do Rate (D1) Yield(D1/Po) Growth DCF
($) ($) ($) (%) (%) (%)American States Water Company 56.68 1.02 1.06 1.87 6.50 8.37Connecticut Water Service, Inc. 61.00 1.19 1.22 1.99 5.63 7.62Middlesex Water Company 41.55 0.90 0.92 2.21 8.50 10.71California Water Service Group 43.70 0.72 0.74 1.70 7.50 9.20SJW Corporat ion 63.94 0.87 0.90 1.40 4.50 5.90Aqua America, Inc. 38.14 0.82 0.86 2.25 6.13 8.37American Water Works Co., Inc. 90.82 1.66 1.74 1.92 7.82 9.74
Group Average D1/Po 1.91Group Average G 6.70DCF 8.61
Latest AverageIndicated Dividend
High Low Average (Pa) Dividend (Do) Yield (Do/Pa) Growth DCF($) ($) ($) ($) (%) (%) (%)
American States Water Company 58.11 41.14 49.63 1.02 2.06 6.50 8.56Connecticut Water Service, Inc. 65.04 50.74 57.89 1.19 2.06 5.63 7.68Middlesex Water Company 46.74 32.23 39.49 0.90 2.28 8.50 10.78California Water Service Group 46.15 32.45 39.30 0.72 1.83 7.50 9.33SJW Corporat ion 69.29 45.39 57.34 0.87 1.52 4.50 6.02Aqua America , Inc. 38.44 29.41 33.93 0.82 2.42 6.13 8.54American Water Works Co., Inc. 92.37 69.96 81.17 1.66 2.05 7.82 9.86AverageGroup Average Do / Pa 2.03Group Average G 6.70DCF 8.73
8.67Average of Current and 52-Week
Calculation of a Current Dividend Yie ld
52-week High-Low Dividend Yie ld Calculation
Water Company Barometer Group
29

Attachment H
Multiple sources of the Barometer companies projected 5 year Earnings Per Share are used to calculate the Group Average Dividend Growth Estimate.
AvgerageValue Line Value Line Zacks Yahoo Reuters Earnings Growth
DPS EPS EPS EPS EPS Growth Estimate(%) (%) (%) (%) (%) (%) (%)
American States Water Company 7.50 6.50 4.00 4.00 4.00 4.63 6.50Connecticut Water Service, Inc. 4.50 4.50 6.00 6.00 6.00 5.63 5.63Middlesex Water Company 4.50 8.50 2.70 5.60 8.50California Water Service Group 6.50 9.00 6.00 9.80 8.27 7.50SJW Corporation 6.00 4.50 14.00 9.25 4.50Aqua America, Inc. 9.00 7.00 5.50 5.00 7.00 6.13 6.13American Water Works Co., Inc. 10.00 8.50 7.50 7.45 9.30 8.19 7.82
Group Average 6.86 6.93 5.80 6.99 6.58 6.81 6.65 USE 6.70
Sources:
5 Yr Forecast
Development of a Representative Dividend Growth Rate for the Barometer Group of Water Companies
Reuters, December 14, 2017(www.reuters.com/finance/stocks)Value Line Investment Survey, December 14, 2017Zacks, December 14, 2017 (www.zacks.com)Yahoo!, December 14, 2017 (http://finance.yahoo.com/)
30