fy2015 annual report economic consequence analysis...
TRANSCRIPT
3710 McClintock Avenue, RTH314 ~ Los Angeles, CA 90089-2902 ~ (213) 740-5514 ~ create.usc.edu
FY2015 Annual Report
Economic Consequence Analysis Tool (E-CAT)
PI: Adam Rose, CREATE, USC
Research Team: F. Prager, Z. Chen, D. Wei, N. Heatwole, E. Warren, CREATE, USC
S. Chatterjee, PNNL
Contents 1. Executive Summary ............................................................................................................................................. 1 2. Research and Research Transition Accomplishments .......................................................................................... 3 2.1. Research Results ............................................................................................................................................... 3 2.2. Research Transition .......................................................................................................................................... 4 2.3. Publications, Reports and Presentations ........................................................................................................... 9 2.4. Models, Databases, Software Tools, Invention Disclosures and Patents ........................................................ 12 3. Education Programs ........................................................................................................................................... 12 4. Outreach Programs ............................................................................................................................................. 13
1. Executive Summary
The purpose of this project is to develop and transition a methodology for rapidly obtaining
approximate estimates of the economic consequences from the nearly 40 threats listed in the
Homeland Security National Risk Characterization (HSNRC) Risk Register. The tool is
intended for use by various DHS components and offices to obtain estimates almost instantly. It
is programmed in Excel and Visual Basic for Applications (VBA) to facilitate its use. This tool is
called E-CAT (Economic Consequence Analysis Tool) and accounts for the cumulative direct
and indirect impacts (including resilience and behavioral factors that significantly affect base
estimates) on the national economy from terrorism, natural disasters, and technological
accidents. E-CAT is intended to be a major step toward advancing the current state of economic
consequence analysis (ECA) across DHS, and also contributing to and developing interest in
further research into fast turnaround approaches.
The essence of the methodology involves running numerous simulations in a computable general
equilibrium (CGE) model for each threat, yielding synthetic data for the estimation of a single
regression equation based on the identification of key explanatory variables (threat
characteristics and background conditions). This transforms the results of a complex model,
which is beyond the reach of most users, into a “reduced form” model that is readily
comprehensible. We have built functionality into E-CAT so that its users can switch various
consequence categories on and off in order to create customized profiles of the economic
consequences of numerous risk events. E-CAT incorporates uncertainty on both the input and
output side in the course of the analysis. A premium has been placed on making E-CAT user
friendly and transparent.
This project is a major milestone in CREATE’s 10-year progression of research on ECA and
leverages its recent research for the Office of Health Administration National Biosurveillance
Integration Center (OHA/NBIC) and the Defense Nuclear Detection Office (DNDO). It builds
upon recent research for DHS on developing a reduced form modeling for selected threats and
developing a user-friendly spreadsheet program to facilitate the performance of ECA. It also

Rose, Economic Consequence Analysis Tool (E-CAT)
2
incorporates insights from the completion of nearly 2 dozen ECA case studies, including
definitive estimate of the economic impacts of the September 11 World Trade Center attack and
simulation studies of a dirty bomb attack on the Los Angeles financial district, the shutdown of a
major port complex in Texas, and a catastrophic Southern California earthquake, among others.
In the course of developing E-CAT, the research team made several innovations, some of which
overlapped with related studies to be discussed below. We developed an “Enumeration Table”
of various types of economic impacts that are potentially associated with each threat. This
provides a checklist that helps ensure that each ECA’s comprehensive. We also updated and
refined the CREATE US CGE Model for the purpose of the analysis. We developed an approach
and the computer code for running hundreds of Monte Carlo simulations of the economic
consequences of individual threats. We incorporated uncertainty into the analysis in relation to
both inputs and results. We are also in the process of completing a sophisticated validation
analysis using several techniques. Finally, we developed a user-friendly interface in Excel/VBA
that will facilitate widespread use.
We have currently incorporated 10 major threats (including, nuclear attack, earthquakes,
pandemic influenza, floods, and transportation system disruptions among others) into E-CAT.
We plan to develop another 20 threats once we have completed our assessment of feedback from
potential users. In addition to developing the software, our analyses have provided new insights
into the importance of various explanatory factors, especially resilience and behavioral linkages,
in the bottom-line consequences of individual threats.
E-CAT was originally intended for primary use by the DHS Policy Office. However, it is also an
ideal tool for more widespread use by those who need a quick turn-round capability to compare
the economic consequences of many threats for decisions relating to resource allocation for
mitigation and resilience and the disbursement of post-disaster assistance. Interest in the tool has
been expressed by FEMA, US Coast Guard, and Los Angeles Mayor’s Office. CREATE will
offer a short course for DHS staff, as well as other interested parties, and help advance the
process of harmonization of modeling of economic impacts for various risk assessments. The
Science and Technology (S&T) Office of University Programs (OUP) will help tailor and shape
the course materials for offering it to a broad set of risk and consequence analyst communities.
E-CAT is ideal for use risk assessments and risk management decisions. It is intended to be easy
to use, quick, reasonably accurate, and transparent. It also incorporates functionality such that
end users can create tailor-made profiles of economic consequences of a broad range of threats,
with associated measures of uncertainty. Recently, E-CAT received CREATE’s Transition
Product of the Year Award.
Research on E-CAT has overlapped with several other current and recent projects. These include
DHS OHA/NBIC on broadening the range of impacts it considers (Rose et al., 2015) and the
Defense Nuclear Detection Office (DNDO) on analyzing the duration and time-path of
radiological/nuclear events (Heatwole et al., 2014). It builds upon prior work on developing a
reduced form model to predict the economic consequences of earthquakes (Heatwole and Rose,
2013) and reduced form modeling for DNDO. It also builds on the CREATE Urban Commerce
and Security (UCASS) Project as well, where CREATE developed a user-friendly spreadsheet
program to facilitate the performance of ECA (Rose et al., 2014).
Rose, Economic Consequence Analysis Tool (E-CAT)
3
2. Research and Research Transition Accomplishments
2.1. Research Results
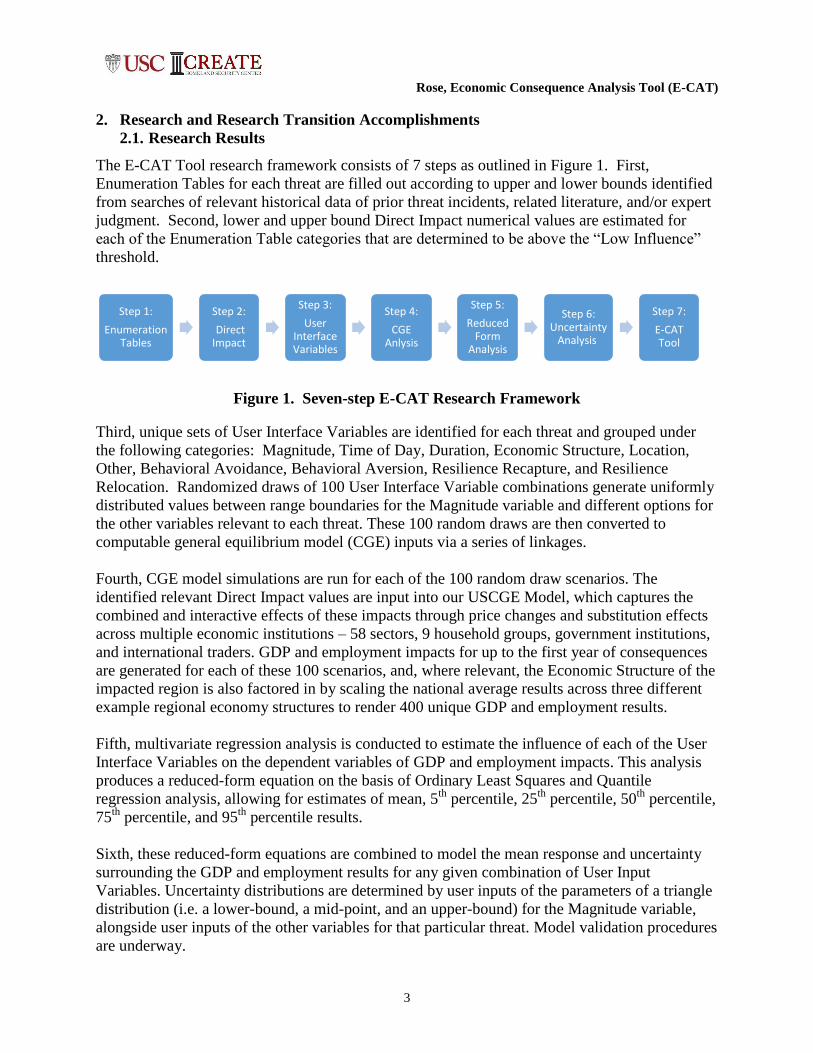
The E-CAT Tool research framework consists of 7 steps as outlined in Figure 1. First,
Enumeration Tables for each threat are filled out according to upper and lower bounds identified
from searches of relevant historical data of prior threat incidents, related literature, and/or expert
judgment. Second, lower and upper bound Direct Impact numerical values are estimated for
each of the Enumeration Table categories that are determined to be above the “Low Influence”
threshold.
Figure 1. Seven-step E-CAT Research Framework
Third, unique sets of User Interface Variables are identified for each threat and grouped under
the following categories: Magnitude, Time of Day, Duration, Economic Structure, Location,
Other, Behavioral Avoidance, Behavioral Aversion, Resilience Recapture, and Resilience
Relocation. Randomized draws of 100 User Interface Variable combinations generate uniformly
distributed values between range boundaries for the Magnitude variable and different options for
the other variables relevant to each threat. These 100 random draws are then converted to
computable general equilibrium model (CGE) inputs via a series of linkages.
Fourth, CGE model simulations are run for each of the 100 random draw scenarios. The
identified relevant Direct Impact values are input into our USCGE Model, which captures the
combined and interactive effects of these impacts through price changes and substitution effects
across multiple economic institutions – 58 sectors, 9 household groups, government institutions,
and international traders. GDP and employment impacts for up to the first year of consequences
are generated for each of these 100 scenarios, and, where relevant, the Economic Structure of the
impacted region is also factored in by scaling the national average results across three different
example regional economy structures to render 400 unique GDP and employment results.
Fifth, multivariate regression analysis is conducted to estimate the influence of each of the User
Interface Variables on the dependent variables of GDP and employment impacts. This analysis
produces a reduced-form equation on the basis of Ordinary Least Squares and Quantile
regression analysis, allowing for estimates of mean, 5th
percentile, 25th
percentile, 50th
percentile,
75th
percentile, and 95th
percentile results.
Sixth, these reduced-form equations are combined to model the mean response and uncertainty
surrounding the GDP and employment results for any given combination of User Input
Variables. Uncertainty distributions are determined by user inputs of the parameters of a triangle
distribution (i.e. a lower-bound, a mid-point, and an upper-bound) for the Magnitude variable,
alongside user inputs of the other variables for that particular threat. Model validation procedures
are underway.
Step 1:
Enumeration Tables
Step 2:
Direct Impact
Step 3:
User Interface Variables
Step 4:
CGE Anlysis
Step 5:
Reduced Form
Analysis
Step 6: Uncertainty
Analysis
Step 7:
E-CAT Tool

Rose, Economic Consequence Analysis Tool (E-CAT)
4
Seventh, the coefficients from the reduced-form equations are input into the E-CAT Tool. The
Tool is designed to be a user-friendly interface with which to explore the deterministic and
probabilistic results of the reduced-form analysis of the CGE modeling for each threat. Users
first select a threat and the level of detail for the results they would like. The resulting E-CAT
Tool User Interface provides an Input Area, whereby the user selects values for each of the
relevant User Input Variables, and an Output Area. Economic impact results for GDP and
employment are presented in both tabular and graphical formats and with respect to both point
estimates and distributions.
2.2. Research Transition
Estimates of economic consequences of threats to the US are an integral part of risk assessment
and risk management decisions. Essentially, the benefits of various mitigation and resilience
strategies are the consequences that they prevent. Until a few years ago, most economic
consequence analysis was performed using the simplistic approach that only included ordinary
direct effects (death/injuries, property damage, and direct business interruption), and then applied
simple multiplier models to estimate indirect effects. CREATE’s research has shown that other
major considerations have a large bearing on bottom-line economic consequence analysis results
(Rose, 2009; Rose, 2015).
Recently, there is a growing awareness that this broader range of economic consequences needs
to be considered. These include behavioral reactions (see, e.g., Giesecke et al., 2012) and
activities associated with decontamination or remediation (see, e.g., Baker et al., 2008; Heatwole
et al., 2015), which can increase the cost of disasters considerably. In addition, it is important to
take into account resilience, which can dampen losses considerably (see, e.g., Rose, 2009b).
These important considerations have been incorporated into the comprehensive Economic
Consequence and Analysis Framework developed at CREATE (see Figure 2) (Rose, 2009a;
Rose, 2015).
Major initiatives are underway at DHS and other federal agencies to broaden the scope of ECA.
This includes research done by the Rose Research Team on broadening the range of impacts
considered by NBIC (Rose et al., 2015), research by the Team, in conjunction with the research
team of CREATE affiliate Peter Dixon, on incorporating some of these aspects in DNDO
analyses (Heatwole et al., 2014), broadening the range of impacts considered by NBIC (Rose et
al., 2015), and a new project to begin this year headed by Peter Dixon developing the next
generation of Terrorism Risk Analysis (TRA) for cam/bio/rad/nuke threats. In addition, Adam
Rose has been appointed to an EPA Scientific Advisory Board Panel on “Economy wide
Impacts,” which addresses prospects for incorporating some of these broader impacts into rule-
making in relation to air pollution issues.

Rose, Economic Consequence Analysis Tool (E-CAT)
5
Figure 2. Economic Assessment Framework Overview
Studies have shown that these broader factors can have sizable influence on the bottom-line. For
example, Rose et al., (2009) found that it’s resilience to relocation in the aftermath of the World
Trade Center attacks reduce potential business interruption (BI) losses by 72%. At the same time,
the almost two-year reduction in airline travel and related tourism following the attack was
responsible for more than 80% of the remaining BI losses. Rose (2015) contrasts the sizeable
relative differences in the role of resilience and behavioral responses in a study of six major bio
threats. The results indicate that rules of thumb cannot be applied to the estimation of total
economic consequences, and that a formal modeling approach is needed.
At the same time, the majority of CREATE’s research on ECA has involved the use of
sophisticated models, such as computable general equilibrium, consisting of thousands of
equations that are beyond the reach of potential users. The E-CAT Tool has transformed this
complexity into a reduced-form regression equation for each threat, which is transparent to wide
range of users.
Although E-CAT was originally formulated to respond to the needs of the DHS Policy Office, its
overall design and user-friendly interface makes it accessible to broad range of users, including
other federal agencies, state and local government emergency management, and industry. Any
analyst or policymaker that requires a rapid estimate of a single or wide variety of threats can
readily use E-CAT to obtain bottom-line estimates. These can be combined with probabilities of
occurrence in risk assessment and with mitigation costs in a benefit-cost analysis. Potential
issues that can be addressed in the areas of risk assessment and risk management include:
comparison of relative risks, allocation of resources for mitigation and resilience across
numerous threats, emergency response allocations, and the disbursement of post-disaster
assistance.
The E-CAT User Interface The tool is based on Excel and Visual Basic for Application (VBA).
Three different economic impact options are developed for each type of threat, including a point
Direct Remediation
Costs
Resilience Adjustments
Ordinary Indirect Economic Impacts
Behavioral Linkages
Total Economic Impacts
Target Specific Economic Impacts
Disaster Event Scenario
Loss of Life
Mitigation Costs Mitigation Costs
Spillovers Effects
Rose, Economic Consequence Analysis Tool (E-CAT)
6
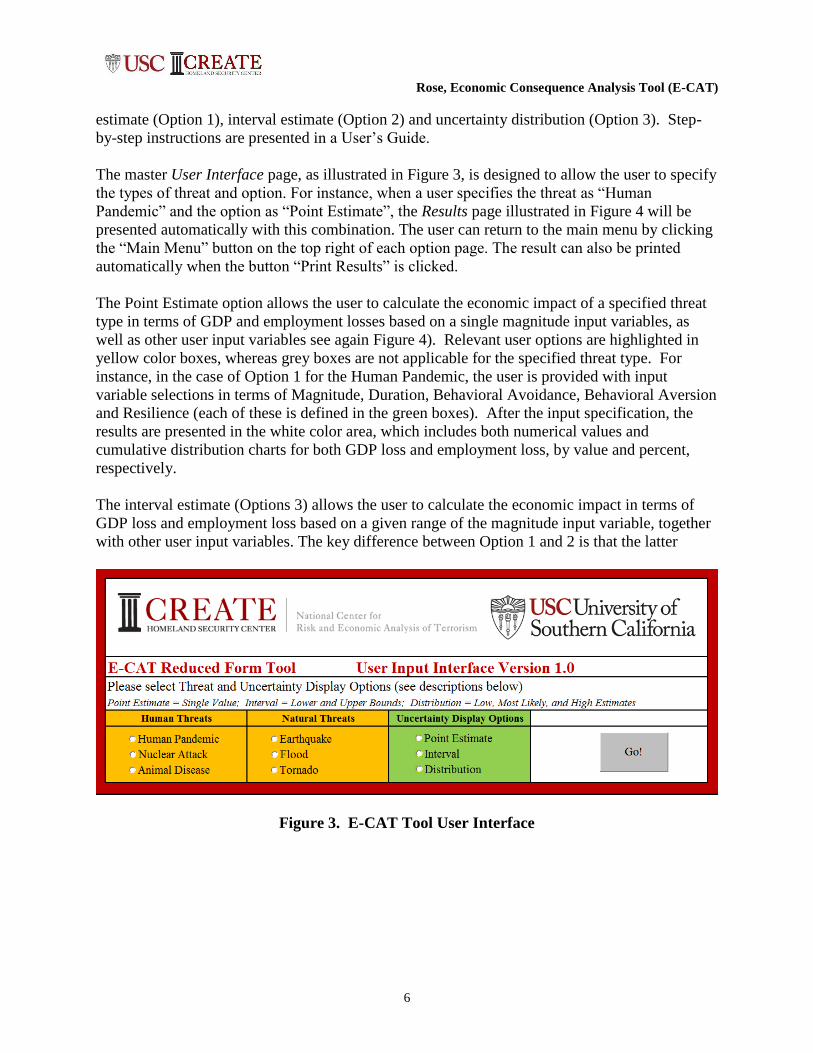
estimate (Option 1), interval estimate (Option 2) and uncertainty distribution (Option 3). Step-
by-step instructions are presented in a User’s Guide.
The master User Interface page, as illustrated in Figure 3, is designed to allow the user to specify
the types of threat and option. For instance, when a user specifies the threat as “Human
Pandemic” and the option as “Point Estimate”, the Results page illustrated in Figure 4 will be
presented automatically with this combination. The user can return to the main menu by clicking
the “Main Menu” button on the top right of each option page. The result can also be printed
automatically when the button “Print Results” is clicked.
The Point Estimate option allows the user to calculate the economic impact of a specified threat
type in terms of GDP and employment losses based on a single magnitude input variables, as
well as other user input variables see again Figure 4). Relevant user options are highlighted in
yellow color boxes, whereas grey boxes are not applicable for the specified threat type. For
instance, in the case of Option 1 for the Human Pandemic, the user is provided with input
variable selections in terms of Magnitude, Duration, Behavioral Avoidance, Behavioral Aversion
and Resilience (each of these is defined in the green boxes). After the input specification, the
results are presented in the white color area, which includes both numerical values and
cumulative distribution charts for both GDP loss and employment loss, by value and percent,
respectively.
The interval estimate (Options 3) allows the user to calculate the economic impact in terms of
GDP loss and employment loss based on a given range of the magnitude input variable, together
with other user input variables. The key difference between Option 1 and 2 is that the latter
Figure 3. E-CAT Tool User Interface

Rose, Economic Consequence Analysis Tool (E-CAT)
7
Figure 4. E-CAT Tool Sample Results for Human Pandemic
allows the user to provide both a lower bound and an upper bound magnitude input, and the
economic impact of both value are presented in the results area automatically. The uncertainty
distribution estimate (Option 3) allows the user to calculate the economic impact in terms of
GDP and employment losses based on the triangular distribution of the magnitude input
variables, together with other user input variables. The user is requested to specify lower, middle
and upper bounds of the magnitude values, as well as duration, avoidance, aversion and
resilience. The economic impact in terms of GDP loss and employment loss are also displayed
automatically in the results area. In addition, the cumulative frequency distribution charts and the
relative frequency distribution charts of the mean values of GDP loss and employment loss are
presented.
E-CAT is based on a careful assessment of direct impact drivers, computable general equilibrium
(CGE) analysis to estimate indirect impacts, and reduced-form regression analysis to translate
the complex analysis into a compact form that can yield quick-turn results under various
assumptions relating to background conditions and the direct drivers, under various
representations of uncertainty. Uncertain threat inputs are quantified and propagated through the
analysis process resulting in appropriate representations of economic consequence uncertainties
as output. E-CAT accounts for the cumulative direct and indirect impacts (including resilience
and behavioral factors that significantly affect base estimates) on the national economy for
numerous threats, including terrorism, natural disasters, and technological accidents.
E-CAT is being considered for use by TSA, FEMA, the US Coast Guard, and the California
Office of Emergency Services. A supplement to FY 16 funding for the Rose Research Team has
been provided by the Coast Guard to refine E-CAT to evaluate maritime cyber threats. We can
tailor E-CAT for other specialized users as well.

Rose, Economic Consequence Analysis Tool (E-CAT)
8
References
Baker, M., Jr., Inc. 2008. Municipal Water Distribution System Security Study: Recommendations for
Science and Technology Investments, Final Report to the U.S. Department of Homeland Security,
Washington, DC.
Geisecke, J., W. Burns, A. Barrett, E. Bayrak, A. Rose, P. Slovic and M. Suher. 2012. "Assessment of the
Regional Economic Impacts of Catastrophic Events: A CGE Analysis of Resource Loss and Behavioral
Effects of a Radiological Dispersion Device Attack Scenario," Risk Analysis 32: 583-600.
Heatwole, N, and A. Rose (2013) “A Reduced-Form Rapid Economic Consequence Estimating Model:
Application to Property Damage from U.S. Earthquakes.” International Journal of Disaster Risk Science,
4(1): 20-32.
Heatwole, N., A. Rose, P. Dixon, M. Rimmer, G. Wittwer, and D. Wei. 2014. Modeling the Temporal
and Spatial Consequences of Nuclear Terrorism Events. Report to the U.S. Domestic Nuclear Detection
Office (DNDO), National Center for Risk and Economic Analysis of Terrorism Events (CREATE),
University of Southern California.
Rose, A. 2009a. "A Framework for Analyzing and Estimating the Total Economic Impacts of a Terrorist
Attack and Natural Disaster,” Journal of Homeland Security and Emergency Management 6: Article 4.
Rose, A. 2009b. Economic Resilience to Disasters, Community and Regional Resilience Institute Report
No. 8, Oak Ridge National Laboratory, Oak Ridge, TN.
Rose, A. 2015. Macroeconomic Consequences of Terrorist Attacks: Estimation for the Analysis of
Policies and Rules," in C. Mansfield and V.K. Smith (eds.), Benefit Transfer for the Analysis of DHS
Policies and Rules, Cheltenham, UK: Edward Elgar.
Rose, A., M. Avetisyan, and S. Chatterjee. 2014. “A Framework for Analyzing the Economic Tradeoffs
between Urban Commerce and Security,” Risk Analysis 34(5): 1554-79.
Rose, A., B. Lee, G. Oladosu, and G.R. Beeler Asay. 2009. “The Economic Impacts of the September
Terrorist Attacks: A Computable General Equilibrium Analysis,” Peace Economics, Peace Science, and
Public Policy, 15(2): Article 4.
Rose, A., F. Prager, D. Wei, and S. Lahri. 2015. Broadening Economic Modeling for Biosurveillance
Analysis. Final Report to the National Biosurveillance Integration Center (NBIC), National Center for
Risk and Economic Analysis of Terrorism Events (CREATE), University of Southern California.

Rose, Economic Consequence Analysis Tool (E-CAT)
9
2.3. Publications, Reports and Presentations
CREATE PUBLICATIONS
Refe
rre
d
No
t R
efe
rred
PD
F
Sen
t to
CR
EA
TE
Perm
issi
on
to
Pu
bli
sh
from
Co
pyrig
ht
Ho
lder?
Rose, Adam – University of Southern California – CREATE
1. Rose, A. and C. Huyck. 2015. “Improving Catastrophe Modeling
for Business Interruption Insurance Needs,” Risk Analysis,
forthcoming.
X
2. Prager, F., A. Rose, D. Wei, B. Roberts, and C. Baschnagel.
2015. “Economy-wide Impacts of Reduced Wait Times at U.S.
International Airports,” Research in Transportation Business and
Management, forthcoming.
X X
3. Sue Wing, I. A. Rose, D. Wei and A. Wein. 2015. “Impacts of
the USGS ARkStorm Scenario on the California Economy,”
Natural Hazards Review, forthcoming.
X X
4. Avetisyan, M., N. Heatwole, A. Rose, and B. Roberts. 2015.
“Competitiveness and Macroeconomic Impacts of Reduced Wait
Times at U.S. Land Freight Border Crossings,” Transportation
Research A, 78: 84–101.
X X X
5. Rose, A., M. Avetisyan, and S. Chatterjee. 2014. “A Framework
for Analyzing the Economic Tradeoffs between Urban
Commerce and Security,” Risk Analysis 34(5): 1554-79.
X X X
6. Rose, A. 2015. “Economic Resilience to Terrorism and Natural
Disasters,” in A. Abbas, M. Tambe and D. von Winterfeldt (eds.),
CREATE Handbook on Decision and Risk Analysis of Terrorism,
forthcoming.
X
7. Dixon, P., M. Rimmer and G. Wittwer, A. Rose and N.
Heatwole. 2015. “Economic Consequences of Terrorism and
Natural Disasters: The Computable General Equilibrium
Approach,” in A. Abbas, M. Tambe and D. von Winterfeldt
(eds.), CREATE Handbook on Decision and Risk Analysis of
Terrorism, forthcoming.
X
8. Roberts, B., A. Rose, N. Heatwole, D. Wei, M. Avetisyan, F.
Prager, C. Baschnagel, and I. Maya. 2015.”Economic Impacts of
Changes in Wait Times at U.S. Ports of Entry,” in A. Abbas, M.
Tambe and D. von Winterfeldt (eds.), CREATE Handbook on
Decision and Risk Analysis of Terrorism, forthcoming.
X
9. Rose, A. 2015. “Economic Resilience to Disasters, in B. Ayyub
(ed.), Economics of Community Disaster Resilience, National
X

Rose, Economic Consequence Analysis Tool (E-CAT)
10
CREATE PUBLICATIONS
Refe
rre
d
No
t R
efe
rred
PD
F
Sen
t to
CR
EA
TE
Perm
issi
on
to
Pu
bli
sh
from
Co
pyrig
ht
Ho
lder?
Institute of Standards and Technology, Gaithersburg, MD,
forthcoming.
10. Rose, A. 2015. “Macroeconomic Consequences of Terrorist
Attacks: Estimation for the Analysis of Policies and Rules," in
C. Mansfield and V.K, Smith (eds.), Benefit Transfer for the
Analysis of DHS Policies and Rules, Cheltenham, UK: Edward
Elgar, pp. 172-201.
X X X
11. Geisecke, J., W. Burns, A. Rose, A. Barrett, and M. Griffith.
“Economic Consequences of a Chlorine Terrorist Attack in the
Los Angeles Financial District: Regional Dynamics under
Adverse Physical and Behavioral Shocks,” in P. Nijkamp et al.
Regional Science Matters: Studies Dedicated to Walter Isard,
Heidelberg, Germany: Springer, pp. 319-50.
X X X
12. Rose, A. 2015. Private Sector Co-Benefits of Disaster Risk
Management. Final report to the World Bank.
X
13. Rose, A., F. Prager, Z. Chen and S. Chatterjee. 2015. Economic
Consequence Analysis Tool (E-CAT). Final Report to DHS,
CREATE, USC, Los Angeles, CA.
X X
14. Rose, A., F. Prager, D. Wei, and S. Lahri. 2015. Broadening
Economic Modeling for Biosurveillance Analysis, Final Report to
the National Biosurveillance Integration Center, CREATE, USC.
X X
15. Heatwole, N., A. Rose, D. Wei, P. Dixon et al. Modeling the
Temporal and Spatial Consequences of Nuclear Terrorism
Events, final report to the Domestic Nuclear Detection Office
(DNDO), CREATE, USC, November 2014.
X X
16. Rose, A. and N. Dormady. 2014. Israeli-Palestinian Land Swap
Auction Model. Final Report, RAND Intelligence Policy Center.
X
CREATE OUTREACH PRESENTATIONS
Rose, Adam – University of Southern California – CREATE
1. Avetisyan, M., N. Heatwole, A. Rose, B. Roberts, ”Macroeconomic Impacts of Reduced
Wait Times at U.S. Land Freight Border Crossings,” invited seminar, Cross-Border Institute,
University of Windsor, Windsor Ontario, October 2014.
2. Rose, A. “Co-Benefits of Disaster Risk Management,” Invited plenary presentation, National
Institute of Building Sciences Annual Symposium, Washington, DC, January 2015.
Rose, Economic Consequence Analysis Tool (E-CAT)
11
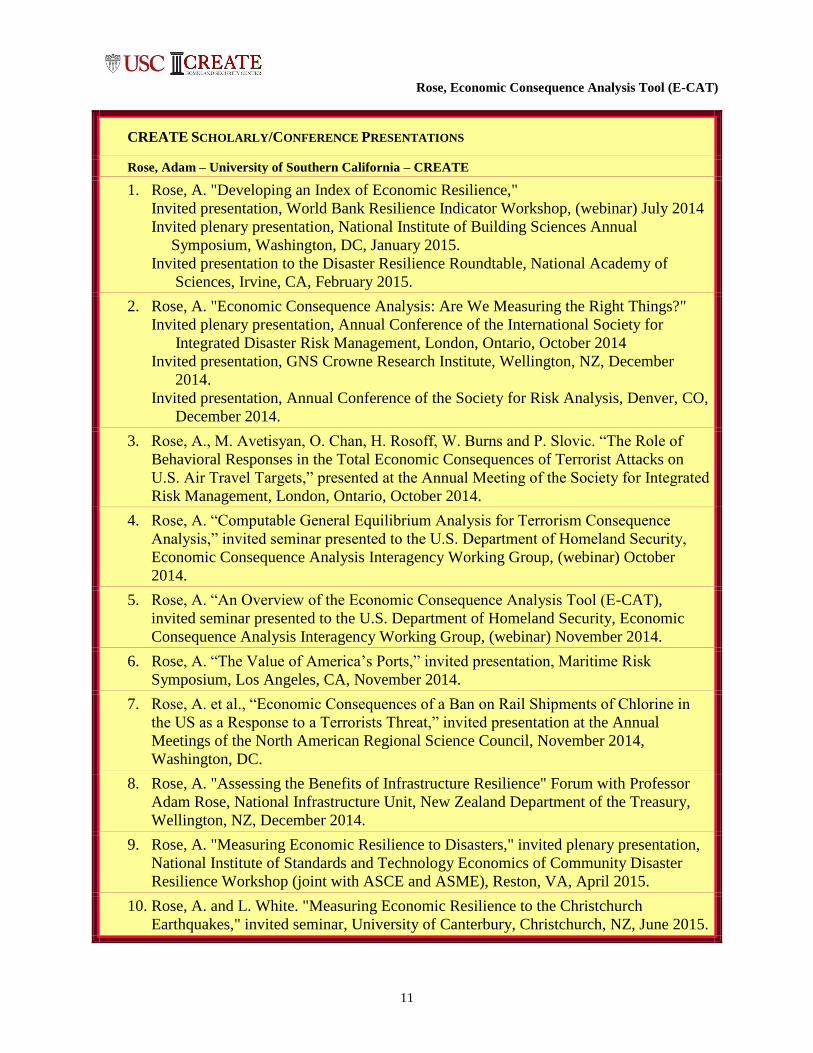
CREATE SCHOLARLY/CONFERENCE PRESENTATIONS
Rose, Adam – University of Southern California – CREATE
1. Rose, A. "Developing an Index of Economic Resilience,"
Invited presentation, World Bank Resilience Indicator Workshop, (webinar) July 2014
Invited plenary presentation, National Institute of Building Sciences Annual
Symposium, Washington, DC, January 2015.
Invited presentation to the Disaster Resilience Roundtable, National Academy of
Sciences, Irvine, CA, February 2015.
2. Rose, A. "Economic Consequence Analysis: Are We Measuring the Right Things?"
Invited plenary presentation, Annual Conference of the International Society for
Integrated Disaster Risk Management, London, Ontario, October 2014
Invited presentation, GNS Crowne Research Institute, Wellington, NZ, December
2014.
Invited presentation, Annual Conference of the Society for Risk Analysis, Denver, CO,
December 2014.
3. Rose, A., M. Avetisyan, O. Chan, H. Rosoff, W. Burns and P. Slovic. “The Role of
Behavioral Responses in the Total Economic Consequences of Terrorist Attacks on
U.S. Air Travel Targets,” presented at the Annual Meeting of the Society for Integrated
Risk Management, London, Ontario, October 2014.
4. Rose, A. “Computable General Equilibrium Analysis for Terrorism Consequence
Analysis,” invited seminar presented to the U.S. Department of Homeland Security,
Economic Consequence Analysis Interagency Working Group, (webinar) October
2014.
5. Rose, A. “An Overview of the Economic Consequence Analysis Tool (E-CAT),
invited seminar presented to the U.S. Department of Homeland Security, Economic
Consequence Analysis Interagency Working Group, (webinar) November 2014.
6. Rose, A. “The Value of America’s Ports,” invited presentation, Maritime Risk
Symposium, Los Angeles, CA, November 2014.
7. Rose, A. et al., “Economic Consequences of a Ban on Rail Shipments of Chlorine in
the US as a Response to a Terrorists Threat,” invited presentation at the Annual
Meetings of the North American Regional Science Council, November 2014,
Washington, DC.
8. Rose, A. "Assessing the Benefits of Infrastructure Resilience" Forum with Professor
Adam Rose, National Infrastructure Unit, New Zealand Department of the Treasury,
Wellington, NZ, December 2014.
9. Rose, A. "Measuring Economic Resilience to Disasters," invited plenary presentation,
National Institute of Standards and Technology Economics of Community Disaster
Resilience Workshop (joint with ASCE and ASME), Reston, VA, April 2015.
10. Rose, A. and L. White. "Measuring Economic Resilience to the Christchurch
Earthquakes," invited seminar, University of Canterbury, Christchurch, NZ, June 2015.

Rose, Economic Consequence Analysis Tool (E-CAT)
12
2.4. Models, Databases, Software Tools, Invention Disclosures and Patents
The Economic Consequence Analysis Tool (E-CAT) accounts for the cumulative direct and
indirect impacts (including resilience and behavioral factors that significantly affect base
estimates) on the national economy from terrorism, natural disasters, and technological
accidents. Implementation of E-CAT in Excel and VBA makes the tool accessible to a wide
variety of users.
E-CAT is being considered for use by TSA, FEMA, the US Coast Guard, and the California
Office of Emergency Services. A supplement to FY 16 funding for the Rose Research Team has
been provided by the Coast Guard to refine E-CAT to evaluate maritime cyber threats. We can
tailor E-CAT for other specialized users as well.
Research Products Transitioned to Governmental Agencies
RESEARCH PRODUCTS
Project
Leader(s) Date Delivered Item
Agency
Receiving
Product
Agency POC Transitioning
Status
Rose
Economic
Consequence
Analysis Tool
(E-CAT)
Software
Tool in
Excel/VBA
DHS Policy
Office;
USCG
Formerly
Debra Elkins;
Joe Direnzo
Transition-
Ready
3. Education Programs
CREATE PROJECT-FUNDED AND OTHER (VOLUNTEER/INTERN) STUDENTS
Last Name First
Name University School Department Degree Research Area
CREATE
Funded?
Graduated
(Year)
1. Prager Fynnwin USC Price Public Policy Post-
doc
Env. Econ;
Nat Hazards/
Terrorism
Yes 2014
2. Chen Zhenhua George
Mason
Public
Policy Public Policy
Post-
doc
Reg Science;
Transportation Yes 2015
3. Warren Eric USC Price Public Policy MPP Yes 2015
4. Shears Brett USC Price Public Policy MPP Yes 2015
5. Banks Joshua USC Price Public Policy MPP Yes 2016
6. Miller Noah USC Price Public Policy MPP Yes 2016

Rose, Economic Consequence Analysis Tool (E-CAT)
13
CREATE RELATED COURSES, CERTIFICATES AND DEGREE PROGRAMS DEVELOPED
Instructor University New or Modified Course Title
1. Adam Rose USC Modified Economic Impact Analysis
CREATE RELATED AWARDS AND RECOGNITION
Name (Who or What) Award/Recognition Date Other Details
1. A. Rose Team CREATE Transition
Product of the Year June 2015
Nominee for DHS OUP Transition Product of
the Year
4. Outreach Programs
MEMBERSHIP IN MAJOR DHS-RELATED COMMITTEES
Name and Committee Institution Time Period
Adam Rose, Scientific Advisory Board Panel on Economy-Wide Impacts EPA 2015-16
REQUESTS FOR ASSISTANCE
Requester Name and Agency/Institution Brief (2-3 sentence) Description of Assistance Provided Dates / Time Period
James King, Terrorism Risk Assessment
Working Group/ DHS S&T
Advice on econ consequence analysis
(including 2 webinar presentations
7 to 12/ 2014
Steve Cauffman and Robert Chapman, NIST Advice on economic resilience component to
new Community Resilience Center
Begun 2/2015
Tony Cheesebrough, NPPD Advice on Economic Analysis Begun 7/2014
Erica Seville, Economics of Resilient
Infrastructure Program, New Zealand
Advice on research and implementation
strategies
Begun 10/2014
5. Project Performance Metrics
Follow-on Funding from Other Sources (Other than OUP)
FOLLOW-ON FUNDING FROM OTHER SOURCES (OTHER THAN OUP)
Funding Name and Agency/Institution
Project Title Amount
Dates / Fiscal Year
From DHS:
CIRI COE Measuring Economic Resilience $250K 10/1/16 to 9/30/16
From Other Federal, State and Local Governments:
NSF Dynamic Economic Resilience $497K 7/15/14 to 7/15/16

Rose, Economic Consequence Analysis Tool (E-CAT)
14
Table 1: FY2015 Project Performance Metrics
Categories of Accomplishments –
Number of:
FY2015
(Year 11)
Student Enrollment in COE Programs:
Traditional undergraduate and graduate students attending classes 4
Students registered in on-line or other distance learning courses
Homeland security professionals attending courses
Project-Funded Students 6
Papers (plus 5 reports) 11
Software Products Developed 1
New Courses Developed (Modified) 1
New Certificates or Degree Programs Developed:
New Degree Programs
New Certificates
New private or public licensees/partners using coursework licensed by the COE
Patent Applications
Patents Awarded
Requests for assistance or advice from DHS (# of different DHS contacts/projects/requests) 1
Requests for assistance or advice from Federal, State, Local Government 3
Follow-on funding from other sources (NSF and new CIRI COE) $747K
Presentations 16
Congressional Testimonies
Projects Completed 3