gaining insight from pi system data using new tools for
TRANSCRIPT

© Copyright 2011 OSIsoft, LLC
Presented by
Gaining Insight from PI System Data
Using New Tools for Operational
Intelligence
Curt Hertler
Marketing Manager
OSIsoft

© Copyright 2011 OSIsoft, LLC 2
Agenda
• Business Intelligence (BI) Technologies
– Multidimensional Data Analysis
– Operational Intelligence
• Introduction to “Self-service BI”
– PI AF
– PI OLEDB Enterprise 2010
– Microsoft PowerPivot for Excel 2010
– Microsoft SharePoint 2010 Enterprise
• Example Walk Through
• Other Examples and Additional Information
© Copyright 2011 OSIsoft, LLC 3
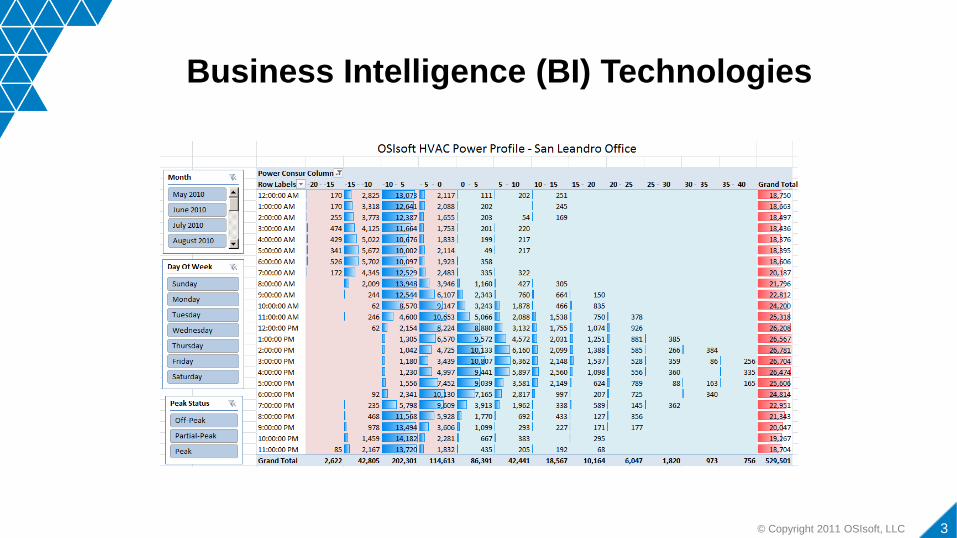
Business Intelligence (BI) Technologies

© Copyright 2011 OSIsoft, LLC 4
Multidimensional Data Analysis
Quick, ad hoc, aggregation of large amounts of interesting data (facts),
based on user-selected criteria (dimensions), to identify opportunities for
improvement.

© Copyright 2011 OSIsoft, LLC 5
Operational Intelligence

© Copyright 2011 OSIsoft, LLC 6
Customer Example: CFE Mexico

© Copyright 2011 OSIsoft, LLC 7
Introduction to “Self-Service” BI

© Copyright 2011 OSIsoft, LLC 8
OSIsoft / Microsoft BI Stack
PI for Office 2010
PI System 2010
Enterprise
Enterprise or above

© Copyright 2011 OSIsoft, LLC 9
Self-service BI Toolkit for the PI System
• Facts and Dimensions
– PI AF (PI System 2010)
• Datasets for BI Data Extraction
– PI OLEDB Enterprise 2010 (PI for Office 2010)
• Desktop Analysis and Cube Configuration
– Microsoft PowerPivot for Excel 2010
• Enterprise Accountability
– Microsoft PowerPivot for SharePoint 2010
– Microsoft SharePoint 2010 Enterprise
– Microsoft SQL Server 2008 R2 Enterprise or above
© Copyright 2011 OSIsoft, LLC 10
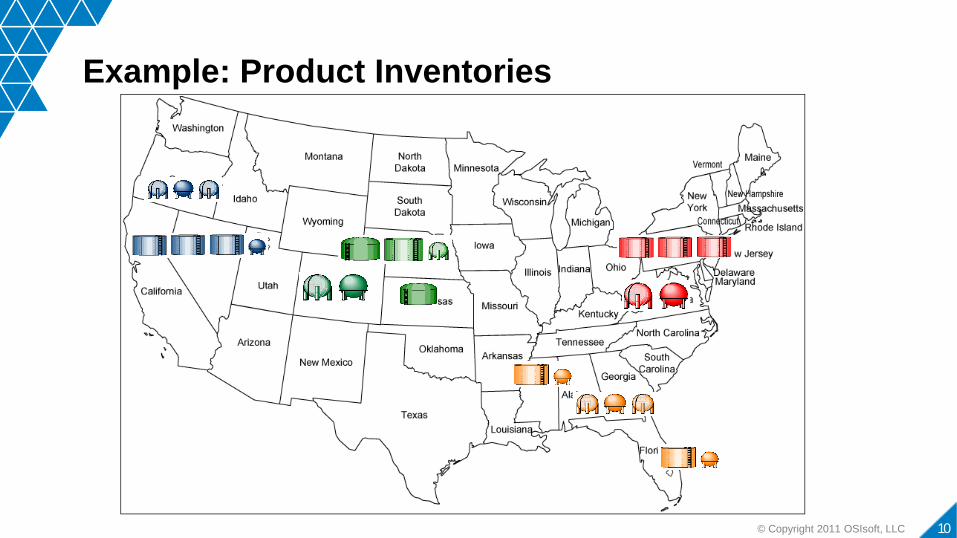
Example: Product Inventories

© Copyright 2011 OSIsoft, LLC 11
PI AF Associates Facts and Dimensions
Hierarchy
Templates
Categories
Dimensions
Facts Attributes
• PI Point
• Formula
• Other
Facts
AF Attributes
• Volume
• Product
• Product
Group
Dimensions
AF Hierarchy
• Region
• Terminal
• Tank

© Copyright 2011 OSIsoft, LLC 12
PI OLEDB Enterprise 2010
PI SQL Commander
Facts - AF Attributes Dimensions – AF Hierarchy

© Copyright 2011 OSIsoft, LLC
13
Introducing PowerPivot for Excel 2010
• Enable users to perform self-service
analysis and intuitively build their own BI
solutions
• Allow users to interactively explore and
perform calculations on large data sets
• Integrate data from multiple sources
• Minimize dependence on IT support
Empowering The End User
© Copyright 2011 OSIsoft, LLC 14
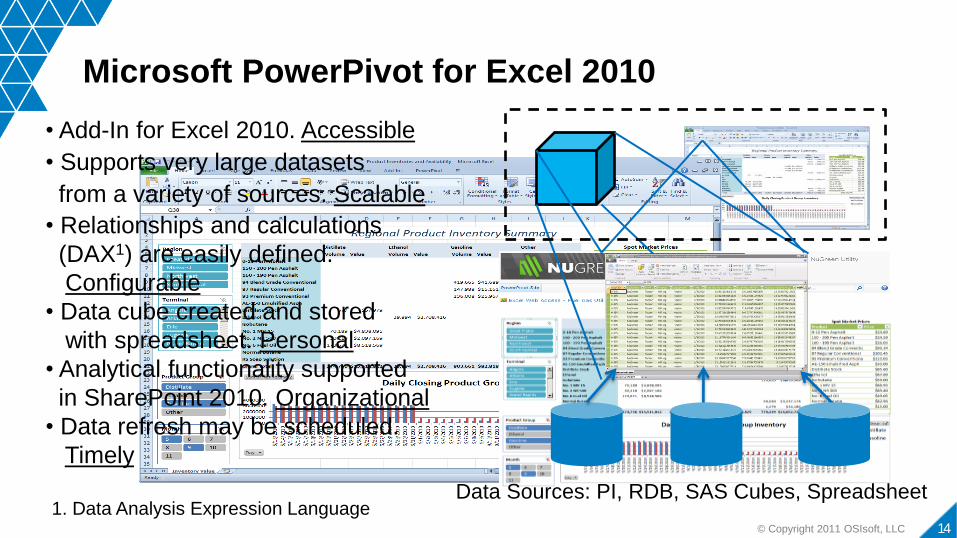
Microsoft PowerPivot for Excel 2010
• Add-In for Excel 2010. Accessible
• Supports very large datasets
from a variety of sources. Scalable
• Relationships and calculations
(DAX1) are easily defined.
Configurable
• Data cube created and stored
with spreadsheet. Personal
• Analytical functionality supported
in SharePoint 2010. Organizational
• Data refresh may be scheduled.
Timely
1. Data Analysis Expression Language Data Sources: PI, RDB, SAS Cubes, Spreadsheet

© Copyright 2011 OSIsoft, LLC 15
Multidimensional Data “Cube”
Net Volume (BBL)
Product
Value ($)
Facts
Terminal
Dimensions Tulsa
Wichita
Benton
Clemont
Region
Time
45.700
87 RON
$4560
85,132
No. 2
$3940
South
Central
Great
Plains
Michigan
Midwest
87,560
Kero.
$2360
87,565
Prop.
$2360
11.700
90 RON
$7840
23.700
87 RON
$90345
11.990
92 RON
$2340
41.560
Prop.
$2360
65,,360
Kero.
$7360
85,132
No. 2
$3940
43,500
LPG.
$2360
51,561
Ethanol
$2360
Shift Hour Month
Storage Tank
….
77-890
T-445
SS-345
…..

© Copyright 2011 OSIsoft, LLC 16
Example Walk Through

© Copyright 2011 OSIsoft, LLC 17
Product Inventories and Valuation
“Slicers” filter data
shown in
PowerPivot
Tables and
Charts

© Copyright 2011 OSIsoft, LLC 18
Product Inventories and Valuation

© Copyright 2011 OSIsoft, LLC 19
Product Inventories and Valuation

© Copyright 2011 OSIsoft, LLC 20
Product Inventories and Valuation

© Copyright 2011 OSIsoft, LLC 21
Product Inventories and Valuation
Linked Tables
Manual entry of
data into
PowerPivot
cube for “What-
If “ analysis

© Copyright 2011 OSIsoft, LLC
Import Data into PowerPivot
PowerPivot
Add-In for
Excel 2010
Configure
Relationships
Current Product Inventories PI OLEDB Enterprise 2010
Six Months Daily Inventories PI OLEDB Enterprise 2010
Tank Location PI OLEDB Enterprise 2010
Commodity Prices Excel Linked Table
Add Calculations
Using DAX1
1. Data Analysis Expression Language

© Copyright 2011 OSIsoft, LLC 23
Build PowerPivot Tables and Charts

© Copyright 2011 OSIsoft, LLC 24
SharePoint 2010 Enterprise

© Copyright 2011 OSIsoft, LLC 25
Other Examples and Additional Information
WWW.PowerPivot.com

© Copyright 2011 OSIsoft, LLC 26
Performance Profiling

© Copyright 2011 OSIsoft, LLC 27
Historical Analytics

© Copyright 2011 OSIsoft, LLC 28
Feedstock Analysis

© Copyright 2011 OSIsoft, LLC 29
Energy Benchmarking

© Copyright 2011 OSIsoft, LLC 30
Resources
• OSIsoft Resources – Recorded Users Conference 2010 and 2011 Presentations
– Recorded OSIsoft vCampus Presentations
– Prescriptive Architecture Guides
• Books – “PowerPivot for the Data Analyst”, Bill Jelen
– “Practical PowerPivot & DAX Formulas for Excel 2010”, Art Tennick
• Microsoft Resources – PowerPivot (www.PowerPivot.com)
– CFE Case Study (www.microsoft.com/casestudies/Microsoft-Sharepoint-Server-2010/Comisi-n-Federal-de-Electricidad-CFE/Mexico-s-Electrical-Utility-Sees-Saving-Millions-of-Dollars-through-Collaborative-BI/4000007996)
– Windows Azure DataMarket (datamarket.azure.com)

© Copyright 2011 OSIsoft, LLC