gardner denver q4 and full year 2017 earnings...
TRANSCRIPT

Gardner DenverQ4 and Full Year 2017 Earnings PresentationFebruary 16, 2018
Replay Information
▪ Dial toll-free: +1.877.344.7529
▪ International: +1.412.317.0088
▪ Conference ID: #10116634
▪ Log on to: http://investors.gardnerdenver.com
2
Disclaimer
Forward-Looking Statements
During the course of this presentation, we may make “forward-looking statements” within the meaning of the USfederal securities laws. In fact, all statements made during this presentation other than statements of historical factare forward-looking statements. Words such as “expects,” “anticipates,” “believes,” “estimates,” “plans,” “intends,”“projects” and “indicates” and variations of such words or similar expressions are intended to identify forward-looking statements. Although they reflect our current expectations, these statements are not guarantees of futureperformance, and actual results may differ materially from what is expressed in or indicated by these forward-looking statements. Forward-looking statements are subject to risks and uncertainties that could cause actualperformance or results to differ materially from those expressed in such forward-looking statements, including thoserisks and uncertainties described under the section titled “Risk Factors” in our most recent annual report on form 10-K filed with the Securities and Exchange Commission (“SEC”), which risks and uncertainties may be updated fromtime to time in our periodic filings with the SEC (accessible on the SEC’s website at www.sec.gov). Forward-lookingstatements speak only as of the date the statements are made. The Company does not undertake to update anyforward-looking statements as a result of future developments or new information, except as required by law.
Non-GAAP Financial Measures
Included in this presentation are certain non-GAAP financial measures designed to supplement, and not substitute,the financial information presented in accordance with generally accepted accounting principles in the United Statesof America because management believes such measures are useful to investors. The reconciliation of thosemeasures to the most comparable GAAP measures is detailed in Gardner Denver’s press release for the fourthquarter of 2017, which is available at http://investors.gardnerdenver.com, together with this presentation.
3

Agenda
▪ Highlights
▪ Q4 & FY 2017 Financial Performance
▪ Segment Highlights
▪ Strategy Update & Runtech Acquisition
▪ 2018 Guidance
▪ Q&A
4

Q4 Highlights
5¹ Excluding the impact of any potential future acquisitions
Strong Execution
• Revenue of $665M, up 15% versus prior year
• Adjusted EBITDA of $173M, up 16% versus the prior year
• Adjusted EBITDA margin of 26.0%, an improvement of 30 basis pointsversus prior year
Improving Leverage Profile
• Free cash flow generation of $96M, up 213% versus prior year
• Net debt to Adjusted EBITDA ratio improved to 2.9x from 3.2x versus prior quarter & 1.3x turns since the time of the IPO (May 2017)
Favorable Outlook
• Providing 2018 guidance for Adjusted EBITDA of $650M to $670M
• Targeting year-end net debt to Adjusted EBITDA ratio of ~2.1X - 2.3X1
Solid performance across all three segments and continued
execution of our value-creation strategy
A premier industrial company with leading brands, mission-critical technologies, and diverse end market exposure

Q4 & FY 2017 Financial Performance
Q4 2017 Financial Performance
7¹ Adjusted EPS is defined as adjusted net income divided by adjusted diluted average shares outstanding
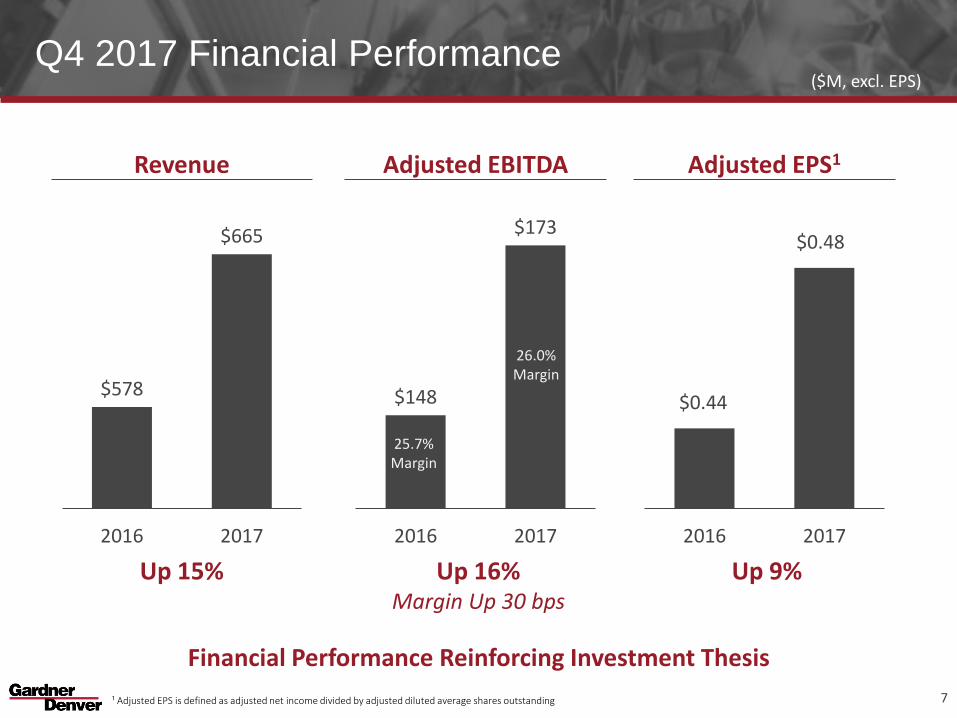
($M, excl. EPS)
Revenue
$578
$665
2016 2017
Adjusted EBITDA
$148
$173
2016 2017
Adjusted EPS1
$0.44
$0.48
2016 2017
Up 15% Up 16%Margin Up 30 bps
Up 9%
26.0%Margin
25.7%Margin
Financial Performance Reinforcing Investment Thesis

Pro-formaIPO
4.2x3.8x
3.2x2.9x
Q1'17 Q2'17 Q3'17 Q4'17
Q4 2017 Financial Performance
8
LeverageFree Cash Flow1Working Capital(Op. Working Capital as % of LTM Sales) (Net Debt / LTM Adjusted EBITDA)
$31
$96
2016 2017
Improved 180 bps Up 213% Improved 0.3x sequentially
¹ Free Cash Flow is defined as cash flows from operations less capital expenditures
31.5%
29.7%
2016 2017
Strengthening Position Through Strong FCF and De-leveraging
($M)

FY 2017 Financial Performance
9¹ Adjusted EPS is defined as adjusted net income divided by adjusted diluted average shares outstanding
Revenue
$1,939
$2,375
2016 2017
Adjusted EBITDA
$401
$562
2016 2017
Adjusted EPS1
$0.88
$1.32
2016 2017
Up 22% Up 40%Margin Up 290 bps
Up 50%
23.6%Margin
20.7%Margin
($M, excl. EPS)

Impact of U.S. Tax Legislation
10
• Net tax benefits of ~$95M recorded in 2017 related to U.S. Tax legislation
• Tax benefit of ~$90M recorded for the revaluation of U.S. deferred tax liabilities for the reduction of tax rate from 35% to 21%
• Repatriation Tax cost of ~$63M offset by the tax benefit of ~$69M for the reduction in the deferred tax liability on unremitted non-U.S. earnings and profits
• 2018 tax rate currently forecasted to improve 200 to 400 bps versus prior year to a range of 26% to 28%1
1Forecasts are subject to change based upon additional regulations and guidance from the U.S. Treasury

Q4 & FY 2017 Segment Performance

Industrials Segment – Q4 & FY Highlights
12
($M)
Highlights (All Q4 unless otherwise noted):
Orders up 25% as reported; up 20% ex-FX… strong growth in all regions
Revenue up 7% ex-FX… strong equipment sales as new product
introductions gaining momentum and healthy global demand
Adj EBITDA margin up 10 bps; lapping strong Q4’16 performance of +800
bps
FY Adj EBITDA margin up 140 bps benefiting from volume gains and
continued execution of operational excellence initiatives (VAVE, lean,
restructuring)… record margin level at 21.5%
iConn Smart Air Flow Management PlatformAir analytics cloud platform providing predictive air insights for customers’ compressed air needs. Over
2,100 iConn units registered in the field with significant ramp expected in 2018.
As Reported
YOYChange
Ex-FX YOY Change
Revenue $311.7 11.8% 6.7%
Adj EBITDA $69.0 12.4% 6.4%
Adj EBITDA Margin 22.1% 10 bps
Innovation in Action
Q4 2017
As Reported
YOYChange
Ex-FX YOY Change
Revenue $1,130.7 4.5% 3.4%
Adj EBITDA $242.7 11.5% 10.2%
Adj EBITDA Margin 21.5% 140 bps
FY 2017

Energy Segment – Q4 & FY Highlights
13
($M)
Upstream Energy Consumables: Redline PackingPacking is the critical seal system in the heart of a fluid
end. Redline Packing’s increased life versus competitor’s offerings and ability to increase product uptime led to
recent adoption by a Tier 1 pressure pumper.
Highlights (All Q4 unless otherwise noted):
Orders up 62% as reported; up 58% ex-FX
Revenue up 18% ex-FX; aftermarket revenue up 54%
Upstream revenue up 99% ex-FX; Mid/Downstream down double
digits due to timing of prior year project shipments
Adj EBITDA margins up 250 bps due to strong upstream volume
performance & operational efficiencies
As Reported
YOYChange
Ex-FX YOY Change
Revenue $295.1 21.6% 18.3%
Adj EBITDA $96.9 31.7% 28.1%
Adj EBITDA Margin 32.8% 250 bps
Innovation in Action
As Reported
YOYChange
Ex-FX YOY Change
Revenue $1,014.5 61.4% 60.0%
Adj EBITDA $296.1 105.9% 104.0%
Adj EBITDA Margin 29.2% 630 bps
Q4 2017 FY 2017
As Reported
YOYChange
Ex-FX YOY Change
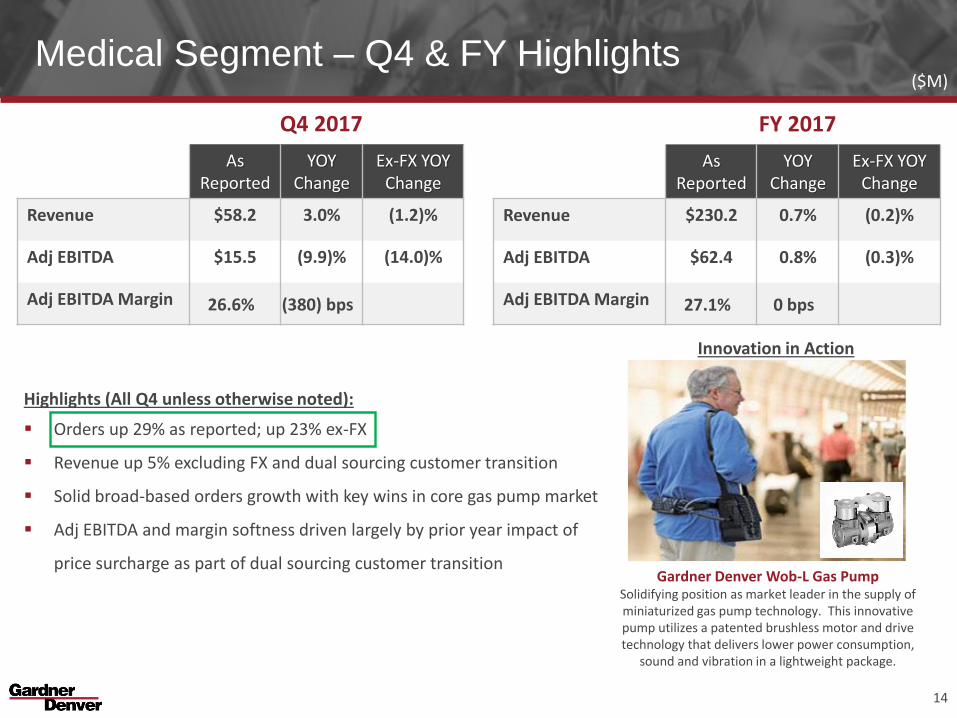
Revenue $58.2 3.0% (1.2)%
Adj EBITDA $15.5 (9.9)% (14.0)%
Adj EBITDA Margin 26.6% (380) bps
Medical Segment – Q4 & FY Highlights
14
($M)
Gardner Denver Wob-L Gas PumpSolidifying position as market leader in the supply of miniaturized gas pump technology. This innovative pump utilizes a patented brushless motor and drive technology that delivers lower power consumption,
sound and vibration in a lightweight package.
Highlights (All Q4 unless otherwise noted):
Orders up 29% as reported; up 23% ex-FX
Revenue up 5% excluding FX and dual sourcing customer transition
Solid broad-based orders growth with key wins in core gas pump market
Adj EBITDA and margin softness driven largely by prior year impact of
price surcharge as part of dual sourcing customer transition
As Reported
YOYChange
Ex-FX YOY Change
Revenue $230.2 0.7% (0.2)%
Adj EBITDA $62.4 0.8% (0.3)%
Adj EBITDA Margin 27.1% 0 bps
Innovation in Action
Q4 2017 FY 2017

Strategy Update & 2018 Guidance

Our Strategy
Deploy Talent
Creating a performance driven culture with highly engaged employees
– Creating a great place to work – Launched multi-year engagement initiative
– Acting like owners – Awarded ~$100M in equity across ~6,000 employees
Continue to enhance expertise and talent in critical functions
Expand Margins
Driving Lean Manufacturing across multitude of sites (still early)
Leveraging spend across organization (e.g., freight, sourcing) to generate further savings
Maturing Value Engineering process to drive further product enhancements and efficiencies
Accelerate Growth
Commercializing new products with new sophisticated Demand Generation process
Embedding smart technologies (e.g., iConn) into products
Leveraging investments in emerging markets – “innovation in the region for the region”
Allocate Capital Effectively
Invest in core: new products, new technologies and emerging markets
Reduce leverage: Net Debt-to-Adjusted EBITDA target
Execute disciplined M&A based on clear strategic and financial criteria
16
Strong Foundation, Clear Strategy, Committed Leadership
Acquisition of Runtech Systems
17¹ Financial estimates are included in total Gardner Denver’s FY2018 guidance.
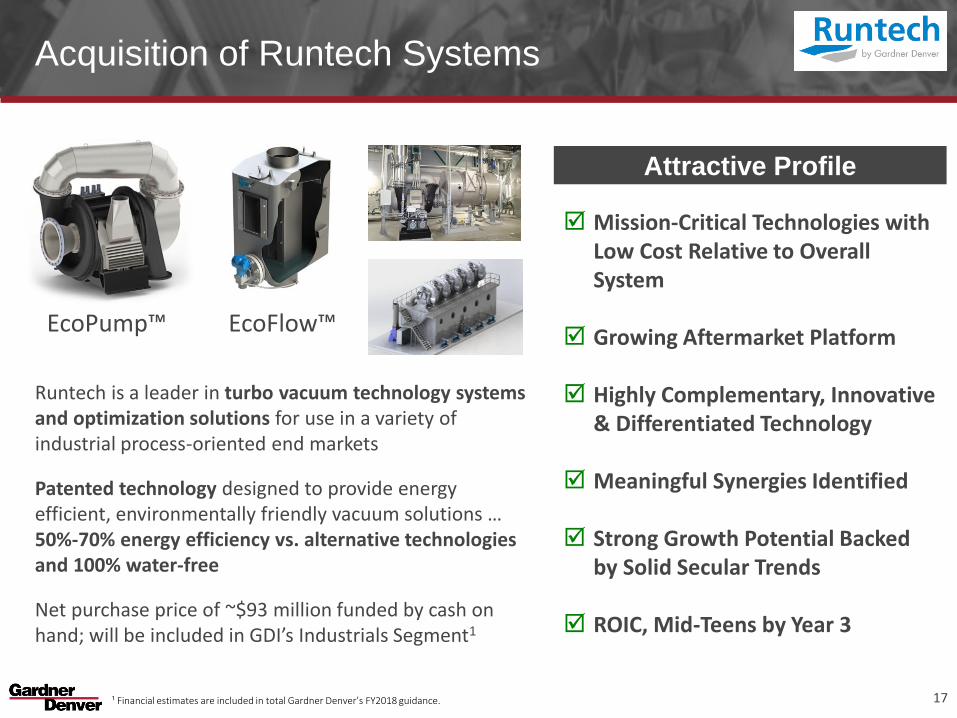
Runtech is a leader in turbo vacuum technology systems and optimization solutions for use in a variety of industrial process-oriented end markets
Patented technology designed to provide energy efficient, environmentally friendly vacuum solutions … 50%-70% energy efficiency vs. alternative technologies and 100% water-free
Net purchase price of ~$93 million funded by cash on hand; will be included in GDI’s Industrials Segment1
EcoPump™ EcoFlow™
Mission-Critical Technologies with Low Cost Relative to Overall System
Growing Aftermarket Platform
Highly Complementary, Innovative & Differentiated Technology
Meaningful Synergies Identified
Strong Growth Potential Backed by Solid Secular Trends
ROIC, Mid-Teens by Year 3
Attractive Profile

2018 Guidance
18
1 Represents the full year expectation of weighted average diluted shares outstanding based on 2017 year end share count and share price. Outlook does not include impacts of option or share grants in 2018 associated with Company’s 2017 long term incentive plan.2 All revenue outlook commentary expressed in percentages
Secular Drivers Growth Profile 2018 Revenue Outlook2
Industrials Increasing Need for Efficiency & Technology GDP+Mid-high single
digit3
Medical Growing Health Needs Globally GDP+ Mid-single digit
Mid &Downstream Energy
Growing Need for Energy & Infrastructure GDP+Mid-single digit
Upstream Energy
Multiple Layers of GrowthIncreasing intensity of fracturing (longer laterals) & growing backlog of DUCsPending replacement cycle
Activity & Intensity-driven
Mid-teens
ENERGY
▪ Adjusted EBITDA $650M to $670M
▪ Capital Expenditures $65M to $75M
▪ Tax Rate 26% to 28%
▪ Average Shares Outstanding1 209.3M
▪ Segment Sales Outlook:
3 Includes the impact of Runtech acquisition

Continuing to Execute Our Strategy
19
DeployTalent
• Continued talent infusion in critical functions & domain expertise (P&L Leadership, Board of Directors)
• Company-wide engagement starting to deliver results
MarginExpansion
• FY’17 Adjusted EBITDA margin of 23.6%, up 290 bps
• Continued execution of lean, sourcing, VAVE initiatives
GrowthAcceleration
• FY’17 revenue growth of 21% ex-FX and strong momentum exiting the year (all three segments +20% orders in Q4’17)
• NPD acceleration driving growth
Capital Allocation
• FY’17 strong free cash flow generation, up 58%
• Reduced 2017 year-end leverage to 2.9x, down 1.3x from IPO
• Executing on disciplined M&A strategy (LeROI, Runtech)
Delivering Results in 2017 & Building Momentum for 2018+

Q&A

Appendix

Reconciliation of Net Income/(Loss) and Earnings/(Loss) per Share to Adjusted Net Income and Adjusted Earnings per Share
22
2017 2016 2017 2016
Net Income (Loss) 143.8$ (4.3)$ 18.5$ (31.3)$
Basic Earnings (Loss) Per Share (As Reported)1,20.71$ (0.07)$ 0.10$ (0.25)$
Diluted Earnings (Loss) Per Share (As Reported)1,20.69$ (0.07)$ 0.10$ (0.25)$
Plus:
(Benefit) provision for income taxes (90.1) 1.3 (131.2) (31.9)
Amortization of acquisition related intangible assets 27.3 27.4 107.7 110.6
Impairment of goodwill and other intangible assets 1.6 23.8 1.6 25.3
Sponsor fees and expenses - 1.0 17.3 4.8
Restructuring and related business transformation costs 4.2 32.5 24.7 78.7
Acquisition related expenses and non-cash charges 1.0 0.6 4.1 4.3
Environmental remediation loss reserve - 5.6 0.9 5.6
Expenses related to public stock offerings 0.5 - 4.1 -
Establish public company financial reporting compliance 0.9 0.1 8.1 0.2
Stock-based compensation 28.2 - 194.2 -
Loss on extinguishment of debt - - 84.5 -
Foreign currency transaction losses (gains), net 3.0 (3.3) 9.3 (5.9)
Other adjustments 7.5 3.5 10.9 7.9
Minus:
Income tax provision, as adjusted 27.8 21.8 105.4 34.7
Adjusted Net Income 100.1$ 66.4$ 249.3$ 133.6$
Adjusted Basic Earnings Per Share20.50$ 0.45$ 1.37$ 0.90$
Adjusted Diluted Earnings Per Share2,40.48$ 0.44$ 1.32$ 0.88$
Average shares outstanding:
Basic, as reported 201.4 148.7 182.2 149.2
Diluted, as reported3209.3 148.7 188.4 149.2
Adjusted diluted4209.3 151.9 188.4 151.0
3 Due to net losses in certain periods shown, basic and diluted average shares outstanding are the same in those periods.4 Adjusted diluted share count and adjusted diluted earnings per share include incremental dilutive shares, using the
treasury stock method, which are added to average shares outstanding.
1 Basic and diluted earnings per share (as reported) are calculated by dividing net income (loss) attributable to Gardner
Denver Holdings, Inc. by the basic and diluted average shares outstanding for the respective periods.2 Basic and diluted earnings per share (as reported) and adjusted basic and diluted earnings per share for the three month
and years ended December 31, 2017 and 2016 are not comparable due to the significant change in capital structure as a
result of the initial public offering in May of 2017.
Month Period Ended Year Ended
December 31, December 31,
GARDNER DENVER HOLDINGS, INC. AND SUBSIDIARIES
RECONCILIATION OF NET INCOME (LOSS) AND EARNINGS (LOSS) PER SHARE TO ADJUSTED NET
INCOME AND ADJUSTED EARNINGS PER SHARE
(Dollars in millions, except per share amounts)
(Unaudited)
For the Three For the

Reconciliation of Net Income/(Loss) to Adjusted EBITDA and Adjusted Net Income and CFOA to Free Cash Flow
23
2017 2016 2017 2016
Net Income (Loss) 143.8$ (4.3)$ 18.5$ (31.3)$
Plus:
Interest expense 25.2 41.6 140.7 170.3
(Benefit) provision for income taxes (90.1) 1.3 (131.2) (31.9)
Depreciation expense 15.5 12.5 54.9 48.5
Amortization expense 31.3 33.4 118.9 124.2
Impairment of goodwill and other intangible assets 1.6 23.8 1.6 25.3
Sponsor fees and expenses - 1.0 17.3 4.8
Restructuring and related business transformation costs 4.2 32.5 24.7 78.7
Acquisition related expenses and non-cash charges 1.0 0.6 4.1 4.3
Environmental remediation loss reserve - 5.6 0.9 5.6
Expenses related to public stock offerings 0.5 - 4.1 -
Establish public company financial reporting compliance 0.9 0.1 8.1 0.2
Stock-based compensation 28.2 - 194.2 -
Loss on extinguishment of debt - - 84.5 -
Foreign currency transaction losses (gains), net 3.0 (3.3) 9.3 (5.9)
Other adjustments 7.5 3.5 10.9 7.9
Adjusted EBITDA 172.6$ 148.3$ 561.5$ 400.7$
Minus:
Interest expense 25.2 41.6 140.7 170.3
Income tax provision, as adjusted 27.8 21.8 105.4 34.7
Depreciation expense 15.5 12.5 54.9 48.5
Amortization of non-acquisition related intangible assets 4.0 6.0 11.2 13.6
Adjusted Net Income 100.1$ 66.4$ 249.3$ 133.6$
Free Cash Flow
Cash flows - operating activities 116.6 58.8 200.5 165.6
Minus:
Capital expenditures 20.4 28.1 56.8 74.4
Free Cash Flow 96.2$ 30.7$ 143.7$ 91.2$
Month Period Ended Year Ended
December 31, December 31,
For the Three For the
GARDNER DENVER HOLDINGS, INC. AND SUBSIDIARIES RECONCILIATION OF NET INCOME (LOSS) TO ADJUSTED EBITDA AND ADJUSTED NET INCOME AND
CASH FLOWS - OPERATING ACTIVITIES TO FREE CASH FLOW
(Dollars in millions)
(Unaudited)

Reconciliation of Segment Adjusted EBITDA to Income/(Loss) Before Income Taxes
24
2017 2016 2017 2016
Revenue
Industrials 311.7$ 278.7$ 1,130.7$ 1,082.3$
Energy 295.1 242.6 1,014.5 628.4
Medical 58.2 56.4 230.2 228.7
Total Revenue 665.0$ 577.7$ 2,375.4$ 1,939.4$
Segment Adjusted EBITDA
Industrials 69.0$ 61.4$ 242.7$ 217.6$
Energy 96.9 73.6 296.1 143.8
Medical 15.5 17.2 62.4 61.9
Total Segment Adjusted EBITDA 181.4$ 152.2$ 601.2$ 423.3$
Less items to reconcile Segment Adjusted EBITDA to
Income (Loss) Before Income Taxes:
Corporate expenses not allocated to segments 8.8$ 3.9$ 39.7$ 22.6$
Interest expense 25.2 41.6 140.7 170.3
Depreciation and amortization expense 46.8 45.9 173.8 172.7
Impairment of goodwill and other intangible assets 1.6 23.8 1.6 25.3
Sponsor fees and expenses - 1.0 17.3 4.8
Restructuring and related business transformation costs 4.2 32.5 24.7 78.7
Acquisition related expenses and non-cash charges 1.0 0.6 4.1 4.3
Environmental remediation loss reserve - 5.6 0.9 5.6
Expenses related to public stock offerings 0.5 - 4.1 -
Establish public company financial reporting compliance 0.9 0.1 8.1 0.2
Stock-based compensation 28.2 - 194.2 -
Loss on extinguishment of debt - - 84.5 -
Foreign currency transaction losses (gains), net 3.0 (3.3) 9.3 (5.9)
Other adjustments 7.5 3.5 10.9 7.9
Income (Loss) Before Income Taxes 53.7$ (3.0)$ (112.7)$ (63.2)$
Month Period Ended Year Ended
December 31, December 31,
For the Three For the
GARDNER DENVER HOLDINGS, INC. AND SUBSIDIARIES
RECONCILIATION OF SEGMENT ADJUSTED EBITDA TO INCOME (LOSS) BEFORE INCOME TAXES
(Dollars in millions)
(Unaudited)