gcse: curved graphs dr j frost ([email protected]) last modified: 31 st december 2014...
TRANSCRIPT

GCSE: Curved Graphs
Dr J Frost ([email protected])
Last modified: 31st December 2014
GCSE Revision Pack Reference: 94, 95, 96, 97, 98

GCSE Specification
Plot and recognise quadratic, cubic, reciprocal, exponential and circular functions.
Plot and recognise trigonometric functions and , within the range -360° to +360°
Use the graphs of these functions to find approximate solutions to equations, eg given x find y (and vice versa)
Find the values of p and q in the function given coordinates on the graph of
“Given that and are points on the curve , find the value of and .”The graph shows .
Determine the coordinate of point .
The diagram shows the graph of y = x2 – 5x – 3(a) Use the graph to find estimates for the solutions of
(i) x2 – 5x – 3 = 0(ii) x2 – 5x – 3 = 6
1
2
3
4

Skill #1: Recognising GraphsLinear
When
The line is known as a straight line.
? ?
?
When
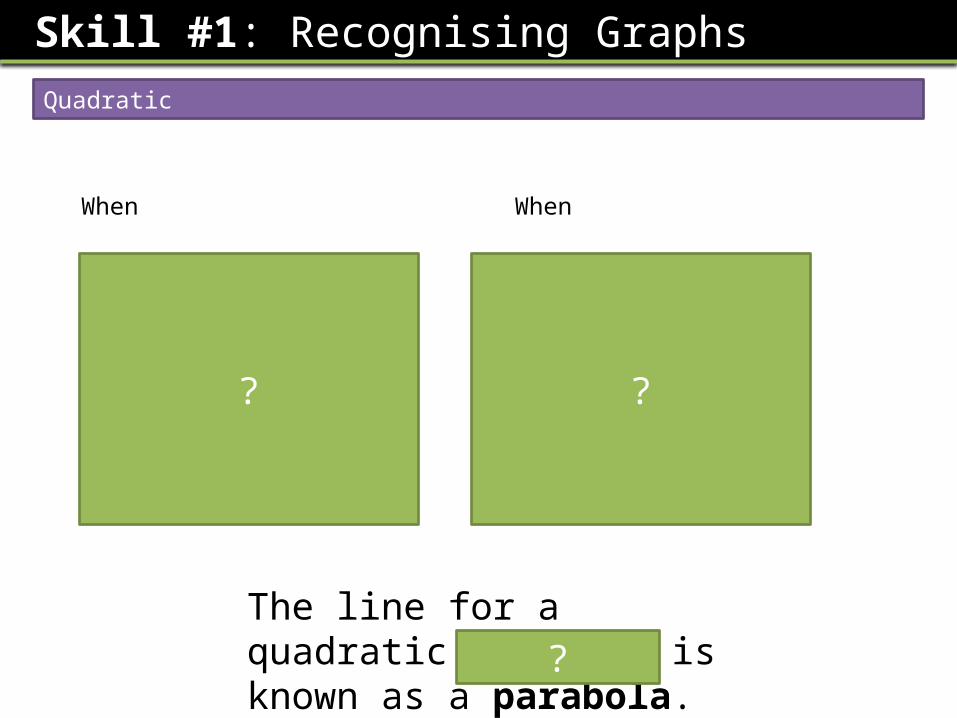
Quadratic
When
The line for a quadratic equation is known as a parabola.
? ?
?
When
Skill #1: Recognising Graphs

Cubic
When When
When
x
y
x
y
?
?
?
?
When
Skill #1: Recognising Graphs

Reciprocal
When
?
The lines x = 0 and y = 0 are called asymptotes.! An asymptote is a straight line which the curve approaches at infinity.
?
?
When
You don’t need to know this until A Level.
Skill #1: Recognising Graphs

Exponential
𝑦=𝑎×𝑏𝑥
x
y
𝑎
The y-intercept is because .(unless , but let’s not go there!)
?
Skill #1: Recognising Graphs
?
𝑥
𝑦
5-5
5
-5
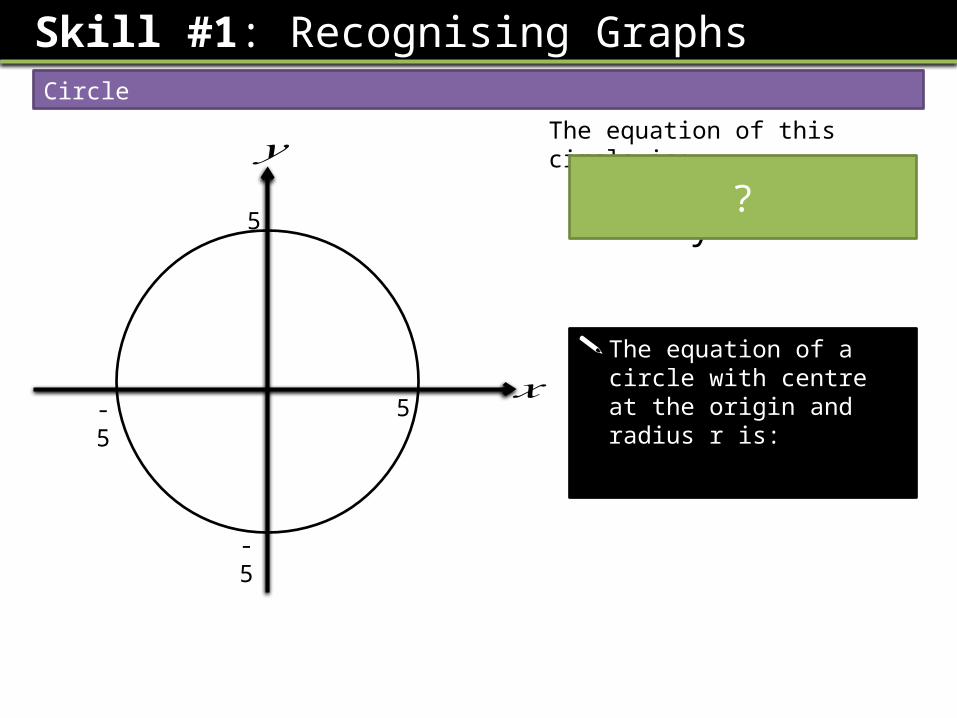
The equation of this circle is:
x2 + y2 = 25
The equation of a circle with centre at the origin and radius r is:
?
Circle
Skill #1: Recognising Graphs

Quickfire Circles
1-1
1
-1
x2 + y2 = 1
3-3
3
-3
x2 + y2 = 9
4-4
4
-4
x2 + y2 = 16
8-8
8
-8
x2 + y2 = 64
10-10
10
-10
x2 + y2 = 100
6-6
6
-6
x2 + y2 = 36
?
?
?
?
?
?
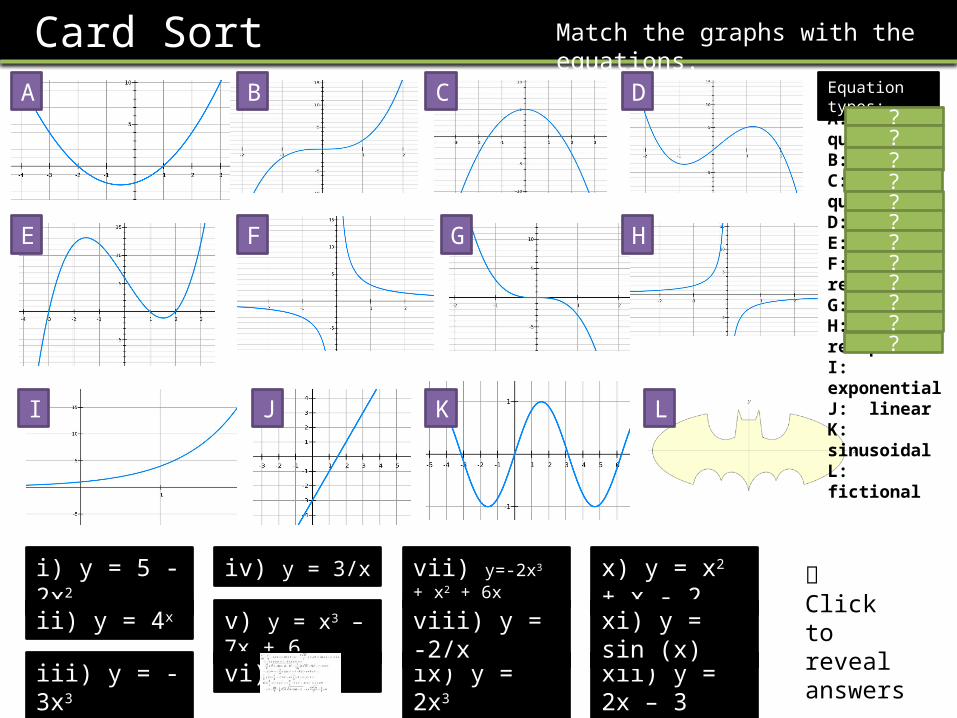
Card Sort Match the graphs with the equations.
A B C D
E F G H
I J K L
x) y = x2 + x - 2
ix) y = 2x3
i) y = 5 - 2x2 vii) y=-2x3 + x2 + 6xiv) y = 3/x
iii) y = -3x3
viii) y = -2/xii) y = 4x
xii) y = 2x – 3
v) y = x3 – 7x + 6 xi) y = sin (x)
vi)
A: quadraticB: cubicC: quadraticD: cubicE: cubicF: reciprocalG: cubicH: reciprocalI: exponentialJ: linearK: sinusoidalL: fictional
Equation types:
????????????
Click to reveal answers.


90 180 270 360
8
1
-1
𝑦=sin 𝑥0 90 180 270 360
0 1 0 -1 0? ? ? ? ?
Click to brosketch
Skill #2: Plotting and recognising trig functions.
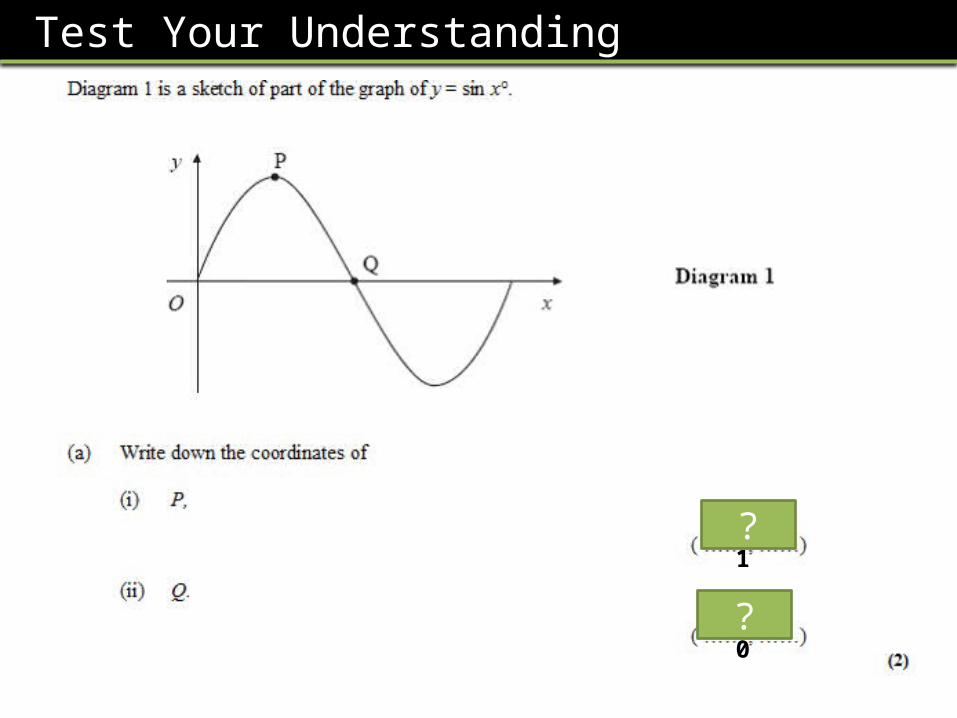
Test Your Understanding
90 1
180 0
?
?

90 180 270 360
8
1
-1
𝑦=cos 𝑥0 90 180 270 360
1 0 -1 0 1? ? ? ? ?
Click to brosketch

Quickfire Coordinates
𝑦=sin 𝑥 𝑦=cos 𝑥 𝑦=sin 𝑥 𝑦=cos 𝑥
𝐴 (270 ,−1 ) 𝐵 (90 ,0 ) 𝐶 (360 ,0 ) 𝐷 (0 ,1 )
𝑦=sin 𝑥 𝑦=cos 𝑥 𝑦=sin 𝑥 𝑦=cos 𝑥
𝐸 (180 ,0 ) 𝐹 (180 ,−1 ) 𝐺 (90,1 ) 𝐻 (270 ,0 )
? ? ? ?
? ? ? ?
𝐴𝐵 𝐶
𝐷
𝐸
𝐹
𝐺 𝐻

SKILL #3: Using graphs to estimate values
The diagram shows the graph of y = x2 – 5x – 3
a) Find the exact value of when .
b) Use the graph to find estimates for the solutions of
(i) x2 – 5x – 3 = 0
(ii) x2 – 5x – 3 = 6
Bro Tip for (b): Look at what value has been substituted into the equation in each case.
a)
b) i) When , then using graph, roughly ii)
?
?
?

Test Your Understanding
The graph shows the line with equation
Find estimates for the solutions of the following equations:
i)
ii) ?
?

90 180 270 360
1
-1
Suppose that Using the graph, find the other solution to
Using a Trig Graph
Q
𝒙=𝟏𝟑𝟓°1
√2 ?
𝟒𝟓 𝟏𝟑𝟓
Suppose that Using the graph, find the other solution to Q
𝒙=𝟑𝟑𝟎°?
We can see by symmetry that the difference between 0 and 45 needs to be the same as the difference between and 180.

90 180 270 360
1
-1
Test Your UnderstandingThe graph shows the line with equation a) Given that , find the other solution to
b) Given that , find the other solution to ?
?

Exercise 1 (on provided sheet)Identify the coordinates of the indicated points.
𝑦=sin 𝑥𝐴
𝐵𝑦=3×2𝑥
𝐶
𝑥2+𝑦2=9
𝐷
𝑦=4𝑥
1
𝐸
𝑨 (𝟗𝟎 ,𝟏 ) 𝑩 (𝟏𝟖𝟎 ,𝟎 )
1
???
??
2 Which of these graphs could have the equation ?
a b c
c, because a is the wrong way up (given term has positive coefficient) and b has the wrong y-intercept.?
Match the graphs to their equations.
i. Eii. Biii. Fiv. Cv. Dvi. A
?
3

-15 -7 -6 1
Reveal
? ?? ?
Exercise 1 (on provided sheet)
4

Exercise 17 Using the cos graph below, and given
that , find all solutions to (other than 45).
Given that , find all solutions to
[Hard] Given , again using the graph, find all solutions to ?
?
b
c
a
The graph shows .
Use the graph to estimate the solution(s) to:i) ii) iii)
The graph shows the line with equation
Use the graph to estimate the solution(s) to: i) ii) iii) By drawing a suitable line onto the graph, estimate the solutions to
5
6
???
???
?

Exercise 1
i) Given , determine all solutions to
ii) Given , determine all solutions to
iii) [Harder] Given , determine the two solutions to (note the minus)
8
?
?
?

(1,7)
(3,175)
The graph shows two points (1,7) and (3,175) on a line with equation:
Determine and (where and are positive constants).
Answer:
Dividing:
Substituting back into 1st equation:?
SKILL #4: Finding constants of
Bro Hint: Substitute the values of the coordinates in to form two equations. You’re used to solving simultaneous equations by elimination – either adding or subtracting. Is there another arithmetic operation?

Test Your Understanding
Given that and are points on the curve , find the value of and .
Given that and are points on the curve where and are positive constants, find the value of and .
Q
N
?
?

Exercise 1 (continued)
Given that the points and lie on the exponential curve with equation , determine and .
Given that the points and lie on the exponential curve with equation , determine and .
Given that the points and lie on the exponential curve with equation , determine and .
Given that the points and lie on the exponential curve with equation , determine and .
9
2
3
4
?
?
?
?