gdt 126 - georgia department of transportation · gdt 126 . test method for determining . the ride...
TRANSCRIPT

GDT 126
TEST METHOD FOR DETERMINING THE RIDE QUALITY AND SMOOTHNESS
OF A PAVEMENT SURFACE USING A ROAD PROFILER
Guidelines and Information on Road Profiler Testing, Calibration, and Smoothness Report Submittals
For The Georgia Department of Transportation
Road Profiler Operator
Office of Materials and Testing 15 Kennedy Drive
2
Forest Park, GA 30297
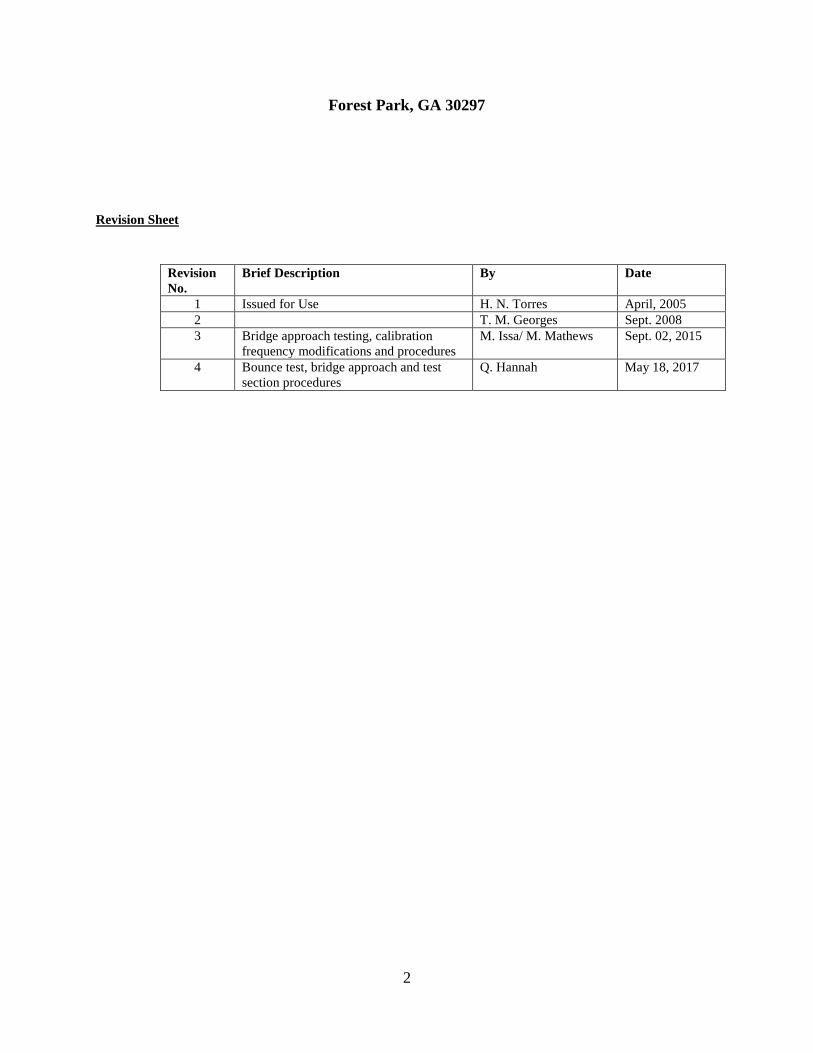
Revision Sheet
Revision No.
Brief Description By Date
1 Issued for Use H. N. Torres April, 2005 2 T. M. Georges Sept. 2008 3 Bridge approach testing, calibration
frequency modifications and procedures M. Issa/ M. Mathews Sept. 02, 2015
4 Bounce test, bridge approach and test section procedures
Q. Hannah May 18, 2017
3
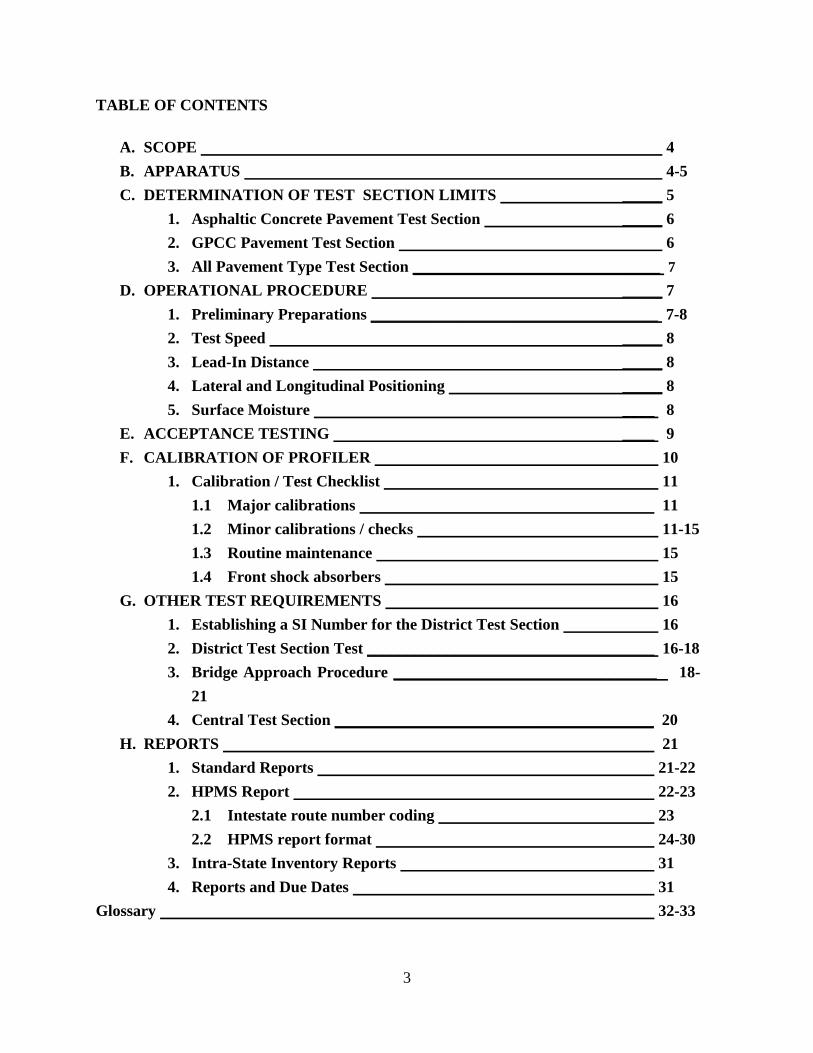
TABLE OF CONTENTS
A. SCOPE 4 B. APPARATUS 4-5 C. DETERMINATION OF TEST SECTION LIMITS _____ 5
1. Asphaltic Concrete Pavement Test Section _____ 6 2. GPCC Pavement Test Section 6 3. All Pavement Type Test Section _______________________________ 7
D. OPERATIONAL PROCEDURE _____ 7 1. Preliminary Preparations ____________________________________ 7-8 2. Test Speed _____ 8 3. Lead-In Distance _____ 8 4. Lateral and Longitudinal Positioning _____ 8 5. Surface Moisture ____ 8
E. ACCEPTANCE TESTING ____ 9 F. CALIBRATION OF PROFILER 10
1. Calibration / Test Checklist 11 1.1 Major calibrations 11 1.2 Minor calibrations / checks 11-15 1.3 Routine maintenance 15 1.4 Front shock absorbers 15
G. OTHER TEST REQUIREMENTS 16 1. Establishing a SI Number for the District Test Section 16 2. District Test Section Test ____________________________________ 16-18 3. Bridge Approach Procedure _________________________________ 18-
21 4. Central Test Section ________________________________________ 20
H. REPORTS 21 1. Standard Reports 21-22 2. HPMS Report 22-23
2.1 Intestate route number coding 23 2.2 HPMS report format 24-30
3. Intra-State Inventory Reports 31 4. Reports and Due Dates 31
Glossary 32-33

4
A. SCOPE
This test method describes the proper procedures for determining the ride quality and smoothness of a paved surface using a laser based, non-contact, height measurement subsystem, herein after referenced as the Road Profiler. The Road Profiler shall be used for testing asphaltic concrete pavement layers, acceptance testing on asphaltic concrete pavement surfaces, and on Ground Portland Cement Concrete (GPCC) pavement surfaces. The equipment manufacturer’s manual and recommendations, together with this document, outline procedures and guidelines for the proper operation, maintenance, and calibration of a Road Profiler. This test method is used in conjunction with the GDOT “Standard Specifications Construction of Transportation Systems” (2013 Edition), Section 400 (Hot Mix Asphaltic Concrete Construction), Section 431 (GPCC), and Section 432 (Milled Asphaltic Concrete Pavement). Other Supplemental Specification or Special Provision items requiring the use of this test method may be added to those listed above.
B. APPARATUS
The Road Profiler is a comprehensive system that is used to collect roadway surface data for determining ride quality (data is used to evaluate the conditions and quality of the newly constructed or resurfaced road). The system performs independently of the housing vehicle characteristics and travel speed. It has the following major components:
• A housing vehicle that is capable of traveling at highway speeds. • A distance measuring subsystem that is accurate to within two feet per one mile (5280 feet) of
distance traveled. • An inertial referencing subsystem capable of measuring the movement of the housing vehicle as it
traverses the pavement section being tested. • A non-contact height measurement subsystem capable of measuring the height from the mounted
sensor faces to the surface of the pavement under test.
The profiler shall have hardware and software capable of generating and storing profiles from each wheel path, by combining the data from the following:
• The inertial referencing subsystem. • The distance measurement subsystem. • The height measurement subsystem.
The road profiler shall be capable of: • Interfacing with the operator. • Controlling all tests. • Measuring the test data. • Recording the data on a Microsoft Windows compatible storage system (i.e., hard drive, portable
storage media, etc.).
5
• Computing (summarizing) the profile elevation data into summary ride quality and smoothness statistics for various section lengths. The default reporting length is one mile.
• Displaying three smoothness values in the post calculation output. These are the International Roughness Index (IRI) based on the quarter car simulation value for each wheel path, and the Half Car Simulation (HCS IRI) for the corresponding sections.
• Profiling and measuring distance values. • Displaying the stored data. • Displaying the road profile plot. • Printing the test results in the field.
The HCS IRI values constitute the basis for acceptance or rejection of pavement ride quality. These values are obtained by taking point-by-point average of the left and right profile and processing the average profile with a quarter car filter (Page 60, Little Book of Profiling, by Michael Sayers and Steven Karamihas).). The HCS IRI values are expressed in the units of millimeter per kilometer (mm/km) which are referred to as the Smoothness Index (SI), and are used for acceptance testing. The road profiler shall be designed as to allow the operator the ability to calibrate both the horizontal distance measurement subsystem and the vertical height measurement (Lasers) subsystem in the field. For consistent pavement profile determination, air pressure inside the tires of the housing vehicle shall be maintained in accordance with vehicle manufacturers’ specification. The vehicle and all system components shall be in good repair and be within the manufacturer’s specifications. The operator of the profiler shall have all tools, manuals, and components necessary, to adjust and operate the profiler according to the manufacturer’s instructions and recommendations.
C. DETERMINATION OF TEST SECTION LIMITS
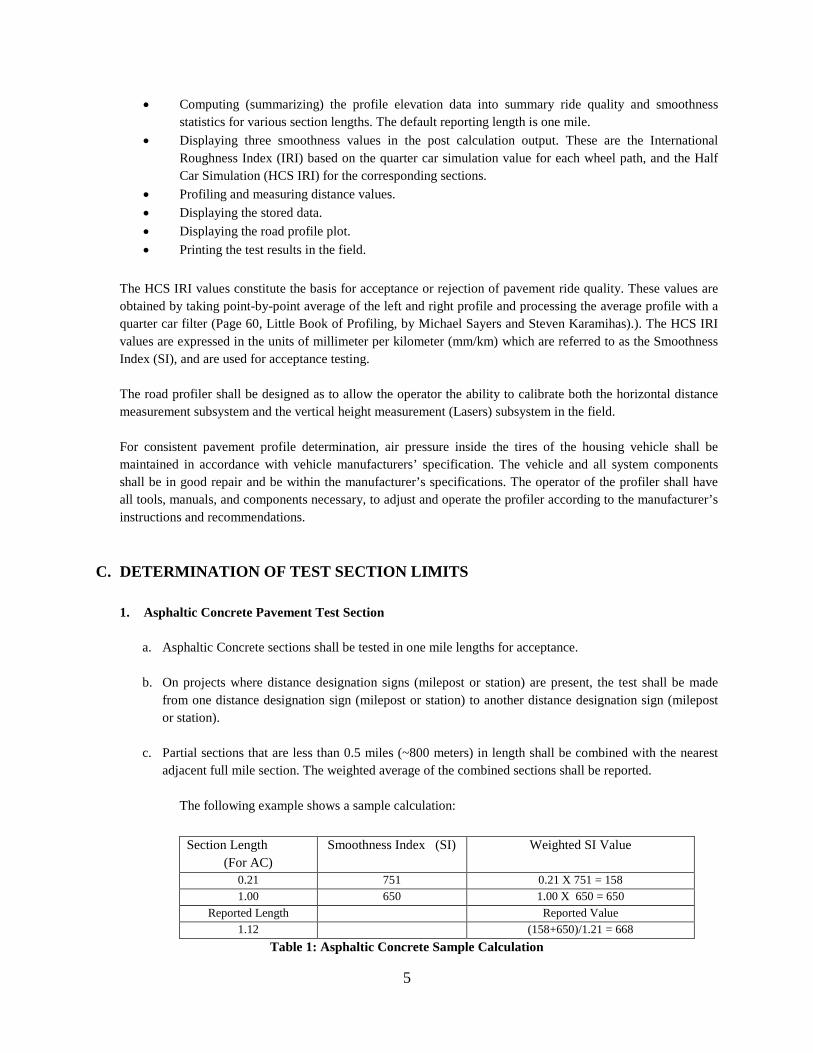
1. Asphaltic Concrete Pavement Test Section
a. Asphaltic Concrete sections shall be tested in one mile lengths for acceptance.
b. On projects where distance designation signs (milepost or station) are present, the test shall be made from one distance designation sign (milepost or station) to another distance designation sign (milepost or station).
c. Partial sections that are less than 0.5 miles (~800 meters) in length shall be combined with the nearest
adjacent full mile section. The weighted average of the combined sections shall be reported.
The following example shows a sample calculation:
Section Length (For AC)
Smoothness Index (SI) Weighted SI Value
0.21 751 0.21 X 751 = 158 1.00 650 1.00 X 650 = 650
Reported Length Reported Value 1.12 (158+650)/1.21 = 668
Table 1: Asphaltic Concrete Sample Calculation
6
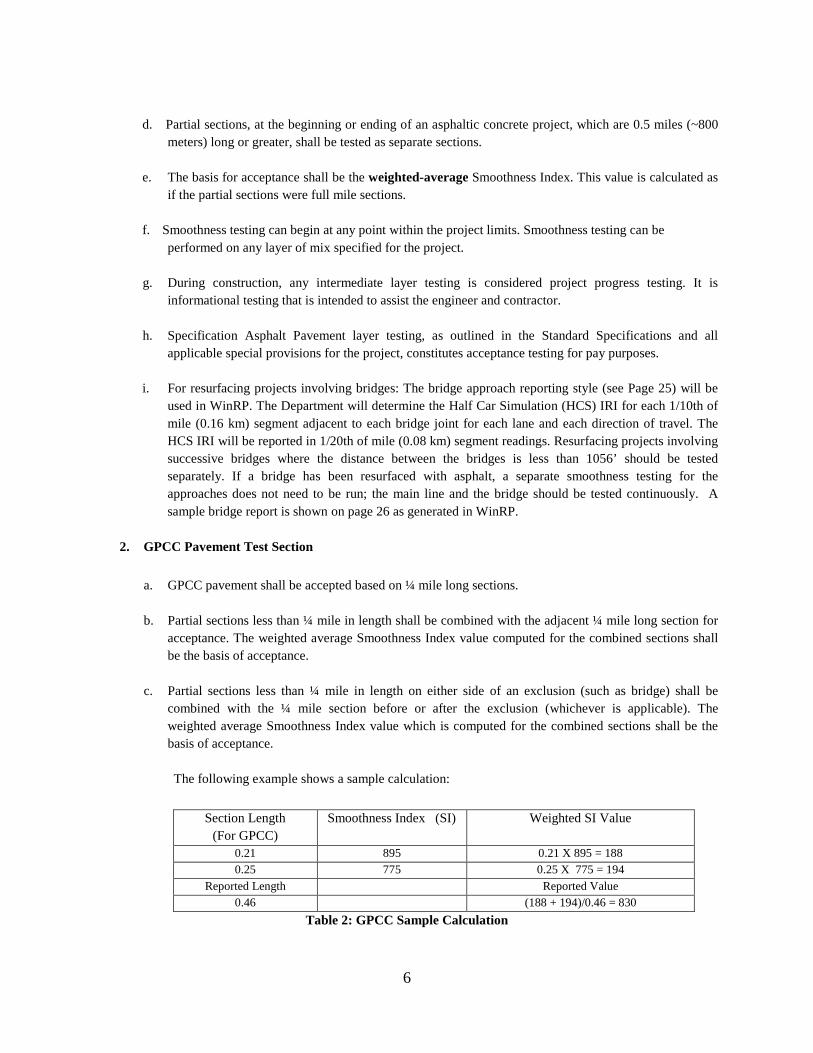
d. Partial sections, at the beginning or ending of an asphaltic concrete project, which are 0.5 miles (~800
meters) long or greater, shall be tested as separate sections.
e. The basis for acceptance shall be the weighted-average Smoothness Index. This value is calculated as if the partial sections were full mile sections.
f. Smoothness testing can begin at any point within the project limits. Smoothness testing can be
performed on any layer of mix specified for the project.
g. During construction, any intermediate layer testing is considered project progress testing. It is informational testing that is intended to assist the engineer and contractor.
h. Specification Asphalt Pavement layer testing, as outlined in the Standard Specifications and all
applicable special provisions for the project, constitutes acceptance testing for pay purposes.
i. For resurfacing projects involving bridges: The bridge approach reporting style (see Page 25) will be used in WinRP. The Department will determine the Half Car Simulation (HCS) IRI for each 1/10th of mile (0.16 km) segment adjacent to each bridge joint for each lane and each direction of travel. The HCS IRI will be reported in 1/20th of mile (0.08 km) segment readings. Resurfacing projects involving successive bridges where the distance between the bridges is less than 1056’ should be tested separately. If a bridge has been resurfaced with asphalt, a separate smoothness testing for the approaches does not need to be run; the main line and the bridge should be tested continuously. A sample bridge report is shown on page 26 as generated in WinRP.
2. GPCC Pavement Test Section
a. GPCC pavement shall be accepted based on ¼ mile long sections.
b. Partial sections less than ¼ mile in length shall be combined with the adjacent ¼ mile long section for acceptance. The weighted average Smoothness Index value computed for the combined sections shall be the basis of acceptance.
c. Partial sections less than ¼ mile in length on either side of an exclusion (such as bridge) shall be
combined with the ¼ mile section before or after the exclusion (whichever is applicable). The weighted average Smoothness Index value which is computed for the combined sections shall be the basis of acceptance.
The following example shows a sample calculation:
Section Length
(For GPCC) Smoothness Index (SI) Weighted SI Value
0.21 895 0.21 X 895 = 188 0.25 775 0.25 X 775 = 194
Reported Length Reported Value 0.46 (188 + 194)/0.46 = 830
Table 2: GPCC Sample Calculation
7
3. All Pavement Type Test Sections
a. On projects where permanent mileposts are not present, such as new construction projects, the project’s section limits shall be established from station numbers.
b. In the above situation, the beginning point shall correspond with the lowest station number, and the
ending point shall correspond to the highest station number on the project.
c. The tested section shall have the same beginning and ending points, in both directions of travel.
d. Reference shall be re-set to an existing milepost, when available during testing. This re-establishes the measured and tested distance, by tying-in with an established milepost.
e. If there are no mileposts or station numbers present, then a tangible land reference shall be used as the
starting point or zero (0.0) point for the initial test and all subsequent tests on the project.
f. When a tangible land reference is used for establishing the zero point, the on-board DMI shall be used to log the length tested. The test shall run in the direction of travel with the zero point being at the south or west-end of the project and increasing north or east.
D. OPERATIONAL PROCEDURE
1. Preliminary Preparations
a. Prior to testing, check all tire pressures for proper inflation. The tire pressure shall be within ± 1.2 psi of the vehicle manufacturer’s recommended pressure for cold using an accurate pressure gauge (ANSI or ASME B 40.1, Grade B, 0-60 psi). The tires shall be checked cold and inflated to the recommended pressure. The profiler shall then be driven 15 minutes prior to performing a distance calibration. The recommended factory tires pressure is located inside the driver door on the post.
b. The faces of the sensors shall be cleaned with a soft rag or towel as needed. Do not use liquids to clean
sensor lenses.
c. Perform the accelerometer test.
d. All other settings, calibrations and operational procedures, shall be in accordance with those set forth here and as stated in the manufacturer’s “Operating Manual.”
e. Prior to measuring the pavement profile, the travel lane to be tested shall be prepared by removing all
debris and other loose materials.
2. Test Speed
a. When measuring the pavement profile, the road profiler shall be operated at a constant speed, if possible.
b. Maintain the speed recommended by the road profiler manufacturer. However, a minimum speed of 15 mph is required for testing and the maximum speed recommended is 68 mph. Failure to maintain this
8
minimum speed causes the system to give an error indication, as it causes the inertial referencing subsystem to “droop,” rendering incorrect pavement profile elevations.
c. Avoid sudden braking or stopping during testing which may result in erroneous test data. Research has indicated that accelerating or decelerating during a profile run can affect the profile data. Either of the above causes a tilt in the accelerometer which induces an error in the long wave lengths that are measured by the profiler.
3. Lead-In Distance
a. The “lead-in distance” refers to the distance prior to the test section that is required in order to collect
accurate profile data.
b. A pre-section length of roadway is required to “settle” the road profiler’s filters in the wheel paths. This “lead-in” distance shall be a minimum of approximately 400 – 500 feet in length and be located immediately before the section of pavement to be tested.
4. If data collection is initiated without a sufficient “lead-in distance,” the data collected at the beginning of the section will be incorrect.Lateral and Longitudinal Positioning
a. The longitudinal lines of the test vehicle travel are normally the wheel paths in each travel lane that
shall be profiled. The road profiler shall be capable of measuring profiles from two longitudinal wheel paths during a single pass, with a fixed wheel path spacing of ~ 69 inches. The lateral sensor spacing of the profiler matches the spacing between the wheel paths that are usually specified in the smoothness specification. The profile operator is to steer the vehicle such that the data are collected along the wheel path within the travel lane.
b. Event markers (Landmarks, Bridges, etc.) shall be stored in the event data file during the testing process. These event markers stored in the data file shall be used to indicate the location of roadway features such as reference markers, stationing, or bridge beginnings and ends.
Consistent lateral positioning of the profiler and the starting point of the section are essential to obtaining repeatable measurements.
5. Surface Moisture
Pavement profiling shall not be performed on wet pavements. A good guideline to follow is not to perform profiling, if traffic is causing the surface water to splash or spray. Profiling of damp pavement is acceptable.
E. ACCEPTANCE TESTING
Acceptance testing shall be performed on the final surface of the roadway and on intermediate pavement courses that are required to meet smoothness criteria. The requirements are set forth in the GDOT “Standard Specifications Construction of Transportation Systems” (2013 Edition) Section 400 for Hot Mix Asphaltic Concrete Construction and any modifications or additions specified in the contract documents. For milled surfaces that are to be left as the final wearing surface, the smoothness requirements are set forth in Section 431
9
for GPCC and Section 432 for Milled Asphaltic Concrete Pavement. For micro milling projects, in addition to the smoothness requirements, the target difference between the ridge and valley (RVD) measurement of the milled surface shall not exceed 1/8 in. (3.2 mm). The target spec is 1/16 in. (1.6 mm).
a. The profile of the surface course shall be tested in the driven wheel paths established by the driving
habits of the motoring public. Due to large trucks and lane crossover, the lateral wander can vary by up to 9 inches on either side of the wheel path.
b. Acceptance testing shall only be performed when the pavement is cleared of any debris or obstructions.
These can impact the accuracy of the test data.
c. Where the traffic conditions or roadway alignment may be hazardous, the contractor shall provide adequate traffic control to ensure the safety of the motoring public and Road Profiler operator.
d. Profile measurement on bridges overlaid with the mainline shall be included in the section being tested. Since there is continuous paving from the mainline across the bridge, it is the contractors' responsibility to ensure a smooth transition from the mainline to the bridge.
e. If a bridge structure that is not to be overlaid lies within the project limits, then it is to be excluded from the calculations.
f. When testing an asphaltic concrete pavement and the data shows that a section has failed, the profiler operator shall repeat the test two more times. If two out of the three sets of test data are equal to or below the specification requirement target, then the section is accepted as “passed.”
g. When testing a milled surface that is to be left as the final wearing surface (GPCC or milled AC pavement) the profiler operator shall run the test three times. If two out of the three sets of test data are equal to or below the specification requirement target, then the section is accepted as “passed.”
h. For failed sections, in addition to the standard report interval for the type of construction (¼ mile
interval report for GPCC, and one mile interval report for asphalt concrete surfaces), the HCS IRI data shall also be computed from the “raw data” files, at a 0.05-mile length interval. These text files shall be provided to the project engineer. The project engineer will address the failing sections (locations) with the contractor.
F. CALIBRATION OF PROFILER
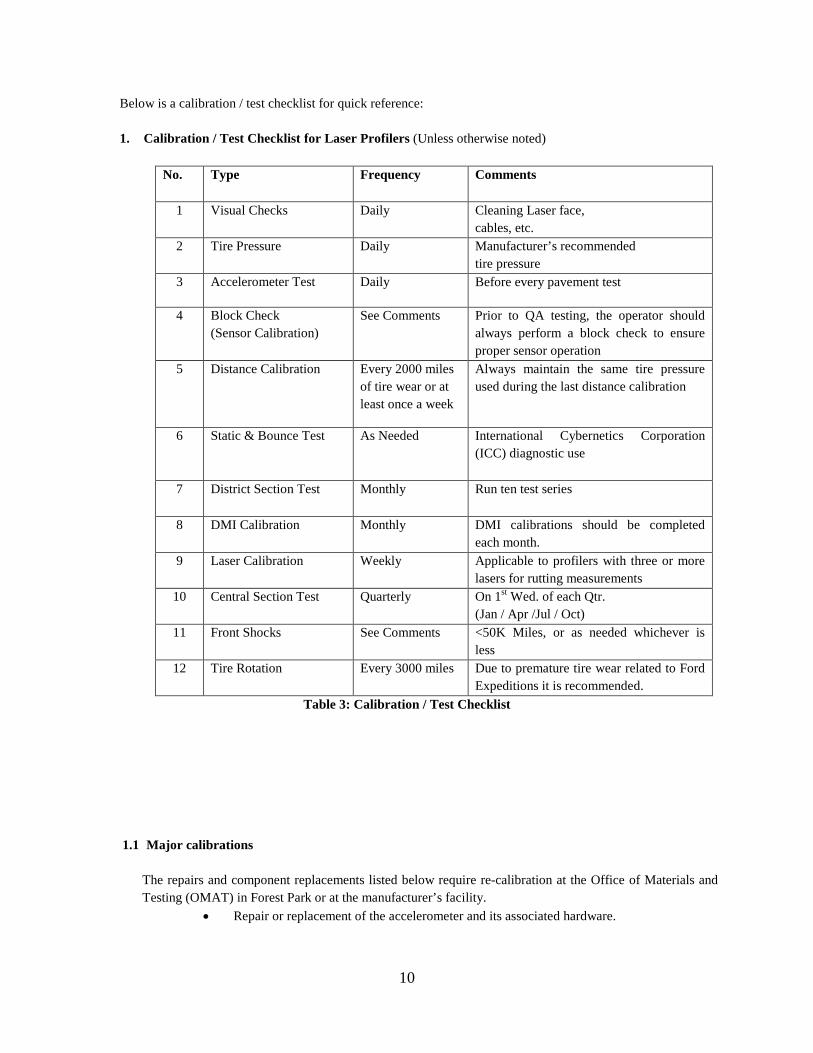
Calibration of the road profiler shall be performed as outlined in this section. Listed in the table below is a summary of various types of calibrations, checks, and/or tests that are required to be performed by each District operator.
The operator of the profiler has a tremendous influence on the quality of profile data. Factors such as lateral positioning and maintaining a constant speed directly affects the measured roughness (smoothness data).
It is the responsibility of a quality conscious operator to maintain the road profiler in top condition by properly following the calibration and other checks mentioned in this manual.
10
Below is a calibration / test checklist for quick reference: 1. Calibration / Test Checklist for Laser Profilers (Unless otherwise noted)
No. Type Frequency Comments
1 Visual Checks Daily Cleaning Laser face,
cables, etc. 2 Tire Pressure Daily Manufacturer’s recommended
tire pressure 3 Accelerometer Test Daily Before every pavement test
4 Block Check
(Sensor Calibration) See Comments Prior to QA testing, the operator should
always perform a block check to ensure proper sensor operation
5 Distance Calibration Every 2000 miles of tire wear or at least once a week
Always maintain the same tire pressure used during the last distance calibration
6 Static & Bounce Test As Needed International Cybernetics Corporation (ICC) diagnostic use
7 District Section Test Monthly Run ten test series
8 DMI Calibration Monthly DMI calibrations should be completed each month.
9 Laser Calibration Weekly Applicable to profilers with three or more lasers for rutting measurements
10 Central Section Test Quarterly On 1st Wed. of each Qtr. (Jan / Apr /Jul / Oct)
11 Front Shocks See Comments <50K Miles, or as needed whichever is less
12 Tire Rotation Every 3000 miles Due to premature tire wear related to Ford Expeditions it is recommended.
Table 3: Calibration / Test Checklist
1.1 Major calibrations
The repairs and component replacements listed below require re-calibration at the Office of Materials and Testing (OMAT) in Forest Park or at the manufacturer’s facility.
• Repair or replacement of the accelerometer and its associated hardware.

11
• Repair or replacement of the non-contact laser light source probe and its associated hardware.
• Repair or replacement of any printed circuit board necessary for the collection of raw sensor data or the processing of the inertial profiles and IRIs.
• Any connections or removal of DMI cables.
The above is not an inclusive list and there may be other cases where major calibrations are required for the profiler.
1.2 Minor calibrations / checks
The operator of the road profiler shall make the following minor calibrations to the system. These include but are not limited to the following:
• Visual Check. • Tire Pressure. • Distance Calibration. • Sensor Calibration (Block Check). • Accelerometer test. • Distance Measurement Instrument (DMI) calibration. • Static and Dynamic (Bounce) tests. • Laser Calibration
a. Visual check
A visual check of the lasers shall be performed. The lenses of the lasers shall be cleaned if dirty. The lasers shall also be checked to ensure that the glass is not chipped. Do not look directly in to the sensors when it is on, since the lasers emit an infrared beam that can damage the eye. Additionally, the operator shall also check to see that if any cables are loose or frayed.
b. Tire pressure
Prior to pavement smoothness testing, check all tire pressures, with a pressure gage, for proper inflation.
The tire pressure shall be within ± 1 psi of the vehicle manufacturer’s recommended tire pressure for cold and warm conditions.
c. Distance calibration
i. The distance calibration window allows entering a Distance Calibration Factor (DCF) directly.
The distance calibration shall be performed on a reasonably straight roadway test section of one mile in length which has been previously measured accurately to within 5 feet using a steel measuring wheel, steel measuring tape, or other suitable method with the same resolution or better. Three calibration runs should be conducted. The beginning and ending points shall be clearly marked. The vehicle shall be driven straight and above 15 mph.
ii. The system will automatically store and process the data that is gathered during the actual
calibration procedure and determine the DCF. At least three separate runs shall be performed to
12
collect the DCF and the average value (displayed) shall be selected. Once the DCF is saved the calibration is complete.
A detailed procedure for distance calibration is outlined in the manufacturer’s “Operating Manual.” This includes calibration tests with targeting and without targeting.
d. Sensor calibration check (Block Check)
Before performing this test, make sure that the mounting of the laser housing is intact and secure. This procedure checks the accuracy of the height sensors on the profiler are working correctly. Three anodized Aluminum blocks (of ¼ inch, ½ inch, and 1 inch) along with a flat plate are used to perform this test.
• Block Check for profilers
i. Position the test vehicle on a smooth, level and flat surface.
ii. Press the New Set button
iii. Position the calibration base plate under the sensor.
iv. Press the Start button
v. If auto stop is enabled, the test stops after the specified number of samples. If Auto Stop is off
you must stop the test using the Stop button. The minimum recommended number of samples is 1000.
vi. Position the next block in the sequence under the same sensor and repeat steps iv. and v. Continue this sequence until the end of the last test for the sensor.
vii. Press the Next Position button. The sensor in the next position is ready to test.
viii. Repeat steps iii through vi.
ix. When the last sensor has been tested, press the Save Set button.
The above tests verify the calibration of the “Gocator” lasers; the sensors can only be calibrated by the manufacturer. A detailed procedure of the sensor check is outlined in the manufacturer’s “Operating Manual.”
• Accelerometer calibration for profilers
i. Position the vehicle on a level area
ii. Press the New button
iii. Press the Start button
13
iv. If Auto Stop is enabled, the test stops after the specified number of samples. If Auto Stop is off
you, must stop the test using the Stop button. The minimum recommended number of samples is 1000.
v. Press the Save button
A detailed procedure of the accelerometer calibration is outlined in the manufacturer’s “Operating Manual.”
e. Static and Dynamic (Bounce) test
This consists of Static and Dynamic (Bounce) tests.
Criteria: IRI from static test for a sensor shall be < 79 mm/km (5 in/mile).
ii. Dynamic (Bounce) test
This test is to verify if the accelerometer and height sensor are working properly.
• A uniform bouncing motion shall be applied at midpoint of the front bumper of the vehicle; bouncing motion shall be a minimum of approximately 1 inch up and 1 inch down.
• Place base plate (received from ICC) below each sensor before bouncing. • Compute IRI from dynamic bounce test output; let test run a minimum of 0.2 miles.
Criteria: IRI from dynamic bounce test shall be < 142 mm/km (9 in/mile). • Static and Dynamic (Bounce) for new profilers
• To perform a static and bounce test:
i. Find a location with as little wind as possible.
ii. Find a location with as little wind as possible.
iii. Do an accelerometer calibration with no one in or leaning on the vehicle.
iv. With E-brake on position the vehicle on a level area like a garage floor or parking lot.
v. (or calibration blocks) Make sure the vehicle is off, in park, and the E-brake is on.
vi. Open the run screen in WinPro.
vii. Do an accelerometer calibration with no one in or leaning on the vehicle.

14
viii. Turn the DMI Simulator on.
ix. Check the simulator speed to see that it is around 35-50 mph. If not, then adjust
accordingly.
x. Turn on the DMI (F3).
xi. Press the reference rest key. (F9).
xii. Let it sit Let it sit statically for at least 0.2 miles worth of data.
xiii. Press the section key (F10) and go to either the front or rear of the vehicle and begin to push down on the bumper in a fluid motion for around 0.5 miles worth of data. .
xiv. Press the (F10) section key and let it sit statically for at least 0.2 miles worth of data.
xv. Press the section key (F10) and then turn the DMI off (F4).
xvi. Export the data to a folder of your choice.
xvii. Open the WinReport program.
xviii. Under the report dropdown box, select bounce test.
xix. Set the Interval to 528 feet and the IRI scale to mm/km.
xx. Process the file. The IRI’s (International Roughness Index) for the bounce portion of the
test should not be higher than .170, and the IRI’s for the static portion of the test should not be higher than .07. If the numbers are higher contact ICC.
xxi. Also, check the graph in WinReport to make sure the accelerometers (red trace) and lasers (yellow trace) are following the same path with minimum deviation.
A detailed procedure of static and dynamic (bounce) test is outlined in the manufacturer’s “Operating Manual.”
f. Laser calibration
• Laser systems composed of two lasers or less do not measure rut depth, therefore calibration is not required.
• Laser systems composed of at least three lasers require weekly calibration to ensure rut depth measurements are accurate.
15
• In order to calibrate a height sensor system, you need to use the calibration bar that was provided with the vehicle.
• To Calibrate the Sensors:
i. Position the vehicle on a level area. Turn the system on and let it warm up for
approximately 10 minutes.
ii. Place the calibration bar so it is under all laser sensors.
iii. Press the New button.
iv. Press the Start button.
v. If Auto Stop is enabled, the test stops after the specified number of samples. If Auto Stop is off, you must stop the test using the Stop button. The minimum recommended number of samples is 1000.
vi. Press the Save button.
A detailed procedure of the laser calibration is outlined in the manufacturer’s “Operating Manual”.
1.3 Routine maintenance The operator of the road profiler shall make minor adjustments to the system. These include but are not limited to the following: a. Replacement of minor components, such as fuses and ink cartridges.
b. Check cable connections, clean laser face, check system power, check laser power (green light), check
inverter power etc.
c. All other settings and adjustments as required by the laser profile manufacturer.
d. Verify that the correct revision of the software has been installed (contact OMAT quarterly).
1.4 Front shock absorbers
It is recommended to replace the front shock absorbers before 50,000 miles or as recommended by the vehicle manufacturer, whichever is less. Poor shock absorbers may result in erroneous profiler data.
G. OTHER TEST REQUIREMENTS
1. Establishing a SI Number for the District Test Section

16
The District operator shall test one asphaltic concrete and one Portland cement concrete test section to establish SI numbers. These sections shall be approximately one mile long. The District operator, along with the OMAT Smoothness Test Engineer shall run the test section with their respective laser road profilers. The test shall be repeated ten times and the average HCS IRI number shall be calculated. The average HCS IRI number calculated from the District operator’s road profiler shall be the SI number for that particular test section.
In the above test series, the result from the OMAT road profiler shall only be used to compare the results. Any anomaly noted shall be addressed by the OMAT personnel.
The above test shall be conducted every year and a new SI number shall be established for each test section. The District operator shall contact the OMAT personnel prior to the commencement of the test series.
2. District Test Section Test
Each District operator shall conduct ten test runs on a previously designated one mile test section within the District. The beginning and ending shall be clearly identified by paint marks, MP, road signs, etc. Each District shall already have a Smoothness Index (SI) number associated with the subject test section (see “Establishing a SI Number for the Test Section” above). If the operator is not sure about this number, he/she may contact the OMAT personnel at Forest Park for assistance. The operator shall have performed all the required calibrations/checks prior to the test run.
Note: The starting point for DMI and reference reset are very critical for repeatability. The operator shall take special care when repeating a test. It is recommended to start the DMI at a fixed point.
If the variation between the ten test results and the test average is more than five percent (5%) and/or the difference between the test average and the established SI number is more or less than five percent (5%), the operator shall notify and forward the ERD files to the OMAT personnel in Forest Park for further analysis.
The operator shall discontinue running any more construction projects, if the results are outside the range described above. The operator shall coordinate with OMAT personnel either to borrow another road profiler and/or seek further assistance. The operator shall also consult with ICC regarding the problem; however, they shall notify OMAT personnel regarding the subject issue.
District operators with more than one test section shall identify one primary test section for weekly runs. Each test section will have its own SI number and the comparison shall be against their respective SI numbers.
17
Example 1: Assume District X’s SI No. is 740 (+ 5% = 777, - 5% = 703)
Test HCS IRI
1 744
2 754
3 750
4 758
5 714
6 748
7 716
8 735
9 725
10 757
AVE 740
5% + 777
5% - 703
Table 4: Example 1 Calibration Runs
18
-Do any of the ten test run results lie outside the ± 5% of the test average number? In the above example, 744, 754, 750, 758, 714, 748, 716, 735, 725, and 757 are all < 777 and > 703 (all ten numbers are within 777 and 703).
In the above example, the road profiler data is within the expected data range and the operator shall continue with the testing.
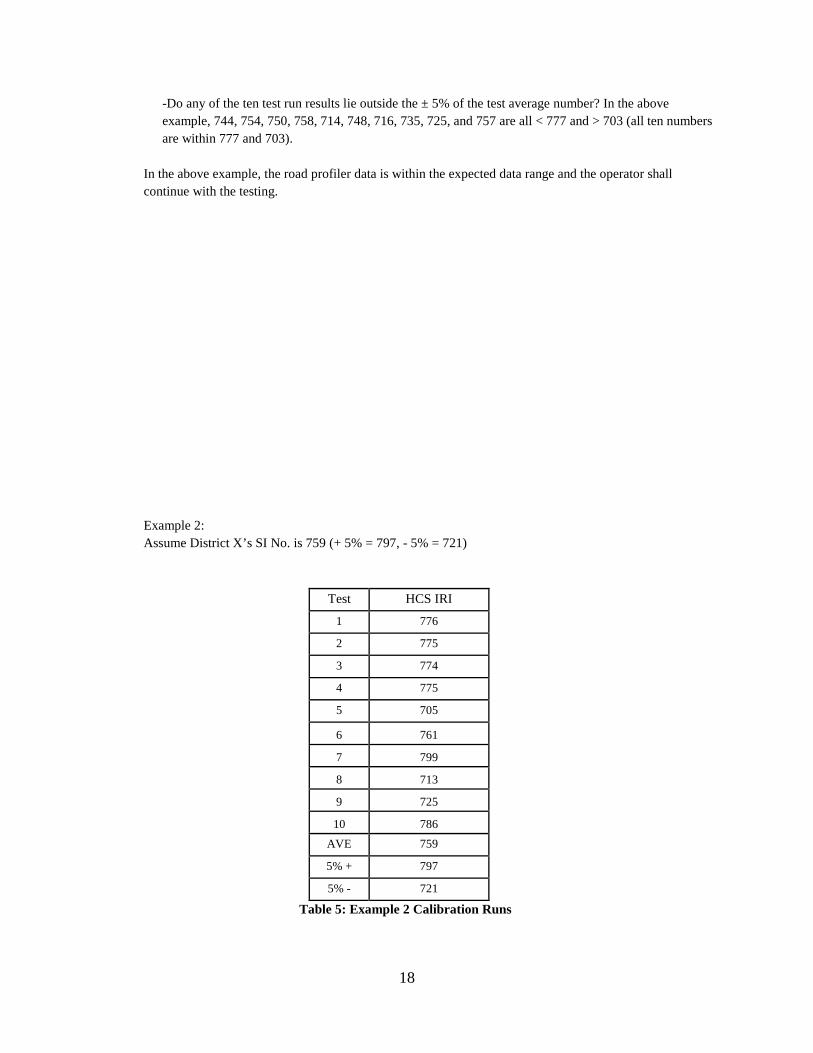
Example 2: Assume District X’s SI No. is 759 (+ 5% = 797, - 5% = 721)
Test HCS IRI
1 776
2 775
3 774
4 775
5 705
6 761
7 799
8 713
9 725
10 786 AVE 759
5% + 797
5% - 721
Table 5: Example 2 Calibration Runs
19
-Do any of the ten test run results lie outside the ± 5% of the test average number? In the above example, 776, 775, 774, 775, 705, 761, 799, 713, 725, and 786 are not all < 797 and > 721 (all ten numbers are not within 797 and 721).
3. In the above example, the road profiler data is not within the expected data range..” It is recommended to repeat the same test sequence and if the result is repeated, the operator shall discontinue any testing and contact OMAT personnel. Bridge Approach
The Bridge Approach report provides roughness information 528 feet before a bridge and 528 feet after a bridge. The procedure for setting the parameter configuration is the same as the Interval Report.
Interval Reporting Options
1. IRI – Selected a. Select average IRI or half car b. Select the scale desired – in/mi, mm/m, or mm/km c. IRI Mov Avg – Not Selected d. QCS Profile – Not Selected
2. Rutting – Not Selected 3. Faulting – Not Selected 4. Filter Options – Select the parameters you would normally select for an IRI Interval
report. 5. Report Controls
a. Section Control – Selected b. Roughness Control – Selected c. Interval Control – Selected d. Interval Reset – Selected
20
e. New Section on RefAdd – NA f. Use Speed File – Selected g. Error Summary – Optional h. Include Error Status – Not Selected i. Include RghOff Data – Not Selected j. Interval – 264 feet k. Spd Limit – Normally 15 mph
6. Event Options – None Selected 7. Profile Interval Control – Optional
Event Processing
First, we must remove all unwanted events and replace the bridge events with bridge system events. All events in the .E## file are removed with the exception of DMI_On, DMI_Off, BrgB (652), BrgE (653), BrgBeg (-133), BrgEnd (-134), and events with BB or BE in the message. The BrgB and events with BB in the message are changed to a BrgBeg system event; the BrgE and events with BE in the message are changed to a BrgEnd system event.
Next, we must establish a 528 foot section at each end of the bridge. We do that by adding a new reference event (RefAdd) -528 feet before the bridge and a section end at the bridge; then we add a section end 528 feet from the end of the bridge and a zero new reference at bridge end. Each section is broken into two 264-foot segments or intervals. So, the section before the bridge runs from -528 feet to 0 feet and the section at the end of the bridge runs from 0 to +528 feet.
Special Conditions
If the distance between two bridges is less than 1056 feet, then the end section of the first bridge will use as much of the distance as required and the second bridge will use what is left. Examples are listed below.
Example 1
21
Delta distance = 928 feet First bridge end section = 528 feet Second bridge beginning section = 400 feet Example 2
Delta distance = 300 feet First bridge end section = 300 feet Second bridge beginning section = 0 feet Note: The bride approach data should be collected at 35 mph on state routes where applicable. The average of each bridge approach or exit is to be used for acceptance.
4. Central Test Section Test
On a quarterly basis, each District operator shall conduct test runs on a designated central test section identified by OMAT personnel. The beginning and ending shall be clearly identified and marked by OMAT personnel. A comparison of all GDOT profilers will be made and the results will be transmitted to all the appropriate District personnel by OMAT Quality Assurance Branch. This test series is not only a comparison between all the State’s road profilers, but also it is a quality assurance check. Prior to collecting smoothness data for the quarterly calibration verification, OMAT personnel shall establish a reference profile for each test section using the Walking Profiler (SurPRO). Ten runs of the candidate profiler shall be made on the designated test section using a highly reflective tape to automatically trigger the starting location of each run of the section. The equipment’s repeatability and accuracy shall be evaluated using the AASHTO R 56 standard.
OMAT personnel in Forest Park will notify each operator of the test. Each operator shall give an electronic copy of the test results and/or other files, such as an ERD file (generated from ICC WinReport), immediately after the tests to the OMAT personnel.
NOTE:
g. Failure to meet the tolerances described above (all calibrations/checks) shall be grounds for taking the
equipment out of service until it can be re-calibrated and/or repaired and re-certified as operable within the tolerances specified above and by the manufacturer.
h. All operators shall follow the frequency of the calibrations listed in the table (page 9); if these differ from
the manufacturer’s operations manual, GDT-126 takes precedence. H. REPORTS
1. Standard Reports
Following are the various types of reports:
22
i. Pre-Construction Report This consists of all tests conducted prior to resurfacing or construction taking place.
ii. Progress Report This consists of all tests conducted during construction but not on the final pavement
surface.
iii. Final Report This report is the test conducted on the final pavement surface (usually the acceptance
test). This may consist of both accepted and failed section reports.
iv. Special Report This is any special runs requested by the District or by OMAT.
v. Monthly Report This is a summary of all the projects that had a final test in the previous month which were
‘accepted.’
vi. Annual Report This is a summary of all the monthly reports for the previous FY (July 1st of previous year
to June 30th of current year). This report shall be issued by July 30 of each year for the previous FY.
vii. Pending Project List Report This is a summary of all the projects that are pending due to failed sections, waiting for
“waiver letter” etc. for the previous FY. This report shall be issued by July 30 of each year for the previous FY.
A summary smoothness statistic shall be computed for each whole mile pavement segment. The smoothness statistics are computed by the on-board computer system after a successful test. The report shall summarize the segments tested and the IRI values computed for each wheel path in those segments. The report also summarizes the HCS IRI values for the respective segment tested.
Acceptance shall be based on the Smoothness Index number. The Smoothness Index number is the HCS IRI values expressed in the units of millimeter per kilometer (unit is pre-selected by the user in the set-up of the program). It is the operator's responsibility to see that all reports are filled out completely and transmitted to the proper contract and construction personnel. Paper reports should be completed daily as work is performed. Forms DOT-554 and DOT-656 or any electronic version that has been reviewed and approved by the OMAT can be used. Additionally, it is the operator's responsibility to send an electronic copy of all approved smoothness runs to the “Pavement Management” mail folder and to the OMAT personnel within 3 business days.
It is essential that project personnel be informed of test results upon completion of tests performed or as early as practicable.
23
All reports shall have the route numbers coded in accordance with the Office of Transportation Data’s (OTD) Road Characteristic (RC) Coding and Procedure’s Manual which is described in more detail under “HPMS Report.”
2. HPMS Report
The Highway Performance Monitoring System (HPMS) is a nationwide inventory system that includes data for all of the Nation's public road mileage as certified by the States' Governors on an annual basis. This includes facilities both on and off State-owned highway systems. Each State is required to furnish annually all data requirements specified in the HPMS Field Manual.
The Federal Highway Administration (FHWA) has the responsibility to assure that adequate highway transportation information is available to support its functions and responsibilities, including those of the Administration and the Congress. The primary purpose of the HPMS is to serve these data and information needs. The HPMS provides data that reflects the extent, condition, performance, use, and operating characteristics of the nation’s highways.
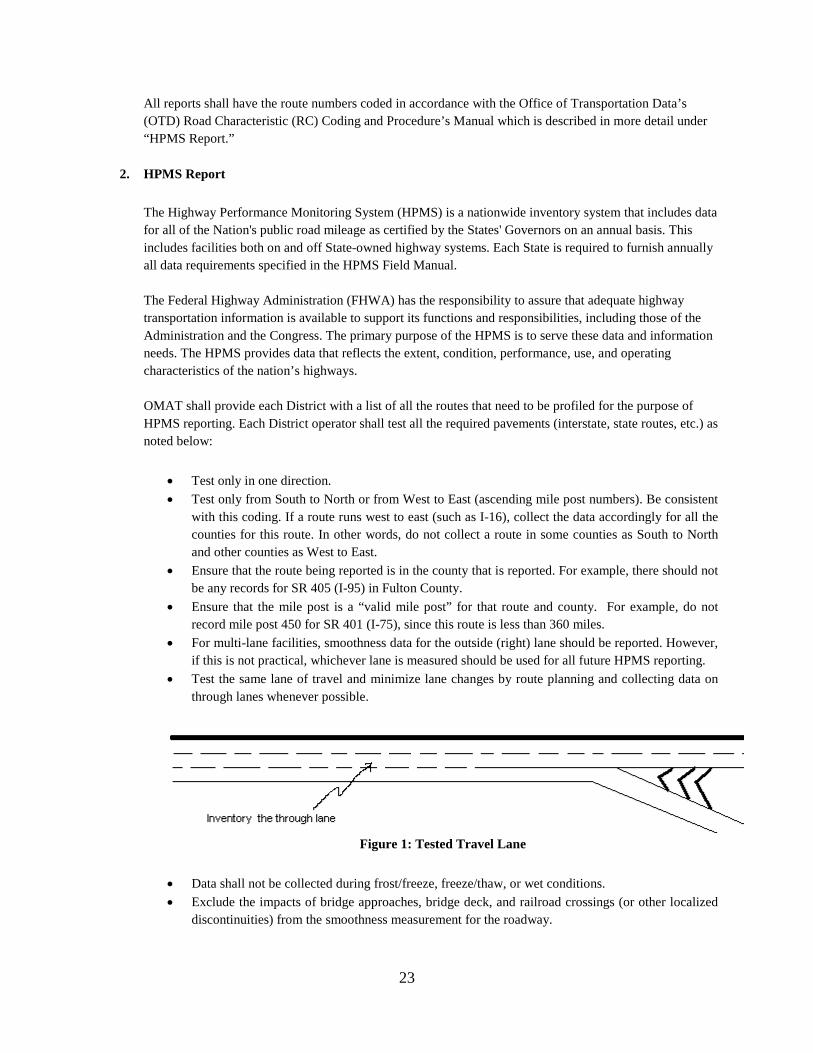
OMAT shall provide each District with a list of all the routes that need to be profiled for the purpose of HPMS reporting. Each District operator shall test all the required pavements (interstate, state routes, etc.) as noted below:
• Test only in one direction. • Test only from South to North or from West to East (ascending mile post numbers). Be consistent
with this coding. If a route runs west to east (such as I-16), collect the data accordingly for all the counties for this route. In other words, do not collect a route in some counties as South to North and other counties as West to East.
• Ensure that the route being reported is in the county that is reported. For example, there should not be any records for SR 405 (I-95) in Fulton County.
• Ensure that the mile post is a “valid mile post” for that route and county. For example, do not record mile post 450 for SR 401 (I-75), since this route is less than 360 miles.
• For multi-lane facilities, smoothness data for the outside (right) lane should be reported. However, if this is not practical, whichever lane is measured should be used for all future HPMS reporting.
• Test the same lane of travel and minimize lane changes by route planning and collecting data on through lanes whenever possible.
Figure 1: Tested Travel Lane
• Data shall not be collected during frost/freeze, freeze/thaw, or wet conditions. • Exclude the impacts of bridge approaches, bridge deck, and railroad crossings (or other localized
discontinuities) from the smoothness measurement for the roadway.
24
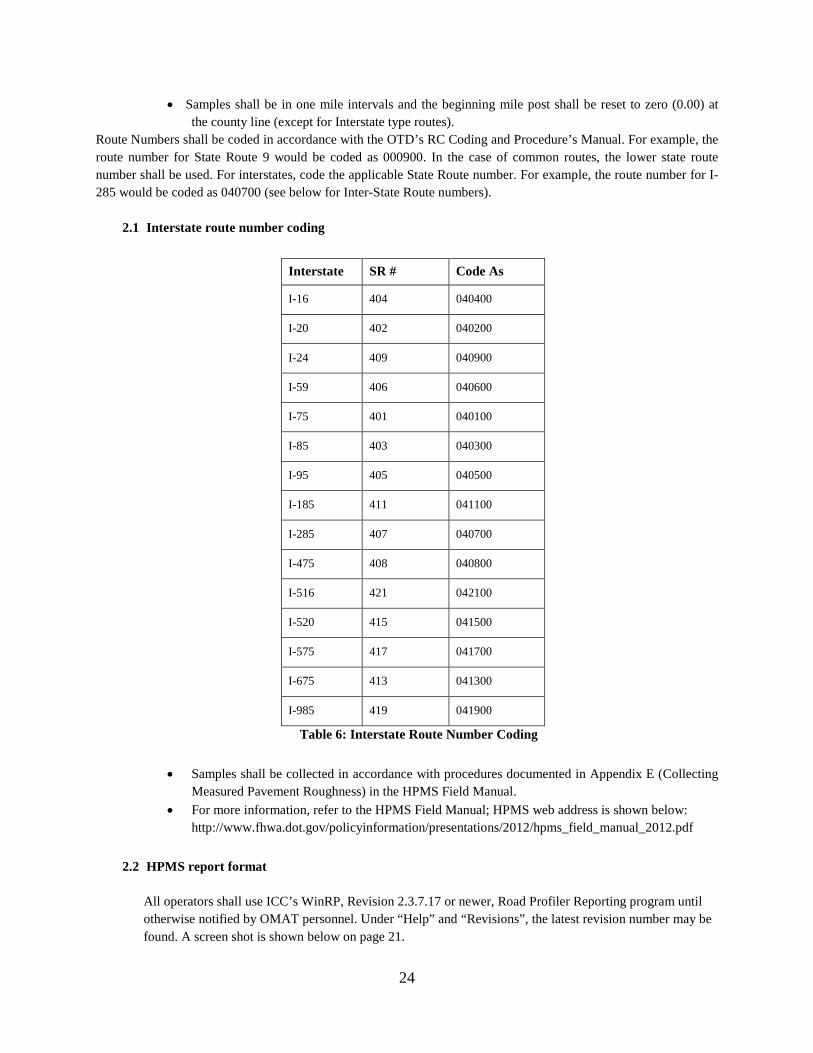
• Samples shall be in one mile intervals and the beginning mile post shall be reset to zero (0.00) at the county line (except for Interstate type routes).
Route Numbers shall be coded in accordance with the OTD’s RC Coding and Procedure’s Manual. For example, the route number for State Route 9 would be coded as 000900. In the case of common routes, the lower state route number shall be used. For interstates, code the applicable State Route number. For example, the route number for I-285 would be coded as 040700 (see below for Inter-State Route numbers).
2.1 Interstate route number coding
Interstate SR # Code As
I-16 404 040400
I-20 402 040200
I-24 409 040900
I-59 406 040600
I-75 401 040100
I-85 403 040300
I-95 405 040500
I-185 411 041100
I-285 407 040700
I-475 408 040800
I-516 421 042100
I-520 415 041500
I-575 417 041700
I-675 413 041300
I-985 419 041900
Table 6: Interstate Route Number Coding • Samples shall be collected in accordance with procedures documented in Appendix E (Collecting
Measured Pavement Roughness) in the HPMS Field Manual. • For more information, refer to the HPMS Field Manual; HPMS web address is shown below:
http://www.fhwa.dot.gov/policyinformation/presentations/2012/hpms_field_manual_2012.pdf 2.2 HPMS report format
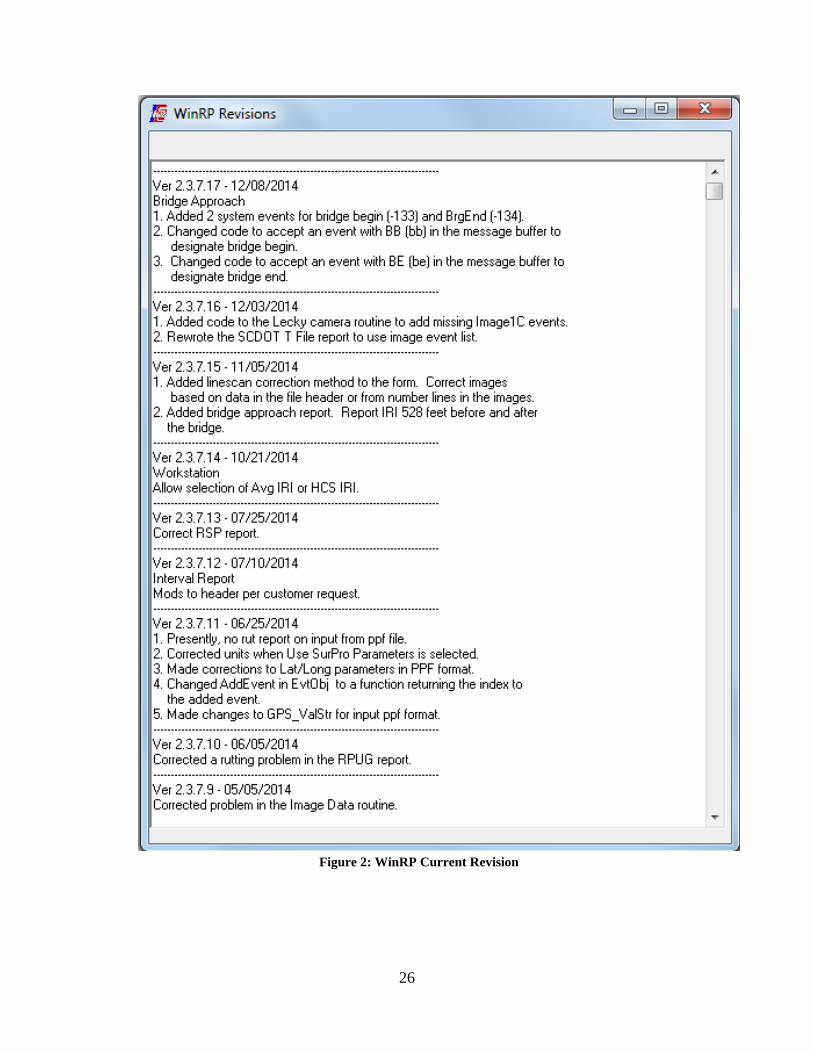
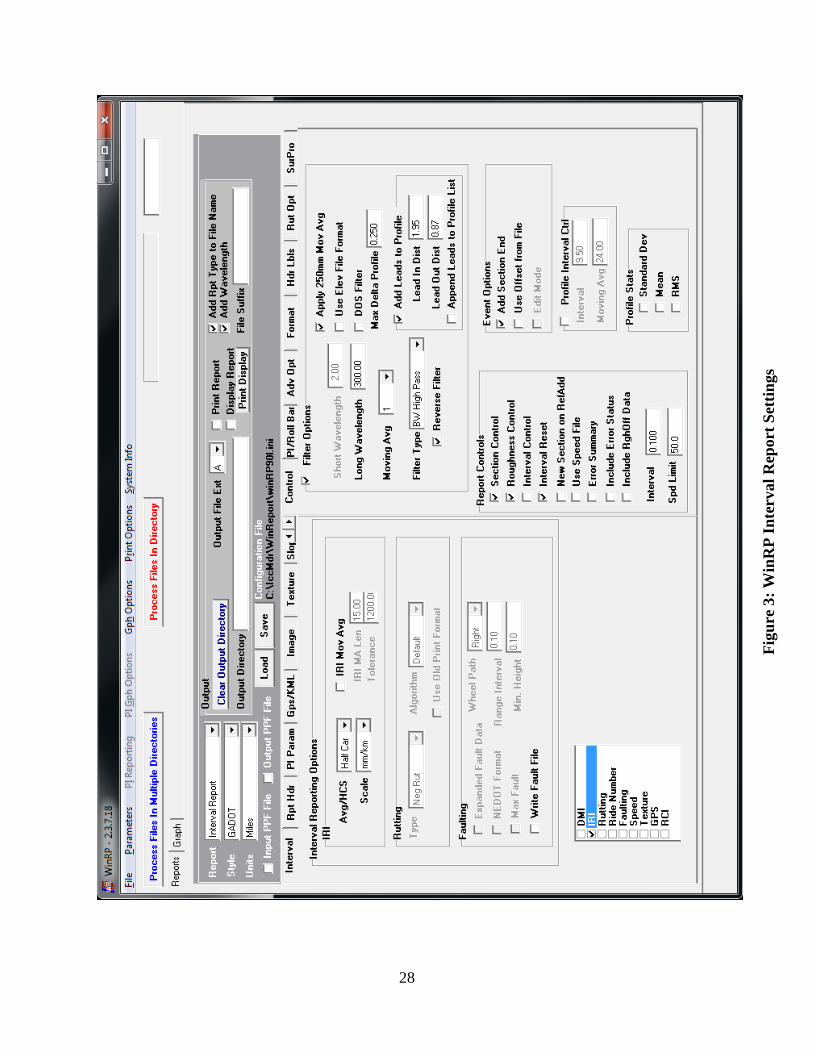
All operators shall use ICC’s WinRP, Revision 2.3.7.17 or newer, Road Profiler Reporting program until otherwise notified by OMAT personnel. Under “Help” and “Revisions”, the latest revision number may be found. A screen shot is shown below on page 21.

25
• The HPMS report when requested by OTD shall be completed each year and a copy of the data
shall be transmitted to OMAT in Forest Park on a storage media by December 15th of each year (unless otherwise instructed by OMAT personnel).
• It is imperative that all operators setup WinRP with the correct settings according to figure 3.
Contact OMAT personnel for assistance. A sample print-out of the data sheet is shown on figure 4.
26
Figure 2: WinRP Current Revision
27
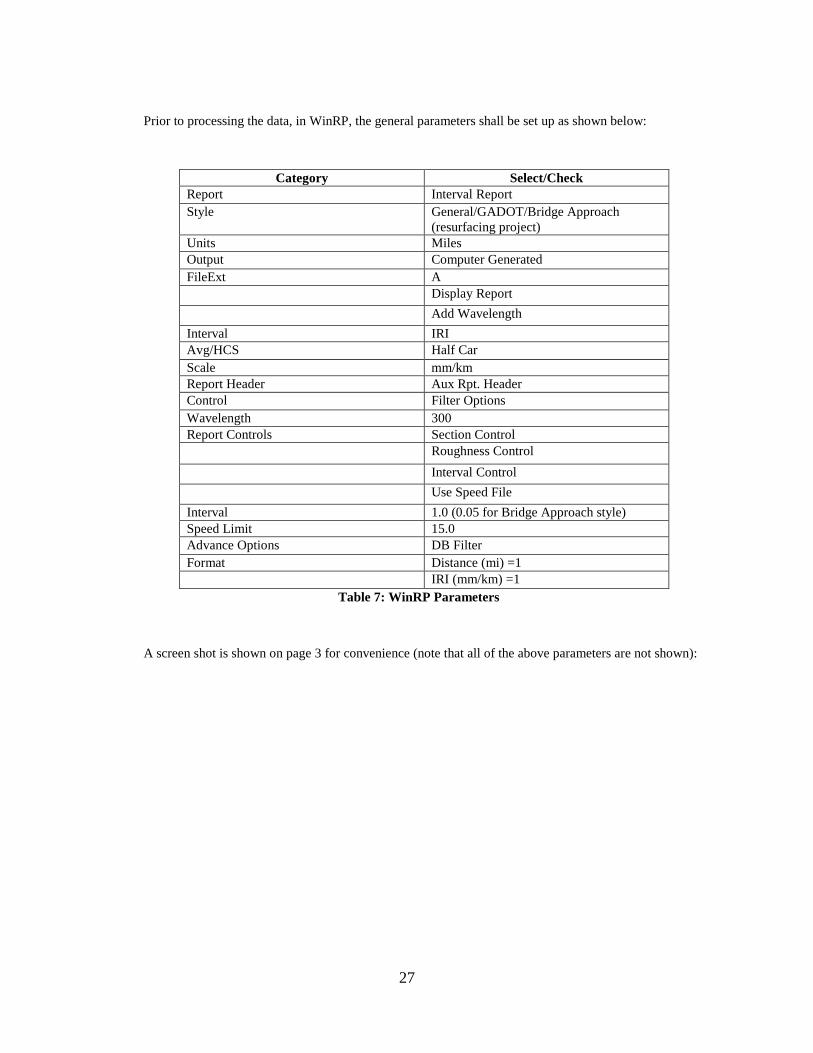
Prior to processing the data, in WinRP, the general parameters shall be set up as shown below:
Category Select/Check
Report Interval Report Style General/GADOT/Bridge Approach
(resurfacing project) Units Miles Output Computer Generated FileExt A Display Report Add Wavelength Interval IRI Avg/HCS Half Car Scale mm/km Report Header Aux Rpt. Header Control Filter Options Wavelength 300 Report Controls Section Control Roughness Control
Interval Control
Use Speed File Interval 1.0 (0.05 for Bridge Approach style) Speed Limit 15.0 Advance Options DB Filter Format Distance (mi) =1 IRI (mm/km) =1
Table 7: WinRP Parameters
A screen shot is shown on page 3 for convenience (note that all of the above parameters are not shown):
28
Figu
re 3
: Win
RP
Inte
rval
Rep
ort S
ettin
gs
29
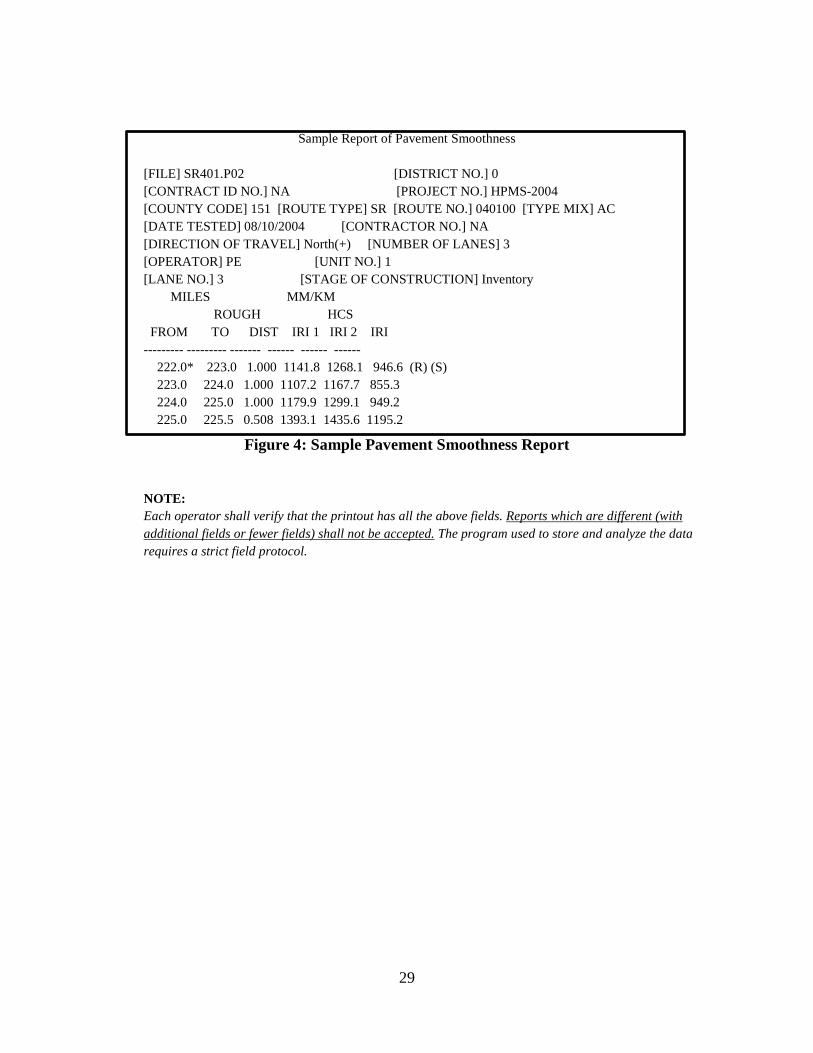
Sample Report of Pavement Smoothness
[FILE] SR401.P02 [DISTRICT NO.] 0 [CONTRACT ID NO.] NA [PROJECT NO.] HPMS-2004 [COUNTY CODE] 151 [ROUTE TYPE] SR [ROUTE NO.] 040100 [TYPE MIX] AC [DATE TESTED] 08/10/2004 [CONTRACTOR NO.] NA [DIRECTION OF TRAVEL] North(+) [NUMBER OF LANES] 3 [OPERATOR] PE [UNIT NO.] 1 [LANE NO.] 3 [STAGE OF CONSTRUCTION] Inventory MILES MM/KM ROUGH HCS FROM TO DIST IRI 1 IRI 2 IRI --------- --------- ------- ------ ------ ------ 222.0* 223.0 1.000 1141.8 1268.1 946.6 (R) (S) 223.0 224.0 1.000 1107.2 1167.7 855.3 224.0 225.0 1.000 1179.9 1299.1 949.2 225.0 225.5 0.508 1393.1 1435.6 1195.2
Figure 4: Sample Pavement Smoothness Report
NOTE: Each operator shall verify that the printout has all the above fields. Reports which are different (with additional fields or fewer fields) shall not be accepted. The program used to store and analyze the data requires a strict field protocol.

30
Figu
re 5
: Win
RP
Inte
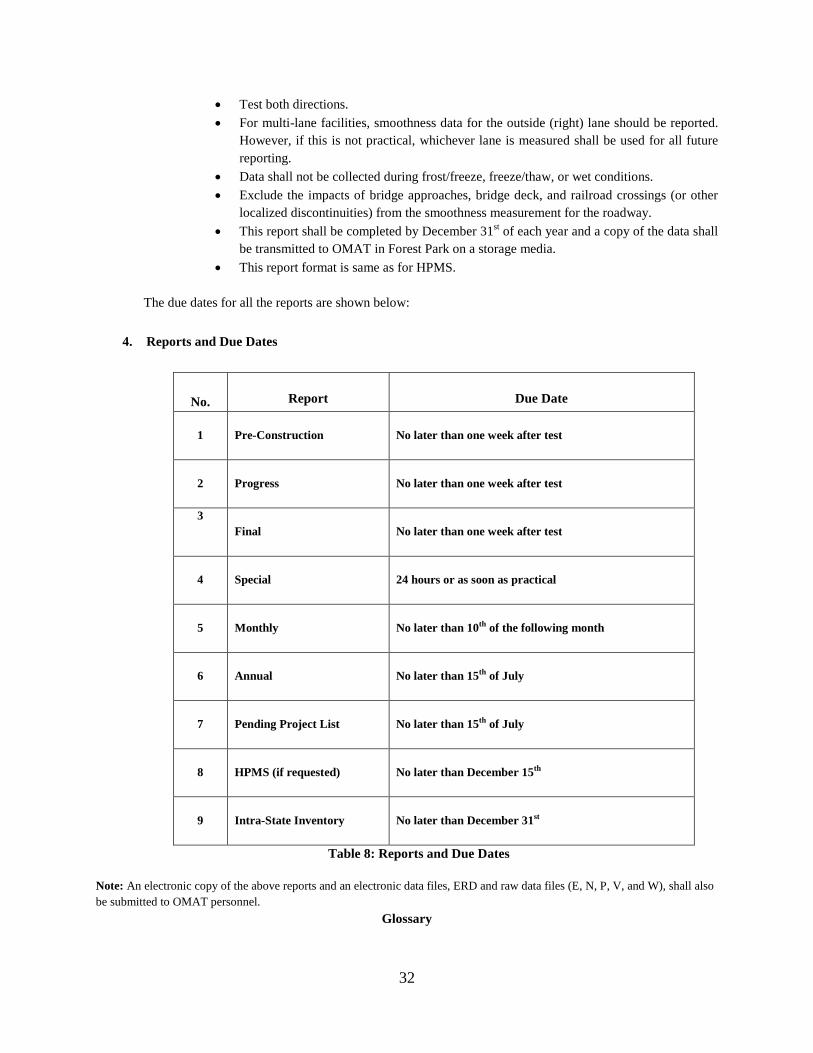
rval
Rep
ort f
or B
ridg
e A
ppro
ach
Sett
ings
31
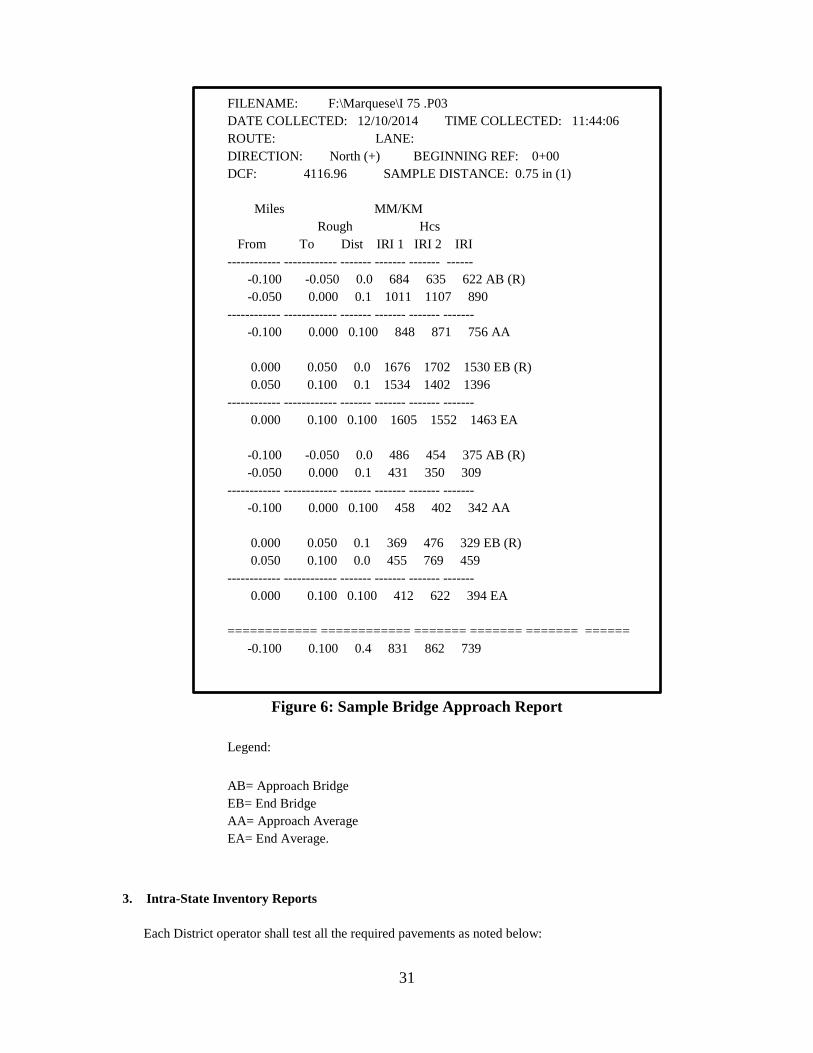
FILENAME: F:\Marquese\I 75 .P03 DATE COLLECTED: 12/10/2014 TIME COLLECTED: 11:44:06 ROUTE: LANE: DIRECTION: North (+) BEGINNING REF: 0+00 DCF: 4116.96 SAMPLE DISTANCE: 0.75 in (1) Miles MM/KM Rough Hcs From To Dist IRI 1 IRI 2 IRI ------------ ------------ ------- ------- ------- ------ -0.100 -0.050 0.0 684 635 622 AB (R) -0.050 0.000 0.1 1011 1107 890 ------------ ------------ ------- ------- ------- ------- -0.100 0.000 0.100 848 871 756 AA 0.000 0.050 0.0 1676 1702 1530 EB (R) 0.050 0.100 0.1 1534 1402 1396 ------------ ------------ ------- ------- ------- ------- 0.000 0.100 0.100 1605 1552 1463 EA -0.100 -0.050 0.0 486 454 375 AB (R) -0.050 0.000 0.1 431 350 309 ------------ ------------ ------- ------- ------- ------- -0.100 0.000 0.100 458 402 342 AA 0.000 0.050 0.1 369 476 329 EB (R) 0.050 0.100 0.0 455 769 459 ------------ ------------ ------- ------- ------- ------- 0.000 0.100 0.100 412 622 394 EA ============ ============ ======= ======= ======= ====== -0.100 0.100 0.4 831 862 739
Figure 6: Sample Bridge Approach Report
Legend: AB= Approach Bridge EB= End Bridge AA= Approach Average EA= End Average.
3. Intra-State Inventory Reports
Each District operator shall test all the required pavements as noted below:
32
• Test both directions. • For multi-lane facilities, smoothness data for the outside (right) lane should be reported.
However, if this is not practical, whichever lane is measured shall be used for all future reporting.
• Data shall not be collected during frost/freeze, freeze/thaw, or wet conditions. • Exclude the impacts of bridge approaches, bridge deck, and railroad crossings (or other
localized discontinuities) from the smoothness measurement for the roadway. • This report shall be completed by December 31st of each year and a copy of the data shall
be transmitted to OMAT in Forest Park on a storage media. • This report format is same as for HPMS.
The due dates for all the reports are shown below:
4. Reports and Due Dates
No.
Report
Due Date
1
Pre-Construction
No later than one week after test
2
Progress
No later than one week after test
3 Final
No later than one week after test
4
Special
24 hours or as soon as practical
5
Monthly
No later than 10th of the following month
6
Annual
No later than 15th of July
7
Pending Project List
No later than 15th of July
8
HPMS (if requested)
No later than December 15th
9
Intra-State Inventory
No later than December 31st
Table 8: Reports and Due Dates
Note: An electronic copy of the above reports and an electronic data files, ERD and raw data files (E, N, P, V, and W), shall also be submitted to OMAT personnel.
Glossary
33
Accelerometer is a transducer that measures acceleration and velocity. Filtering is a procedure to extract information that would be of interest such as in the calculation of a profile. Digital filtering is a calculation procedure that takes one set of numbers and transforms them into another set. Moving average is an example of such a filter. Index is a measure or standard. Within the context of this test method, a suitably chosen index quantifies the ride quality of a pavement. Infrared sensor is a non-contacting transducer that measures the height of the traveled surface relative to the reference plane. Sensors are placed at a specified height, or standoff, above the roadway surface when the test vehicle is in the static position. IRI describes profile roughness that causes vehicle vibrations; it is a specific mathematical transform of a true profile. Low-Pass filtering is a smoothing type filter. When using low-pass filtering, the smoothed profile shows more of the general features of the roadway; such as, it is going up, down, or staying level. Measurement range is the detectable range of heights, measurable by the sensor. New Profilers are those equipped with five laser system, two of which are Gocator lasers. They are capable of measuring rutting, pavement profile, and Ridge to Valley Depth (RVD). Profile is a two-dimensional slice of the roadway surface, taken along an imaginary line, such as the wheel path, in the longitudinal or travel direction. It represents the perpendicular deviations of the pavement surface from an established reference parallel to the horizontal. OMAT is the Office of Materials and Testing located in Forest Park. Reference Plane is the imaginary plane formed by the infrared sensors and the reference horizontal line in a static mode. Repeatability is consistency in successive measurements of the same quantity over time. It is a quantifier of the variability in measurement error. Roughness is the deviation of the roadway surface from a true horizontal surface, due to surface finish, aggregate texture, the underlying layers etc. All of those properties induce vibrations in traveling vehicles contributing to the roughness (or lack of smoothness) of the traveled surface being evaluated. Sensors or Lasers are devices that measure quantities. They are responsive to a change such as in elevation or height or any other quantity being measured. SI Number is the Smoothness Index Number (GDOT uses the HCS IRI value).

34
SurPro is a class I walking profiler for measuring surface profile and roughness characteristics of pavements. It is used by GDOT to verify the calibration of its high speed laser profilers.