gear development by reverse engineering
DESCRIPTION
gear is manufacturing by reverse engineeringTRANSCRIPT
SPUR GEAR DEVELOPMENT USING RAPID PROTOTYPING BY REVERSE ENGINEERING
ABSTRACT:
This project is about application of reverse engineering. Reverse engineering helps in obtaining
the geometry of part or product which is not available otherwise. Its application makes it possible
to reconstruct the original component with its drawing and manufacturing process. It is used in
various fields but here the main application is related to broken Gear. In this present work a
broken tooth of gear of two wheeler bike has been taken. Currently this part is not available in
the market and drawing of the component does not exist. As the part is no longer available it has
to be made in-house so it will require all activities from designing to rapid prototyping. The
procedure includes various stages which will help understand the different phases of reverse
engineering.
The process starts with understanding the reverse engineering procedure. The part
geometry is first obtained with the help of scanning technology. Then with the use of
SOLIDWORKS SCAN TO 3D option the three-dimensional model of the spur gear is obtained.
Once the CAD model is obtained, the part is analyzed using SOLID WORKS simulation tool by
applying alloy steel material and by varying face width of the Gear. The stresses induced will be
low as the face width of gear increases. After the analysis, the pattern of the part is obtained
using Rapid prototyping machine. This can be used for Machining/ casting of the original part.
INTRODUCTION TO REVERSE ENGINEERING
In today’s intensely competitive global market, product enterprises are constantly seeking
new ways to shorten lead times for new product developments that meet all customer
expectations. In general, product enterprise has invested in CAD/CAM, rapid prototyping, and a
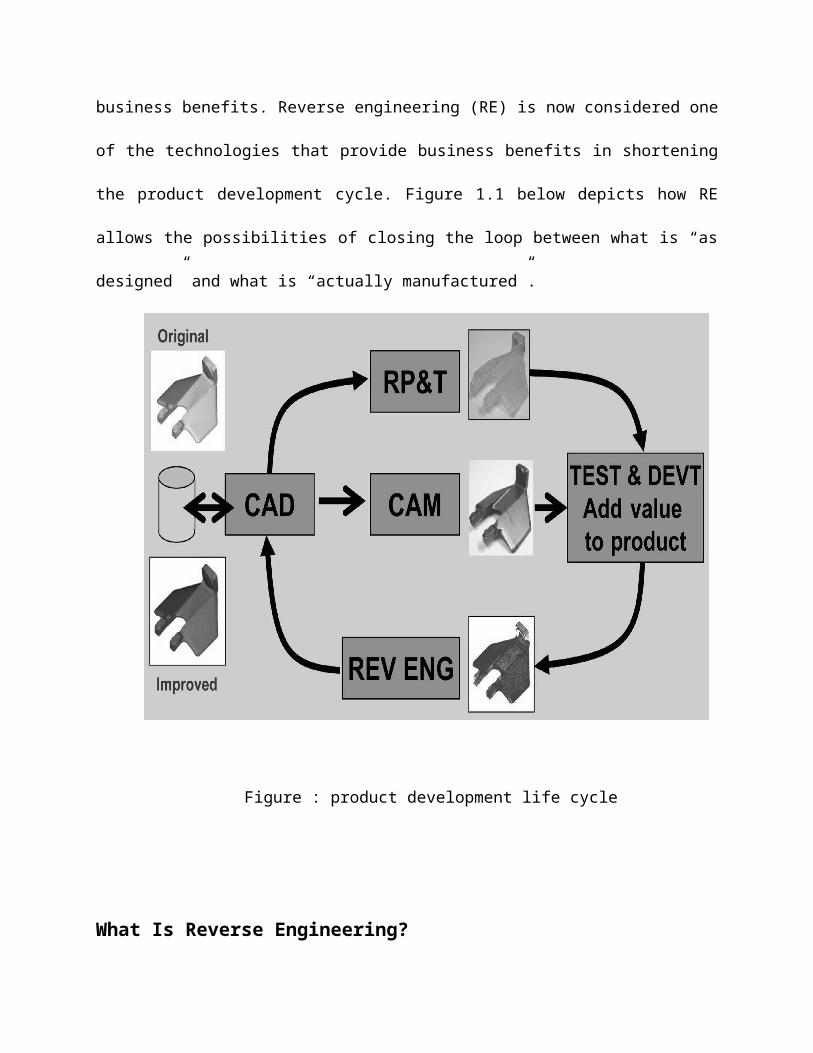
range of new technologies that provide business benefits. Reverse engineering (RE) is now
considered one of the technologies that provide business benefits in shortening the product
development cycle. Figure 1.1 below depicts how RE allows the possibilities of closing the loop
between what is “as designed” and what is “actually manufactured”.
Figure : product development life cycle
What Is Reverse Engineering?
Engineering is the process of designing, , assembling, manufacturing and maintaining products
and systems. There are two types of engineering, forward engineering and reverse engineering.
Forward engineering is the traditional process of moving from high-level abstractions and logical
designs to the physical implementation of a system. In some situations, there may be a physical
part/ product without any technical details, such as drawings, bills-of-material, or without
engineering data. The process of duplicating an existing part, subassembly, or product, without
drawings, documentation, or a computer model is known as reverse engineering. Reverse
engineering is also defined as the process of obtaining a geometric CAD model from 3-D points
acquired by scanning/ digitizing existing parts/products.
The process of digitally capturing the physical entities of a component, referred to as
reverse engineering (RE), is often defined by researchers with respect to their specific task
(Motavalli & Shamsaasef 1996). Abella et al. (1994) described RE as, “the basic concept of
producing a part based on an original or physical model without the use of an engineering
drawing”. Yau et al.(1993) define RE, as the “process of retrieving new geometry from a
manufactured part by digitizing and modifying an existing CAD model”. Reverse engineering is
now widely used in numerous applications, such as manufacturing, industrial design, and jewelry
design and reproduction For example, when a new car is launched on the market, competing
manufacturers may buy one and disassemble it to learn how it was built and how it works. In
software engineering, good source code is often a variation of other good source code. In some
situations, such as automotive styling, designers give shape to their ideas by using clay, plaster,
wood, or foam rubber, but a CAD model is needed to manufacture the part. As products become
more organic in shape, designing in CAD becomes more challenging and there is no guarantee
that the CAD representation will replicate the sculpted model exactly.
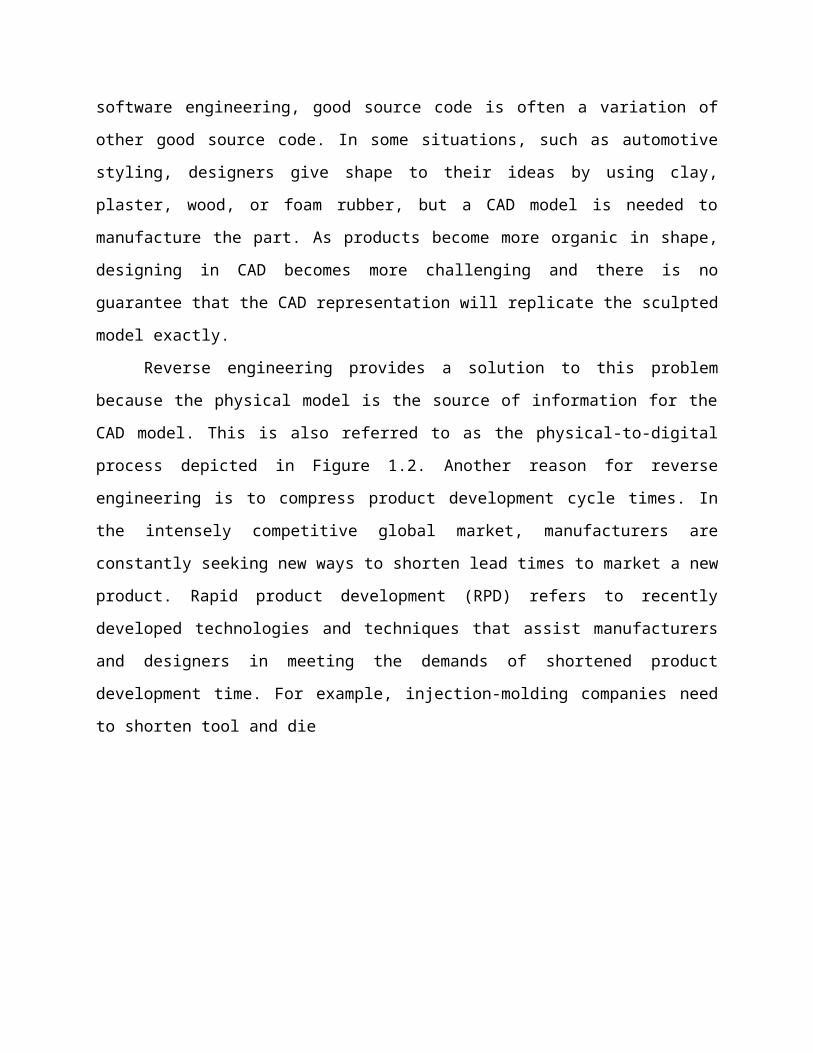
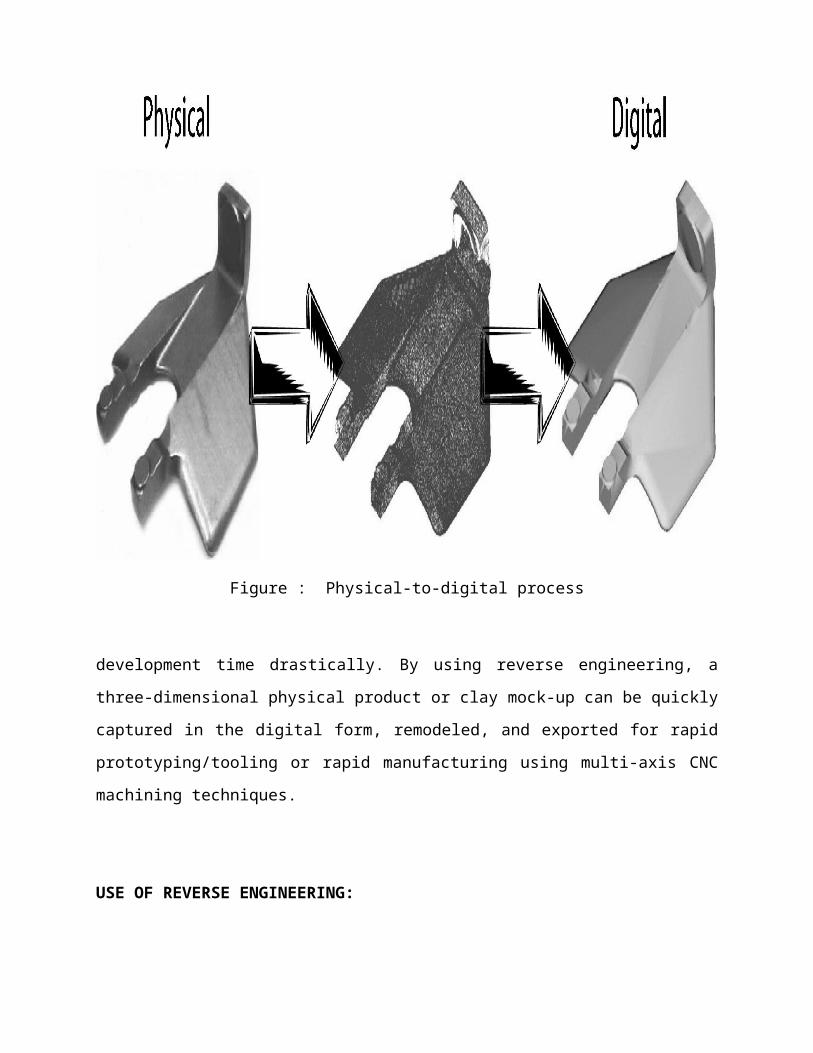
Reverse engineering provides a solution to this problem because the physical model is the
source of information for the CAD model. This is also referred to as the physical-to-digital
process depicted in Figure 1.2. Another reason for reverse engineering is to compress product
development cycle times. In the intensely competitive global market, manufacturers are
constantly seeking new ways to shorten lead times to market a new product. Rapid product
development (RPD) refers to recently developed technologies and techniques that assist
manufacturers and designers in meeting the demands of shortened product development time.
For example, injection-molding companies need to shorten tool and die
Figure : Physical-to-digital process
development time drastically. By using reverse engineering, a three-dimensional physical
product or clay mock-up can be quickly captured in the digital form, remodeled, and exported for
rapid prototyping/tooling or rapid manufacturing using multi-axis CNC machining techniques.
USE OF REVERSE ENGINEERING:
Following are some of the reasons for using reverse engineering:
• The original manufacturer no longer exists, but a customer needs the product, e.g., aircraft
spares required typically after an aircraft has been in service for several years.
• The original manufacturer of a product no longer produces the product, e.g., the original
product has become obsolete.
• The original product design documentation has been lost or never existed.
• Creating data to refurbish or manufacture a part for which there are no CAD data, or for which
the data have become obsolete or lost.
• Inspection and/or Quality Control–Comparing a fabricated part to its CAD description or to a
standard item.
• Some bad features of a product need to be eliminated e.g., excessive wear might indicate where
a product should be improved.
• Strengthening the good features of a product based on long-term usage.
• Analyzing the good and bad features of competitors’ products.
• Exploring new avenues to improve product performance and features.
• Creating 3-D data from a model or sculpture for animation in games and movies.
• Creating 3-D data from an individual, model or sculpture to create, scale, or reproduce artwork.
• Architectural and construction documentation and measurement.
• Fitting clothing or footwear to individuals and determining the anthropometry of a population.
• Generating data to create dental or surgical prosthetics, tissue engineered body parts, or for
surgical planning.
• Documentation and reproduction of crime scenes.
The above list is not exhaustive and there are many more reasons for using reverse
engineering, than documented above.
REVERSE ENGINEERING –THE GENERIC PROCESS:
The generic process of reverse engineering is a three-phase process as depicted in Figure 1.3.
The three phases are scanning, point processing, and application specific geometric model
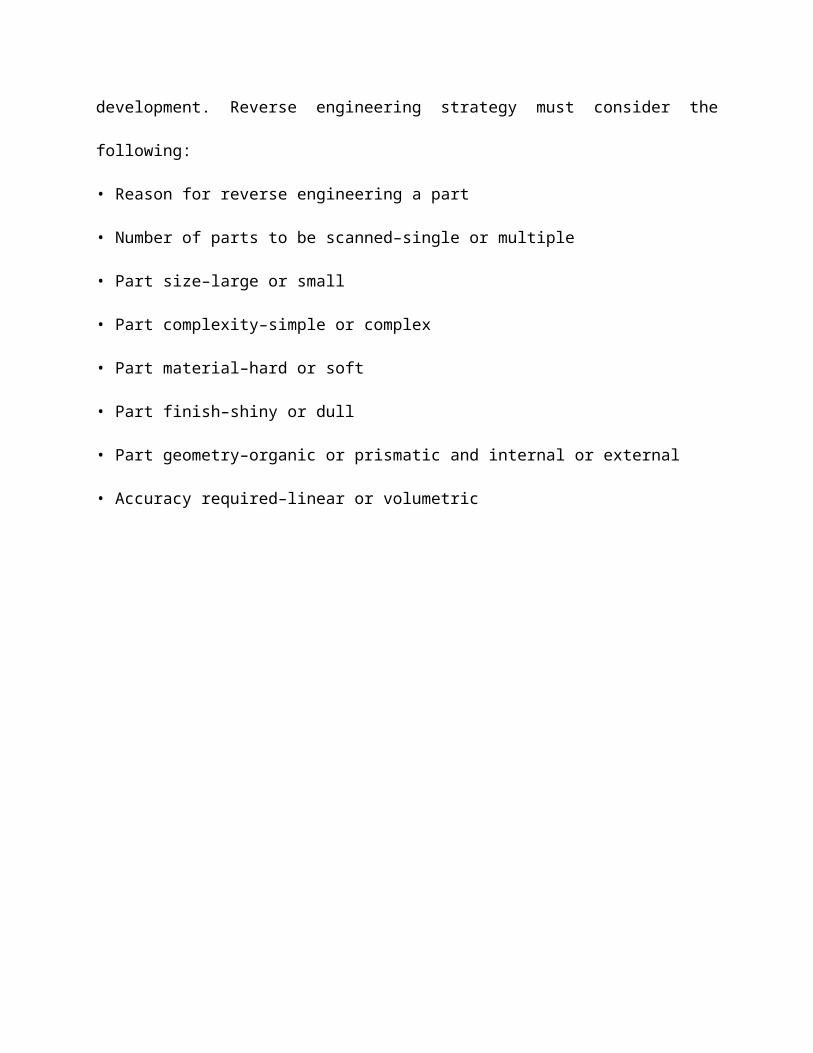
development. Reverse engineering strategy must consider the following:
• Reason for reverse engineering a part
• Number of parts to be scanned–single or multiple
• Part size–large or small
• Part complexity–simple or complex
• Part material–hard or soft
• Part finish–shiny or dull
• Part geometry–organic or prismatic and internal or external
• Accuracy required–linear or volumetric
Figure : Reverse engineering – the generic process
Phase 1– Scanning:
This phase is involved with the scanning strategy–selecting the correct scanning technique,
preparing the part to be scanned, and performing the actual scanning to capture information that
describes all geometric features of the part such as steps, slots, pockets, and holes. Three-
dimensional scanners are employed to scan the part geometry, producing clouds of points, which
define the surface geometry. These scanning devices are available as dedicated tools or as add-
ons to the existing computer numerically controlled (CNC) machine tools. There are two distinct
types of scanners, contact and noncontact.
a. Contact Scanners
These devices employ contact probes that automatically follow the contours of a physical surface
.In the current market place, contact probe.
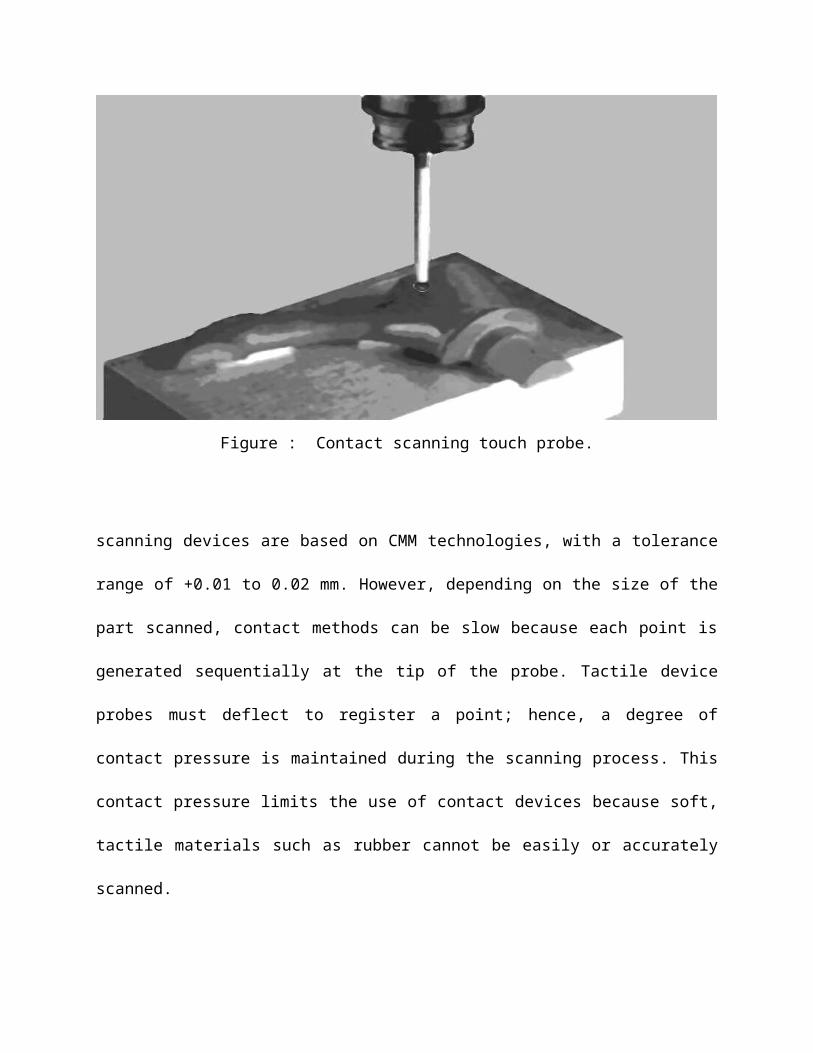
Figure : Contact scanning touch probe.
scanning devices are based on CMM technologies, with a tolerance range of +0.01 to 0.02 mm.
However, depending on the size of the part scanned, contact methods can be slow because each
point is generated sequentially at the tip of the probe. Tactile device probes must deflect to
register a point; hence, a degree of contact pressure is maintained during the scanning process.
This contact pressure limits the use of contact devices because soft, tactile materials such as
rubber cannot be easily or accurately scanned.
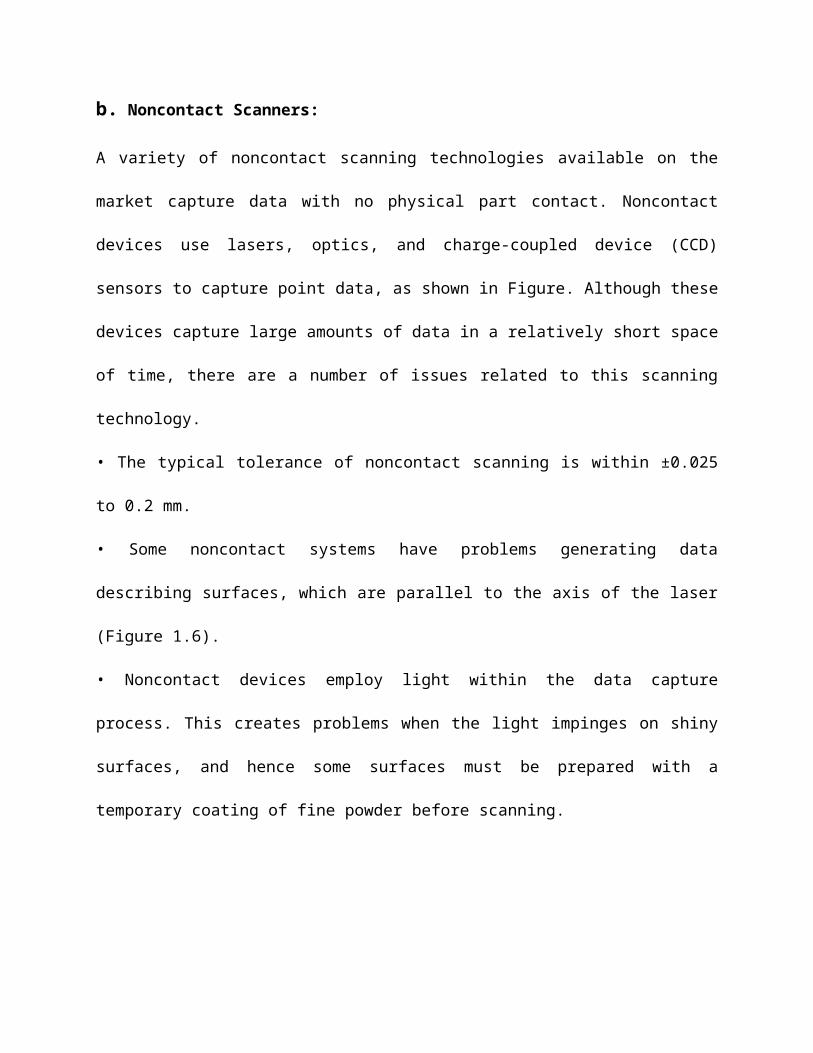
b. Noncontact Scanners:
A variety of noncontact scanning technologies available on the market capture data with no
physical part contact. Noncontact devices use lasers, optics, and charge-coupled device (CCD)
sensors to capture point data, as shown in Figure. Although these devices capture large amounts
of data in a relatively short space of time, there are a number of issues related to this scanning
technology.
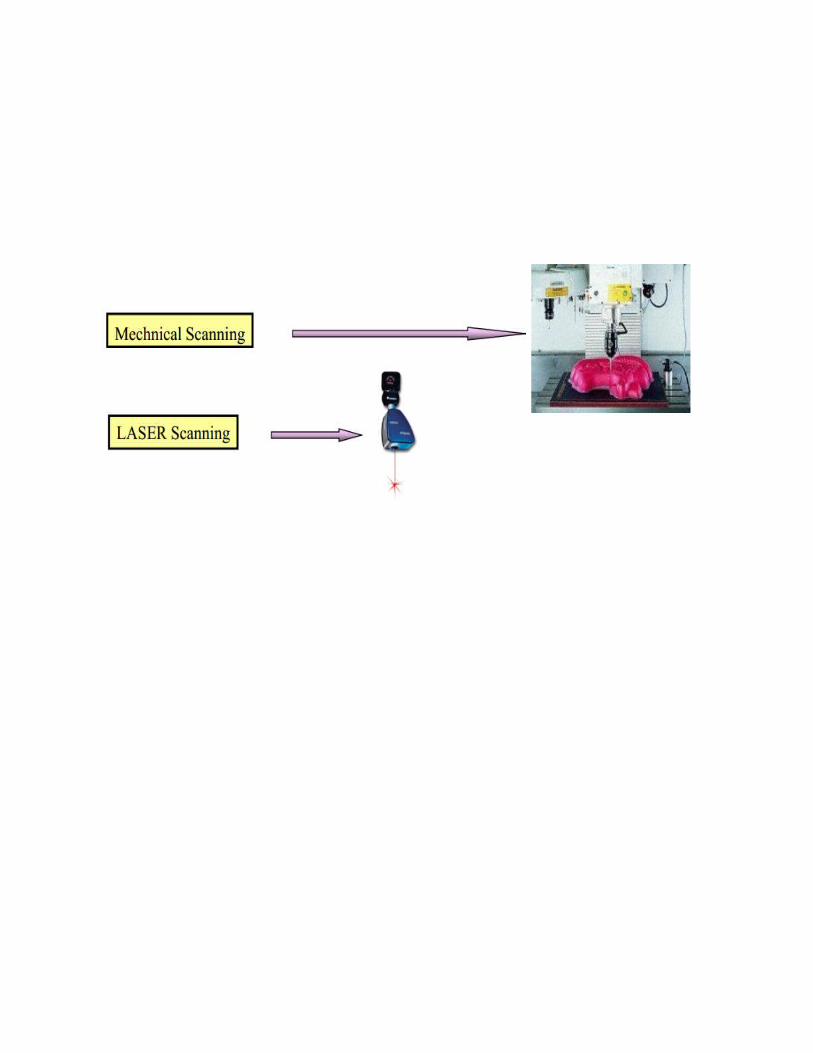
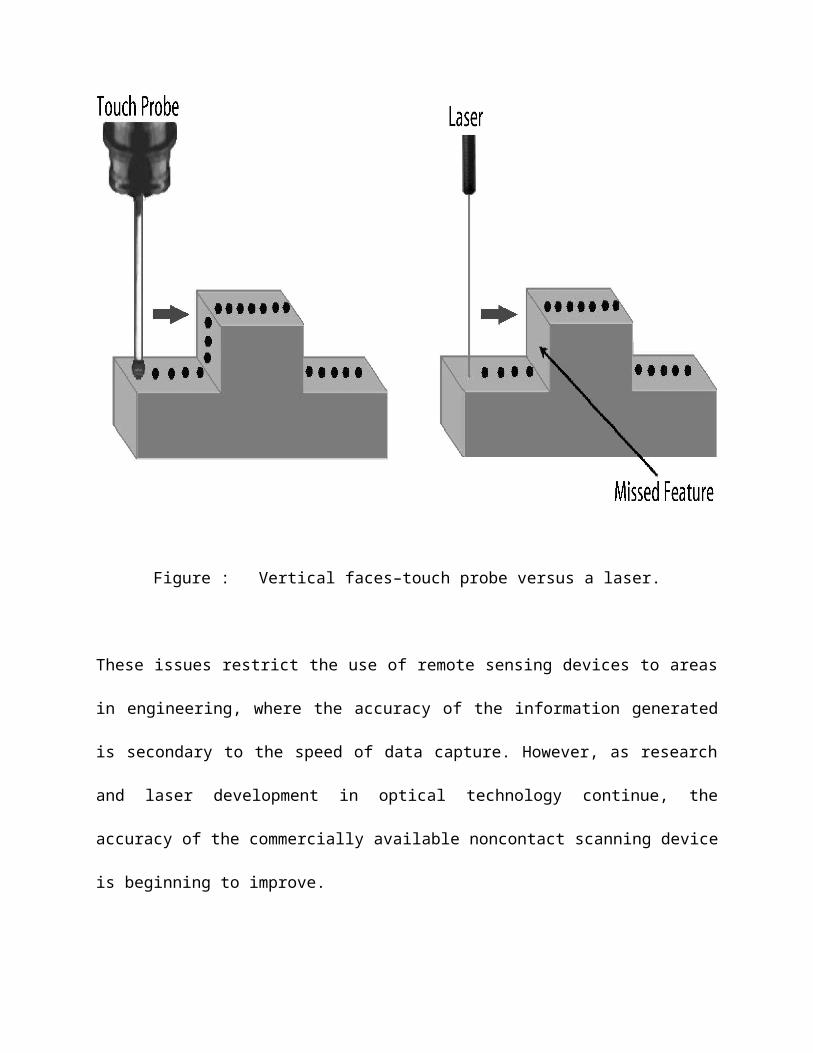
• The typical tolerance of noncontact scanning is within ±0.025 to 0.2 mm.
• Some noncontact systems have problems generating data describing surfaces, which are
parallel to the axis of the laser (Figure 1.6).
• Noncontact devices employ light within the data capture process. This creates problems when
the light impinges on shiny surfaces, and hence some surfaces must be prepared with a
temporary coating of fine powder before scanning.
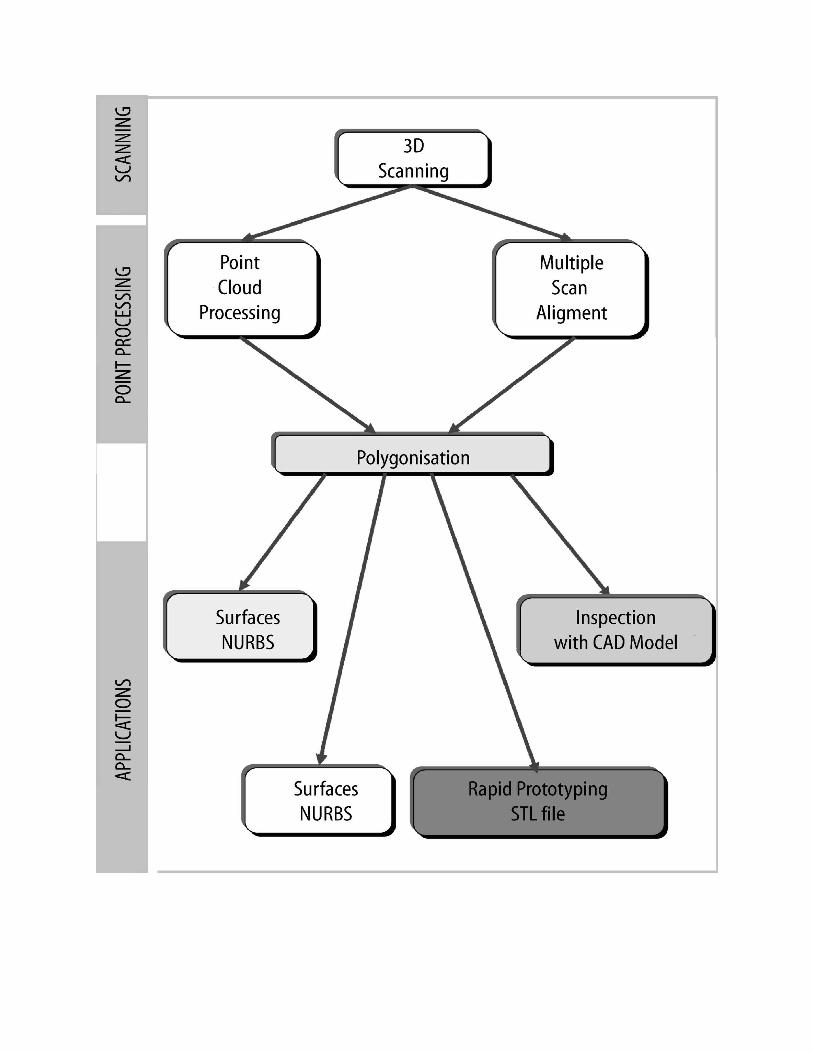
Figure : Optical scanning device. Originally published in Rapid Prototyping Casebook,
McDonald, J.A.
Figure : Vertical faces–touch probe versus a laser.
These issues restrict the use of remote sensing devices to areas in engineering, where the
accuracy of the information generated is secondary to the speed of data capture. However, as
research and laser development in optical technology continue, the accuracy of the commercially
available noncontact scanning device is beginning to improve.
The output of the scanning phase is point cloud data sets in the most convenient format.
Typically, the RE software provides a variety of output formats such as raw (X, Y, Z values
separated by space or commas).
Phase 2–Point Processing:
This phase involves importing the point cloud data, reducing the noise in the data collected, and
reducing the number of points. These tasks are performed using a range of predefined filters. It is
extremely important that the users have very good understanding of the filter algorithms so that
they know which filter is the most appropriate for each task. This phase also allows us to merge
multiple scan data sets. Sometimes, it is necessary to take multiple scans of the part to ensure
that all required features have been scanned. This involves rotating the part; hence each scan
datum becomes very crucial. Multiple scan planning has direct impact on the point processing
phase. Good datum planning for multiple scanning will reduce the effort required in the point
processing phase and also avoid introduction of errors from merging multiple scan data. A wide
range of commercial software is available for point processing. The output of the point
processing phase is a clean , merged, point cloud data set in the most convenient format. This
phase also supports most of the proprietary formats mentioned above in the scanning phase.
Phase 3–Application Geometric Model Development:
In the same way that developments in rapid prototyping and tooling technologies are
helping to shorten dramatically the time taken to generate physical representations from CAD
models, current RE technologies are helping to reduce the time to create electronic CAD models
from existing physical representations. The need to generate CAD information from physical
components will arise frequently throughout any product introduction process. The generation of
CAD models from point data is probably the most complex activity within RE because potent
surface fitting algorithms are required to generate surfaces that accurately represent the three-
dimensional information described within the point cloud data sets. Most CAD systems are not
designed to display and process large amounts of point data; as a result new RE modules or
discrete software packages are generally needed for point processing.
Generating surface data from point cloud data sets is still a very subjective process,
although feature-based algorithms are beginning to emerge that will enable engineers to interact
with the point cloud data to produce complete solid models for current CAD environments. The
applications of RE for generating CAD data are equally as important as the technology which
supports it. A manager’s decision to employ RE technologies should be based on specific
business needs.
This phase depends very much on the real purpose for reverse engineering. For example, if we
scanned a broken injection molding tool to produce a new tool, we would be interested in the
geometric model and also in the ISO G code data that can be used to produce a replacement tool
in the shortest possible time using a multi-axis CNC machine. One can also use reverse
engineering to analyze “as designed” to “as manufactured”. This involves importing the as
designed CAD model and superimposing the scanned point cloud data set of the manufactured
part. The RE software allows the user to compare the two data sets (as designed to as
manufactured). This process is also used for inspecting manufactured parts. Reverse engineering
can also be used to scan existing hip joints and to design new artificial hips joint around patient-
specific pelvic data. This creates the opportunity for customized artificial joints for each patient.
The output of this phase is geometric model in one of the proprietary formats such as IGES,
VDA, STL, DXF, OBJ, VRML, ISO G Code, etc.
INTRODUCTION TO POWER TRANSMISSION
Power transmission states that speed and torque conversions from rotating power source to other
device. Here in our project we design and analysis the intermediate shaft for stress and
deflection, it is necessary to know the applied forces. If the forces are transmitted through gears,
it is necessary to know the gear specifications in order to determine the forces that will be
transmitted to the shaft. But stock gears come with certain bore sizes, requiring knowledge of the
necessary shaft diameter. This project will focus on an overview of a power transmission system
design, demonstrating how to incorporate the details of each component into an overall design
process.
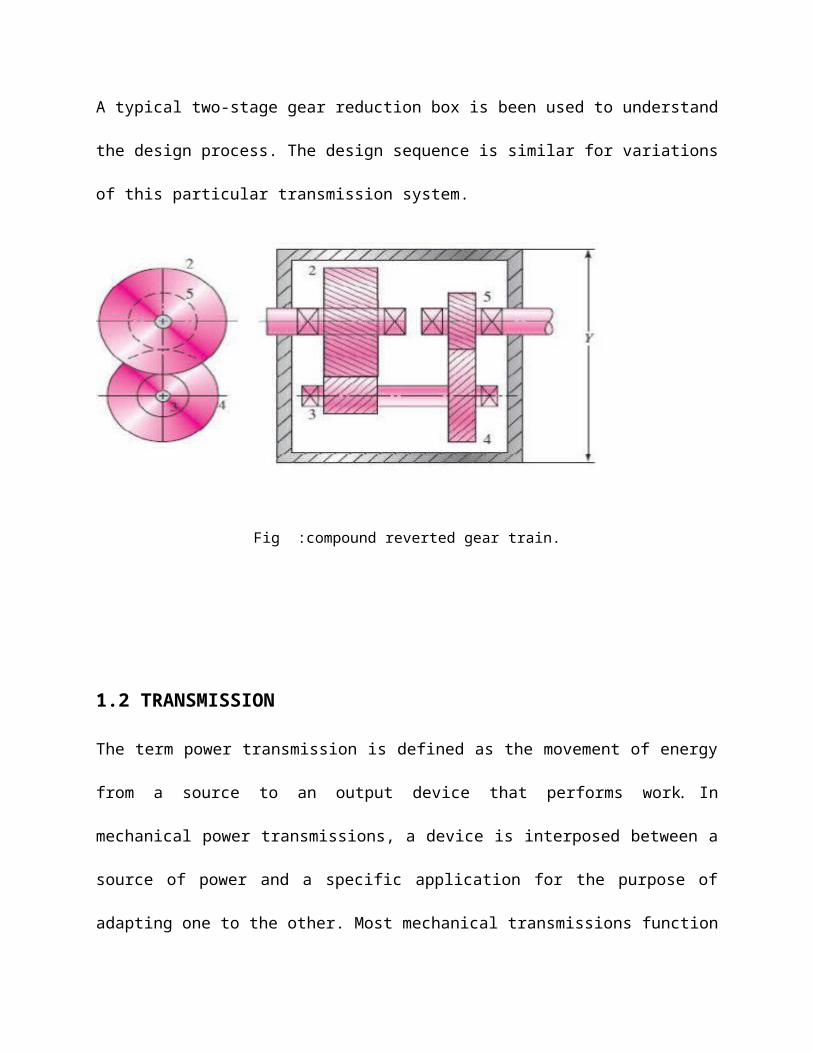
A typical two-stage gear reduction box is been used to understand the design process. The design
sequence is similar for variations of this particular transmission system.
Fig :compound reverted gear train.
1.2 TRANSMISSION
The term power transmission is defined as the movement of energy from a source to an output
device that performs work. In mechanical power transmissions, a device is interposed between a
source of power and a specific application for the purpose of adapting one to the other. Most
mechanical transmissions function as rotary speed changers; the ratio of the output speed to the
input speed may be constant (as in a gearbox) or variable. On variable-speed transmissions the
speeds may be variable in discrete steps or they may be continuously variable within a range.
The need for a transmission in an automobile is a consequence of the characteristics of the
internal combustion engine. Engines typically operate over a range of 600 to about
7000revolutions per minute (though this varies, and is typically less for diesel engines), while the
car's wheels rotate between 0 rpm and around 1800 rpm.
The most common use of power transmission is in motor vehicles, where the transmission adapts
the output of the internal combustion engine to the drive wheels. Such engines need to operate at
a relatively high rotational speed, which is inappropriate for starting, stopping, and slower travel.
Furthermore, the engine provides its highest torque and power outputs unevenly resulting in a
torque band and a power band. Often the greatest torque is required when the vehicle is moving
from rest or traveling slowly, while maximum power is needed at high speed. Therefore, a
system that transforms the engine's output so that it can supply high torque at low speeds, but
also operate at highway speeds with the motor still operating within its limits, is required.
Transmissions perform this transformation.
The transmission reduces the higher engine speed to the slower wheel speed, increasing torque in
the process. Transmissions are also used on pedal bicycles, fixed machines, and anywhere
rotational speed and torque must be adapted.
Many applications require the availability of multiple gear ratios. Often, this is to ease the
starting and stopping of a mechanical system, though another important need is that of
maintaining good fuel efficiency.
1.3 TYPES OF POWER TRANSMISSION SYSTEMS
Transmissions types include
Manual Transmission
Automatic Transmission
Semi-automatic transmission.
1.3.1 Manual transmission
Manual transmissions come in two basic types:
A simple but rugged sliding-mesh or unsynchronized/non-synchronous system, where straight-
cut spur gear sets spin freely, and must be synchronized by the operator matching engine revs to
road speed, to avoid noisy and damaging clashing of the gears.
The now common constant-mesh gearboxes, which can include nonsynchronized, or
synchronized/synchromesh systems, where typically diagonal cut helical (or sometimes either
straight-cut, or double-helical) gear sets are constantly "meshed" together, and a dog clutch is
used for changing gears. On synchromesh boxes, friction cones or "synchro-rings" are used in
addition to the dog clutch to closely match the rotational speeds of the two sides of the
(declutched) transmission before making a full mechanical engagement.

Manual transmissions are the most common type. They are cheaper, lighter, usually give
better performance, and fuel efficiency. It is customary for new drivers to learn, and be tested, on
a car with a manual gear change.
Some manual transmissions have an extremely low ratio for first gear, called a creeper
gear or granny gear. Such gears are usually not synchronized. This feature is common on pickup
trucks tailored to trailer-towing, farming, or construction-site work. During normal on-road use,
the truck is usually driven without using the creeper gear at all, and second gear is used from a
standing start.
1.3.2 Semi-automatic
A hybrid form of transmission where the integrated control system handles manipulation of the
clutch automatically, but the driver can still - and may be required to - take manual control of
gear selection. This is sometimes called a "clutchless manual," or "automated manual"
transmission. Many of these transmissions allow the driver to fully delegate gear shifting choice
to the control system, which then effectively acts as if it was a regular automatic transmission.
They are generally designed using manual transmission "internals", and when used in passenger
cars, have synchromesh operated helical constant mesh gear sets.
Early semi-automatic systems used a variety of mechanical and hydraulic systems - including
centrifugal clutches, torque converters, electro-mechanical (and even electrostatic) and
servo/solenoid controlled clutches - and control schemes – automatic declutching when moving
the gearstick, pre-selector controls, centrifugal clutches with drum-sequential shift requiring the

driver to lift the throttle for a successful shift, etc. -and some were little more than regular lock-
up torque converter automatics with manual gear selection.
Most modern implementations, however, are standard or slightly modified manual transmissions
(and very occasionally modified automatics—even including a few cases of CVTs with "fake"
fixed gear ratios), with servo-controlled clutching and shifting under command of the central
engine computer. These are intended as a combined replacement option both for more expensive
and less efficient "normal" automatic systems, and for drivers who prefer manual shift but are no
longer able to operate a clutch, and users are encouraged to leave the shift lever in fully
automatic "drive" most of the time, only engaging manual-sequential mode for sporty driving or
when otherwise strictly necessary.
1.3.3 Automatic
These primarily use hydraulics to select gears, depending on pressure exerted by fluid within the
transmission assembly. Rather than using a clutch to engage the transmission, a fluid flywheel,
or torque converter is placed in between the engine and transmission. It is possible for the driver
to control the number of gears in use or select reverse, though precise control of which gear is in
use may or may not be possible.
Automatic transmissions are easy to use. However, in the past, automatic transmissions of
this type have had a number of problems; they were complex and expensive, sometimes had
reliability problems (which sometimes caused more expenses in repair), have often been less
fuel-efficient than their manual counterparts (due to "slippage" in the torque converter), and their
shift time was slower than a manual making them uncompetitive for racing. With the
advancement of modern automatic transmissions this has changed.
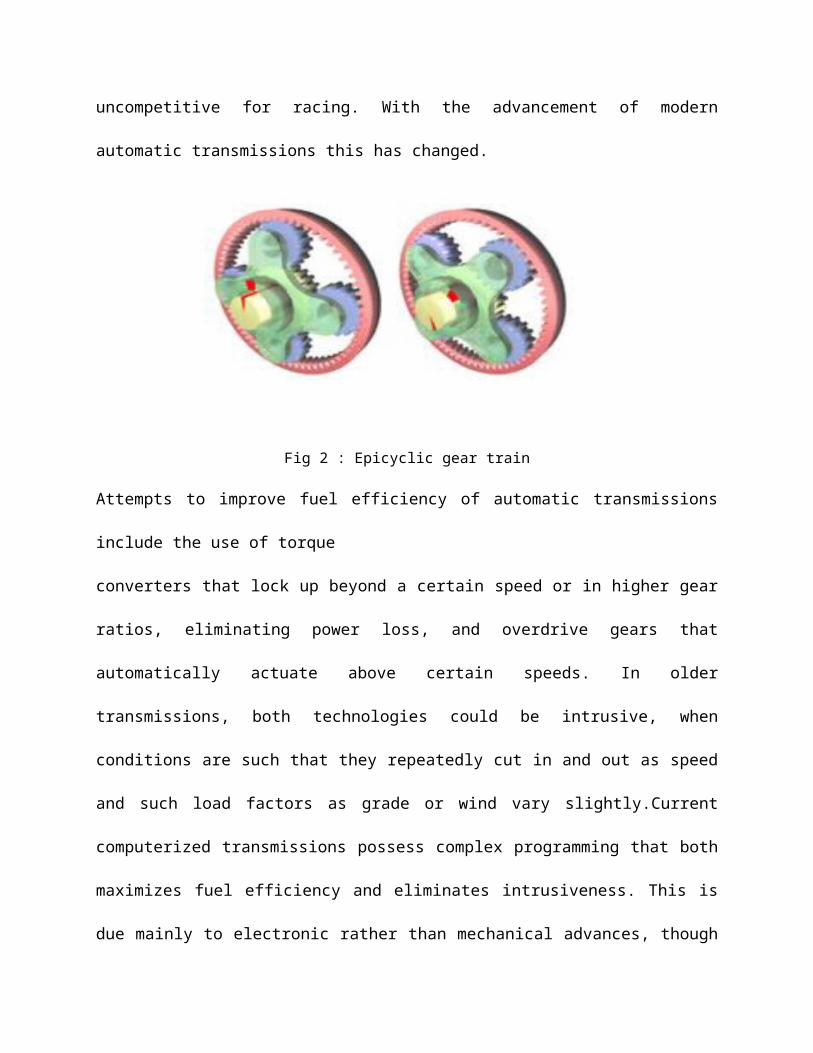
Fig 2 : Epicyclic gear train
Attempts to improve fuel efficiency of automatic transmissions include the use of torque
converters that lock up beyond a certain speed or in higher gear ratios, eliminating power loss,
and overdrive gears that automatically actuate above certain speeds. In older transmissions, both
technologies could be intrusive, when conditions are such that they repeatedly cut in and out as
speed and such load factors as grade or wind vary slightly.Current computerized transmissions
possess complex programming that both maximizes fuel efficiency and eliminates intrusiveness.
This is due mainly to electronic rather than mechanical advances, though improvements in CVT
technology and the use of automatic clutches have also helped.
1.4 Power Transmission Devices
Mechanical power can be transmitted across large distances in a variety of ways. Shafts transfer
motion from point to point along their axis of motion. Shafts can be connected to each other by
the following ways
Gear Drive
Chain Drive
Belt Drive

1.4.1 Gear Drive
Gear drive is a mechanism consisting of toothed wheels that engage and transmit rotary motion,
usually transforming angular velocity and torques. Gear drives are the most practical and wide
spread type of mechanical transmission. They are used to transmit power— from negligibly
small values to tens of thousands of kilowatts-and to transmit circumferential forces of fractions
of a gram to 10 meganewtons (1,000 tonsforce). The main advantages of gear drives are their
significantly smaller dimensions, high efficiency (losses in precision-made, well-lubricated
drives are 1-2 percent, and, under especially favorable conditions, 0.5 percent), longer life and
greater dependability, lack of slippage, and small shaft loads. The disadvantages of gear drives
include noisy operation and the need for precision manufacture.
Gear drives are classified according to the relationship of the axes to the drives.
Fig1.3 gear driveGear drive with spur gears: (a) straight-cut,(b) helical, (c)herring bone,
(d) bevel,(e) with spiral teeth, (f) with internal gearing.
The above figure shows the spur gearing, with parallel axes; bevel gearing, with intersecting axes
and, in rare instances, spur-bevel and flat spur gearing; and screw drives (worm gears, hypoid
gears, and screws), with overlapping axes. Rack-and-gear drive is a special type of gear drive
which transforms rotary motion into translatory motion or vice versa. Most machines and
mechanisms use external gearing—that is, gears with teeth on their outer surface. Internal
gearing, in which case one gear has teeth cut into its inner surface, is used less frequently.
1.4.2 Chain drive
Chain drive is a mechanism in which mechanical energy is transmitted over a distance by a chain
that engages sprockets. Device widely used for the transmission of power where shafts are
separated atdistances greater than that for which gears are practical. In such cases, sprockets
(wheels with teeth shaped to mesh with a chain) take the place of gears and drive one another by
means of a chain passing over the sprocket teeth. The chains used in conveyor belts are
commonly block chains, and consist of solid or laminated blocks connected by side plates
and pins. The blocks engage with teeth on sprocket wheels. Depending on the material
being moved, buckets, hooks, or other devices are connected to the blocks.
The widespread use of chain drives began with the introduction of pintle chains with bushings
and precision roller chains that permit powers up to 5,000 kilowatts to be transmitted at high
chain velocities (up to 35 m per second) and high forces (up to 70,000 kg-force, or 700
meganewtons, in chain drives having several parallel, multistrand chains), with a substantial
number of gear ratios (up to 12 for a single chain drive), and with high efficiency (up to 0.99).
Under particularly light-duty operating conditions (low velocities and light loads), open-hook
chains may be used.
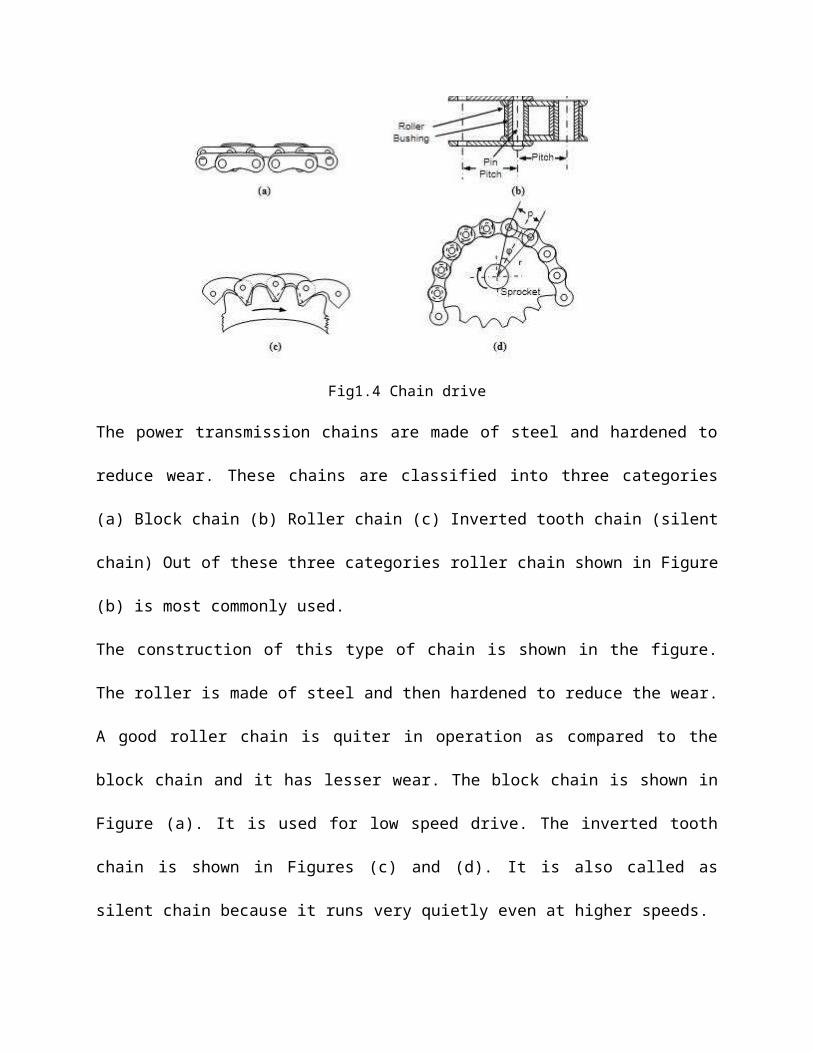
Fig1.4 Chain drive
The power transmission chains are made of steel and hardened to reduce wear. These chains are
classified into three categories (a) Block chain (b) Roller chain (c) Inverted tooth chain (silent
chain) Out of these three categories roller chain shown in Figure (b) is most commonly used.
The construction of this type of chain is shown in the figure. The roller is made of steel and then
hardened to reduce the wear. A good roller chain is quiter in operation as compared to the block
chain and it has lesser wear. The block chain is shown in Figure (a). It is used for low speed
drive. The inverted tooth chain is shown in Figures (c) and (d). It is also called as silent chain
because it runs very quietly even at higher speeds.
1.4.3 Belt Drive
A mechanism that transmits rotational motion from one pulley mounted on a shaft to another by
means of a belt. The belt transmits torque from the driving pulley to the driven pulley by means
of the forces of friction that arise between the taut belt and the pulleys. The type of belt used
determines whether the mechanism is flat-belt, roundbelt, or V-belt. A belt drive with a multiple
V-belt, which has several grooves on its inner surface, is now becoming increasingly common.
Flat and round belts, as a rule, are used singly in a drive, while several V-belts (usually no more
than eight) can be used together.
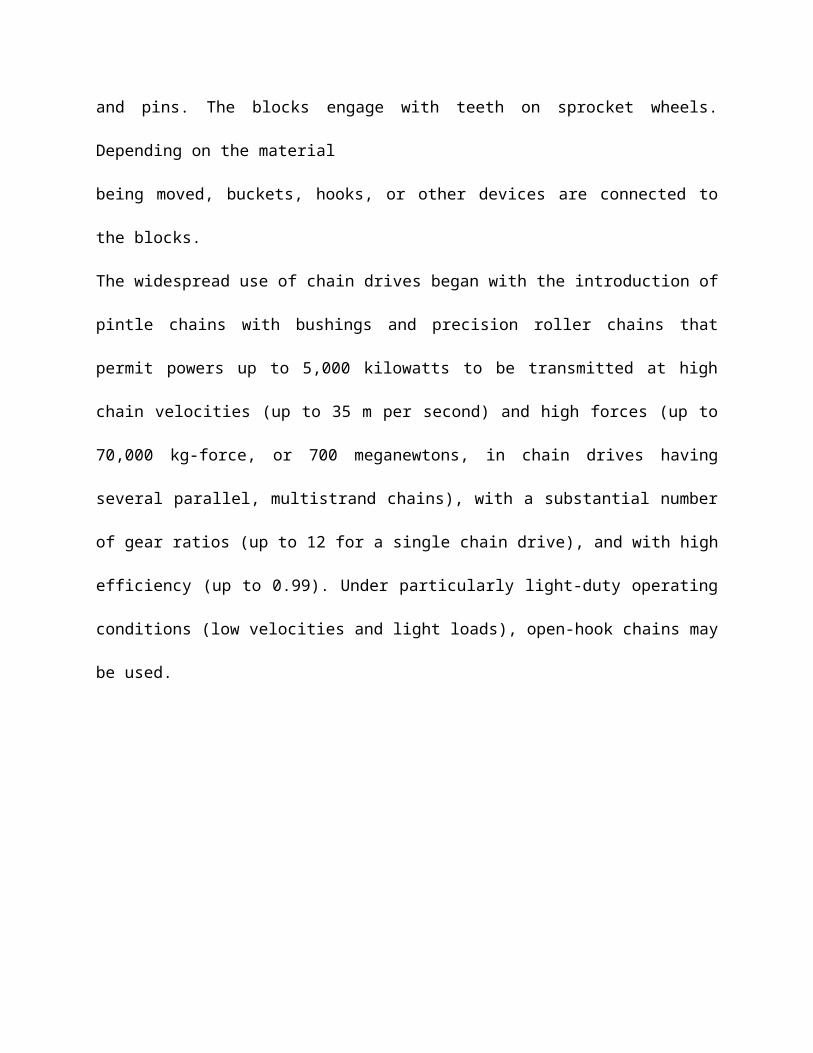
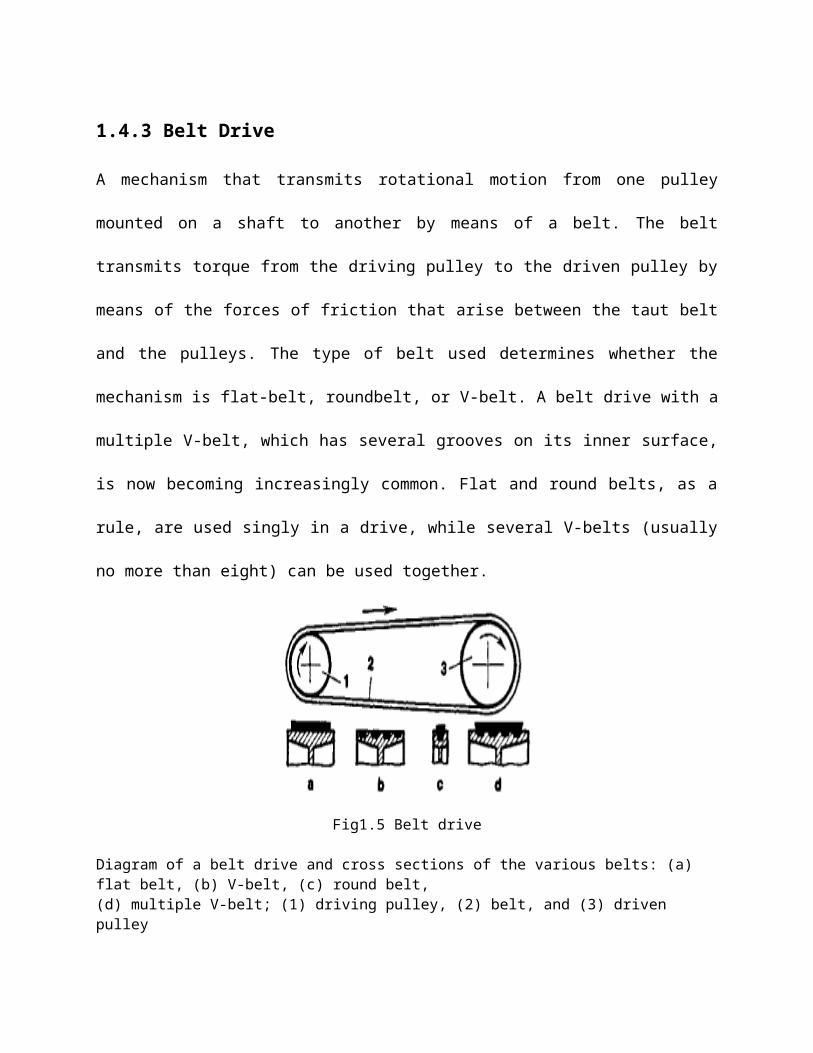
Fig1.5 Belt drive
Diagram of a belt drive and cross sections of the various belts: (a) flat belt, (b) V-belt, (c) round belt,(d) multiple V-belt; (1) driving pulley, (2) belt, and (3) driven pulley
Flat-belt drives are simple and convenient. They permit the use of ordinary pulleys with smooth
surfaces, and they can be operated at speeds as high as 40–50 m/sec and more. However, they are
bulky in design and low in strength, and their tension ratio usually does not exceed 5. V-belt
drives provide improved attachment of the belt to the pulleys, permit shortening of the center
distances, and allow a decrease in the size of the drive and an increase in the tension ratio (up to
10-15). Round-belt drives are now rare and are used only in mechanisms of low power, such as
those in sewing machines.
1.5 Gear Trains :
A gear train is formed by mounting gears on a frame so that the teeth of the gearsengage. Gear
teeth are designed to ensure the pitch circles of engaging gears roll on each other without
slipping; this provides a smooth transmission of rotation from one gear to the next.
Gears trains are classified into following types
Simple gear train
Compound gear train
Reverted compound gear train
Planetary gear train
1.5.1 Simple Gear Trains
The simple gear train is used where there is a large distance to be covered between the input
shaft and the output shaft. Each gear in a simple gear train is mounted on its own shaft. A simple
gear train may include many gears. Ina simple gear train each shaft carries only one train the
expression for the simple train’s velocity ratio .
1.5.2 Compound gear trainsTo get a train ratio of greater than about 10:1 with spur, helical, or bevel gears it is necessary to
compound the train. A compound train is one in which at least one shaft carries more than one
gear. This will be a parallel or series-parallel arrangement, rather than the pure series connections
of the simple gear train. The figure shows a compound train of four gears two of which, gears 3
and 4, are fixed on the same shaft and have same angular velocity.
The train ratio now:
this can be generalized for any number of gears in the train as:
Fig1.6 Compound gear train
1.5.3 Reverted compound trains:
A reverted gear train is very similar to a compound gear train. They are both used when there is
only a small space between the input and output shafts and large changes in speed or power are
needed. There are two major differences between compound and reverted gear trains.
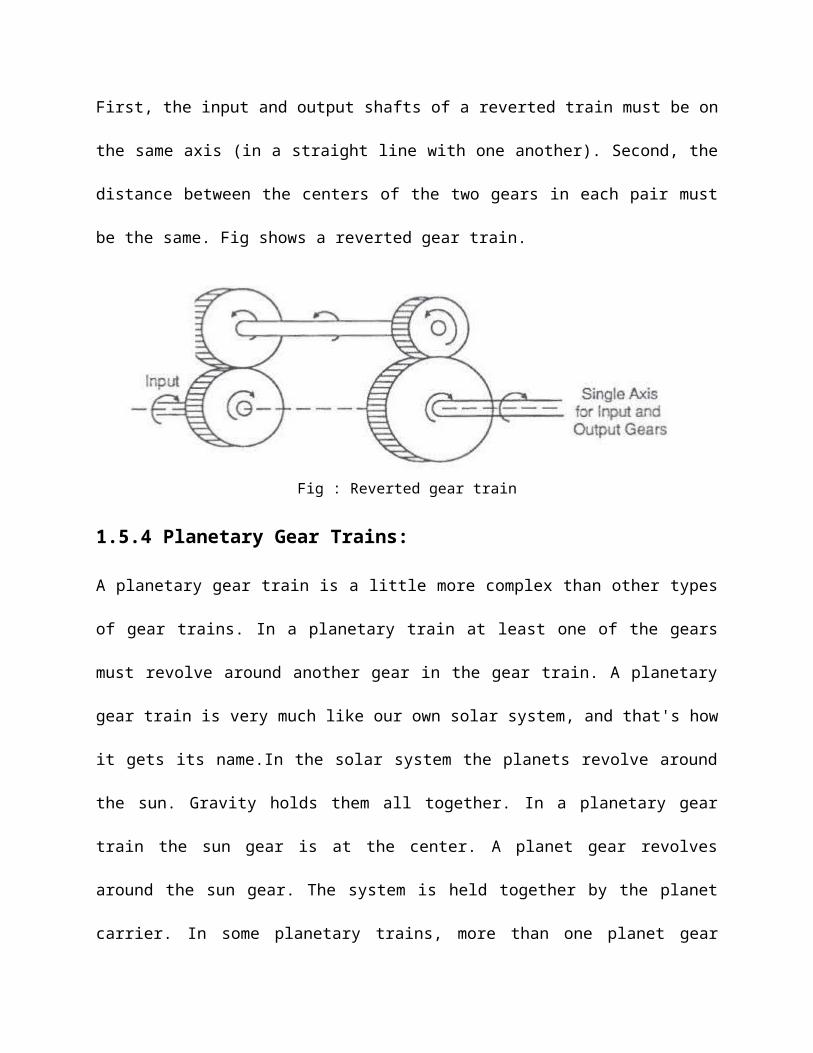
First, the input and output shafts of a reverted train must be on the same axis (in a straight line
with one another). Second, the distance between the centers of the two gears in each pair must be
the same. Fig shows a reverted gear train.
Fig : Reverted gear train
1.5.4 Planetary Gear Trains:
A planetary gear train is a little more complex than other types of gear trains. In a planetary train
at least one of the gears must revolve around another gear in the gear train. A planetary gear train
is very much like our own solar system, and that's how it gets its name.In the solar system the
planets revolve around the sun. Gravity holds them all together. In a planetary gear train the sun
gear is at the center. A planet gear revolves around the sun gear. The system is held together by
the planet carrier. In some planetary trains, more than one planet gear rotates around the sun
gear. The system is then held together by an arm connecting the planet gears in combination with
a ring gear.
Gears :
Gear is a part, as a disk, wheel, or section of a shaft, having cut teeth of such form, size and
spacing that they mesh with teeth in another part to transmit or receive force and motion
The gears in a transmission are analogous to the wheels in a pulley. An advantage of gears is that
the teeth of a gear prevent slipping.
Gears are the most common means used for power transmission
They can be applied between two shafts which are
Parallel Collinear
Perpendicular and intersecting
Perpendicular and nonintersecting
Inclined at any arbitrary angle
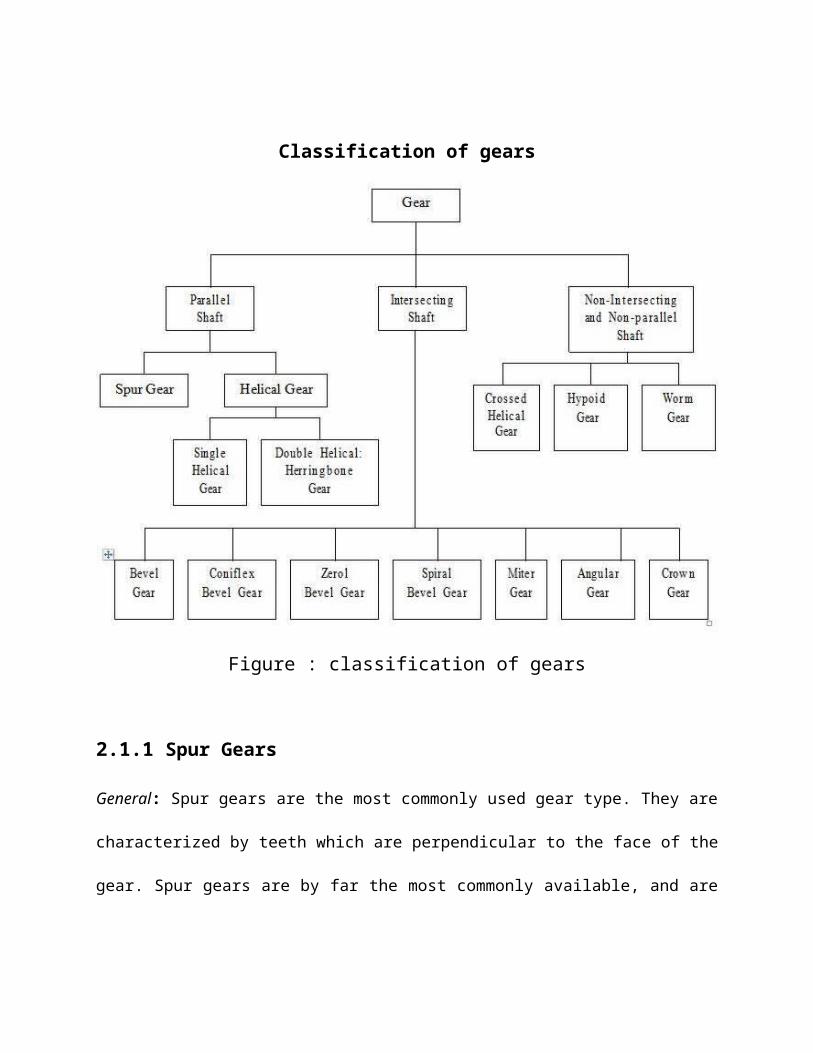
Classification of gears
Figure : classification of gears
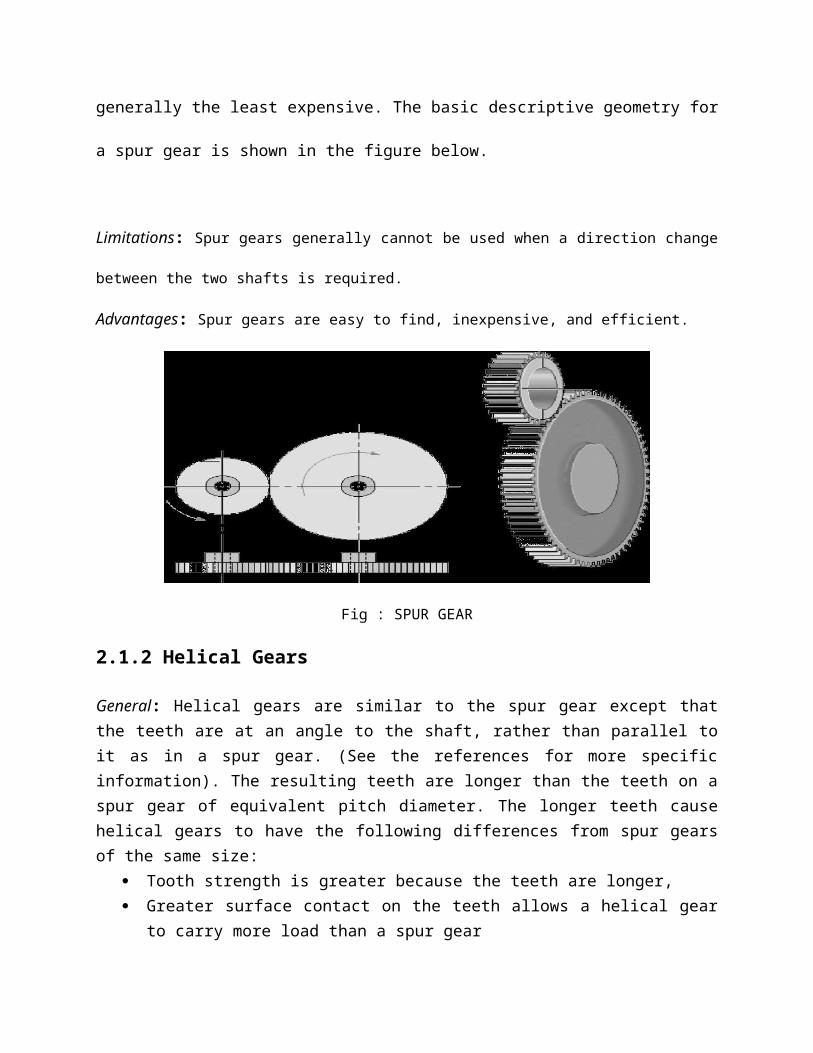
2.1.1 Spur Gears
General: Spur gears are the most commonly used gear type. They are characterized by teeth
which are perpendicular to the face of the gear. Spur gears are by far the most commonly
available, and are generally the least expensive. The basic descriptive geometry for a spur gear is
shown in the figure below.
Limitations: Spur gears generally cannot be used when a direction change between the two shafts is
required.
Advantages: Spur gears are easy to find, inexpensive, and efficient.
Fig : SPUR GEAR
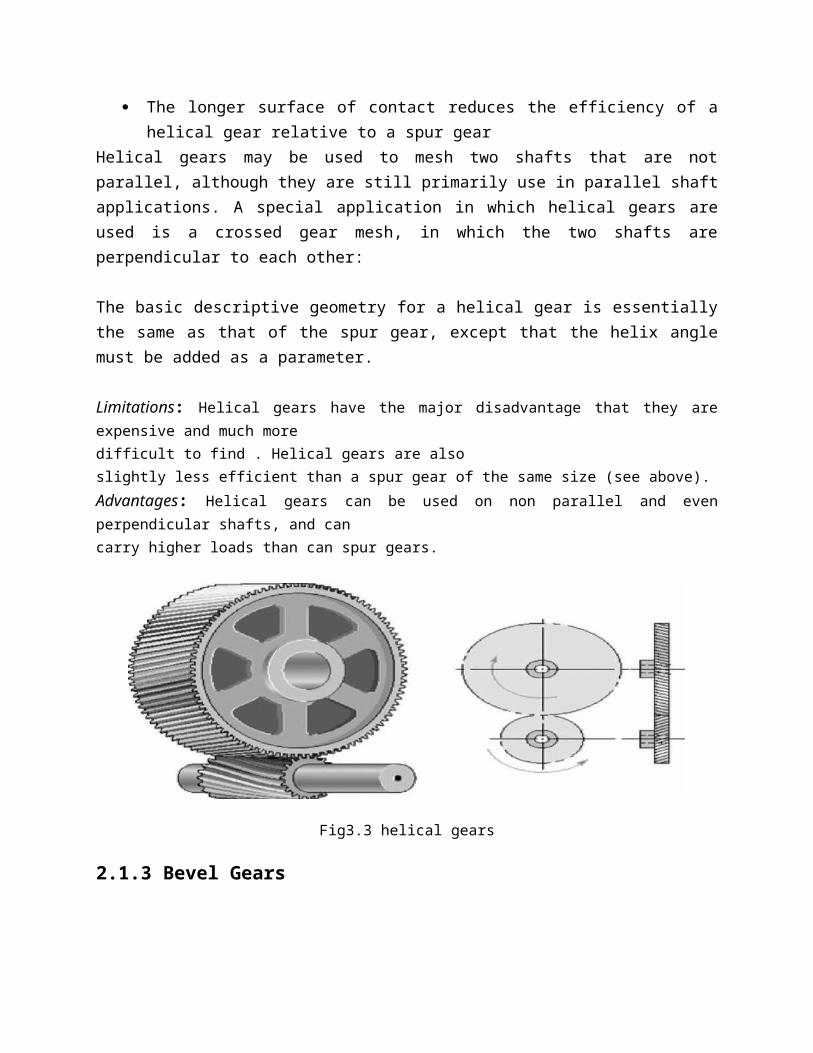
2.1.2 Helical Gears
General: Helical gears are similar to the spur gear except that the teeth are at an angle to the shaft, rather than parallel to it as in a spur gear. (See the references for more specific information). The resulting teeth are longer than the teeth on a spur gear of equivalent pitch diameter. The longer teeth cause helical gears to have the following differences from spur gears of the same size:
Tooth strength is greater because the teeth are longer, Greater surface contact on the teeth allows a helical gear to carry more load than a spur
gear The longer surface of contact reduces the efficiency of a helical gear relative to a spur
gearHelical gears may be used to mesh two shafts that are not parallel, although they are still primarily use in parallel shaft applications. A special application in which helical gears are used is a crossed gear mesh, in which the two shafts are perpendicular to each other:
The basic descriptive geometry for a helical gear is essentially the same as that of the spur gear, except that the helix angle must be added as a parameter.
Limitations: Helical gears have the major disadvantage that they are expensive and much moredifficult to find . Helical gears are alsoslightly less efficient than a spur gear of the same size (see above).
Advantages: Helical gears can be used on non parallel and even perpendicular shafts, and cancarry higher loads than can spur gears.
Fig3.3 helical gears
2.1.3 Bevel Gears
General: Bevel gears are primarily used to transfer power between intersecting shafts. The teeth
of these gears are formed on a conical surface. Standard bevel gears have teeth which are cut
straight and are all parallel to the line pointing the apex of the cone on which the teeth are based.
Spiral bevel gears are also available which have teeth that form arcs. Hypocycloid bevel gears
are a special type of spiral gear that will allow non-intersecting, non-parallel shafts to mesh.
Straight tool bevel gears are generally considered the best choice for systems with speeds lower
than 1000 feet per minute: they commonly become noisy above this point. One of the most
common applications of bevel gears is the bevel gear differential.
Limitations: Limited availability. Cannot be used for parallel shafts. Can become noisy at high
speeds.
Advantages: Excellent choice for intersecting shaft systems.
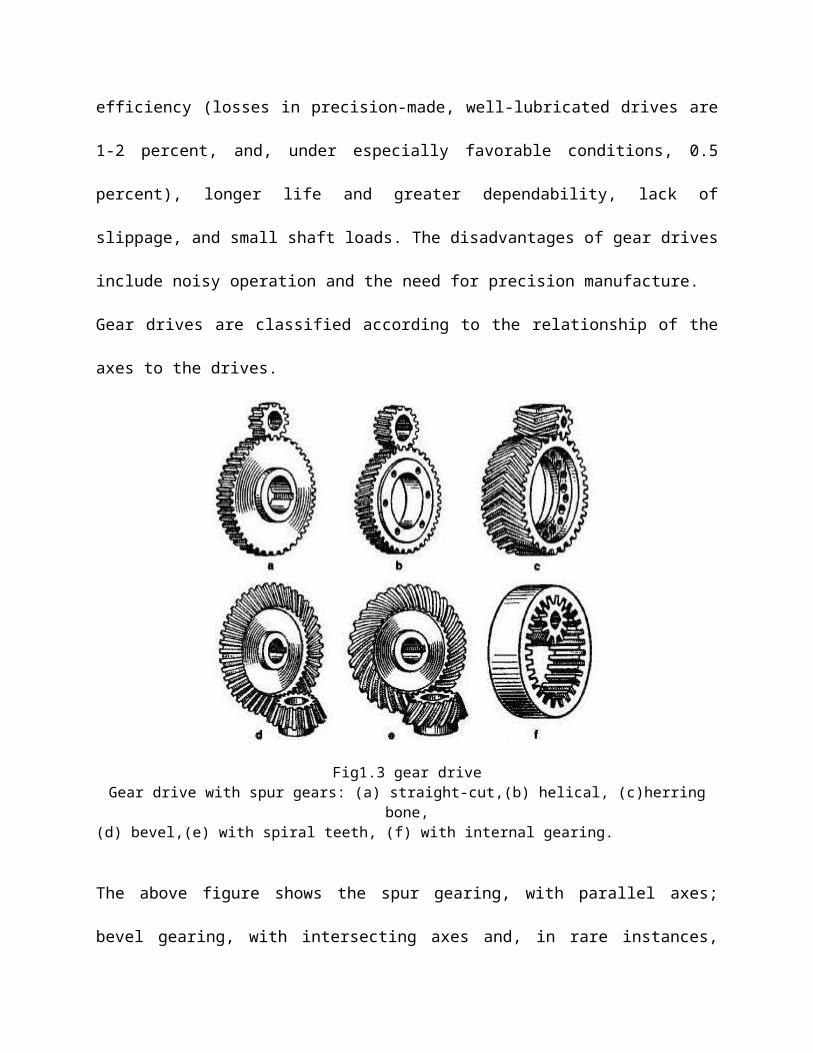
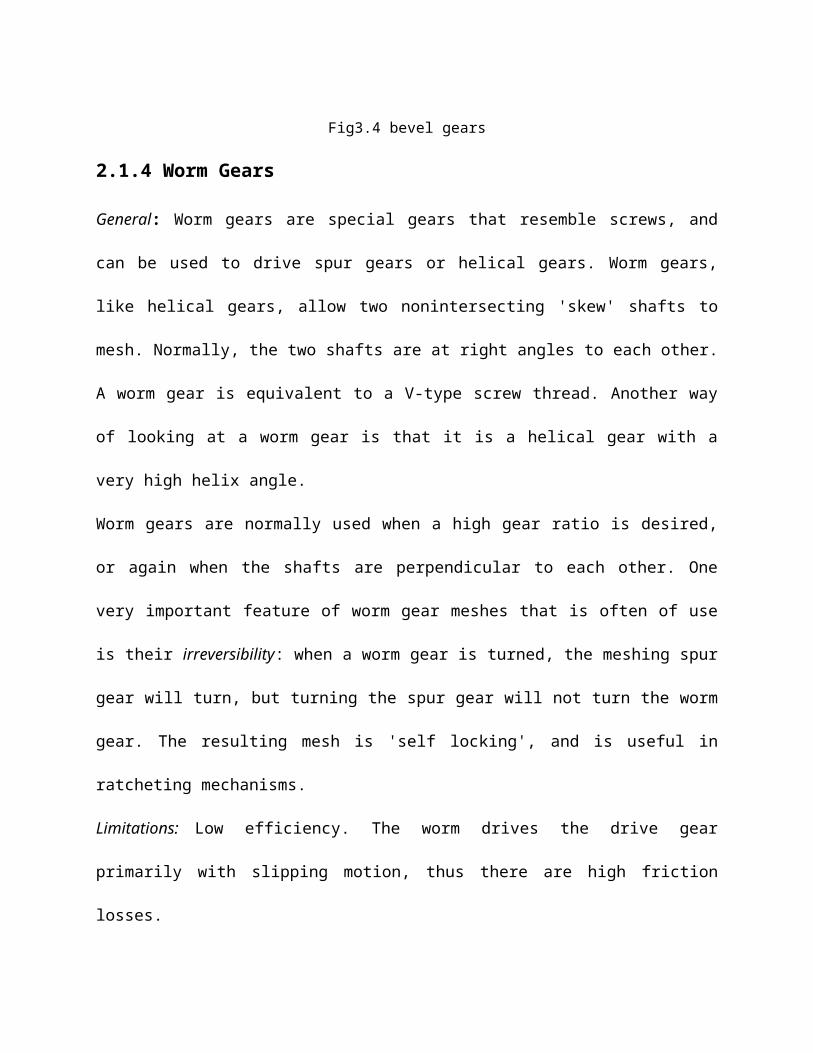
Fig3.4 bevel gears
2.1.4 Worm Gears
General: Worm gears are special gears that resemble screws, and can be used to drive spur gears
or helical gears. Worm gears, like helical gears, allow two nonintersecting 'skew' shafts to mesh.
Normally, the two shafts are at right angles to each other. A worm gear is equivalent to a V-type
screw thread. Another way of looking at a worm gear is that it is a helical gear with a very high
helix angle.
Worm gears are normally used when a high gear ratio is desired, or again when the shafts are
perpendicular to each other. One very important feature of worm gear meshes that is often of use
is their irreversibility: when a worm gear is turned, the meshing spur gear will turn, but turning
the spur gear will not turn the worm gear. The resulting mesh is 'self locking', and is useful in
ratcheting mechanisms.
Limitations: Low efficiency. The worm drives the drive gear primarily with slipping motion,
thus there are high friction losses.
Advantages: Will tolerate large loads and high speed ratios. Meshes are self locking (which can
be either an advantage or a disadvantage).
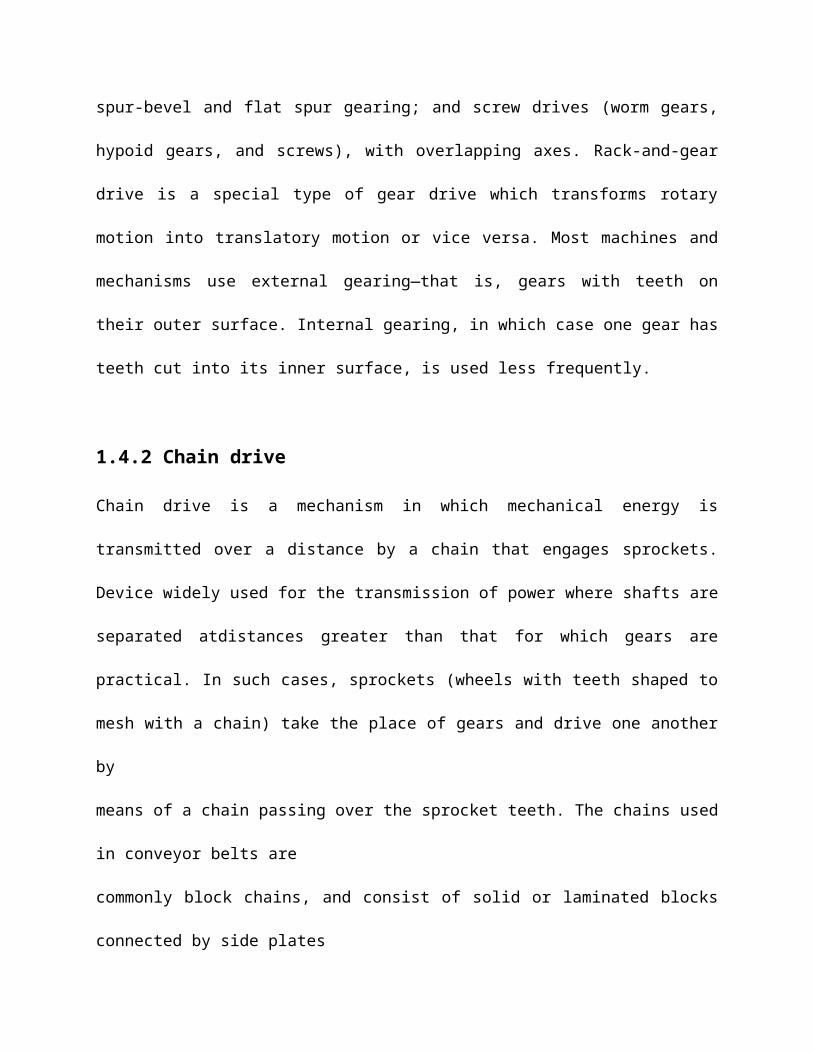
Fig3.5 Worm Gears
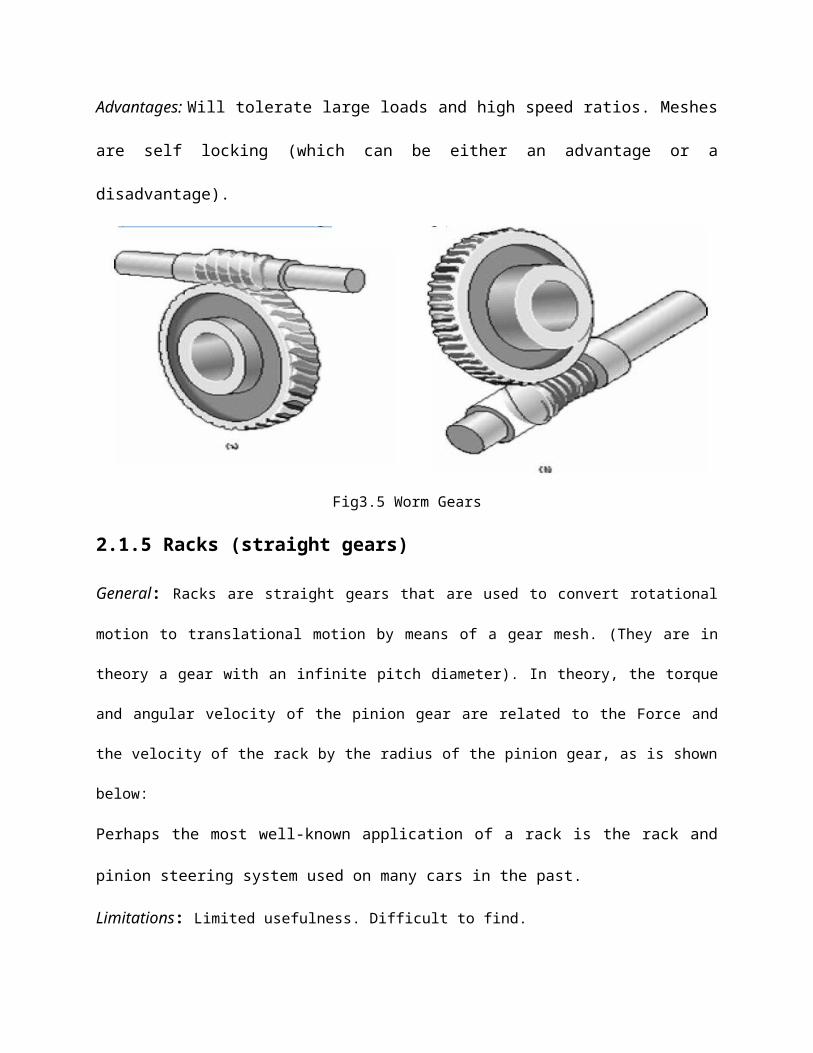
2.1.5 Racks (straight gears)
General: Racks are straight gears that are used to convert rotational motion to translational motion by
means of a gear mesh. (They are in theory a gear with an infinite pitch diameter). In theory, the torque
and angular velocity of the pinion gear are related to the Force and the velocity of the rack by the radius
of the pinion gear, as is shown below:
Perhaps the most well-known application of a rack is the rack and pinion steering system used on
many cars in the past.
Limitations: Limited usefulness. Difficult to find.
Advantages: The only gearing component that converts rotational motion to translational motion.
Efficiently transmits power. Generally offers better precision than other conversion methods.
Fig3.6 Racks (straight gears)
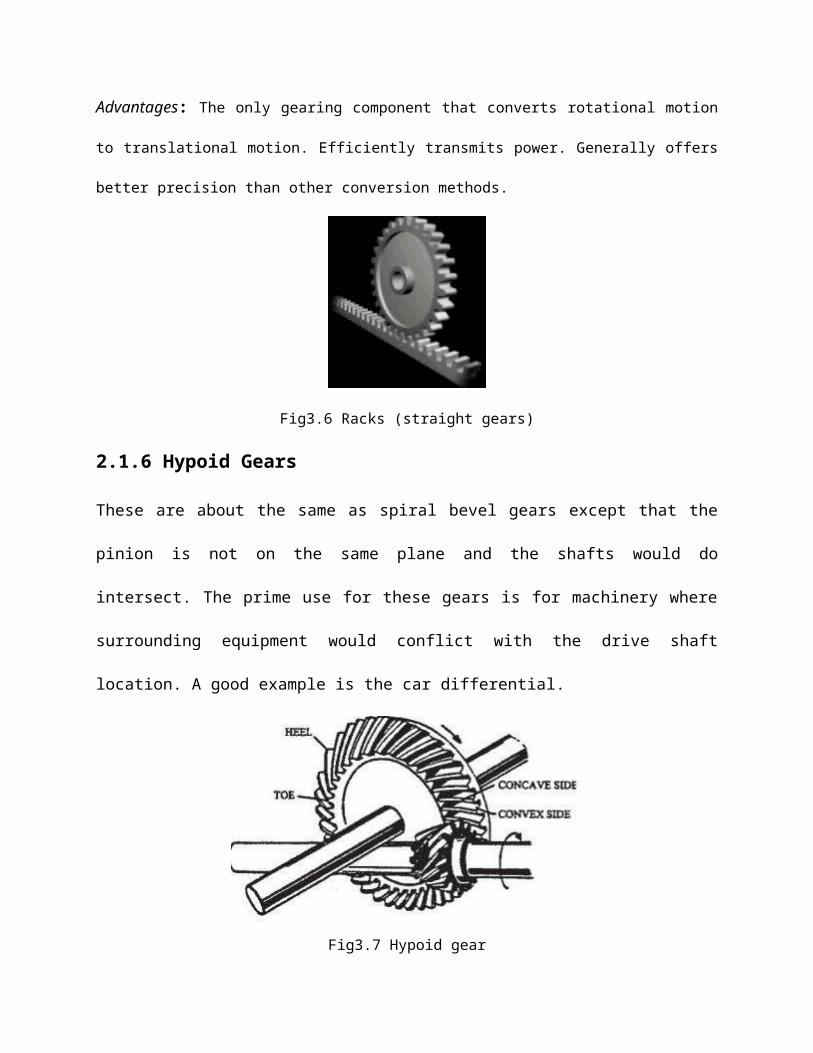
2.1.6 Hypoid Gears
These are about the same as spiral bevel gears except that the pinion is not on the same plane and
the shafts would do intersect. The prime use for these gears is for machinery where surrounding
equipment would conflict with the drive shaft location. A good example is the car differential.
Fig3.7 Hypoid gear
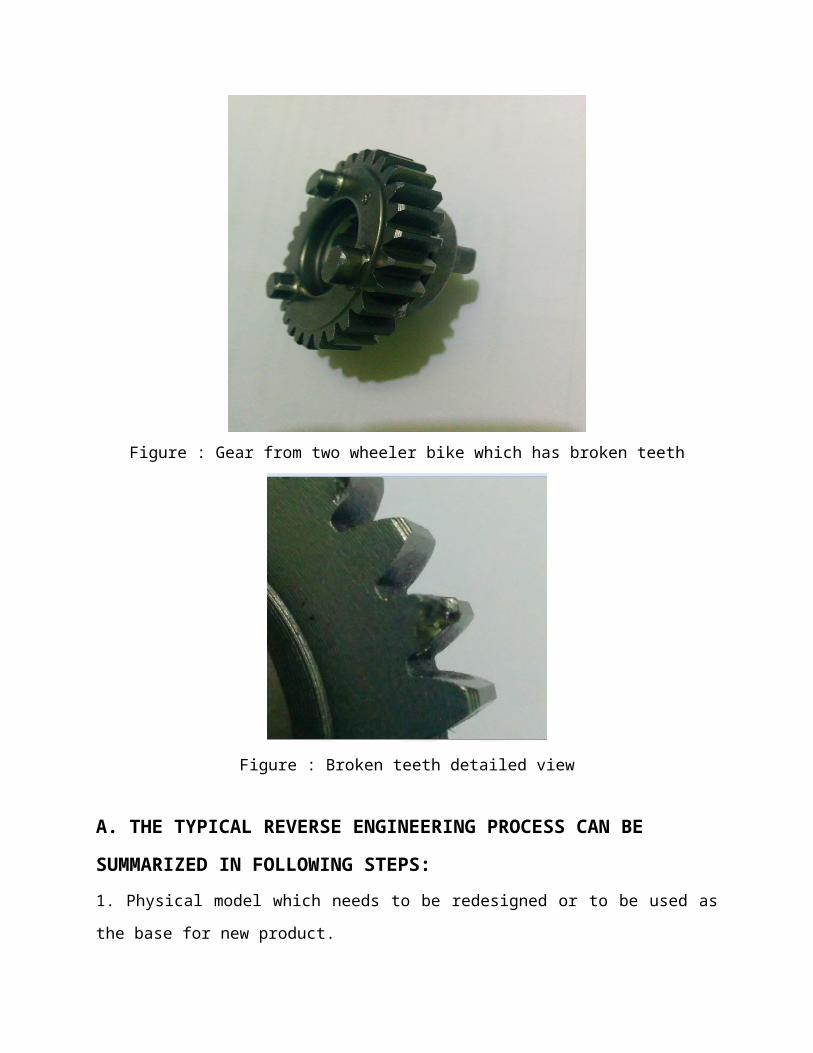
METHODOLOGY USED FOR CASE STUDY OF GEAR
A case study of broken teeth of spur Gear is done for the purpose of obtaining point cloud data
which was exported into associate nursing .stl format of the CAD program. The best method to
approximate a 3D geometrical model is by approximating it with lots of triangular aspects.
Figure : Gear from two wheeler bike which has broken teeth
Figure : Broken teeth detailed view
A. THE TYPICAL REVERSE ENGINEERING PROCESS CAN BE
SUMMARIZED IN FOLLOWING STEPS:
1. Physical model which needs to be redesigned or to be used as the base for new product.
2. Scanning the physical model to get the point cloud. The scanning can be done using various
scanners available in the market.
3. Processing the points cloud includes merging of points cloud if the part is scanned in several
settings. The outlines and noise is eliminated. If too many points are collected then sampling of
the points should be possible.
4. To create the polygon model and prepare .stl files for rapid prototyping.
5. To prepare the surface model to be sent to CAD/CAM packages for analysis.
6. Tool path generation with CAM package for suitable CNC machine manufacturing of final
part on the CNC machine.
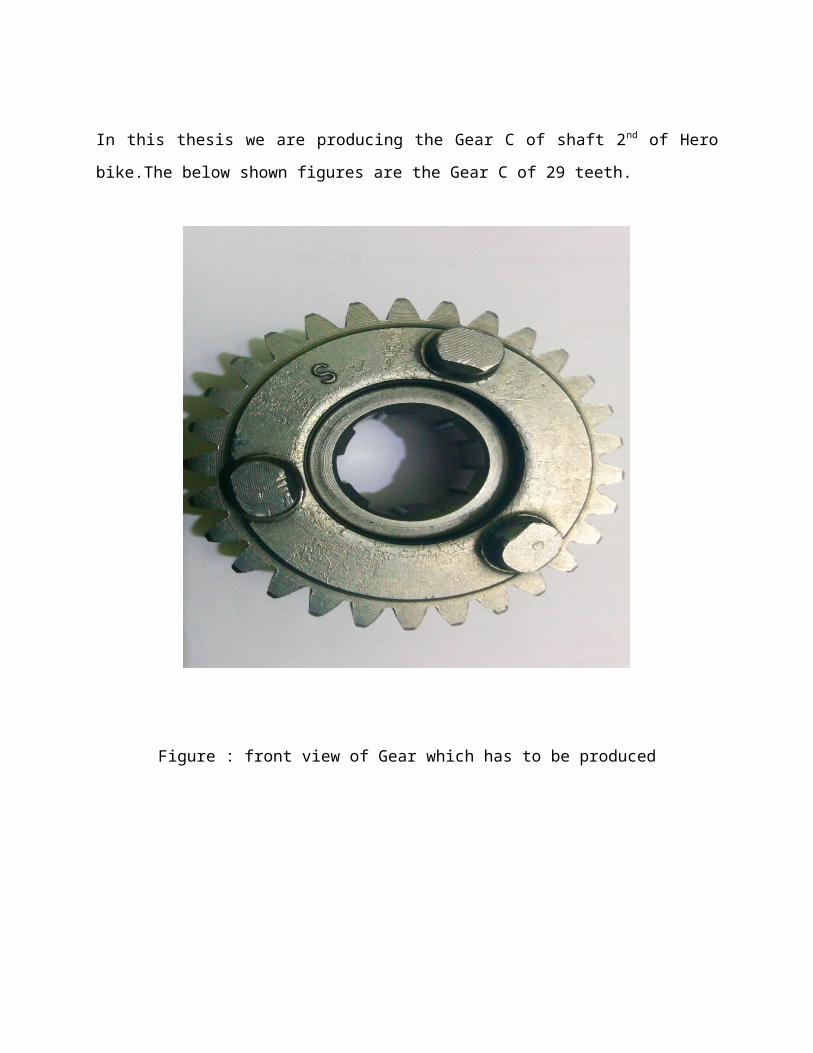
In this thesis we are producing the Gear C of shaft 2nd of Hero bike.The below shown figures are
the Gear C of 29 teeth.
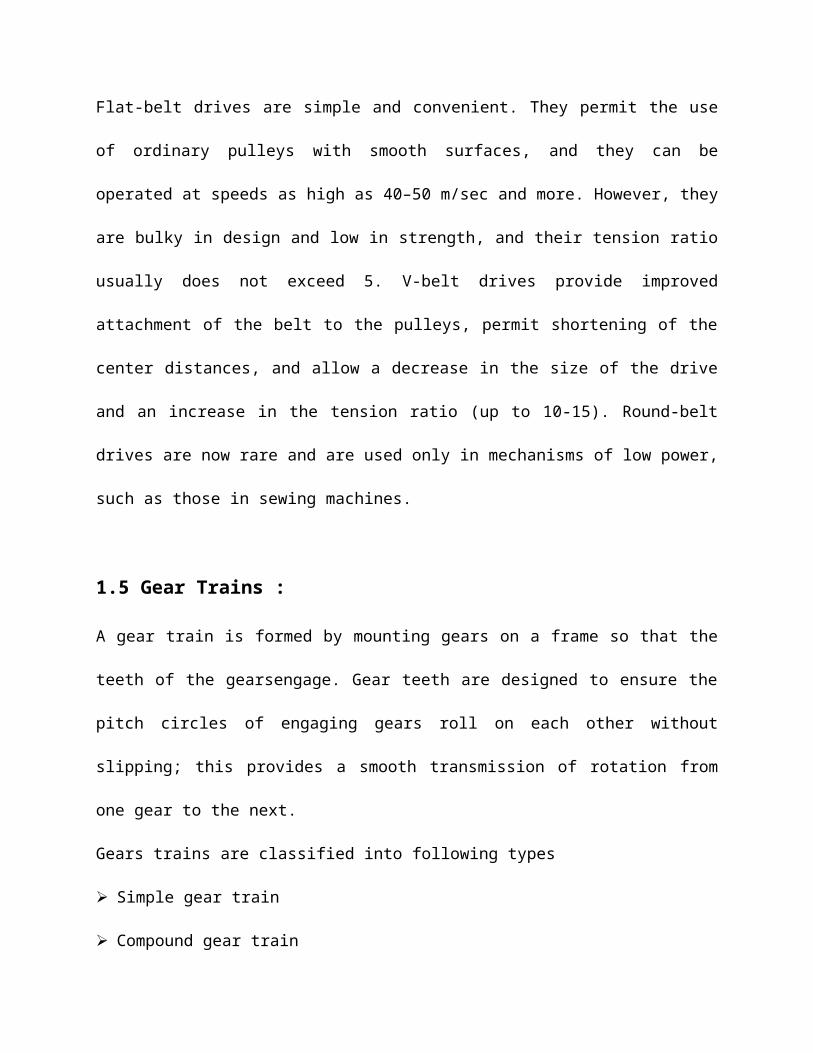
Figure : front view of Gear which has to be produced
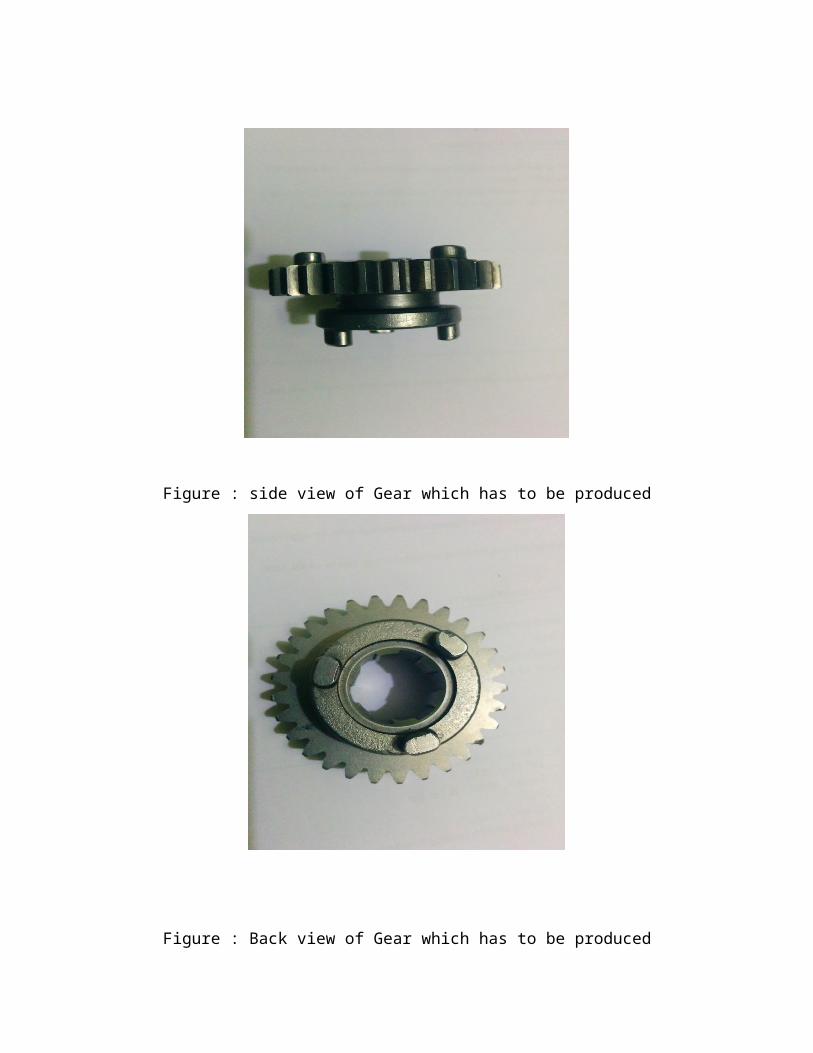
Figure : side view of Gear which has to be produced
Figure : Back view of Gear which has to be produced
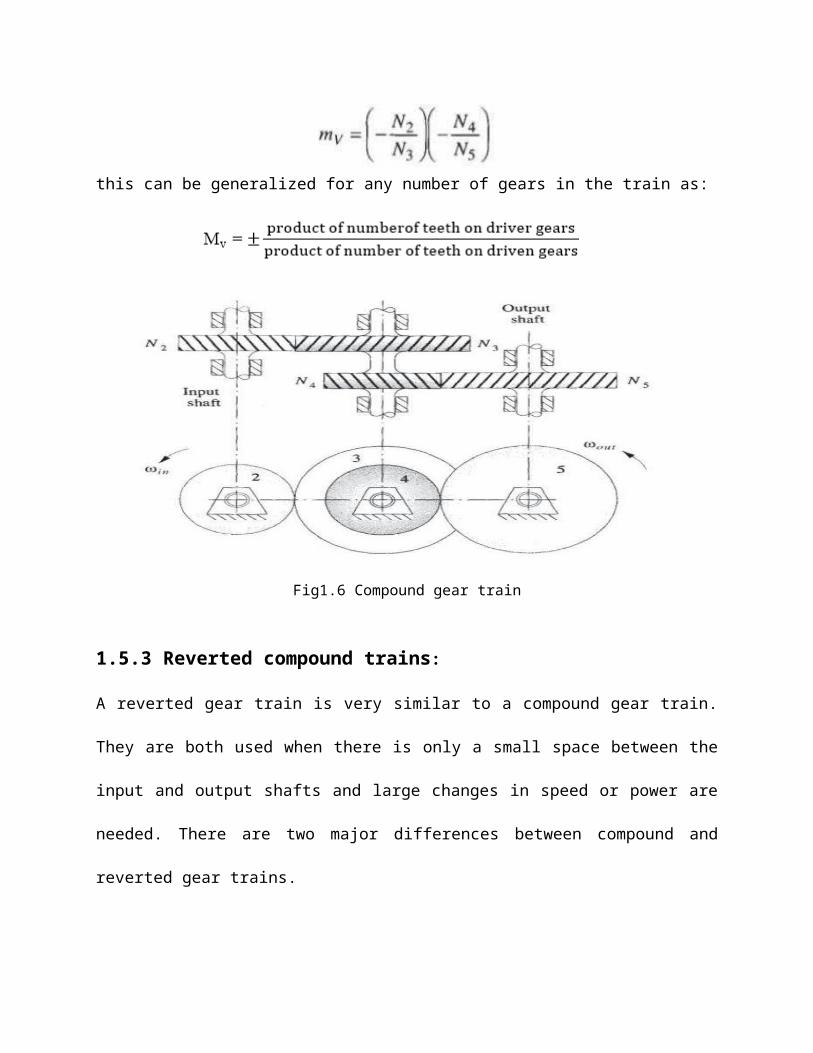
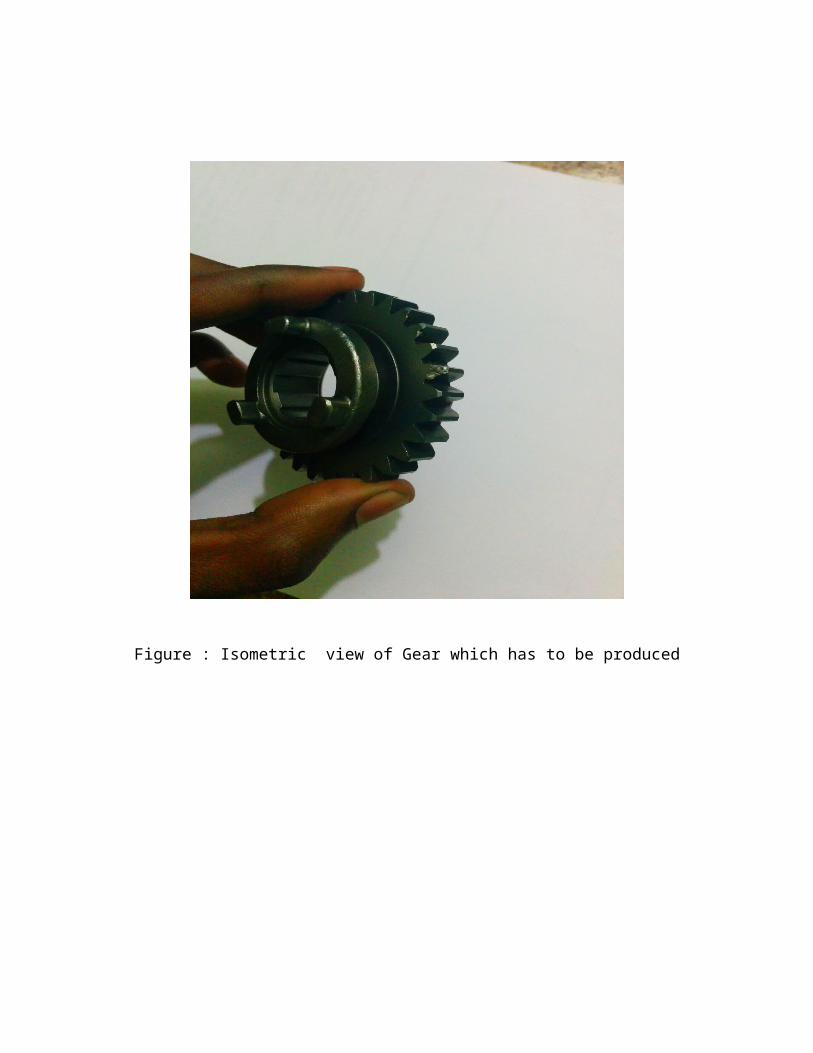
Figure : Isometric view of Gear which has to be produced
The Gear has been scanned in a Roland Model lpx-600 laser scanner .
The Roland Model lpx-600 laser scanner is a medium sized scanner used to scan object of
maximum height of around 150 mm and diameter of 120 mm. It operates with interface of
computer with software Dr. Picza which helps in setting up the scanning parameters and also
shows the scanning process. It stores the scanned file in .stl format. The scanner is shown in fig.
Figure : Roland Model LPX-600 Laser Scanner
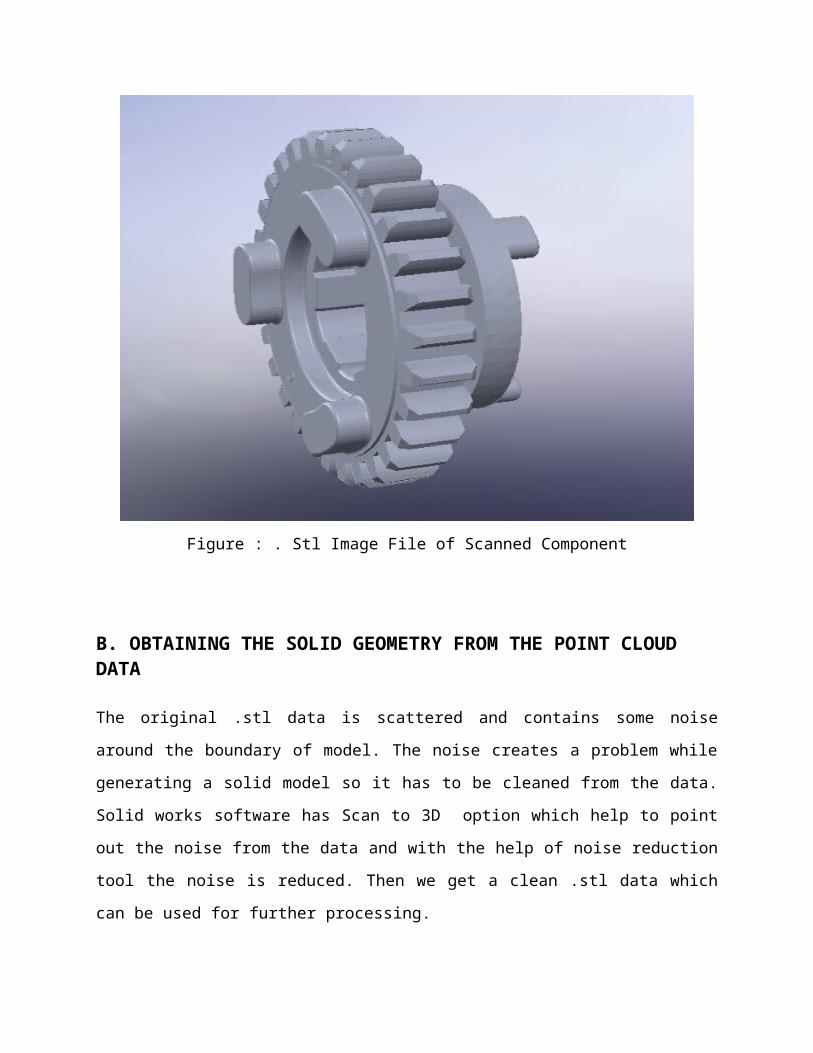
Once the scanned image of object is obtained using scanner it is exported into .stl format shown
in fig.. The parameter set in the above software decides the quality of scanned image. As the time
for scanning increases the quality of scanned image improves.

Figure : . Stl Image File of Scanned Component
B. OBTAINING THE SOLID GEOMETRY FROM THE POINT CLOUD DATA
The original .stl data is scattered and contains some noise around the boundary of model. The
noise creates a problem while generating a solid model so it has to be cleaned from the data.
Solid works software has Scan to 3D option which help to point out the noise from the data and
with the help of noise reduction tool the noise is reduced. Then we get a clean .stl data which can
be used for further processing.
SOLID WORKS
Solid Works is mechanical design automation software that takes advantage of the familiar
Microsoft Windows graphical user interface.
It is an easy-to-learn tool which makes it possible for mechanical designers to quickly sketch
ideas, experiment with features and dimensions, and produce models and detailed drawings.
A Solid Works model consists of parts, assemblies, and drawings.
Typically, we begin with a sketch, create a base feature, and then add more features to
the model. (One can also begin with an imported surface or solid geometry).
We are free to refine our design by adding, changing, or reordering features.
Associativity between parts, assemblies, and drawings assures that changes made to one
view are automatically made to all other views.
We can generate drawings or assemblies at any time in the design process.
The Solid Works software lets us customize functionality to suit our needs.
INTRODUCTION TO SOLID WORKS:
Solid works mechanical design automation software is a feature-based, parametric solid
modeling design tool which advantage of the easy to learn windows TM graphical user interface.
We can create fully associate 3-D solid models with or without while utilizing automatic or user
defined relations to capture design intent.
Parameters refer to constraints whose values determine the shape or geometry of the model or
assembly. Parameters can be either numeric parameters, such as line lengths or circle diameters,
or geometric parameters, such as tangent, parallel, concentric, horizontal or vertical, etc.
Numeric parameters can be associated with each other through the use of relations, which allow
them to capture design intent.
Design intent is how the creator of the part wants it to respond to changes and updates. For
example, you would want the hole at the top of a beverage can to stay at the top surface,
regardless of the height or size of the can. Solid Works allows you to specify that the hole is a
feature on the top surface, and will then honor your design intent no matter what the height you
later gave to the can.several factors contribute to how we capture design intent are Automatic
relations,Equations,added relations and dimensioning.
Features refer to the building blocks of the part. They are the shapes and operations that
construct the part. Shape-based features typically begin with a 2D or 3D sketch of shapes such as
bosses, holes, slots, etc. This shape is then extruded or cut to add or remove material from the
part. Operation-based features are not sketch-based, and include features such as fillets,
chamfers, shells, applying draft to the faces of a part, etc.
Building a model in Solid Works usually starts with a 2D sketch (although 3D sketches are
available for power users). The sketch consists of geometry such as points, lines, arcs, conics
(except the hyperbola), and splines. Dimensions are added to the sketch to define the size and
location of the geometry. Relations are used to define attributes such as tangency, parallelism,
perpendicularity, and concentricity. The parametric nature of Solid Works means that the
dimensions and relations drive the geometry, not the other way around. The dimensions in the
sketch can be controlled independently, or by relationships to other parameters inside or outside
of the sketch.
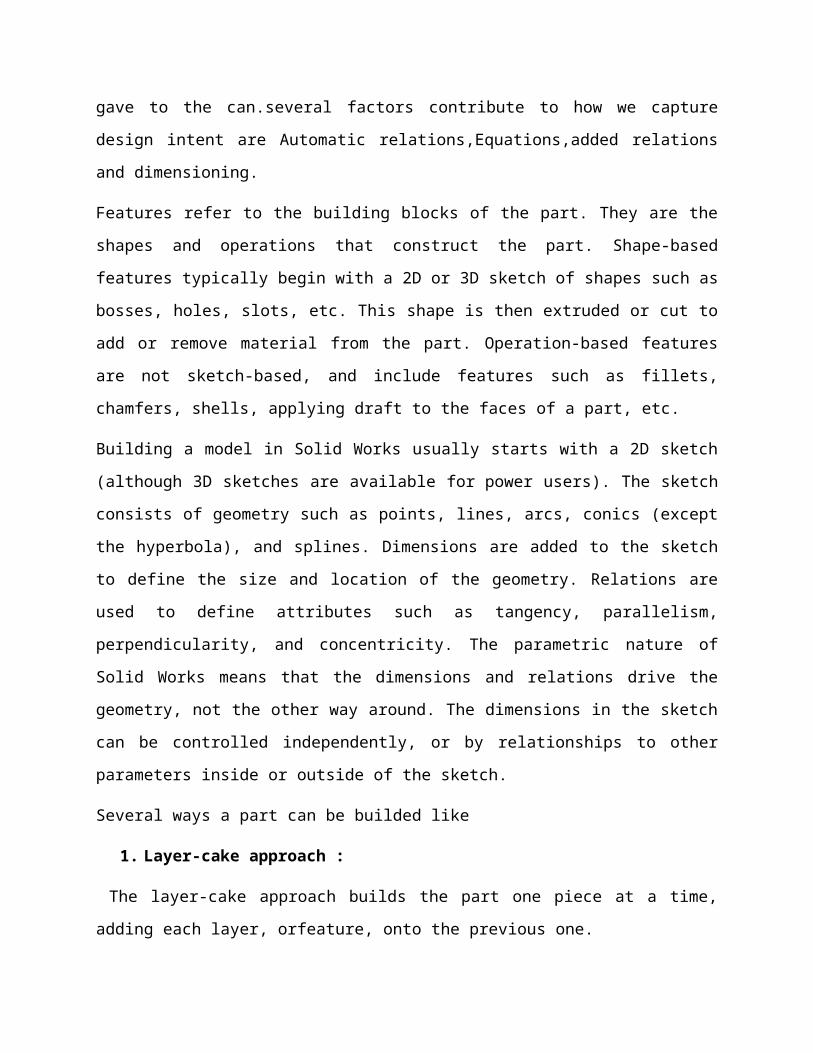
Several ways a part can be builded like
1. Layer-cake approach :
The layer-cake approach builds the part one piece at a time, adding each layer, orfeature, onto
the previous one.
2. Potter’s wheel approach :
The potter’s wheel approach builds the part as a single revolved feature.As a single sketch
representing the cross section includes all the information and dimensions necessary to make the
part as one feature.
3. Manufacturing approach :
The manufacturing approach to modeling mimics the way the part would be manufactured. For
example, if the stepped shaft was turned a lathe ,we would start with a piece of bar stock and
remove material using a series of cuts.
In an assembly, the analogue to sketch relations is mates. Just as sketch relations define
conditions such as tangency, parallelism, and concentricity with respect to sketch geometry,
assembly mates define equivalent relations with respect to the individual parts or components,
allowing the easy construction of assemblies. Solid Works also includes additional advanced
mating features such as gear and cam follower mates, which allow modelled gear assemblies to
accurately reproduce the rotational movement of an actual gear train.
Finally, drawings can be created either from parts or assemblies. Views are automatically
generated from the solid model, and notes, dimensions and tolerances can then be easily added to
the drawing as needed. The drawing module includes most paper sizes and standards.
A Solid Works model consists of parts, assemblies, and drawings.
(1) Part: Individual components are drawn in the form of part drawings.
(2) Assembly: The individual parts are assembled in this region.
(3) Drawings: This contains detailed information of the assembly.
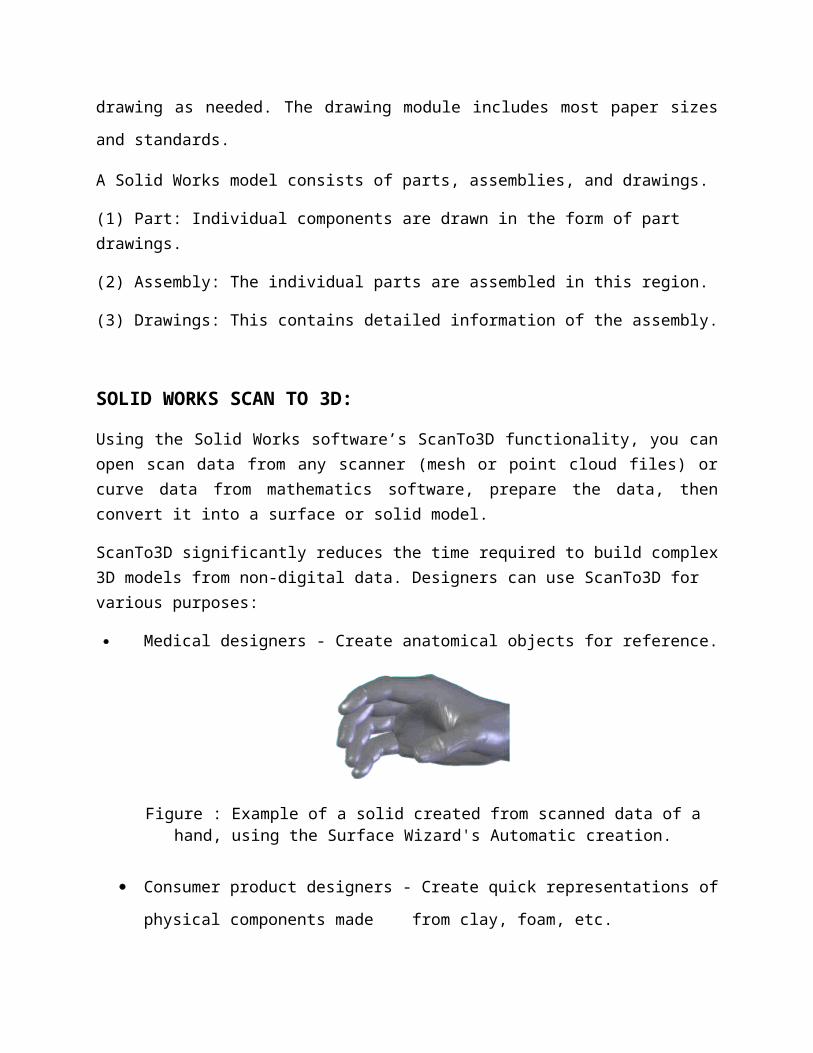
SOLID WORKS SCAN TO 3D:
Using the Solid Works software’s ScanTo3D functionality, you can open scan data from any scanner (mesh or point cloud files) or curve data from mathematics software, prepare the data, then convert it into a surface or solid model.
ScanTo3D significantly reduces the time required to build complex 3D models from non-digital data. Designers can use ScanTo3D for various purposes:
Medical designers - Create anatomical objects for reference.
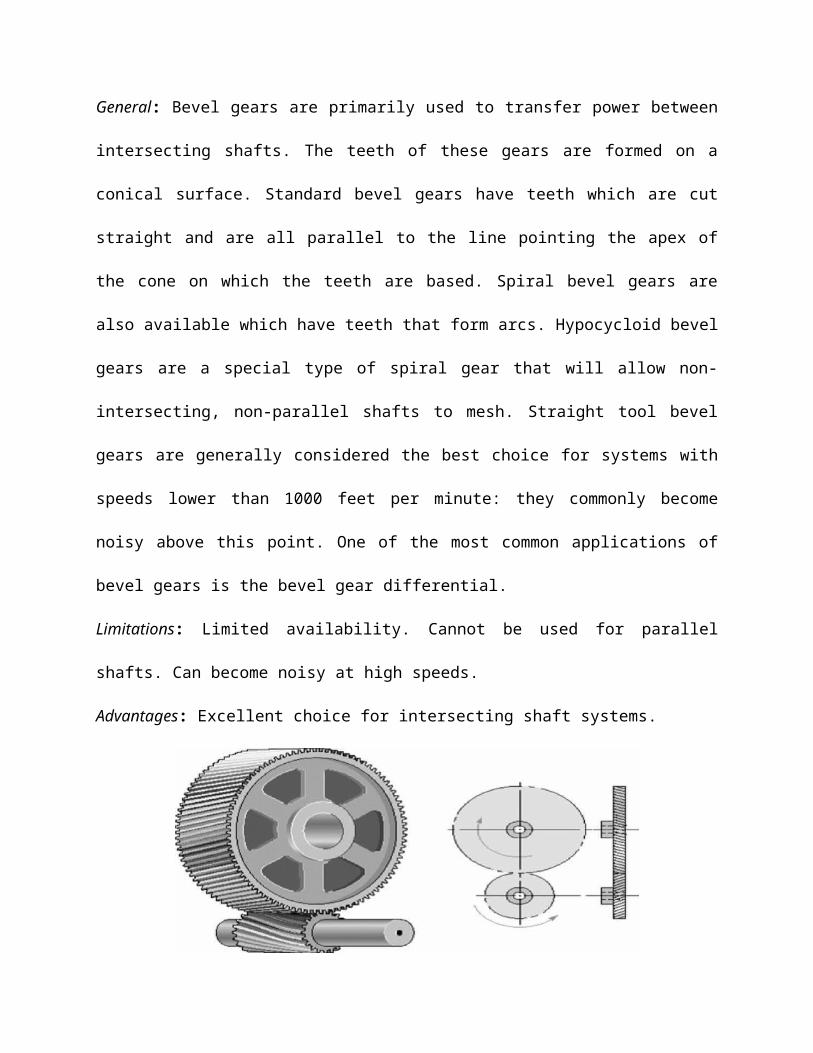
Figure : Example of a solid created from scanned data of a hand, using the Surface Wizard's Automatic creation.
Consumer product designers - Create quick representations of physical components made
from clay, foam, etc.
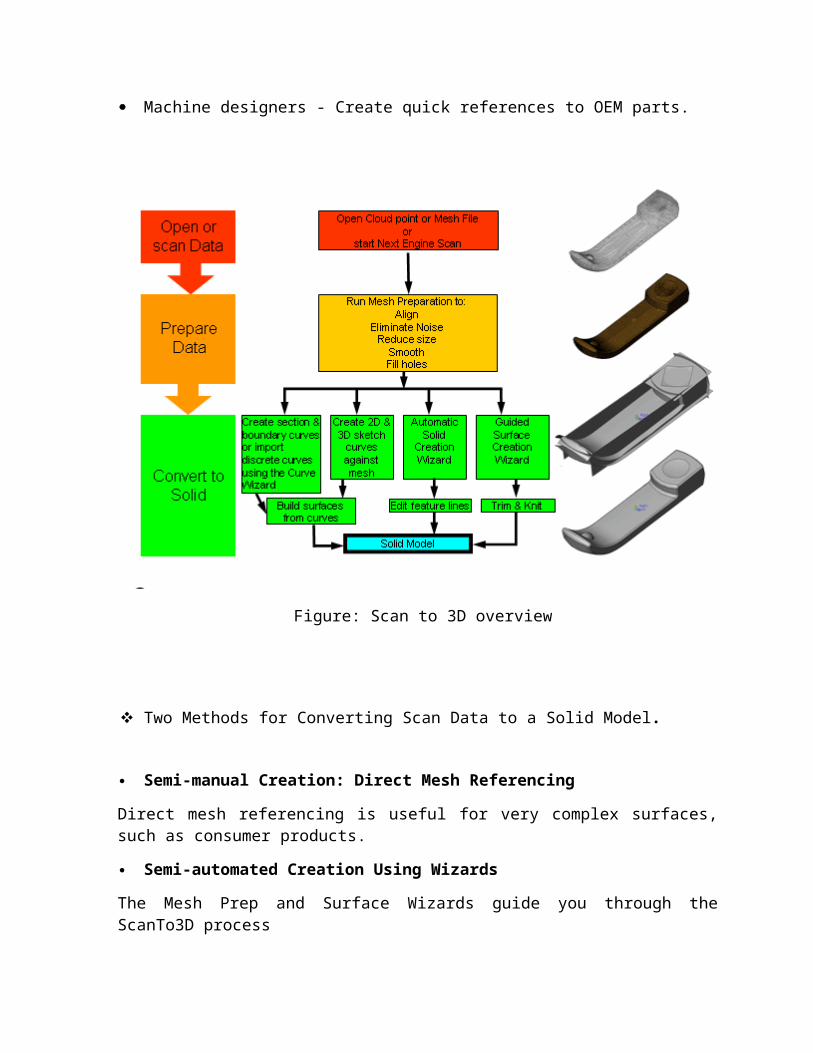
Machine designers - Create quick references to OEM parts.
Figure: Scan to 3D overview
Two Methods for Converting Scan Data to a Solid Model.
Semi-manual Creation: Direct Mesh Referencing
Direct mesh referencing is useful for very complex surfaces, such as consumer products.
Semi-automated Creation Using Wizards
The Mesh Prep and Surface Wizards guide you through the ScanTo3D process
MESH PREPARATION WIZARD:
Mesh Prep Wizard - Welcome Property Manager
The Mesh Prep Wizard prepares and cleans up mesh or point cloud files. The wizard produces a mesh feature from which you can create surfaces and a solid model using direct mesh referencing or the Surface Wizard.
Orientation Property Manager
Align the mesh or point cloud feature to the global origin and planes, which is important for accurate downstream manipulation of the model.
Noise Removal Property Manager
For point cloud data, this tool divides the cloud into partitions and removes points that are outside the average distribution, resulting in the removal of noise points.
Removing Noise From Point Clouds or Meshes
You can remove noise using the Noise Removal Property Manager. Noise is defined as either points that are outside the average distribution, or separate mesh patches that are small in area.
Extraneous Data Removal Property Manager
Extraneous data typically exists in point cloud data and comes from the fixture used to hold the part in place while you scan it. Choose a tool to select extraneous data, then click Delete to remove the data.
Mesh Boundaries
Mesh boundaries form along boundary edges. ScanTo3D can create boundary curves only along boundary edges. Boundary edges are commonly found on meshes that represent surfaces or have large holes in them.
SURFACE WIZARD CREATION MANAGER :
Surface Wizard - Welcome Property Manager
The Surface Wizard converts a mesh feature into surfaces and a solid model.
Solid/Surface Creation Property Manager
The Surface Wizard can automatically create surfaces or guide you to create surfaces.
Automatic Creation
Automatically create solids based on the desired amount of detail.
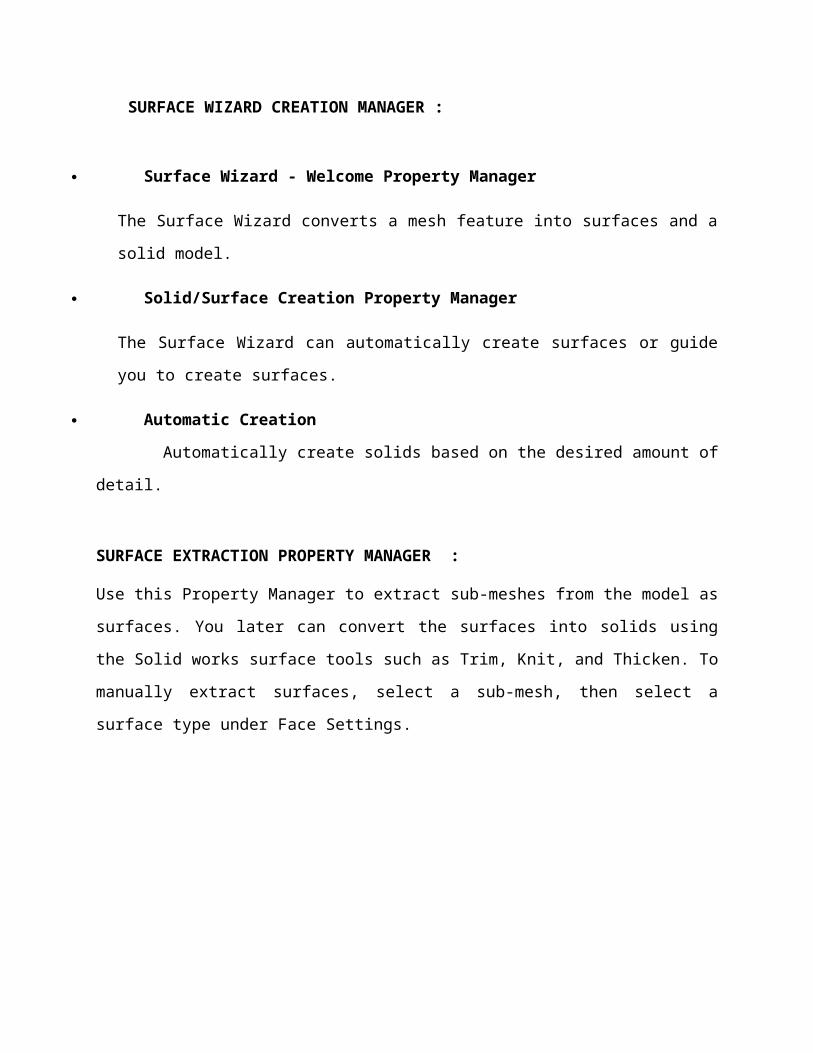
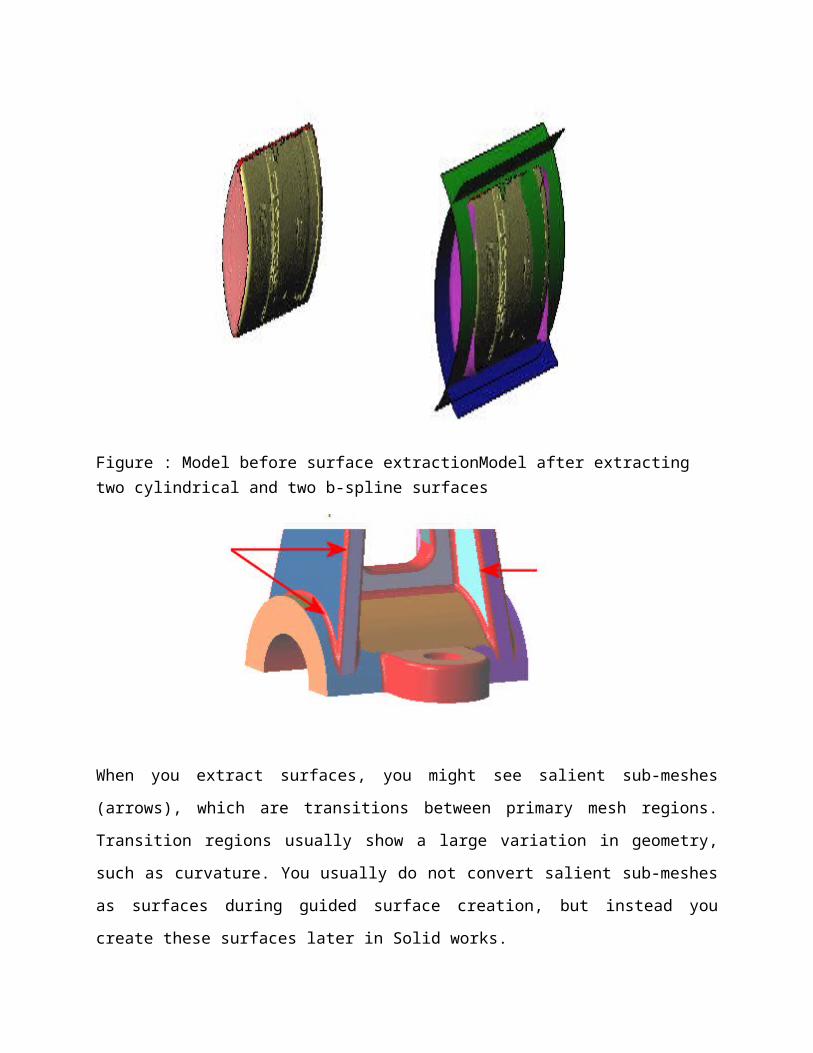
SURFACE EXTRACTION PROPERTY MANAGER :
Use this Property Manager to extract sub-meshes from the model as surfaces. You later can
convert the surfaces into solids using the Solid works surface tools such as Trim, Knit,
and Thicken. To manually extract surfaces, select a sub-mesh, then select a surface type
under Face Settings.
Figure : Model before surface extractionModel after extracting two cylindrical and two b-spline surfaces
When you extract surfaces, you might see salient sub-meshes (arrows), which are transitions
between primary mesh regions. Transition regions usually show a large variation in geometry,
such as curvature. You usually do not convert salient sub-meshes as surfaces during guided
surface creation, but instead you create these surfaces later in Solid works.
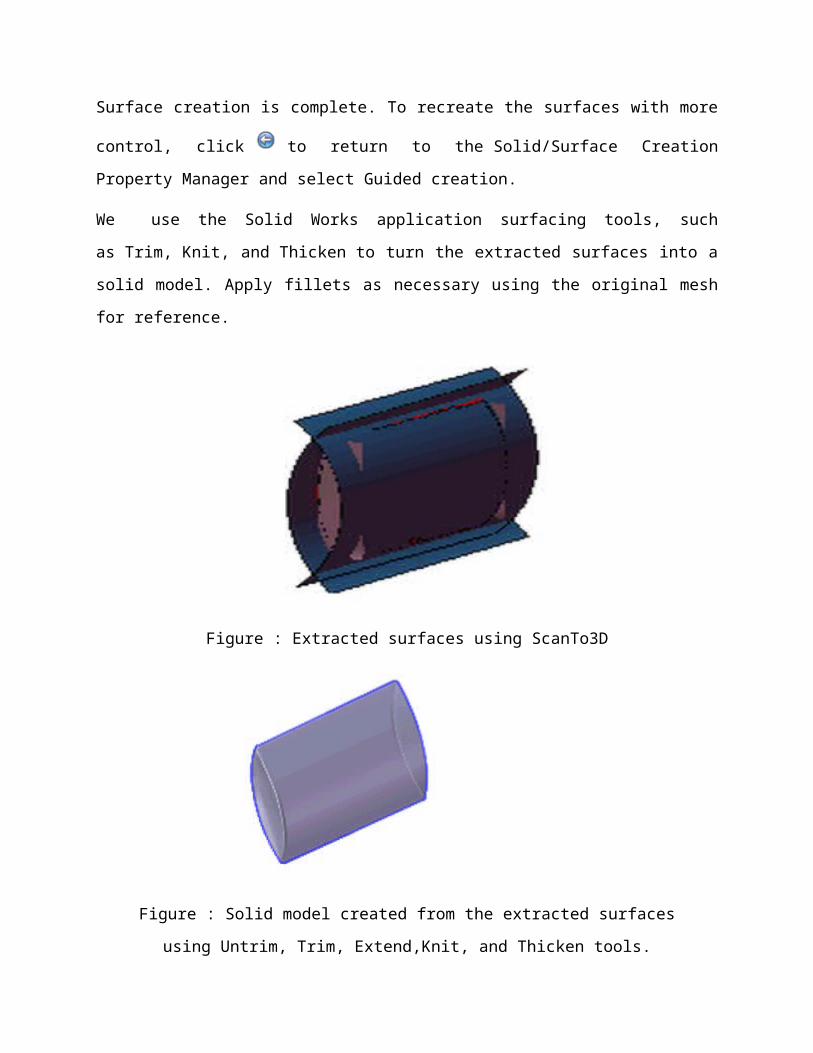
Surface creation is complete. To recreate the surfaces with more control, click to return to
the Solid/Surface Creation Property Manager and select Guided creation.
We use the Solid Works application surfacing tools, such as Trim, Knit, and Thicken to turn the
extracted surfaces into a solid model. Apply fillets as necessary using the original mesh for
reference.
Figure : Extracted surfaces using ScanTo3D
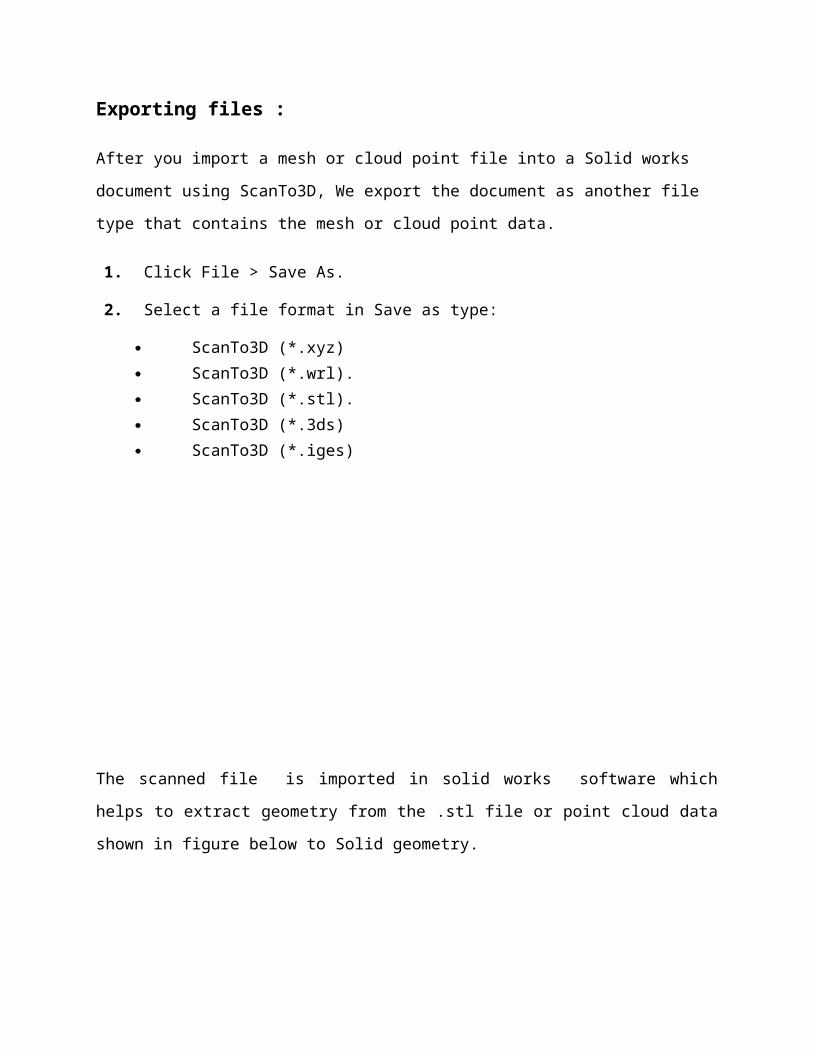
Figure : Solid model created from the extracted surfaces using Untrim, Trim, Extend,Knit,
and Thicken tools.
Exporting files :
After you import a mesh or cloud point file into a Solid works document using ScanTo3D, We
export the document as another file type that contains the mesh or cloud point data.
1. Click File > Save As.
2. Select a file format in Save as type:
ScanTo3D (*.xyz)
ScanTo3D (*.wrl).
ScanTo3D (*.stl).
ScanTo3D (*.3ds)
ScanTo3D (*.iges)
The scanned file is imported in solid works software which helps to extract geometry from
the .stl file or point cloud data shown in figure below to Solid geometry.
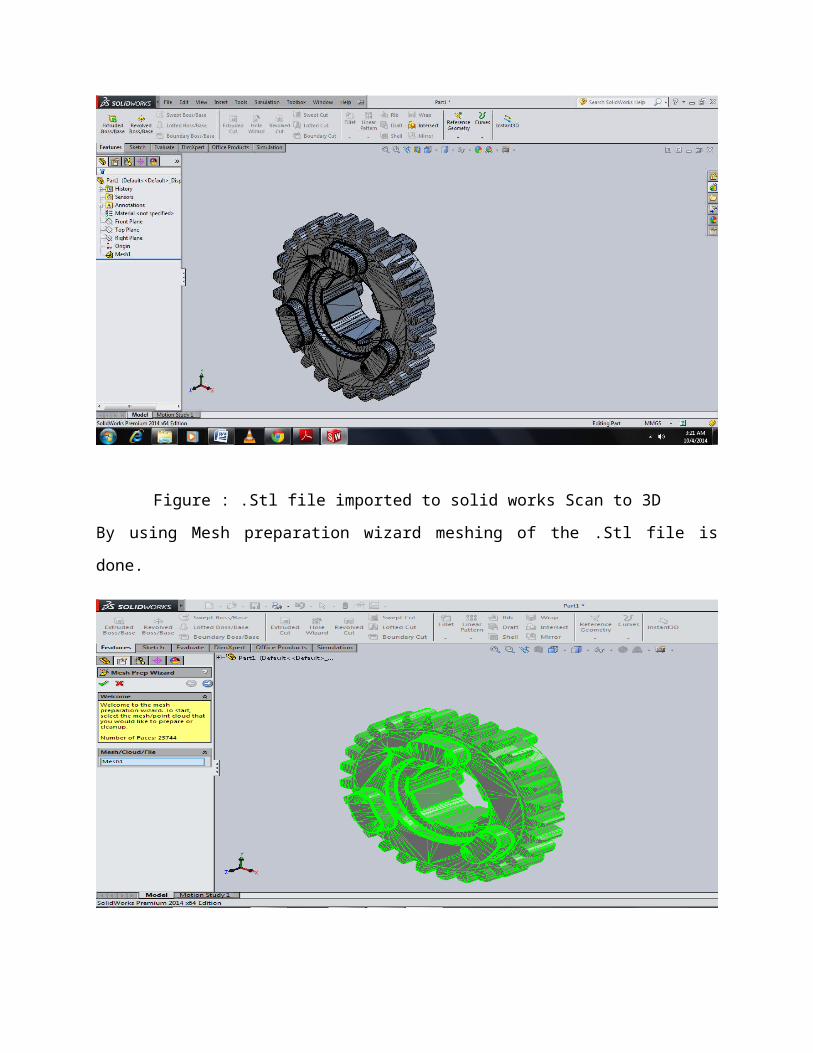
Figure : .Stl file imported to solid works Scan to 3D
By using Mesh preparation wizard meshing of the .Stl file is done.

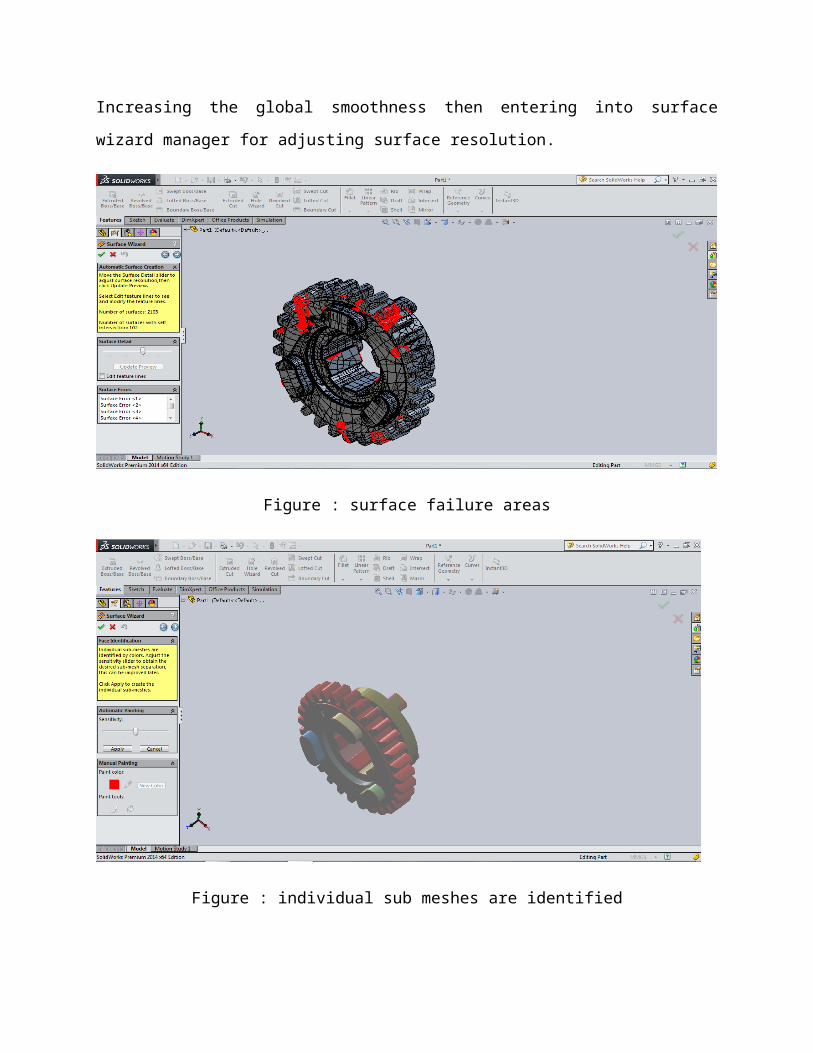
Increasing the global smoothness then entering into surface wizard manager for adjusting surface
resolution.
Figure : surface failure areas
Figure : individual sub meshes are identified
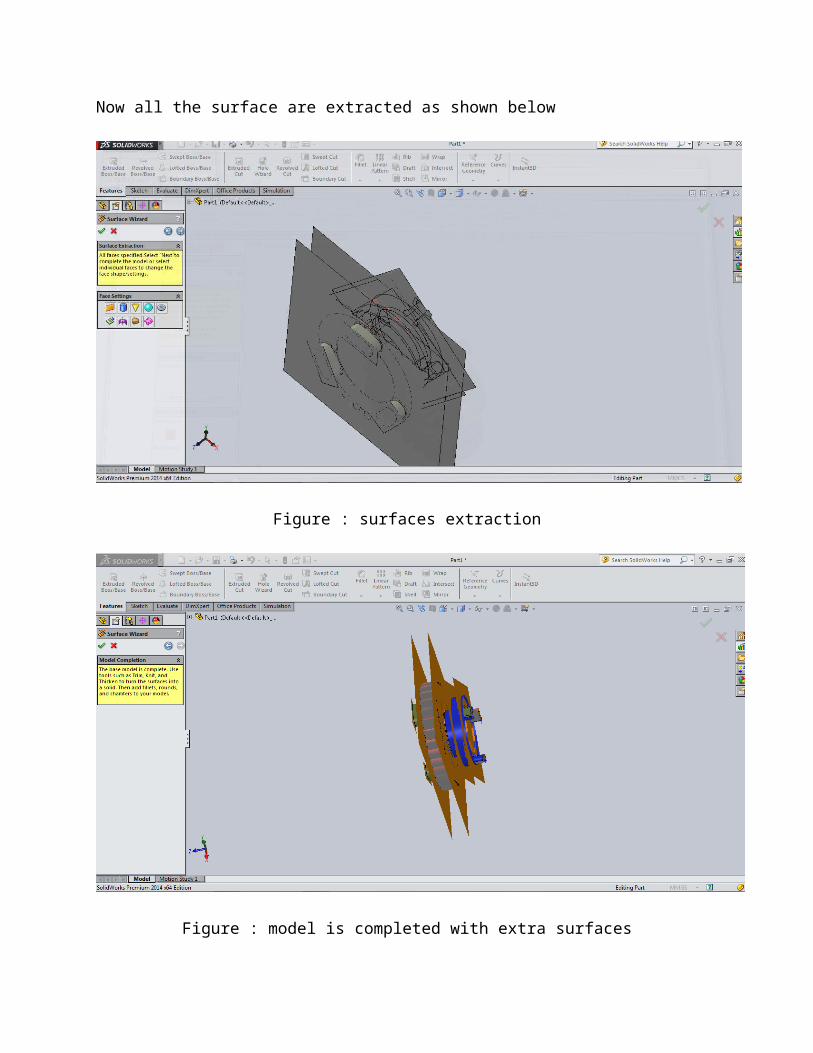
Now all the surface are extracted as shown below
Figure : surfaces extraction
Figure : model is completed with extra surfaces
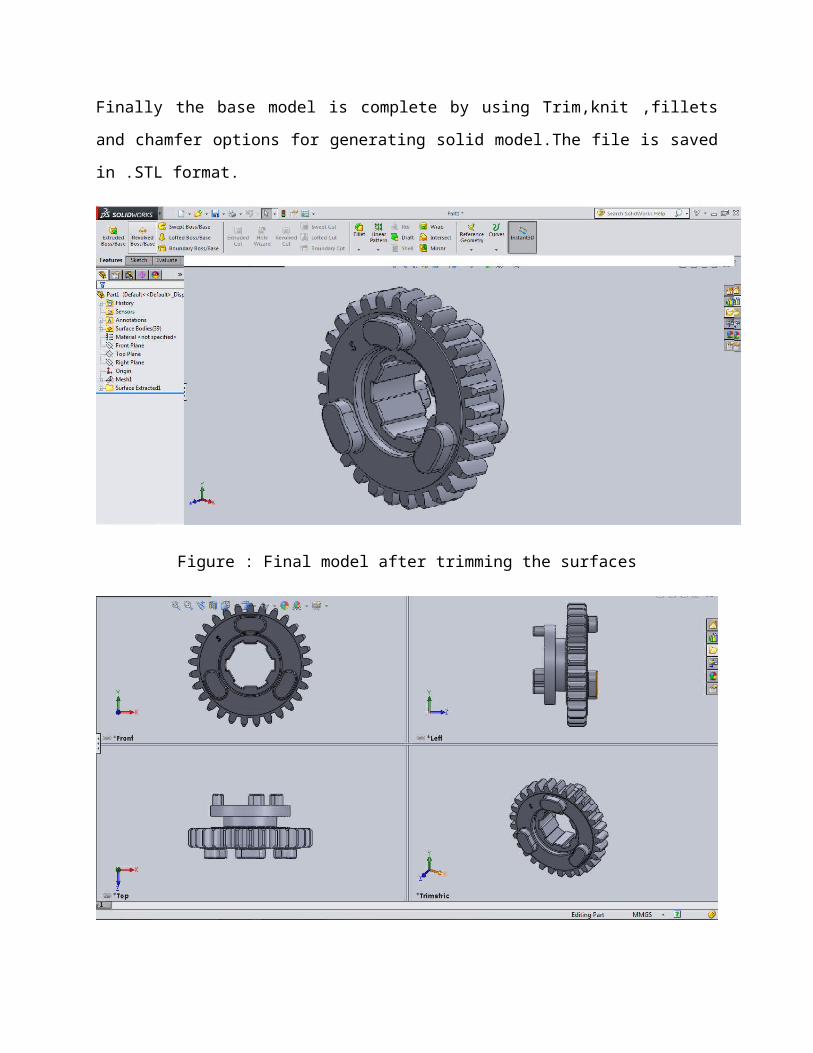
Finally the base model is complete by using Trim,knit ,fillets and chamfer options for generating
solid model.The file is saved in .STL format.
Figure : Final model after trimming the surfaces
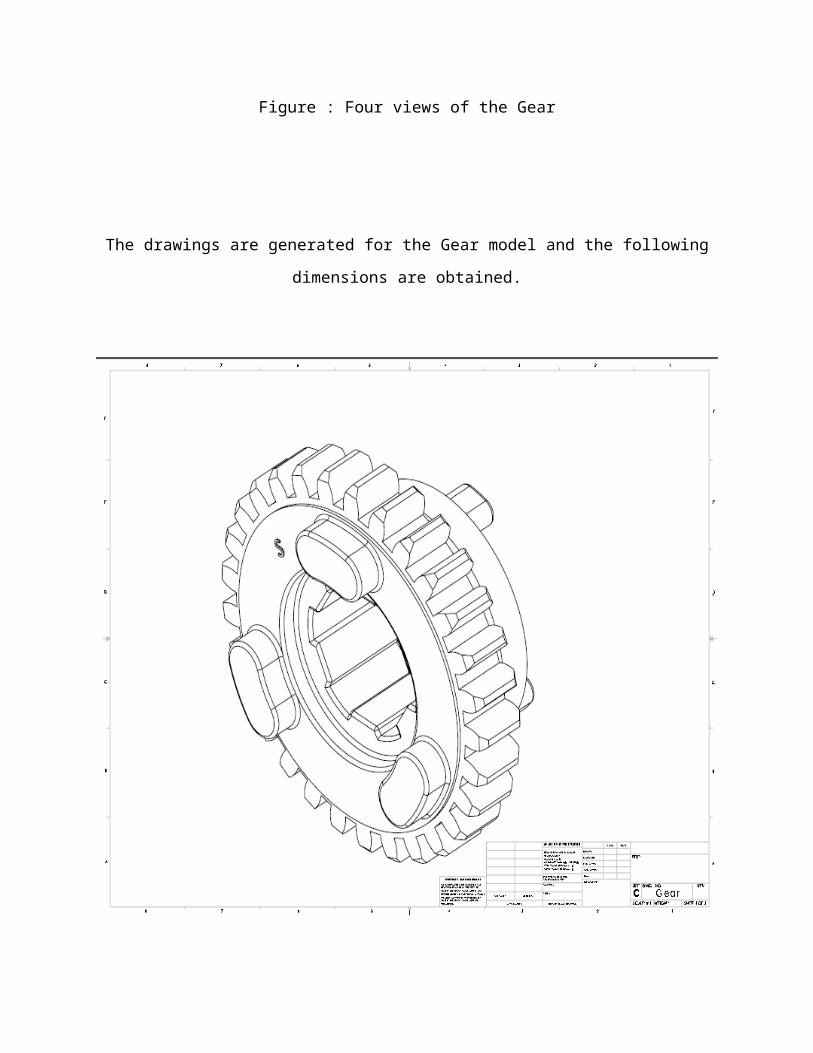
Figure : Four views of the Gear
The drawings are generated for the Gear model and the following dimensions are obtained.
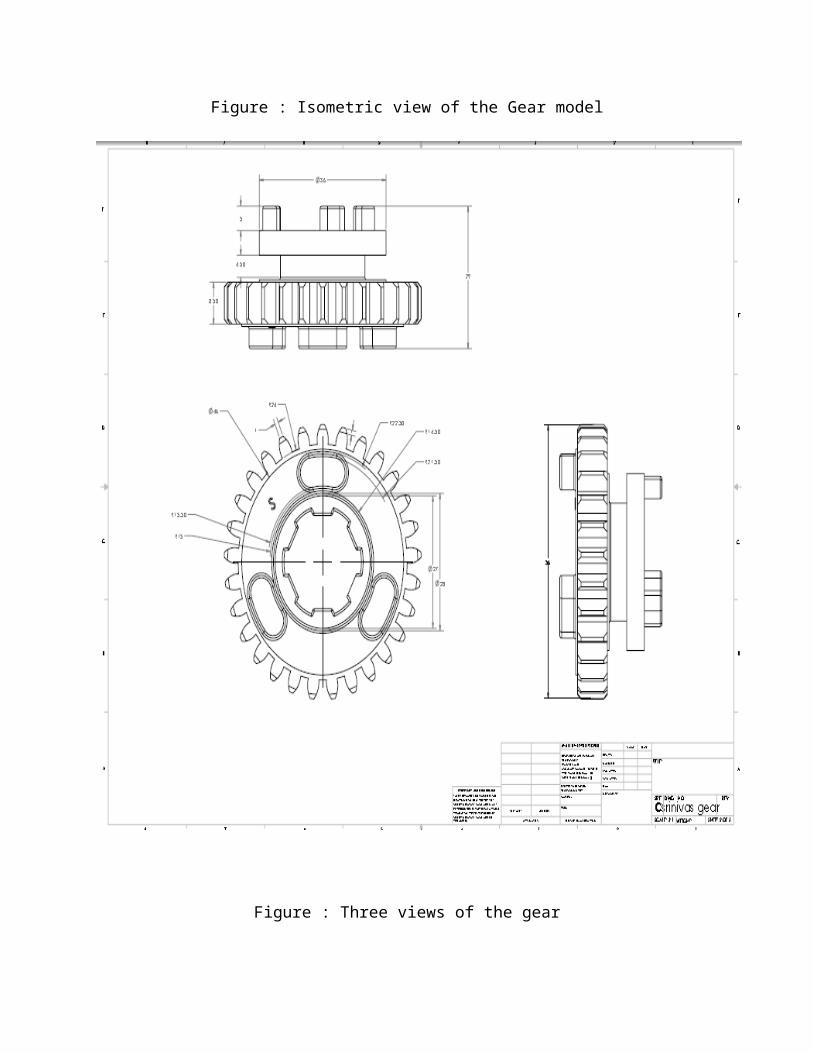
Figure : Isometric view of the Gear model

Figure : Three views of the gear
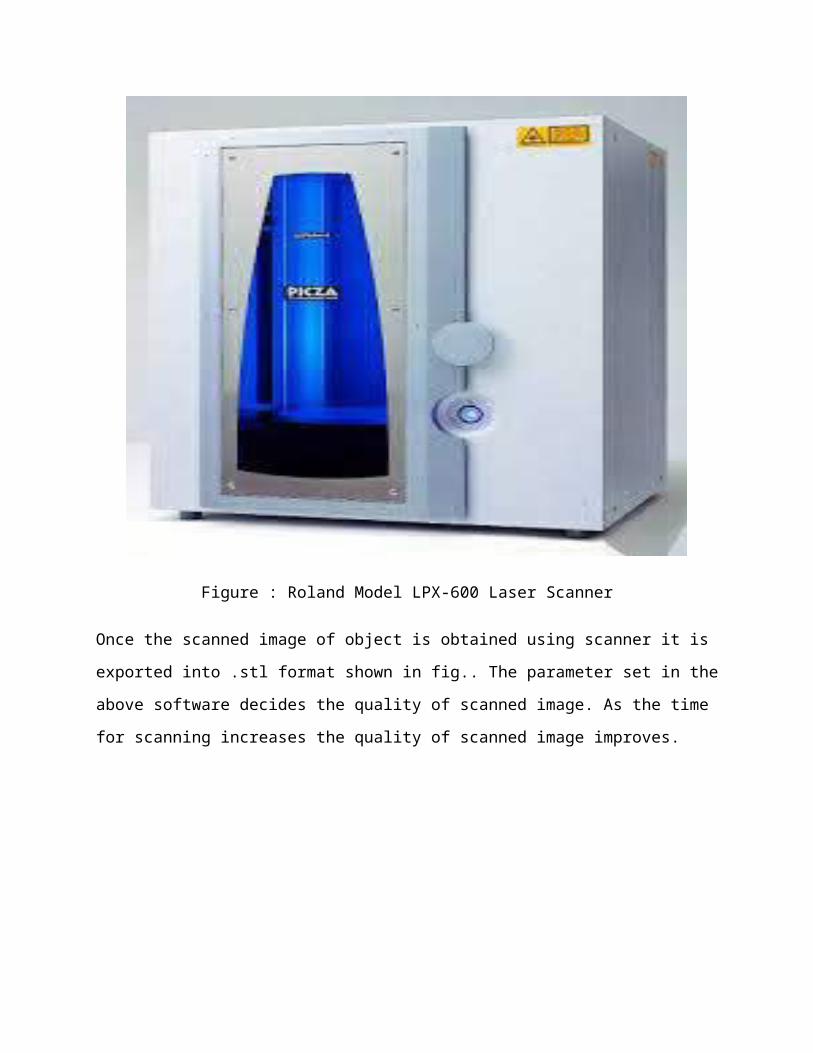
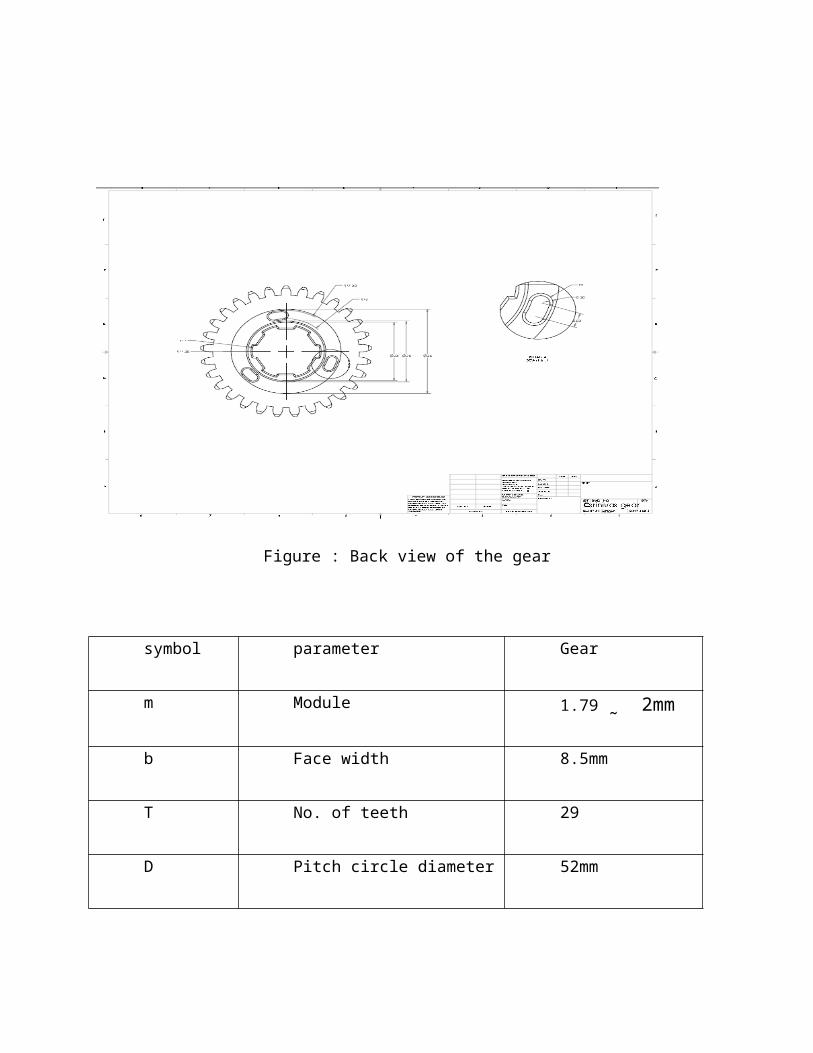
Figure : Back view of the gear
symbol parameter Gear
m Module 1.79 ˷ 2mm
b Face width 8.5mm
T No. of teeth 29
D Pitch circle diameter 52mm
Profile 20 degree full depth
involute
Table: Dimensions obtained for Gear
INTRODUCTION TO SOLID WORKS SIMULATION :
Solid Works® Simulation is a design analysis system fully integrated with Solid works. Solid
Works Simulation provides simulation solutions for linear and nonlinear static, frequency,
buckling, thermal, fatigue, pressure vessel, drop test, linear and nonlinear dynamic, and
optimization analyses.
Powered by fast and accurate solvers, Solid works Simulation enables you to solve large
problems intuitively while you design. Solid works Simulation comes in two bundles: Solid
works Simulation Professional and Solid works Simulation Premium to satisfy your analysis
needs. Solid works Simulation shortens time to market by saving time and effort in searching for
the optimum design.
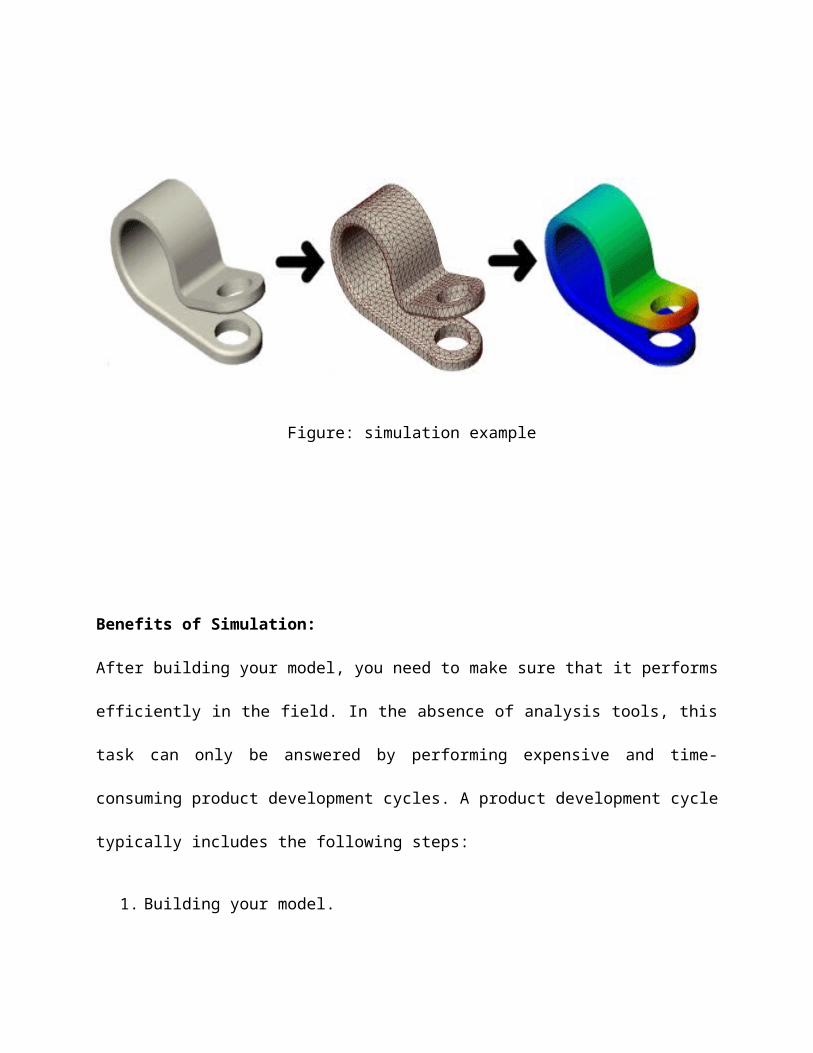
Figure: simulation example
Benefits of Simulation:
After building your model, you need to make sure that it performs efficiently in the field. In the
absence of analysis tools, this task can only be answered by performing expensive and time-
consuming product development cycles. A product development cycle typically includes the
following steps:
1. Building your model.
2. Building a prototype of the design.
3. Testing the prototype in the field.
4. Evaluating the results of the field tests.
5. Modifying the design based on the field test results.
This process continues until a satisfactory solution is reached. Analysis can help you accomplish
the following tasks:
Reduce cost by simulating the testing of your model on the computer instead of
expensive field tests.
Reduce time to market by reducing the number of product development cycles.
Improve products by quickly testing many concepts and scenarios before making a final
decision, giving you more time to think of new designs.
Basic Concepts of Analysis :
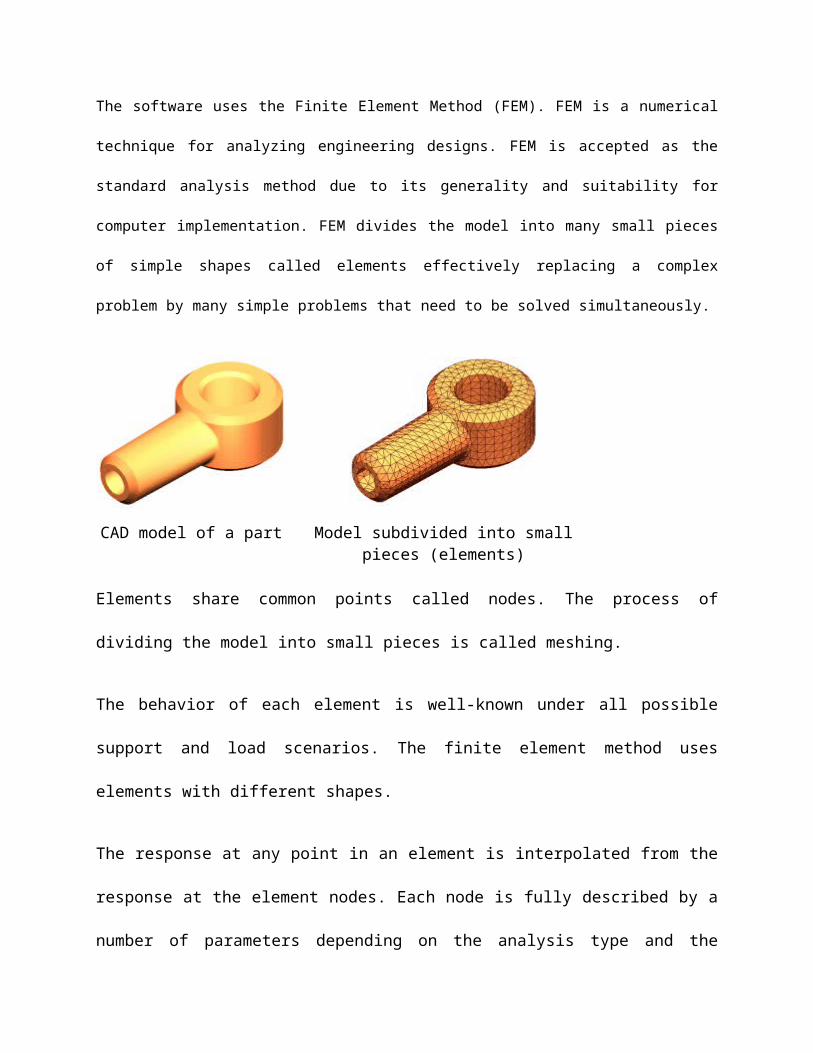
The software uses the Finite Element Method (FEM). FEM is a numerical technique for analyzing
engineering designs. FEM is accepted as the standard analysis method due to its generality and
suitability for computer implementation. FEM divides the model into many small pieces of simple shapes
called elements effectively replacing a complex problem by many simple problems that need to be
solved simultaneously.
CAD model of a part Model subdivided into small pieces (elements)
Elements share common points called nodes. The process of dividing the model into small pieces
is called meshing.
The behavior of each element is well-known under all possible support and load scenarios. The
finite element method uses elements with different shapes.
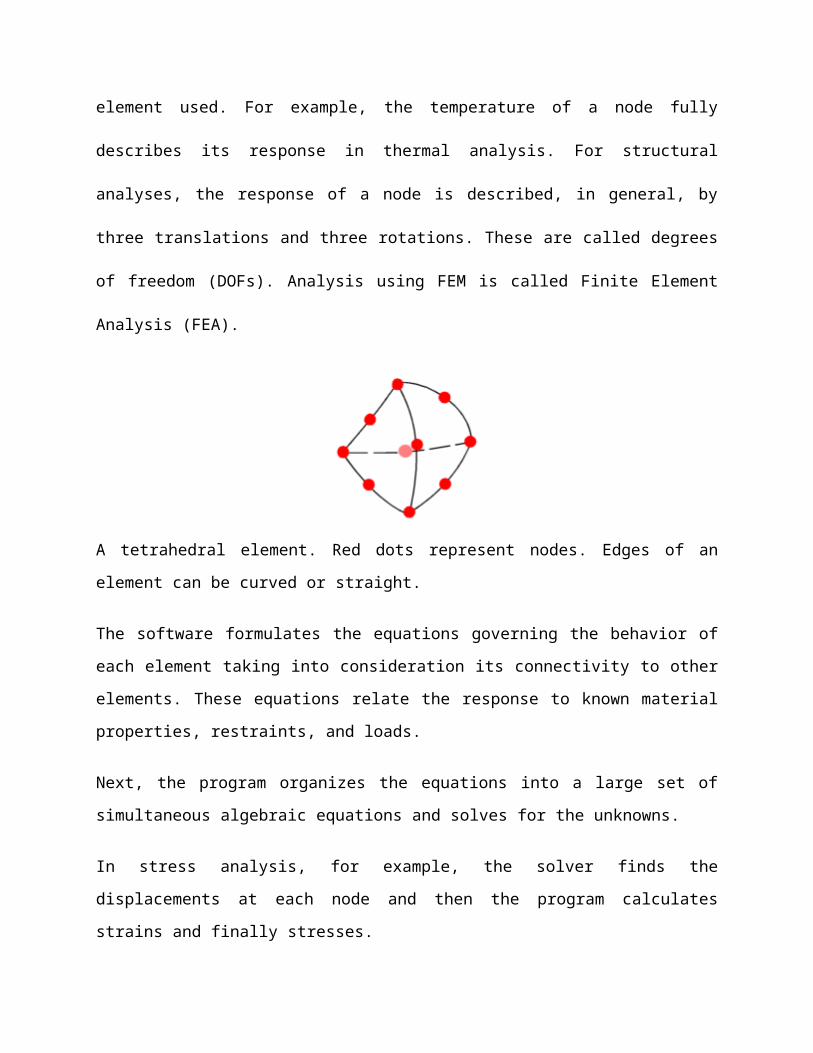
The response at any point in an element is interpolated from the response at the element nodes.
Each node is fully described by a number of parameters depending on the analysis type and the
element used. For example, the temperature of a node fully describes its response in thermal
analysis. For structural analyses, the response of a node is described, in general, by three
translations and three rotations. These are called degrees of freedom (DOFs). Analysis using
FEM is called Finite Element Analysis (FEA).
A tetrahedral element. Red dots represent nodes. Edges of an element can be curved or straight.
The software formulates the equations governing the behavior of each element taking into
consideration its connectivity to other elements. These equations relate the response to known
material properties, restraints, and loads.
Next, the program organizes the equations into a large set of simultaneous algebraic equations
and solves for the unknowns.
In stress analysis, for example, the solver finds the displacements at each node and then the
program calculates strains and finally stresses.
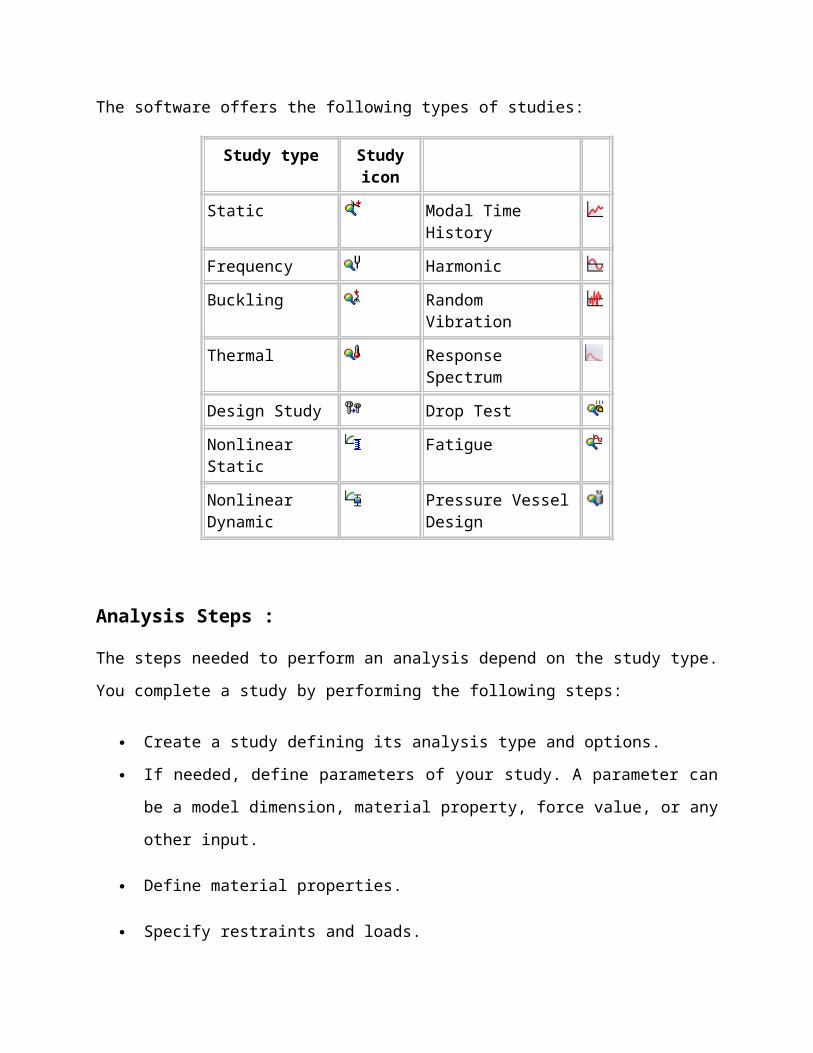
The software offers the following types of studies:
Study type Study icon
Static Modal Time History
Frequency Harmonic
Buckling Random Vibration
Thermal Response Spectrum
Design Study Drop Test
Nonlinear Static Fatigue
Nonlinear Dynamic Pressure Vessel Design
Analysis Steps :
The steps needed to perform an analysis depend on the study type. You complete a study by
performing the following steps:
Create a study defining its analysis type and options.
If needed, define parameters of your study. A parameter can be a model dimension,
material property, force value, or any other input.
Define material properties.
Specify restraints and loads.
The program automatically creates a mixed mesh when different geometries (solid, shell,
structural members etc.) exist in the model.
Define component contact and contact sets.
Mesh the model to divide the model into many small pieces called elements. Fatigue and
optimization studies use the meshes in referenced studies.
Run the study.
View results.
Specific capabilities of Solid works Simulation :
1. Static Analysis:When loads are applied to a body, the body deforms and the effect of loads is
transmitted throughout the body. The external loads induce internal forces and reactions
to render the body into a state of equilibrium. Linear Static analysis calculates
displacements, strains, stresses, and reaction forces under the effect of applied loads.
2. Thermal Stress Analysis:
Changes in temperature can induce substantial deformations, strains, and stresses.
Thermal stress analysis refers to static analysis that includes the effect of temperature.
Perform thermal stress analysis using one of the following options:
Using a uniform rise or drop in temperature for the whole model.
Using a temperature profile resulting from a steady state or transient thermal
analysis.
Using a temperature profile from Flow Simulation.
3. Frequency analysis :
If the design is subjected to dynamic environments, static studies cannot be used to
evaluate the response. Frequency studies can help you avoid resonance and design
vibration isolation systems. They also form the basis for evaluating the response of linear
dynamic systems where the response of a system to a dynamic environment is assumed to
be equal to the summation of the contributions of the modes considered in the analysis.
4. Dynamic analysis :
Dynamic analysis includes:
Design structural and mechanical systems to perform without failure in dynamic
environments.
Modify system's characteristics (i.e., geometry, damping mechanisms, material
properties, etc.) to reduce vibration effects.
5. Buckling analysis :
Used to calculate the buckling loads and determine the buckling mode shape. Both linear
(Eigen value) buckling and nonlinear buckling analyses are possible.
6. Non-linear static analysis :
All real structures behave nonlinearly in one way or another at some level of loading. In
some cases, linear analysis may be adequate. In many other cases, the linear solution can
produce erroneous results because the assumptions upon which it is based are violated.
Nonlinearity can be caused by the material behavior, large displacements, and contact
conditions. We can use a nonlinear study to solve a linear problem. The results can be
slightly different due to different procedures.In the nonlinear static analysis, dynamic
effects like inertial and damping forces are not considered.
7. Drop test studies :
Drop test studies evaluate the effect of the impact of a part or an assembly with a rigid or
flexible planar surface. Dropping an object on the floor is a typical application and hence
the name. The program calculates impact and gravity loads automatically. No other loads
or restraints are allowed.
8. Fatigue Analysis :
Fatigue is the prime cause of the failure of many objects, especially those made of metals.
Examples of failure due to fatigue include, rotating machinery, bolts, airplane wings,
consumer products, offshore platforms, ships, vehicle axles, bridges, and bones.
Linear and nonlinear structural studies do not predict failure due to fatigue.
9. Pressure vessel Design study :
In a Pressure Vessel Design study, you combine the results of static studies with the
desired factors. Each static study has a different set of loads that produce corresponding
results. These loads can be dead loads, live loads (approximated by static loads), thermal
loads, seismic loads, and so on. The Pressure Vessel Design study combines the results of

the static studies algebraically using a linear combination or the square root of the sum of
the squares (SRSS).
STRUCTURAL ANALYSIS OF GEAR
Gear analysis can be performed using analytical methods which required a number of
assumption and simplifications which aim at getting the maximum stress values only but
gear analyses are multidisciplinary including calculations related to the tooth stresses .In this
work, an attempt will been made to analyze bending stress to resist bending of helical gears, as
both affect transmission error. Due to the progress of computer technology many researchers
tended to use numerical Methods to develop theoretical models to calculate the effect of
whatever is studied. numerical methods are capable of providing more truthful solution since
they require very lessrestrictive assumptions. However, the developed model and its solution
method must e selected attentively to ensure that the results are more acceptable and its
computational time is reasonable. The dimension of the model have been arrived at by
theoretical methods. The stress generated of the tooth have been analyzed for materials. Finally
the results obtained by theoretical analysis, AGMA calculations and finite element analysis are
compared to check the correctness.
This procedure is based on the principle of differential geometry that pertains to envelopes of
curves and surfaces.
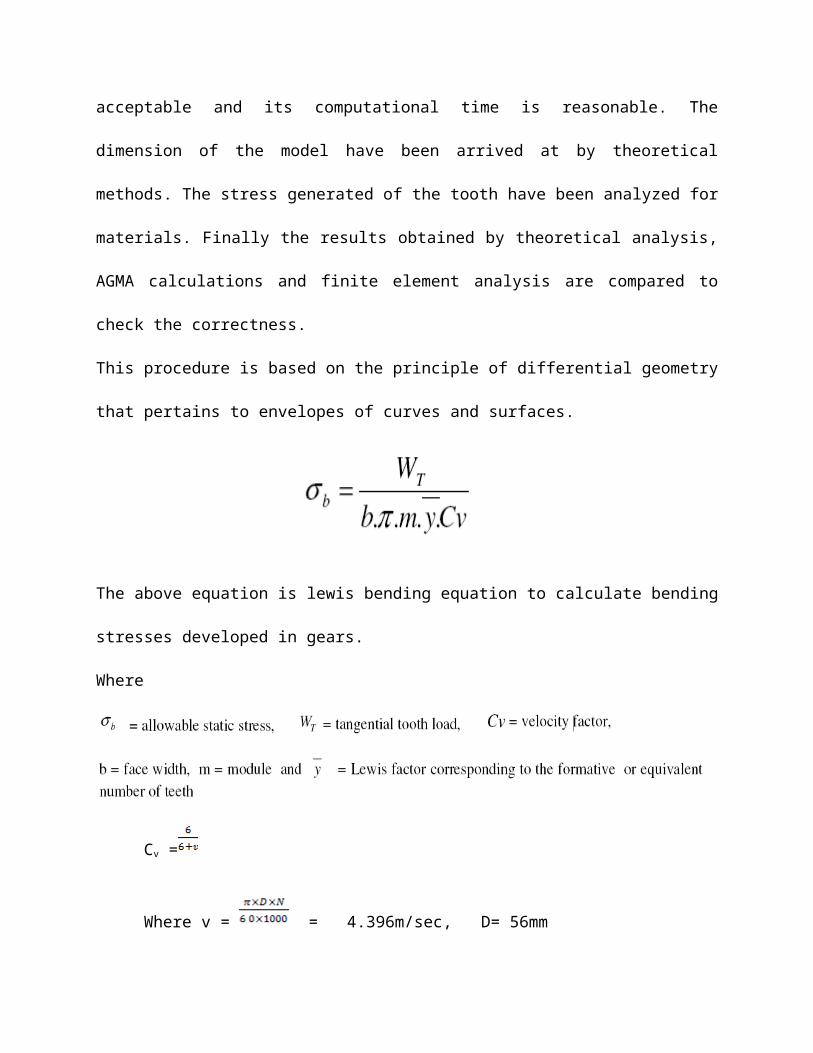
The above equation is lewis bending equation to calculate bending stresses developed in gears.
Where
Cv =
Where v = = 4.396m/sec, D= 56mm
D= diameter of gear
N=speed .rpm =1500 rpm
Cv = = 0.577
Taking tangential load =500N and y = 0.32
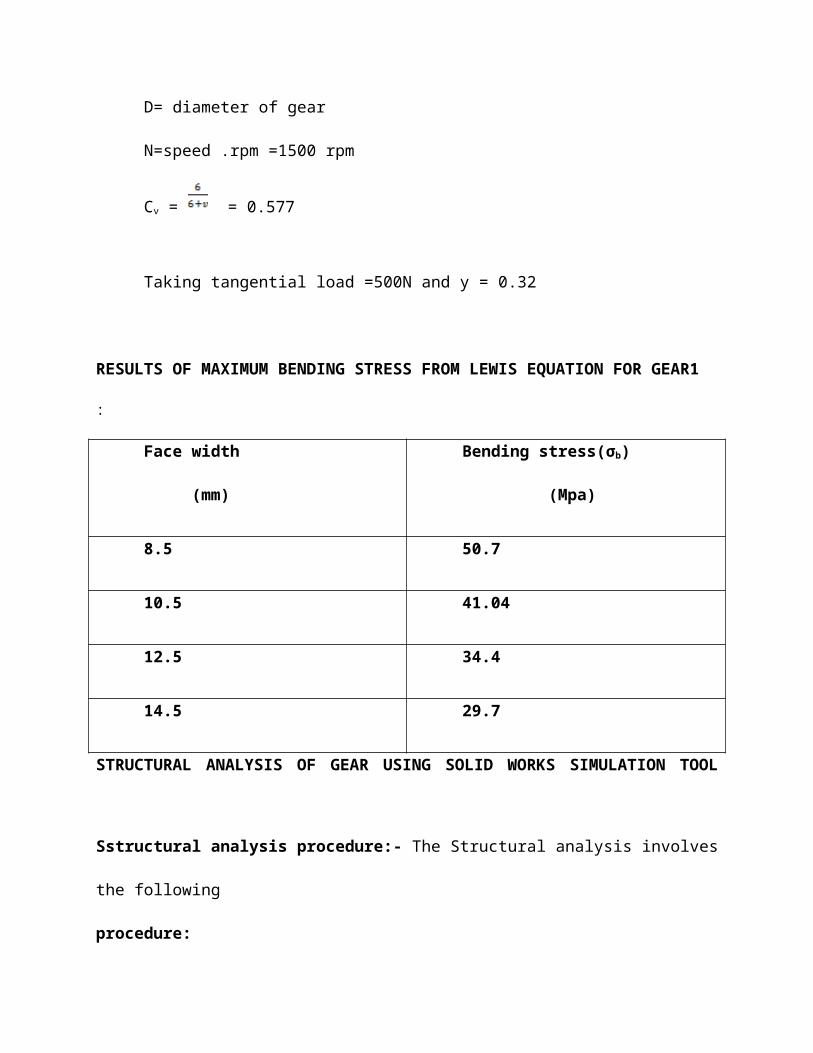
RESULTS OF MAXIMUM BENDING STRESS FROM LEWIS EQUATION FOR
GEAR1 :
Face width
(mm)
Bending stress(σb)
(Mpa)
8.5 50.7
10.5 41.04
12.5 34.4
14.5 29.7
STRUCTURAL ANALYSIS OF GEAR USING SOLID WORKS SIMULATION TOOL
Sstructural analysis procedure:- The Structural analysis involves the following
procedure:
_ Pre-Processing: It include the description of the geometry or model, the physical
characteristics of the model.
Definition of type of analysis, material properties, Loads and boundary conditions
_ Solution: it involves the application of the finite element analysis
_ Run analysis to obtain solution (stresses).
_ Post-Processing: It includes the visualization and interpretation of the results of the solution.
PERFORMING STATIC ANALYSIS ON GEAR
The structural stress analysis of the gear tooth model is carry out using the FEA in
Solid works simulation .The load applied at the tooth of the gear by applying the analysis over
the tooth which is facing the load we get the stress distribution in the numeric as well as in the
form of the color scheme.
STUDY PROPERTIES :
Study name Static 1
Analysis type Static
Mesh type Solid Mesh
Thermal Effect: On
Thermal option Include temperature loads
Zero strain temperature 298 Kelvin
Include fluid pressure effects from Solid works Flow Simulation
Off
Solver type FFEPlus
Inplane Effect: Off
Soft Spring: Off
Inertial Relief: Off
Incompatible bonding options Automatic
Large displacement Off
Compute free body forces On
Friction Off
Use Adaptive Method: Off
Result folder Solid works document (C:\Users\srinivas\Desktop)
Units :
Unit system: SI (MKS)
Length/Displacement mm
Temperature Kelvin
Angular velocity Rad/sec
Pressure/Stress N/m^2
Material Properties :
Model Reference Properties Components
Name: Alloy Steel
Model type: Linear Elastic Isotropic
Default failure criterion:
Max von Mises Stress
Yield strength: 6.20422e+008 N/m^2
Tensile strength: 7.23826e+008 N/m^2
Elastic modulus: 2.1e+011 N/m^2
Poisson's ratio: 0.28
Mass density: 7700 kg/m^3
Shear modulus: 7.9e+010 N/m^2
Thermal expansion coefficient:
1.3e-005 /Kelvin
SolidBody 1(Fillet8)(srinivas gear)
Loads and Fixtures:
Fixture name Fixture Image Fixture Details
Fixed-1
Entities: 6 face(s)
Type: Fixed Geometry
Resultant Forces
Components X Y Z Resultant
Reaction force(N) 443.107 -197.792 -0.00437104 485.248
Reaction Moment(N.m) 0 0 0 0
Load name Load Image Load Details
Force-1
Entities: 1 face(s)
Type: Apply normal force
Value: 500 N
Phase Angle: 0
Units: deg
Mesh Information :
Mesh type Solid Mesh
Mesher Used: Standard mesh
Automatic Transition: Off
Include Mesh Auto Loops: Off
Jacobian points 4 Points
Element Size 2.7397 mm
Tolerance 0.136985 mm
Mesh Quality High
Mesh Information - Details
Total Nodes 27167
Total Elements 16148
Maximum Aspect Ratio 15.563
% of elements with Aspect Ratio < 3 83.9
% of elements with Aspect Ratio > 10 0.142
% of distorted elements(Jacobian) 0
Time to complete mesh(hh;mm;ss): 00:00:12
Computer name: Srinivas-PC
Study Results for face width 8.5 mm :
Name Type Min Max
Stress1 VON: von Mises Stress 30.9186 N/m^2
Node: 10906
4.7972e+007 N/m^2
Node: 1280
Name Type Min Max
Name Type Min Max
Displacement1 URES: Resultant Displacement
0 mm
Node: 698
0.00307442 mm
Node: 15382
Name Type Min Max
Name Type Min Max
Strain1 ESTRN: Equivalent Strain 8.80717e-011
Element: 5061
0.000172154
Element: 5473
Name Type Min Max
Factor of Safety1 Automatic 12.933
Node: 1280
2.00663e+007
Node: 10906
A factor of safety less than 1 at a location indicates that the material at that location has failed.A
factor of safety of 1 at a location indicates that the material at that location has just started to fail.
A factor of safety greater than 1 at a location indicates that the material at that location is safe.
So our design is safe for given loading condition.
Study Results for face width 10.5 mm :
Name Type Min Max
Stress1 VON: von Mises Stress 3.92889 N/m^2
Node: 11761
4.02837e+007 N/m^2
Node: 19002
Name Type Min Max
Displacement1 URES: Resultant Displacement 0 mm
Node: 674
0.00248392 mm
Node: 1646
Name Type Min Max
Name Type Min Max
Strain1 ESTRN: Equivalent Strain 5.21391e-011
Element: 5529
0.000142769
Element: 5826
Name Type Min Max
Factor of Safety1 Automatic 15.4013
Node: 19002
1.57913e+008
Node: 11761
STUDY RESULTS FOR FACE WIDTH 12.5MM :
Name Type Min Max
Stress1 VON: von Mises Stress 15.9894 N/m^2
Node: 23297
2.92143e+007 N/m^2
Node: 1113
Name Type Min Max
Displacement1 URES: Resultant Displacement 0 mm
Node: 617
0.00171887 mm
Node: 1464

Name Type Min Max
Name Type Min Max
Strain1 ESTRN: Equivalent Strain 5.93542e-011
Element: 5036
7.72139e-005
Element: 13711
Name Type Min Max
Factor of Safety1 Automatic 21.237
Node: 1113
3.88021e+007
Node: 23297
Name Type Min Max
STUDY RESULTS FOR FACE WIDTH 14.5mm :
Name Type Min Max
Stress1 VON: von Mises Stress 14.9038 N/m^2
Node: 24243
2.57757e+007 N/m^2
Node: 14953
Name Type Min Max
Displacement1 URES: Resultant Displacement 0 mm
Node: 643
0.00206972 mm
Node: 1548
Name Type Min Max
Strain1 ESTRN: Equivalent Strain 3.18208e-011
Element: 5186
9.05585e-005
Element: 12900
Name Type Min Max
Factor of Safety1 Automatic 24.07 4.16285e+007
Name Type Min Max
Node: 14953 Node: 24243
RESULTS AND DISCUSSIONS
The structural stress analysis of the gear tooth model is carry out using the FEA in Solid works
simulation. The load applied at the tooth of the gear .by applying the analysis over the tooth
which is facing the load we get the stress distribution in the numeric as well as in the form of the
color scheme. By varying the face width and keeping the other parameters constant various
models of the gear are created. For determining at any stage during the design of the gear face
width is an important parameter. The results of the variation in face width from (8.5 mm to
14.5mm) there is continuous decrement in the value of the stress of the tooth of the gear stress.
Results of theoretical and static analysis are closer, therefore the design are accepted. As it is
seen clearly from all tables and graphs the maximum bending stress values are increases with the
decrease of face width. In this work we got on two results as follow
_ Theoretical results (from Lewis equation directly)
_ static analysis results
And all results are closer as shown in graphs.
Effect of face width :
The effect face width on maximum bending stress is study by varying the face width for five
Values which are (b=8.5mm, 10.5mm, 12.5mm, 14.5mm) the magnitude of the stresses
obtained for those face widths are displayed .
COMPARISION OF THEORETICAL STRESS VALUES AND SOLID WORKS
VALUES
Face width
(mm)
Bending
stresses Mpa
(lewis equation)
Bending
stresses Mpa
(static analysis)
8.5 50.7 47.2
10.5 41.04 40.2
12.5 34.4 29.2
14.5 29.7 25.2
Table : comparison of bending stresses (theoretical and
software )
INTRODUCTION TO RAPID PROTOTYPING:
Rapid Prototyping (RP) can be defined as a group of techniques used to quickly fabricate
a scale model of a part or assembly using three-dimensional computer aided design (CAD) data.
What is commonly considered to be the first RP technique, Stereo-lithography, was developed by
3D Systems of Valencia, CA, USA. The company was founded in 1986, and since then, a number
of different RP techniques have become available.
Rapid Prototyping has also been referred to as solid free-form manufacturing; computer
automated manufacturing, and layered manufacturing. RP has obvious use as a vehicle for
visualization. In addition, RP models can be used for testing, such as when an airfoil shape is put
into a wind tunnel. RP models can be used to create male models for tooling, such as silicone
rubber molds and investment casts. In some cases, the RP part can be the final part, but typically
the RP material is not strong or accurate enough. When the RP material is suitable, highly
convoluted shapes (including parts nested within parts) can be produced because of the nature of
RP.
There is a multitude of experimental RP methodologies either in development or used by
small groups of individuals. This section will focus on RP techniques that are currently
commercially available, including Stereo-lithography (SLA), Selective Laser Sintering (SLS®),
Laminated Object Manufacturing (LOM™), Fused Deposition Modeling (FDM), 3D printing,
and Ink Jet printing techniques
Why Rapid Prototyping ?
The reasons of Rapid Prototyping are
• To increase effective communication.
• To decrease development time.
• To decrease costly mistakes.
• To minimize sustaining engineering changes
• To extend product lifetime by adding necessary features and eliminating redundant
features early in the design.
Rapid Prototyping decreases development time by allowing corrections to a product to be made
early in the process. By giving engineering, manufacturing, marketing, and purchasing a look at
the product early in the design process, mistakes can be corrected and changes can be made
while they are still inexpensive. The trends in manufacturing industries continue to emphasize
the following:
• Increasing number of variants of products.
• Increasing product complexity.
• Decreasing product lifetime before obsolescence.
• Decreasing delivery time.
4.2 Methodology of Rapid Prototyping
The basic methodology for all current rapid prototyping techniques can be summarized as
follows:
1. A CAD model is constructed, and then converted to STL format. The resolution can be
set to minimize stair stepping.
2. The RP machine processes the .STL file by creating sliced layers of the model.
3. The first layer of the physical model is created. The model is then lowered by the
thickness of the next layer, and the process is repeated until completion of the model.
4. The model and any supports are removed. The surface of the model is then finished and
cleaned
STEREO-LITHOGRAPHY
The implementation shown is used by 3D Systems and some foreign manufacturers. A moveable
table, or elevator (A), initially is placed at a position just below the surface of a vat (B) filled
with liquid photopolymer resin (C). This material has the property that when light of the correct
color strikes it, it turns from a liquid to a solid. The most common photopolymer materials used
require an ultraviolet light, but resins that work with visible light are also utilized. The system is
sealed to prevent the escape of fumes from the resin.
Fig: 4.2.1 STEREO-LITHOGRAPHY
After the layer is completely traced and for the most part hardened by the beam, the table is
lowered into the vat a distance equal to the thickness of a layer. The resin is generally quite
viscous, however. To speed this process of recoating, early stereolithography systems drew a
knife edge (E) over the surface to smooth it. More recently pump-driven recoating systems have
been utilized. The tracing and recoating steps are repeated until the object is completely
fabricated and sits on the table within the vat.
LAMINATED OBJECT MANUFACTURING
Profiles of object cross sections are cut from paper using a CO2 laser as shown in Fig. 2. The
paper is unwound from a feed roll (A) onto the stack and bonded to the previous layer using a
heated roller (B). The roller melts a plastic coating on the bottom side of the paper to create the
bond. The profiles are traced by an optics system that is mounted to an X-Y stage (C). The
process generates considerable smoke. Either a chimney or a charcoal filtration system is
required (E) and the build chamber must be sealed.
After cutting the geometric features of a layer is completed, the excess paper is cut away to
separate the layer from the web. The extra paper of the web is wound on a take-up roll (D). The
method is self-supporting for overhangs and undercuts. Areas of cross sections which are to be
removed in the final object are heavily cross-hatched with the laser to facilitate removal.
Fig: 4.2.2 Laminated Object Manufacturing
FUSED DEPOSITION MODELING
FDM is the second most widely used rapid prototyping technology, after stereo-
lithography. A plastic filament, approximately 1/16 inch in diameter, is unwound from a coil (A)
and supplies material to an extrusion nozzle (B). Some configurations of the machinery have
used plastic pellets fed from a hopper rather than a filament. The nozzle is heated to melt the
plastic and has a mechanism which allows the flow of the melted plastic to be controlled. The
nozzle is mounted to a mechanical stage (C) which can be moved in horizontal and vertical
directions
As the nozzle is moved over the table (D) in the required geometry, it deposits a thin bead of
extruded plastic to form each layer. The plastic hardens immediately after being squirted from
the nozzle and bonds to the layer below. The entire system is contained within an oven chamber
which is held at a temperature just below the melting point of the plastic. Thus, only a small
amount of additional thermal energy needs to be supplied by the extrusion nozzle to cause the
plastic to melt. This provides much better control of the process.
Fig: 4.2.3 Fused Deposition Modeling
THREE DIMENSIONAL PRINTING
The system was developed at MIT and is shown schematically in Fig. 6. The method is
very reminiscent of selective laser sintering, except that the laser is replaced by an inkjet head.
The multi-channel jetting head (A) deposits a liquid adhesive compound onto the top layer of a
bed of powder object material (B). The particles of the powder become bonded in the areas
where the adhesive is deposited.
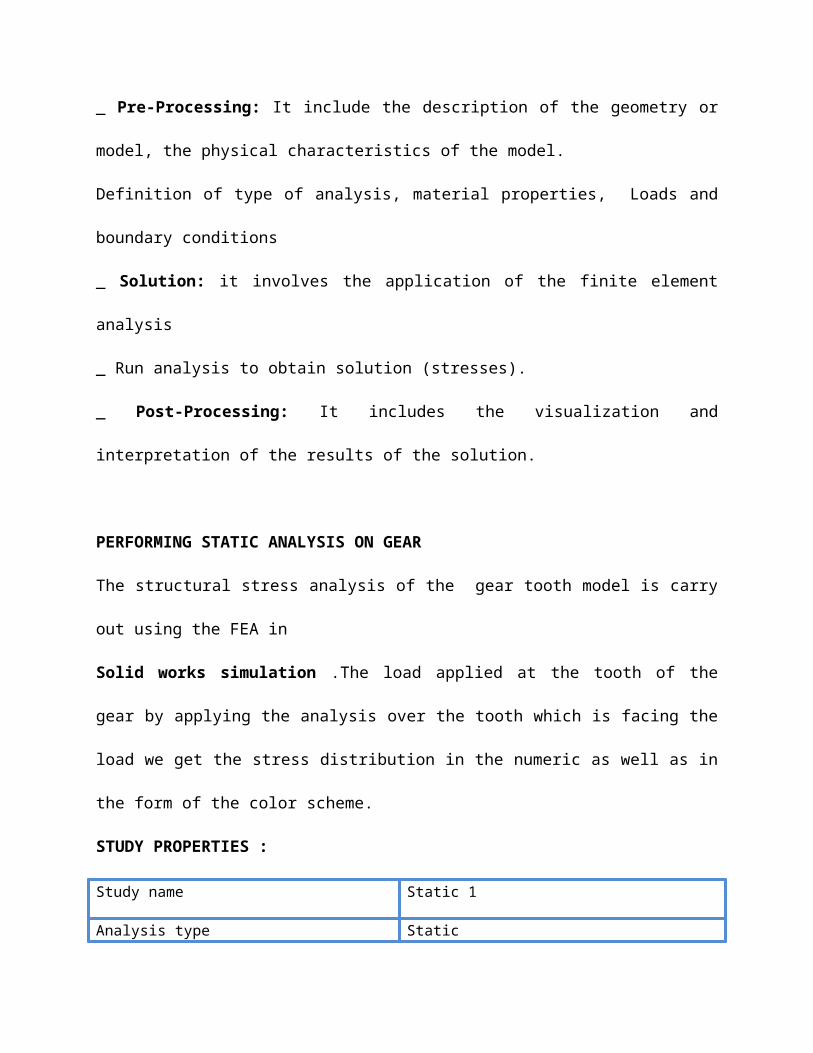
Once a layer is completed the piston (C) moves down by the thickness of a layer. As in selective
laser sintering, the powder supply system (E) is similar in function to the build cylinder In this
case the piston moves upward incrementally to supply powder for the process and the roller (D)
spreads and compresses the powder on the top of the build cylinder. The process is repeated until
the entire object is completed within the powder bed.
Fig: 4.2.4 Three Dimensional Printing
After completion the object is elevated and the extra powder brushed away leaving a "green"
object. Parts must usually be infiltrated with a hardener before they can be handled without much
risk of damage.
SELECTIVE LASER SINTERING
The process is somewhat similar to stereo-lithography in principle as can be seen from
Figure. In this case, however, a laser beam is traced over the surface of a tightly compacted
powder made of thermoplastic material (A). The powder is spread by a roller (B) over the
surface of a build cylinder (C). A piston (D) moves down one object layer thickness to
accommodate the layer of powder

The power supply system (E) is similar in function to the build cylinder. It also comprises a
cylinder and piston. The piston moves upward incrementally to supply powder for the process.
Heat from the laser melts the powder where it strikes under guidance of the scanner system (F).
The CO2 laser used provides a concentrated infrared heating beam. The entire fabrication
chamber is sealed and maintained at a temperature just below the melting point of the plastic
powder. Thus, heat from the laser need only elevate the temperature slightly to cause sintering,
greatly speeding the process. A nitrogen atmosphere is also maintained in the fabrication
chamber which prevents the possibility of explosion in the handling of large quantities of powder
After the object is fully formed, the piston is raised to elevate the object. Excess powder is
simply brushed away and final manual finishing may be carried out. It may take a considerable
time before the part cools down enough to be removed from the machine. Large parts with thin
sections may require as much as two days of cooling time
Fig: 4.2.5 Selective Laser Sintering

No supports are required with this method since overhangs and undercuts are supported by the
solid powder bed. This saves some finishing time compared to stereo-lithography. However,
surface finishes are not as good and this may increase the time. No final curing is required as in
stereo-lithography, but since the objects are sintered they are porous. Depending on the
application, it may be necessary to infiltrate the object with another material to improve
mechanical characteristics. Much progress has been made over the years in improving surface
finish and porosity. The method has also been extended to provide direct fabrication of metal and
ceramic objects and tools.
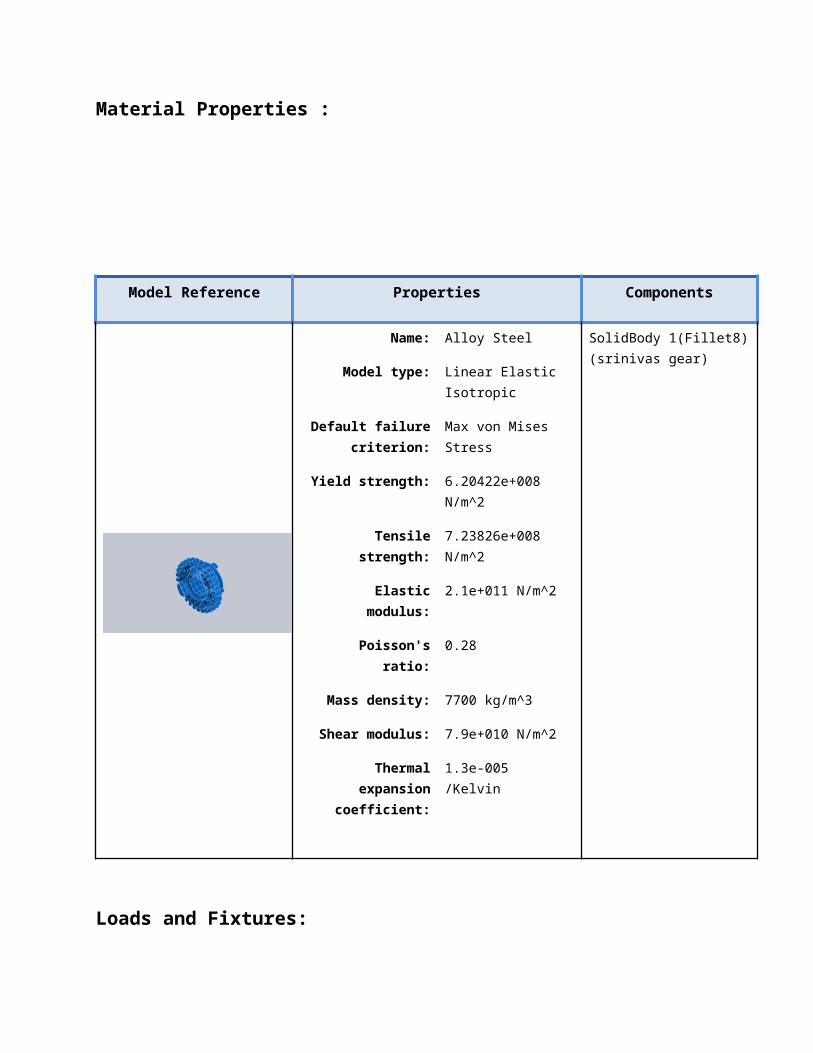
Fig: Selective Laser Sintering Machine (RPT Systems).
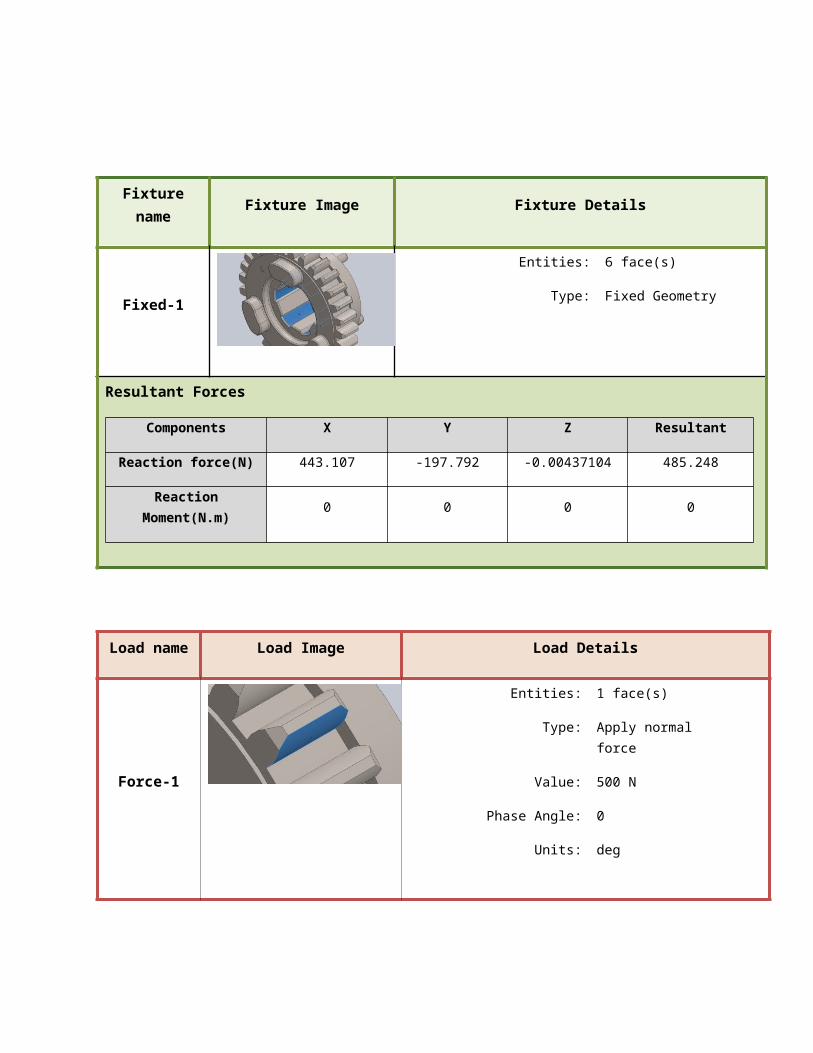
PROTOTYPING OF THE GEAR USING SELECTIVE LASER SINTERING –
RAPIDPROTOYPING SYSTEM:
FORMIGA P 100 - small, fast, efficient, e-Manufacturing in the Compact Class Plastic
laser-sintering system for the direct manufacture of series, spare parts and functional prototypes.
Fig: 4.4.3 RP Systems
The FORMIGA P 100 represents laser-sintering in the compact class. With a build envelope of
200 mm x 250 mm x 330 mm, the FORMIGA P 100 produces plastic products from polyamide
or polystyrene within a few hours and directly from CAD data. The machine is ideally suited for
the economic production of small series and individualized products with complex geometry –
requirements which apply among others to the medical device industry as well as for high-value
consumer goods. At the same time, it provides capacity for the quick and flexible production of
fully functional prototypes and patterns for plaster, investment and vacuum casting. With
turnover times of less than 24 hours the FORMIGA P 100 integrates itself perfectly in a
production environment that requires the highest level of flexibility. The system distinguishes
itself also by comparatively low investment costs.
Technical Specifications :
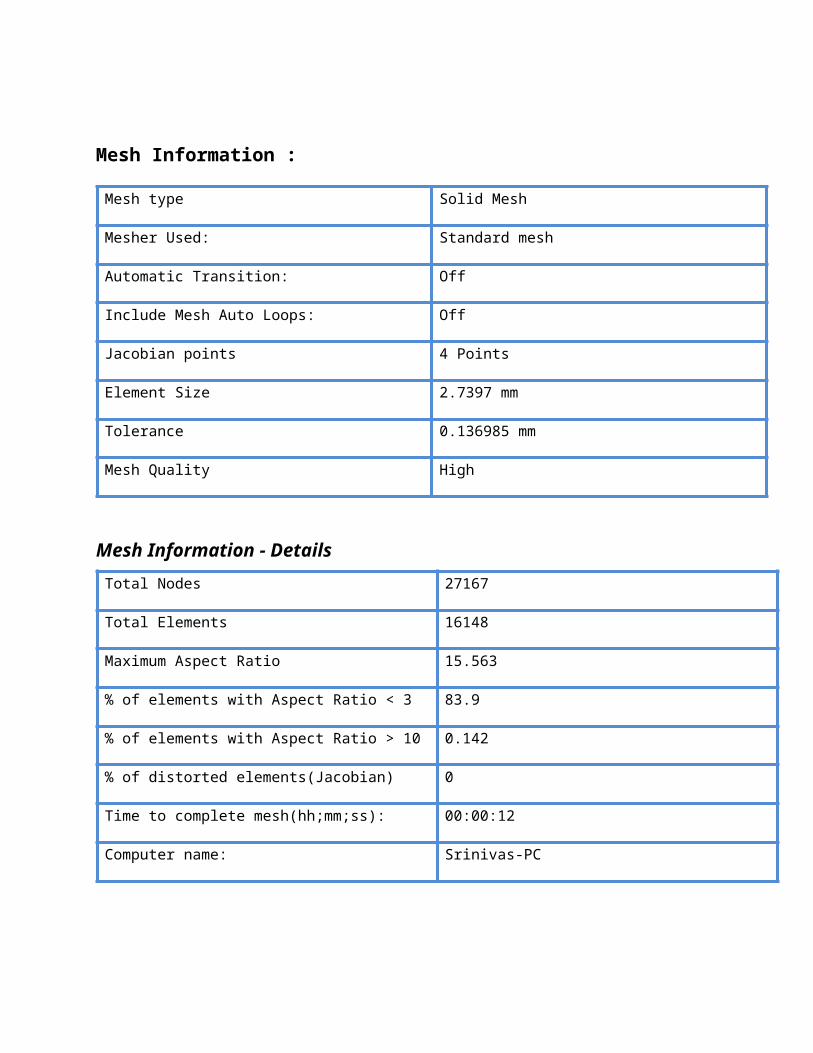
Technical Data :
TABLE NO – 1 :
Effective building volume 200 mm x 250 mm x 330 mm (7.9 x 9.8 x 13 in)
Building speed (material-dependent) up to 24 mm height/h (0.94 in/h)
Layer thickness (material-dependent) typically 0.1 mm (0.004 in)
Support structure not necessary
Laser type CO2, 30W
Precision optics F-theta lens
Scan speed during build process up to 5 m/s (16.4 ft/sec)
Power supply 16 A
Power consumption (nominal) 2 Kw
Nitrogen generator integrated (optional)
Compressed air supply minimum 6,000 hPa; 10 m3/h (87 psi; 13.08 yd3/h)
Dimensions :
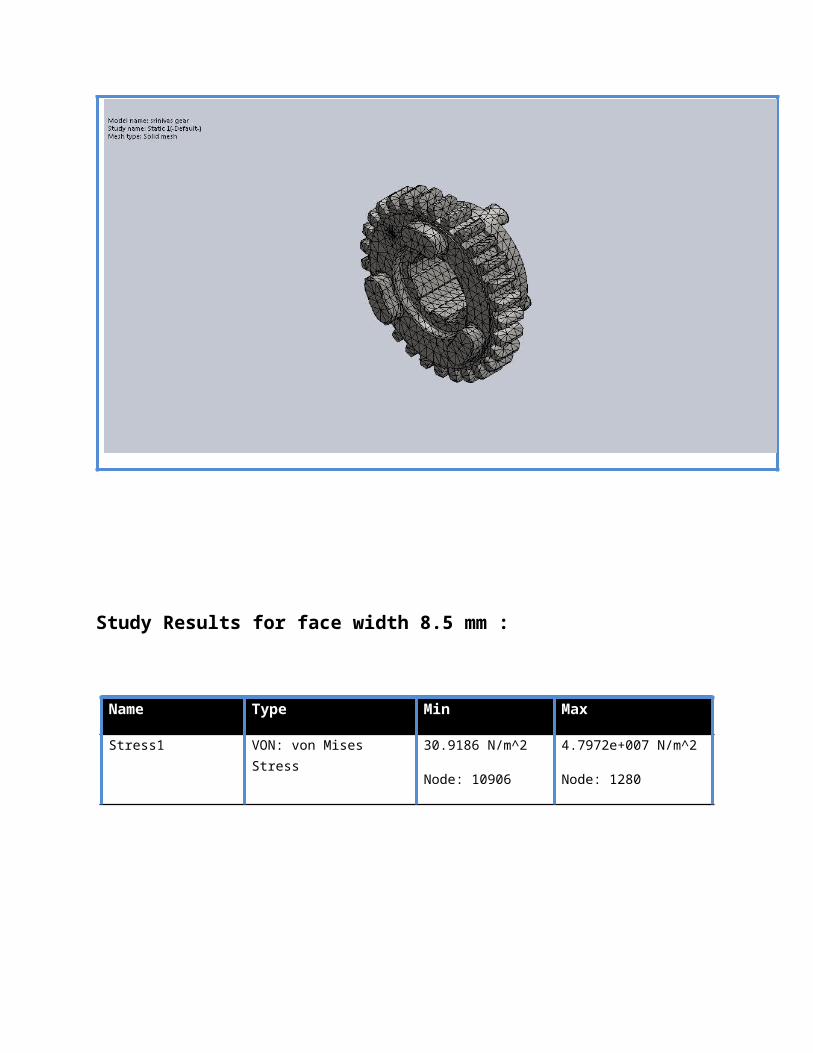
TABLE NO – 2 :
Machine with powder
containers and touch screen
1,320 mm x 1,067 mm x 2,204 mm
(51.97 x 42.01 x 86.77 in)
Recommended installation
space3.2 m x 3.5 m x 3 m (126 x 137.8 x 118.1 in)
Weight Ca. 600 kg (1,323 lb)
Powder mixing station 700 mm x 500 mm x 1,000 mm (27.56 x 19.69 x 39.37 in)
Unpacking and sieving station 1,200 mm x 700 mm x 1,500 mm (47.24 x 27.56 x 59.06
in)
Data preparation :
TABLE NO – 3 :
PC current Windows operating system
Software EOS RP Tools; Magics RP (Materialise)
CAD interface STL. Optional: converter to all common formats
Network Ethernet
Certification CE
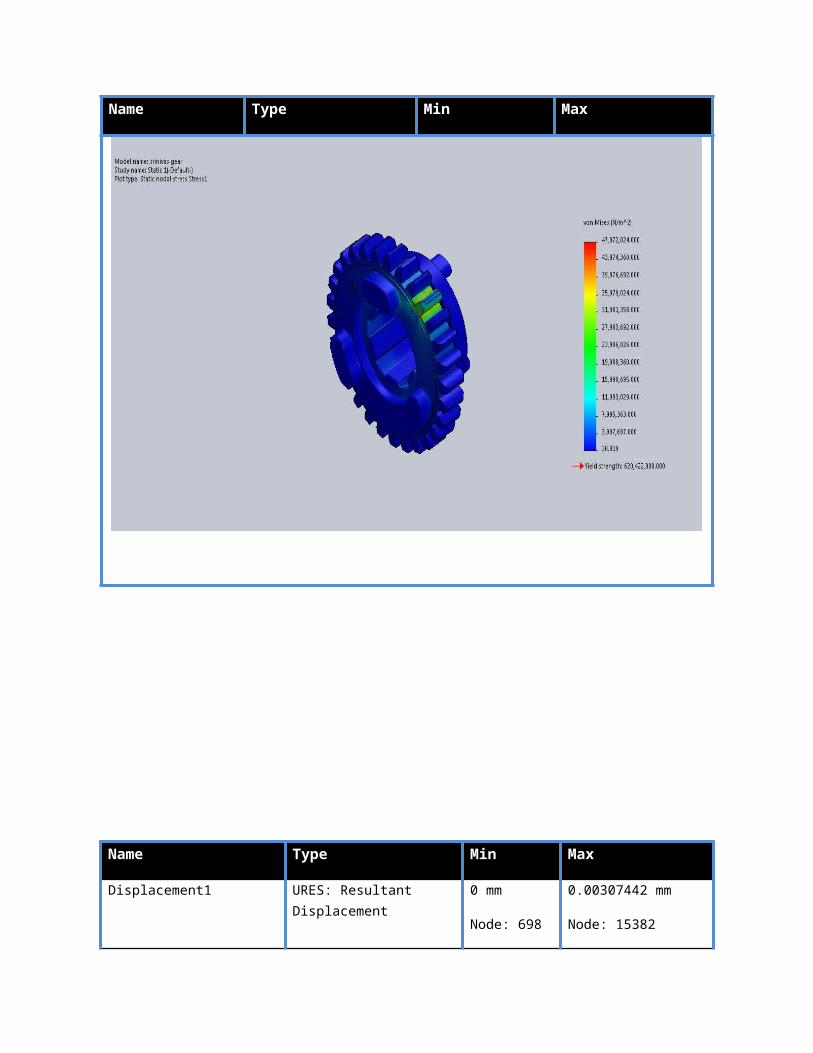
RAPID PROTOTYPING OF GEAR:
After the .STL file of gear is imported into the fused deposited machine. The 3D printing has
been done for 3hrs.The following prototype has been obtained .The material used is ABS
material.
Figure :Front view of the Gear [RPT file]
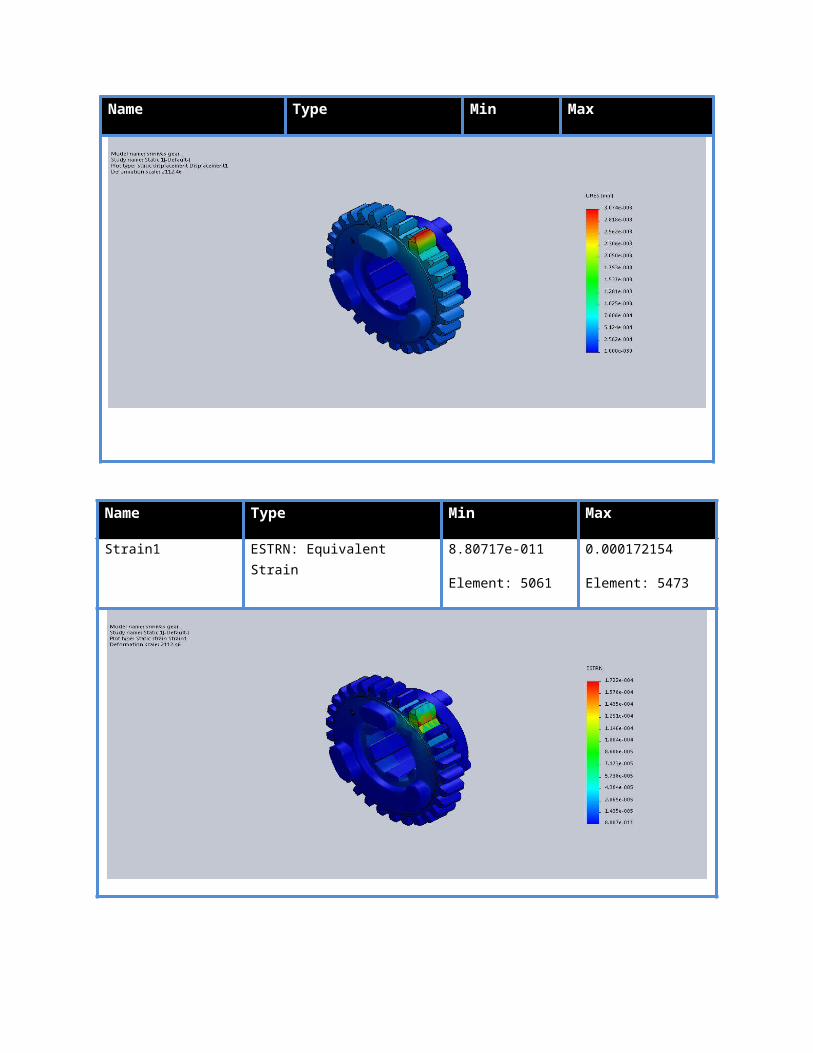
Figure :Side view of Gear [RPT]
Figure : Back view of Gear[RPT]
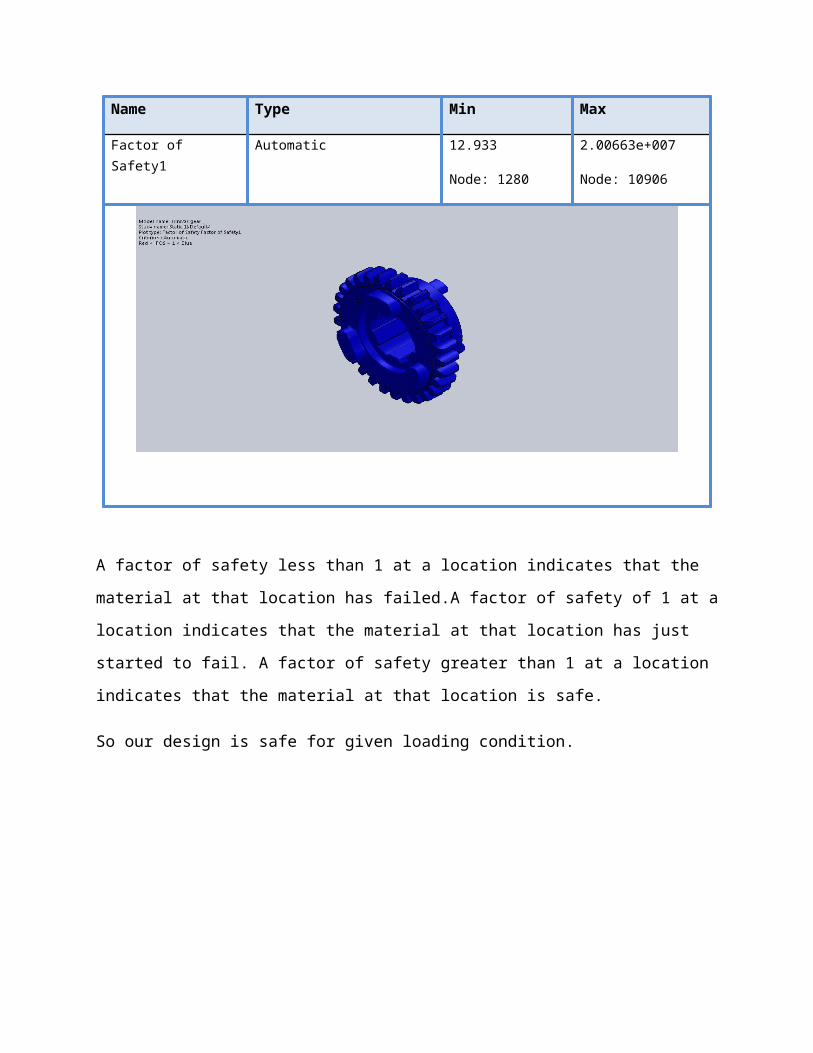
Figure: RPT gear and normal gear front views
Figure: Back view of RPT gear
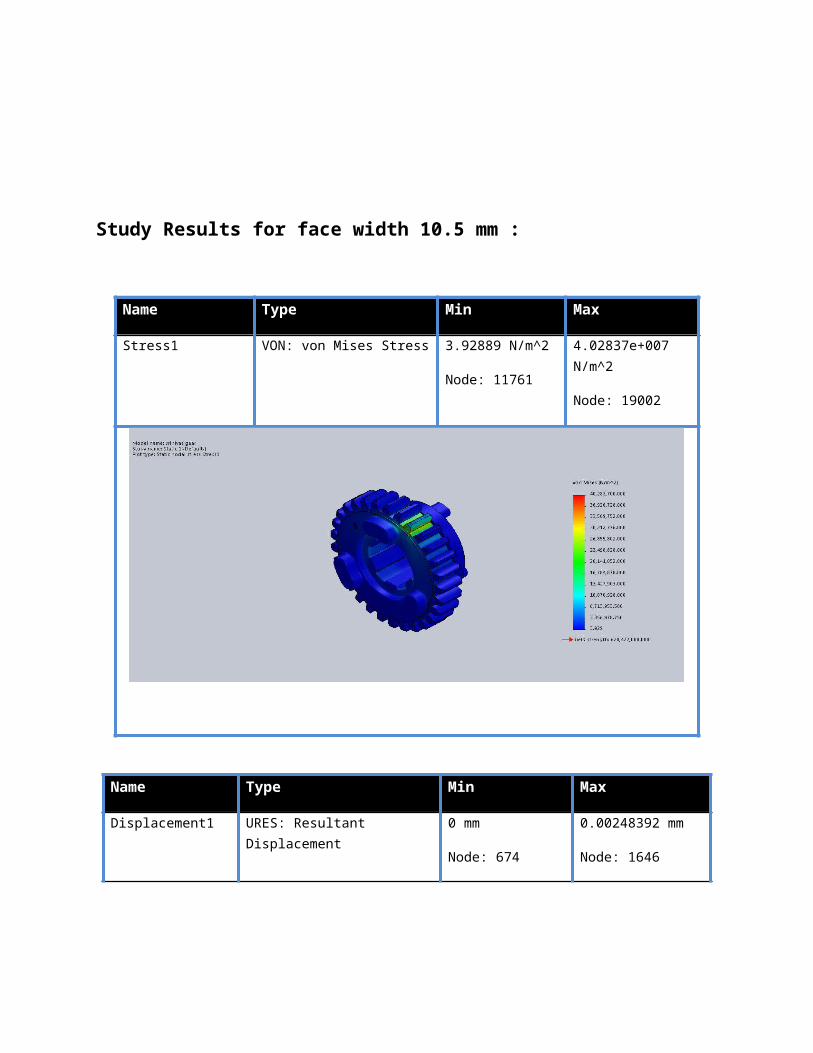
Figure: isometric view of Gear [RPT] and Normal gear
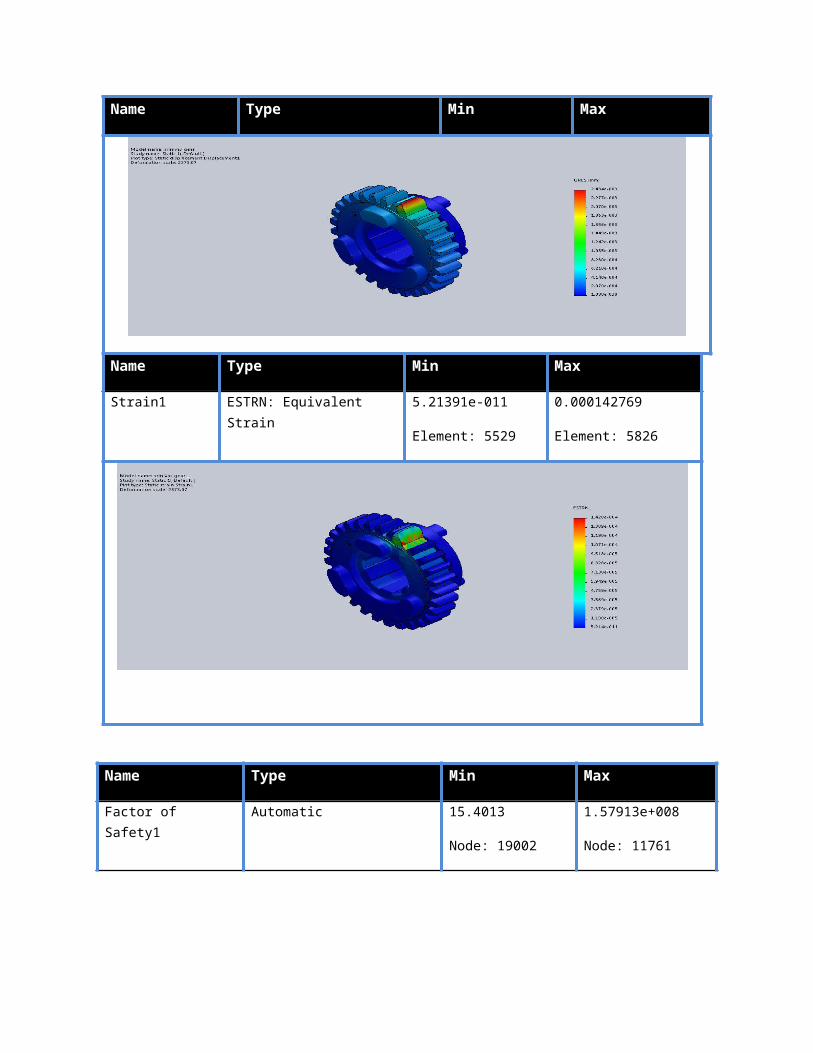
CONCLUSIONS
Reverse engineering helps in obtaining the geometry of part or product which is not available
otherwise. Its application makes it possible to reconstruct the original component with its
drawing and manufacturing process. It is used in various fields but here the main application is
related to broken Gear.
The process starts with understanding the reverse engineering procedure. The part
geometry is first obtained with the help of scanning technology. Then with the use of
SOLIDWORKS SCAN TO 3D option the three-dimensional model of the spur gear is
obtained.
In theory of Gear, we are considering that the load is acting at one point and the stress is
calculated. The calculation of maximum stresses in a gear at tooth root is three
dimensional problems. The accurate evaluation of stress state is complex task. The
contribution of this thesis work can be summarized as follows:
The strength of gear tooth is a crucial parameter to prevent failure. In this work, it is
shown that the effective method to estimate the root bending stress using three
dimensional model of a gear and to verify the accuracy of this method the results with
different face width of teeth are compared with theoretical values.
The face width is an important geometrical parameter in design of gear as it is expected
in this work the maximum bending stress decreases with increasing face width.
After the analysis, the pattern of the part is obtained using Rapid prototyping machine
{Fused depositing machine}.
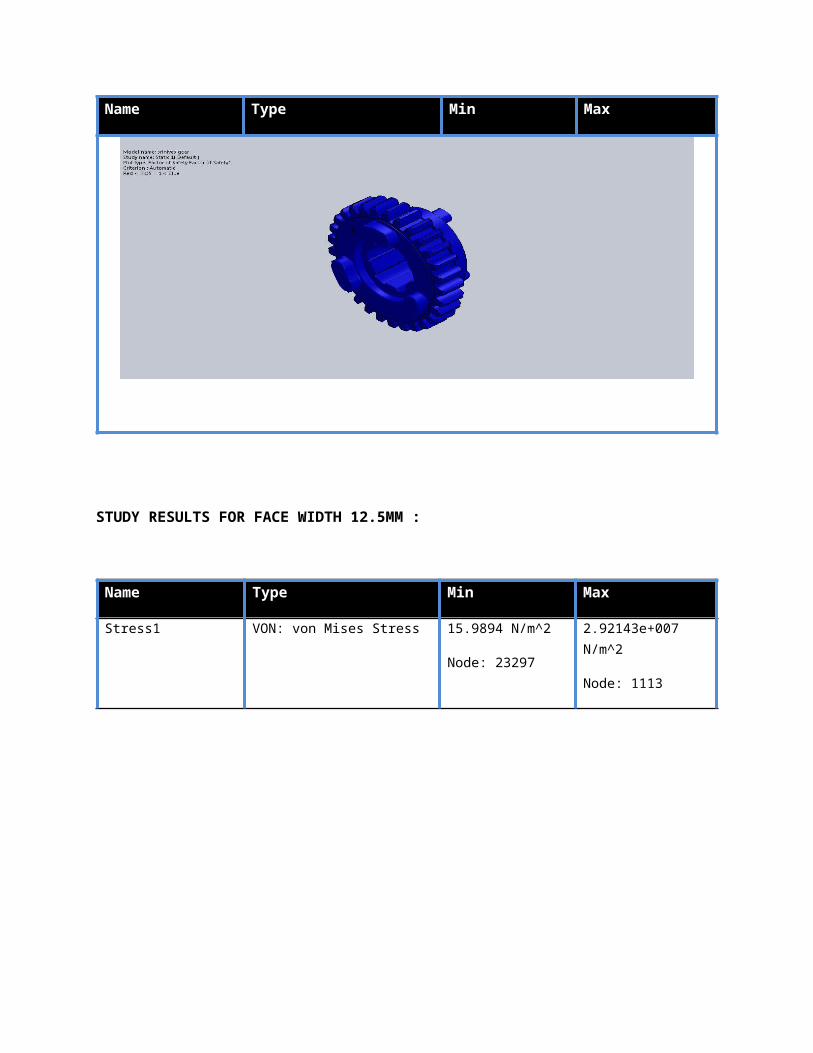
REFERENCES
[1]. Cheng, Y., and Tasy C.B., Stress Analysis Of Helical Gear Set With Localized Bearing
Contact, Finite Element In Analysis And Design, 38,Pp. 707-723, 2002
[2]. Vijayarangan, s., and Ganesan, n., a static analysis of composite helical gears using three
dimensional finite element method, computers & structures, 49,pp.253-268,1993.
[3]. Huston, R.L., Mavriplis, D., Oswald, B.F., and Liu Y.S., A Basis for Solid Modeling of Gear
Teeth with Application In Design And Manufacturing, NASA Technical Memorandum
105392, 1992.
[4]. Zhang, J.J., East, I.I., Shi, And Y.H., Load Analysis with Varying Mesh Stiffness, Computer
And Structures, 70, pp.273-280, 1999
[5]. Zhang, Y., And Fang. Z, Analysis Of Teeth Contact and Load Distribution of Helical Gears
With Crossed Axes, Mechanism And Machine Theory, 34,Pp.41-57, 1999.
[6]. Litvin, L.F., Fuentes, A., Perez, I.G., and Sep, T.M., New Version Of Nivikon-Wildhaber
Helical Gears: "Computerized Design, Simulation of Meshing and Stress Analysis",
Computational Methods In Applied Mechanics And Engineering, 191, Pp.5707-5740, 2002.
[7]. Hedlund, J., And Lethovaara, A., Modeling Of Helical Gear Contact With Tooth
Defection,Tampere University Of Technology, Machine Design, P.O. Box 589,33101 Tampere,
Finland.
[8]. Vera, N.S., And Ivan, C., The Analysis Of Contact Stress on Meshed Teeth_S Flanks Along
The Path Of Contact For A Tooth Pair, Mechanics Automatic Control and Robotics, 3,
Pp, 1055-1066, 2003.
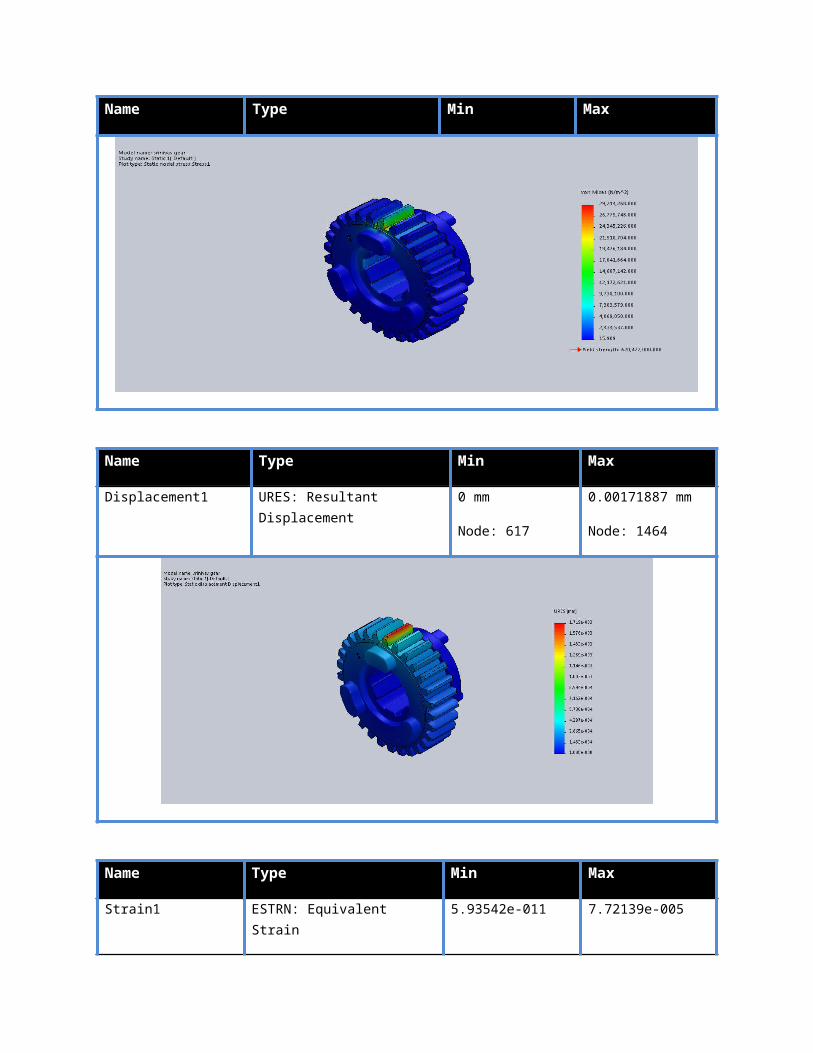
[9]. Pushpendra Kumar Mishra, Dr. M. S. Murthy", Comparison of Bending Stresses for
Different Face Width of Helical Gear Obtained pp45-51, 2013.
[10]. Ajeet Kumar Rai and Mustafa S Mahdi, “A Practical Approach to Design and Optimization
of Single Phase Liquid to Liquid Shell and Tube Heat Exchanger”, International Journal of
Mechanical Engineering & Technology (IJMET), Volume 3, Issue 3, 2012, pp. 378 - 386, ISSN
Print: 0976 – 6340, ISSN Online: 0976 – 6359.
[11]. Ajeet Kumar Rai and Ashish Kumar, “A Review on Phase Change Materials & Their
Applications”, International Journal of Advanced Research in Engineering & Technology
(IJARET), Volume 3, Issue 2, 2012, pp. 214 - 225, ISSN Print: 0976-6480, ISSN Online: 0976-
6499.