general knowledge about climate change, factors influencing risk perception and willingness
TRANSCRIPT

Dis cus si on Paper No. 11-060
General Knowledge About Climate Change, Factors Influencing Risk
Perception and Willingness to Insure
Claas Menny, Daniel Osberghaus, Max Pohl, and Ute Werner

Dis cus si on Paper No. 11-060
General Knowledge About Climate Change, Factors Influencing Risk
Perception and Willingness to Insure
Claas Menny, Daniel Osberghaus, Max Pohl, and Ute Werner
Die Dis cus si on Pape rs die nen einer mög lichst schnel len Ver brei tung von neue ren For schungs arbei ten des ZEW. Die Bei trä ge lie gen in allei ni ger Ver ant wor tung
der Auto ren und stel len nicht not wen di ger wei se die Mei nung des ZEW dar.
Dis cus si on Papers are inten ded to make results of ZEW research prompt ly avai la ble to other eco no mists in order to encou ra ge dis cus si on and sug gesti ons for revi si ons. The aut hors are sole ly
respon si ble for the con tents which do not neces sa ri ly repre sent the opi ni on of the ZEW.
Download this ZEW Discussion Paper from our ftp server:
http://ftp.zew.de/pub/zew-docs/dp/dp11060.pdf

Non-Technical Summary
It is a common belief that more information about climate change will lead to a better under-
standing of the phenomenon and to an increase of prevention measures, such as insurance for
natural hazards.
To test this hypothesis, two independent surveys in Germany were conducted. The survey by
the research team of KIT was based on an internet questionnaire and a sample of 510 re-
spondents from all regions and socio-economic groups in Germany. The other survey (by re-
searchers of ZEW) was conducted with 157 respondents which were personally present at the
premises of the research institute in Mannheim.
The main objective of the analyses was to check the correlations and interactions between
knowledge about climate change, scientific information about the phenomenon and the risk
perception of climate-induced hazards. Furthermore the links between risk perception and
prevention measures were analysed.
We found that respondents who revealed a better actual knowledge in questions about climate
change perceived climate change impacts as less hazardous than those with weaker
knowledge. The impact of actual knowledge is opposed to the effect of the self-declared
knowledge of the respondents. Respondents who declared their own level of information
about climate change as being rather high showed a higher degree of risk perception of cli-
mate change than those who ascribed themselves a lower level of information.
Overall, in both surveys independently from each other we identified certain factors determin-
ing risk perception. These are: gender (female respondents exhibited higher risk perception),
experience of damages through extreme weather events (experience implies higher risk per-
ception), and actual knowledge about climate change (better knowledge implies lower risk
perception). Surprisingly, the provision of scientific information about expected climate
change impacts showed no significant effect on the risk perception.
Furthermore we found a positive effect of risk perception of climate change on the willing-
ness to insure and a significant influence of experience with damages through extreme weath-
er events on insurance coverage.
Since information about the consequences of climate change does not lead to increased risk
perception, we doubt the efficiency of large-scale public information campaigns. Given the
broad coverage of the topic in mass media with partly quite drastic pictures and messages,
scientifically grounded information may not enhance the awareness that climate change can
impact everybody and that it is time to take action on a personal level.

Das Wichtigste in Kürze
Es ist eine weit verbreitete Ansicht, dass mehr Informationen über den Klimawandel zu einem
besseren Verständnis des Phänomens und zu einem Anstieg von Präventionsmaßnahmen, wie dem
Abschluss von Versicherungen gegen Naturgefahren, führen.
Um diese Thematik zu untersuchen wurden zwei unabhängige Erhebungen durchgeführt. Die
Umfrage der Forschungsgruppe des KIT basierte auf einem Online- Fragebogen mit 510 Teil-
nehmern aller sozio-ökonomischer Gruppierungen und aus allen Regionen Deutschlands. Die
andere Umfrage (von Wissenschaftlern des ZEW) wurde mit 157 Teilnehmern durchgeführt, die
in den Räumlichkeiten des Forschungsinstituts in Mannheim persönlich anwesend waren.
Das Ziel der Analysen war es, die Zusammenhänge und Wechselwirkungen zwischen dem Wis-
sen über den Klimawandel, wissenschaftlicher Information über das Phänomen, sowie der Risi-
kowahrnehmung bezüglich klimabedingter Gefahren zu überprüfen. Außerdem wurden die Bezie-
hungen von Risikowahrnehmung und Präventionsmaßnahmen untersucht.
Teilnehmer, die ein besseres Wissen in Fragen des Klimawandels offenbaren, schätzen die Effekte
des Klimawandels als weniger gefährlich ein als solche mit niedrigerem Wissensstand. Der Ein-
fluss von tatsächlichem Wissen verhält sich gegenteilig zu dem des selbst deklarierten Wissens.
Die Teilnehmer, die ihr eigenes Informationsniveau über den Klimawandel relativ hoch einschät-
zen, zeigen ein höheres Maß an Risikowahrnehmung des Klimawandels als diejenigen, die sich
selbst einen niedrigeren Informationsstand zuschreiben.
Insgesamt wurden in beiden Befragungen unabhängig voneinander bestimmte Faktoren identifi-
ziert, die die Risikowahrnehmung beeinflussen. Diese sind: das Geschlecht (weibliche Befragte
zeigen eine höhere Risikowahrnehmung), Erfahrungen mit extremen Wetterereignissen (Scha-
denerfahrung bedeutet eine höhere Risikowahrnehmung), und das tatsächliche Wissen über den
Klimawandel (besseres Wissen impliziert eine niedrigere Risikowahrnehmung). Überraschender-
weise zeigt die Bereitstellung von wissenschaftlichen Informationen über die erwarteten Klimaef-
fekte keinen signifikanten Effekt auf die Risikowahrnehmung.
Außerdem wurden ein positiver Effekt der Risikowahrnehmung des Klimawandels auf die Bereit-
schaft sich zu versichern und ein signifikanter Einfluss der Erfahrung mit Schäden durch extreme
Wetterereignisse auf den Versicherungsschutz gefunden.
Da Informationen über die Folgen des Klimawandels nicht zu einer steigenden Risikowahrneh-
mung führen, sind Zweifel über die Effizienz groß angelegter öffentlicher Informationskampag-
nen angebracht. Angesichts der breiten Berichterstattung über das Thema in den Massenmedien,
mit teilweise recht drastischen Bildern und Nachrichten, können wissenschaftlich fundierte In-
formationen das Bewusstsein, dass der Klimawandel persönlich spürbare Auswirkungen haben
wird und dass es Zeit zum Handeln ist, vermutlich nicht steigern.

General knowledge about climate change, factors influencing risk
perception and willingness to insure
Claas Menny,1* Daniel Osberghaus,
§ Max Pohl
§ and Ute Werner*
* Karlsruhe Institute of Technology (KIT), Chair of Insurance Economics, Kronenstraße 34, 76133 Karlsruhe,
Germany
§ Department of Environmental and Resource Economics, Environmental Management, Centre for European
Economic Research, L 7, 1 68161 Mannheim, Germany
September 2011
Abstract
In two empirical surveys in Germany the link between the information respondents have
about climate change and their risk perception of the phenomenon was analysed. We found
that a better understanding of the effects of climate change might lead to a decrease of the
perceived hazard. In contrast, a high self-declared knowledge about climate change might
correspond with higher risk perception. Further factors affecting the risk perception of climate
change are gender, experience of extreme weather events and trust in external aid. Surprising-
ly, information campaigns based on scientific facts are not effective for increasing risk per-
ception and willingness to insure. Higher risk perception might induce higher interest in pre-
cautionary measures like insurance.
Keywords: Climate Change, Knowledge Illusion, Insurance, Risk Perception, Information,
Psychometric paradigm
JEL-Classification: Q54, Q58, D83
1 Corresponding author. Email address: [email protected]

2
Introduction
Climate change is the triggering mechanism for a variety of changes, but it cannot be experi-
enced in itself. The consequences triggered by climate change happen very slowly and can
only be determined through statistical analysis of temperature and precipitation data, and
by continuous monitoring of their variations and the effects induced on the natural envi-
ronment such as extreme weather events. These observations and analyses have to take a
long view, therefore generating long-term predictions. Consequently, the derived, effects of
climate change lie further in the future than the planning horizon of most individuals reach-
es.2
All these factors create an image of climate change as a phenomenon in which most people
can believe or not since they mainly must rely on scientific models, expert judgments, and
media reports.3 Personal experiences with potential effects of climate change, e.g. longer
drought periods for farmers or more frequent flooding of homes, are rare.4 Therefore it can
be assumed that the majority of people rate the risk of climate change on an abstract, cogni-
tive level which might lead to an underestimation of the hazards of climate change.5 Then
again, the term ‘risk’ is generally understood as describing the possible downside of activi-
ties or events resulting in damages, and not so much potential positive effects. This is also
the focus of our article. However, when judging risks, people might mentally counterbalance
expected positive and negative effects of risks. These mental processes and the underlying
differing interpretations of risk or are not covered in this article.
We concentrate on analysing the existing knowledge about climate change in two samples of
the German population, the role of knowledge and scientific information for risk perception,
and the resulting willingness to insure against extreme weather events. Furthermore, we
analyse the influence of other factors on the perception of climate change, like socio-
demographic characteristics, or the respondent’s own judgement regarding their knowledge,
as well as the effect of trust in external aid, science and technology, and personal experienc-
es with extreme weather events.
It turns out that the actual knowledge about climate change corresponds to the knowledge
level declared by the respondents. However, the correlation between the two is rather
weak. Many people tend to overestimate the expected climate impacts in terms of key pa-
rameters, such as temperature increase or sea level rise. Regarding the personal risk percep-
tion, especially those individuals reveal a high perceived risk who (a) ascribe high damage
potential to climate change, (b) expect little aid from external sources, and (c) see climate
change as something new and unexplored. The factors a to c in turn are related to gender,
2 von Alten (2008)
3 Swim et al. (2009)
4 Sloman (1996), Chaiken and Trope (1999), Swim et al. (2009)
5 Weber (2006)

3
age, and experience with extreme weather events, and self-perceived and actual knowledge
about climate change. Another interesting finding is that scientific information on expected
climate impacts does not increase the risk perceived, possibly due to a “relaxation effect” in
the group as expectations based on prior knowledge are more severe. Regarding the relation
of risk perception and willingness to insure, the findings are more ambiguous. There seems
to be a positive correlation between the extent of risk perceived and existing or intended
insurance for extreme weather events but the effect in our samples is relatively weak.
1. Methodology of the surveys
The relations of/between actual and declared knowledge about climate change, perceived
risk, and willingness to purchase natural hazard insurance have been analyzed by two sur-
veys, which were developed and conducted independently by two different research teams.
Even though the foci of the research groups were slightly different, it turns out that the sur-
veys developed are complementary and compatible in the sense that both of them cover the
abovementioned aspects and – if presented in connection – allow deeper insights into the
complex of perceived risk and related topics.
The first study is called “study A” in this paper. It was based on an online-survey, which was
conducted in Germany among 510 participants. The participants were selected according to
layered quotas based on the distribution of gender, age and education level in the German
population. Regarding these characteristics, the sample was representative although we
made sure to include a certain minimum number of participants from 2 federal states with
political conditions that might be important for the willingness to insure. Nevertheless, peo-
ple from all federal states took part in this survey in March 2010.
The main part of the survey consisted of questions regarding the perception of the climate
change risk, following the psychometric paradigm6: Traditional attributes used for the rating
of activities, technologies or events regarding their risk were supplemented by research-
specific characteristics. Furthermore, the respondents were questioned about their own
experiences with extreme weather events, and their general knowledge about climate
change issues was assessed (c.f. Appendix A1). We also asked for the sources of information
used to learn about climate change, and for precautionary measures that could be taken on
a personal basis. Finally, several insurance products with varying design options for weather-
related risks were presented. Here, the respondents could indicate their willingness to buy
as well as payment and prize preferences.
The second study, hereinafter called “study B”, is based upon a smaller sample than study A,
with 157 participants. It was conducted in February 2010. The main difference to study A is
that the participants of study B were divided into two treatment groups. While one group of
6 Fischhoff et al. (1978), Slovic et al. (1986)

4
104 participants received an informative text about the scientific background of climate
change and expected climate impacts, the control group of 53 individuals received no addi-
tional information.7 The selection of treatment groups was random. The provided informa-
tive input had been gathered from mainstream literature sources such as IPCC (2007) (as
source for the scientific background and more global impacts) and national studies8, as
sources for more local impacts. It was presented in the form of a two-page text in simple,
easily understandable language which is attached in the Appendix B1. In order to assure that
the text was really read, all participants had to be personally present in a facility of the re-
search institute. The questionnaire about risk and insurance was distributed not before all
participants have had enough time to thoroughly study the texts provided.
All participants came from the city of Mannheim in South West Germany, in the Upper Rhine
Valley. The city has not been affected by major storm or flood events in recent years, but its
geographical position and its building density makes it vulnerable to urban heat waves. Alt-
hough all employment statuses and many professions were represented, the socio-economic
structure of our sample is not assured to represent total Germany. However, these circum-
stances are not expected to systematically bias the results of the research questions in this
paper. In particular, most statistical analyses are actually intra-sample comparisons. E.g., the
absolute value of personal risk perception does not play a role, but rather its intra-sample
variation and the dependence of the variation on other variables. We do not expect that
these interdependencies vary considerably between different regions within Germany. Be-
sides, all presented results of study B which have a counterpart in the representative study A
show a convincing consistence with results from study A.
The questionnaire itself was divided into two parts. First, general socio-economic variables
were asked, followed by a short series of knowledge questions about personal estimates of
key climate change parameters. After this first part, a share of the sample was provided with
the abovementioned informative text about climate change. The second part of the ques-
tionnaire elicited the personal perceived risk by a series of 17 statements about the rele-
vance and hazard of climate change and the respective levels of agreement of respondents
with these statements (c.f. Appendix B2). Preferences regarding insurance coverage were
also asked in this second part of the questionnaire.
2. Declared and actual knowledge about climate change
Respondents of the internet-based online-study A were asked “How well are you informed
about the topic of climate change?” The answer was given on a scale ranging from “I am not
7 The treatment group which received information was furthermore split into a group which received infor-
mation about expected local climate impacts in South West Germany, and another group which received only
information about global climate impacts. The different effects are dealt with in Osberghaus et al. (2010), but
do not play a role in respect to the research questions posed in this paper. For the present analysis, both
aforementioned groups are treated as one. 8 UBA (2005) and Bundesregierung (2008)

5
at all informed” to “I am excellently informed”. The result of this question is listed in Figure
1, left panel. The majority of the respondents (67%) declared being rather well informed
(values 6 or higher). Only 22% indicated a level of information below 5.
But how much do the respondents really know about climate change? To find out, 8 multiple
choice questions were provided. These questions and appropriate answers to them were
checked beforehand by experts in the topic of climate change. Likewise, the comprehensibi-
ty of the questionnaire had been pretested several times with students and other persons.
To prevent cheating, e.g. with online-searches for the correct answers, a time limit of 45
seconds per answer was set. Knowledge about climate change was measured by a score that
increased with correct answers and was reduced by wrong answers. The option “I don’t
know” had no effect on the score. The possible range of the overall score runs from -8 to +8.
Both extremes were never reached, as can be seen in Figure 1, right panel. All questions and
the multiple choice options are listed in Fehler! Verweisquelle konnte nicht gefunden werden. in
the appendix A1. The relative frequency of the options chosen is listed in parentheses; cor-
rect answers are printed in bold. The majority of respondents obtained close to zero points
over all.
Figure 1: Study A - declared (left panel) versus actual knowledge (right panel) about cli-mate change
The correlation between the individually declared level of information and the score ob-
tained in the knowledge questionnaire is very weak, but significant and positive. Those who
ascribed a better knowledge to themselves, actually knew slightly more facts about climate

6
change (Pearsons-r = 0,11**).9 The weakness of this correlation however fits well with find-
ings regarding a knowledge illusion, which means that people tend to overestimate their
knowledge of topics that are broadly discussed in the media.10 Therefore, the declared
knowledge level of respondents is not necessarily a suitable indicator of their actual
knowledge.
The pattern of relatively little knowledge about climate science is also shown by results of
study B. Here participants were asked in an open-ended question about their estimation of
the expected global temperature increase and the expected sea level rise within one decade.
Although the “correct” answer depends on the exact decade (e.g. the correct values differ
between the 1990s and the 2090s) the question was posed in this general form in order to
keep it short and simple for the participants. All answers which range broadly in the uncer-
tainty ranges of the IPCC (2007) were coded as “correct”. Although these uncertainty ranges
are quite high, the share of correct answers is relatively low, and almost every incorrect an-
swer is indicating values with too high estimations. The survey also shows that people do not
dare a guess (don’t know answers) (see Table 1). This result indicates that most respondents
are very pessimistic or quite unsure about concrete climate impacts.
Underestimation of impacts including statements of “no im-pact” and decrease
Value given by climate science (IPCC 2007a)
Overestimation of impacts
Don’t know-answers
Sea level rise in 10 years
decrease, no change and increase up to 13 mm
increase between 13 mm and 38 mm
increase by more than 38 mm
Share of re-sponses (%)
12.9 18.1 46.4 22.6
Global tem-perature change in 10 years
decrease, no change and increase up to 0.04°C
increase between 0.04°C and 0.16°C
increase by more than 0.16°C
Share of re-sponses (%)
5.8 1.9 82.6 9.7
Table 1: Study B - Respondents’ estimations of key climate impact parameters.
Although these data stem from a regional survey it is quite plausible that great parts of the
German public cannot indicate the correct magnitude of meteorological changes induced by
climate change and – when asked – tend to overestimate them. This phenomenon deserves
definitely a deeper analysis in future, e.g. about the sources of information and the socio-
9
** = significant at the 5%-level 10
Glenberg et al. (1982); Park (2001)
7
economic background of respondent groups. Here we just want to highlight that the majori-
ty of people in Germany tend to overestimate their knowledge about climate change as well
as the magnitude of climate effects in Germany.
3. Risk perception of climate change
In study A, in order to elicit the risk perception of climate change in a way comparable to
other psychometric research, the respondents were asked to evaluate 8 different risks re-
garding their hazard potential for Germany as a whole and for them personally. The risks
selected were: driving by car, smoking, floods, storms, flying by plane, crime, nuclear power
and climate change. Aside from climate change, all risks mentioned had been tested before
in psychometric research carried out in many countries, including Germany. The main drivers
for their evaluation as more or less risky are, therefore, rather well known and include the
kind of risk as technological or natural, familiar or novel, controllable or not, taken voluntari-
ly or imposed, with consequences that are hard or easy to imagine.11 To assess the relative
positioning of climate change risk, all 8 risks selected were presented to the respondents in
random order and simultaneously. Therefore, the respondents rated the hazard of each ac-
tivity or event with regard to all other risks. The perceived extent of hazard could be indicat-
ed by movable sliders provided by the online questionnaire. The position of the sliders was
translated into values from 1 to 10, with 1 meaning “not hazardous at all” and 10 standing
for “very hazardous”.
One result was a ranking of the 8 risks according to the average hazard degree attributed to
them for personal matters. Since the hazard degree estimates for the whole country are
quite similar, it can be assumed that people are not really able to differentiate between the-
se 2 levels of exposure. The assessments of all 510 respondents regarding their personal
hazard are shown in Figure 2. Climate Change ranks at about the same level as storms,
floods, and nuclear power.
11
Slovic (1992), Werner (1994)

8
Figure 2: Study A - Perceived hazard of several risks
In study B, the perceived personal risk of respondents was elicited by a series of 17 state-
ments about the relevance and hazardousness of climate change (c.f. Appendix B2). Based
on the respective levels of agreement with the statements provided, an index for personal
perceived risk (PPR) for each individual was constructed. Since the preset scale values range
between 1 and 5 and are added up for each person, the individual PPR values may range
between a minimum of 17 and a maximum of 85. The distribution of the PPR index is illus-
trated in Figure 3.
0
.01
.02
.03
.04
Den
sity
20 40 60 80PPR sum
Figure 3: Study B - Histogram of PPR index of respondents

9
4. Factors influencing the risk perception of climate change
In a further step we searched for the underlying factors that influence the perception of the
hazard of climate change. Therefore, in study A we presented a series of 13 statements
which were based on the psychometric paradigm12, but also on works about trust13 and per-
ceived adaptive capacity as relevant factors for risk perception, risk attitude and risk behav-
ior.14. The statements are listed in Table 2; they comprised risk attributes like threat, famili-
arity to science and to the exposed, as well as descriptions of potential risk consequences
such as damages and expected benefits due to climate change, just as outlined in early psy-
chometric research. This was completed by statements referring to individual and public
means of adaptation and mitigation. Two statements dealt with trust in external help since
there is evidence to suggest that this might diminish the willingness to prepare on a personal
level. One statement focussed on the ease or difficulty to imagine the consequences of cli-
mate change. In order to assist the respondents in keeping this risk in mind we addressed it
explicitly in each statement. From the beginning of this part of the questionnaire it was
made clear, that all statements referred to the German situation.
The 13 statements were evaluated by the respondents on scales from 1 to 10, according to
their level of agreement. These statements were afterwards condensed by a principal com-
ponent analysis. We found four components influencing the risk perception of climate
change. Those components are shaded in Table 2 and comprise: the perceived degree of
dread of climate change, the degree of trust in external aid – firefighters and other helpers
as well as financial support -, the perceived potential to cope with the effects of climate
change, and the degree to which the risk seems to be familiar. These four components ex-
plain 60.4% of the variance of the underlying variables, which can be taken from the rotated
component matrix given in Table 2.
12
Slovic (1992), Brun (1992), Karger and Wiedemann (1998), Plapp (2004) 13
Slovic (1993); for a thorough literature review see Earle et al. (2007) 14
Grothmann and Patt (2005), Goersch (2010).

10
Rotated Component Matrix
Component
1 dread
2 trust in external aid
3 coping capacity
4 familiarity,
Q7 Are you afraid of the possible consequences of climate change? ,836 ,017 -,029 ,052
Q8 Do you think that damages caused by extreme storms, heat, heavy rain, hail or flooding will increase?
,806 -,052 -,206 ,132
Q9 Do you think it is likely that climate change will cause natural disasters in Germany with many casualties?
,838 -,092 ,012 ,061
Q10 To what extent do you think climate change is explored by science?
,095 -,031 ,358 ,493
Q11 Have you been aware of the predicted consequences of cli-mate change for yourself for a long time or is this completely new to you?
,042 ,005 -,252 ,811
Q12 How well can you picture these consequences of climate change?
,385 ,104 ,023 ,677
Q13 How large is the benefit you expect for yourself due to cli-mate change?
-,116 ,139 ,646 -,260
Q14 How large is the contribution of man to climate change? ,563 -,209 -,032 ,190
Q15 Due to technical progress, it will be possible to limit climate change and to adapt to its consequences
-,170 ,409 ,505 -,043
Q16 In the case of weather-induced disasters, those impacted will be assisted quickly by firefighters, civil defense, police and similar institutions.
-,118 ,870 ,071 ,014
Q17 In the case of weather-induced disasters, those impacted will quickly obtain financial aid (private donations, government assis-tance).
-,085 ,830 ,198 ,054
Q18 Up to what extent do you see options for yourself to guard against the dangers of climate change?
,025 ,125 ,785 ,124
Q19 Up to what extent do you see opportunities to make a contri-bution to the mitigation of climate change?
,489 -,202 ,376 ,213
Extraction method: Principal component analysis Rotation method: Varimax with Kaiser-Normalisation
Explained variance of all variables by components 1,2,3,4: R2 0,604
Table 2: Study A – Statements used to assess the factors influencing risk perception of cli-mate change
53% of the variance of the perceived hazard of climate change can be explained with three
of these components - the degree of dread, the degree of trust in external aid and the de-
gree to which climate change is familiar to the respondents. Statistically, the factor ‘coping

11
capacity’ shows no significant influence, whereas dread has the strongest influence on the
level of perceived hazard. Respondents who fear climate change, who think it will cause dis-
asters with many victims and an increasing amount of damages perceive this phenomenon
as more hazardous than others. Respondents who have high trust that in case of disasters
the firefighters and other services will help them and that they will get financial aid to cope
with the aftermath perceive climate change as less hazardous. Respondents who perceive
the consequences of climate change as an old, familiar problem and who claim to be able to
imagine the effects of it clearly perceive this risk as more hazardous than others. The influ-
ence of the principal components on the perceived level of hazard was tested in a regression
analysis. The results can be taken from Table 3.
N = 510 Double-sided test: *** = significant on the 1%-level
ANOVA Dependent variable: Perceived hazard of climate change
Factor 1 – Degree of dread 1.44***
Factor 2 – Degree of trust in external aid -0.167***
Factor 4 – Degree of familiarity 0.379***
Constant 7.29***
Goodness of fit: R2 0.53
Table 3: Study A – Model of the aggregated principal components influencing the per-ceived hazard of climate change
Two of these three main components influencing the hazard ratings are themselves influ-
enced by other variables. After dividing the sample of Study A into subgroups of respondents
with common characteristics, analyses of variance were performed with the following re-
sults: People with better actual knowledge about climate change, who reached higher scores
in the test questions (Appendix A1: Q21_Q28), had smaller values on the dread factor. That
means: they perceived climate change and its consequences as less dreadful than people
with a weaker actual knowledge about climate change. For people who already experienced
damages from extreme weather events, climate change is more dreadful than for people
without such experiences. Women perceived a significantly higher level of dread than men
(see Table 4).

12
N=510 Regression coefficient
Factor 1 dread of climate change Influenced by:
ANOVA
Actual knowledge (score) -0.043 **
Experience with extreme weather events (yes)
0.20 **
Gender (male) -0.485***
Constant 0.176***
Goodness of fit: R2 0.072
Factor 4 familiarity of cli-mate change Influenced by:
ANOVA Age 0.12***
Declared knowledge 0.198***
Constant -1.734***
Goodness of fit: R2 0.161
*** = significant at the 1%-level, ** = significant at the 5%-level,
Table 4: Study A – Background Factors influencing the principal components dread and familiarity
The component contending the perceived familiarity of the phenomenon is influenced by
the age of the respondents and by the declared knowledge about climate change. Elder re-
spondents had higher values on this factor. For them, climate change was more familiar and
they declared a better imagination of its effects than younger persons. People who claimed
to be well informed about climate change had higher values on this factor as well (see Table
4). All these links and dependencies are visualized in Figure 4.

13
Figure 4: Study A - Reinforcing and weakening factors influencing the hazard ratings
In study B the PPR index is used as a dependent variable in a multivariate regression, in or-
der to shed light on socio-economic variables that may have an effect on the perceived cli-
mate risk. Since the PPR index is bound to values between 17 and 85, the use of ordinary
least squares is not appropriate. Instead, we transform the PPR index to values between 0
(for the theoretical minimum of 17) and 1 (for the theoretical maximum of 85) and use a
fractional logit estimator, as proposed by Papke and Wooldridge (1996). Here the dependent
variable may range continuously between 0 and 1. The results are displayed in Table 5.
Perception
of hazard
Actual knowledge : - better
- weaker
Declared knowledge: - good
- weak
Dread
Age: - older
- younger
Familiarity
Gender: - male
- female
Trust
in external aid
Event experiences: - yes
- no
Background Factors Principal components Hazard Ratings
reinforcing
weakening

14
Fractional Logit N = 142 (standard deviations in parenthesis) Double-sided test: *** = significant on the 1%-level ** = significant on the 5%-level * = significant on the 10%-level
Dependent variable: Summated score of PPR items, standard-ized to a value be-tween 0 and 1
Gender: female 0.2775 **
Age 0.0007
Children 0.0482
Education - 0.1773
Income - 0.0797
Home-owner 0.1967*
Agreement to statement “Climate change is big-gest challenge for mankind”
0.2510**
Interest for climate change - 0.0179
Revealed knowledge on climate change - 0.2191 ***
Feeling influenced by mass media 0.3521 ***
Experience of climate change impacts 0.3049 ***
Constant 0.2658
Goodness of fit: R2 0.3116
Table 5: Study B - Results of multivariate regression of Personal Perceived Risk.
The results reveal that some of the potentially influencing factors do not have an effect on
Personal Perceived Risk in our sample. E.g., age of respondents, whether they have children
or not, their level of education, income, and interest for the topic of climate change do not
show a significant influence on the PPR index. Our data however reveal highly significant
gender effects (positive effect for females), effects of the individual knowledge level (nega-
tive effect of high knowledge level), of experience of climate impacts (positive), and if re-
spondents state that they feel influenced by mass media (positive). The result with regard to
gender has to be interpreted with caution, though. In study A we found that women per-
ceive all risks higher than men by about 1 point. When we ranked the perceived hazard of all
risks for each respondent – from flying with an airplane to crime - climate change was on
average on third place for men and for women alike.
In study B, results of the analysis of Personal Perceived Risk show a significant influence of
climate knowledge. Those respondents who gave correct estimates of key climate impact
parameters tend to exhibit a relatively low personal perceived risk index. The respective
Pearson’s correlation coefficient is -0.3078, at a significance level of 0.001. Also the multivar-
iate regression results, indicated in Table 5 confirm the significant negative effect of
knowledge level on PPR (significant on the 1%-level).

15
5. External information and risk perception
The last few years have seen an increasing coverage of the topic of climate change both in
the mass media as well as in information campaigns from governments or non-governmental
organisations. Most of the information aims to educate people about the increasing physical
impacts which are to be expected in the coming decades and about ways to adapt to or cope
with these impacts. As noted by Etkin and Ho (2007), however, there is still a large discrep-
ancy between the level of information within the scientific community and the general pub-
lic about climate change. Hence, in one way or another, information campaigns seek to in-
crease risk awareness in order to motivate people to act against the causes and conse-
quences of climate change.
In the previous sections, it was demonstrated, however, that our studies have generated
somewhat surprising results with respect to the influence of people’s level of knowledge and
the subsequent level of risk perception. Recalling, study A found that individuals scoring high
in knowledge questions about climate change had a relatively low feeling of dread about
climate change, which correlates with low risk perception scores. Similar results were ob-
tained in study B, where participants scoring high on objective knowledge questions scored
comparably low on the personal risk index.
As has been stated, the topic of climate change has increasingly gained attention in the last
years and numerous information campaigns, aiming to increase people’s knowledge about
the processes and implications of climate change, have been initiated. In the light of findings
such as in study A and study B, the question about the effectiveness of such information
campaigns arises. As the provision of information seems to be one central tool to main-
stream knowledge about climate change and adaptation by the general public, study B was
partly devised in order to test the effect of providing information on people’s personal risk
perception, i.e. the effectiveness of such campaigns in instigating awareness about the po-
tential threats of climate change.
In the study, the experimental group received two pages of specific information on the pro-
cess of climate change, its expected physical impacts as well as an overview of mitigation
and adaptation measures before filling out the questionnaire. The control group received no
information before completing the questionnaire. The personal risk levels (PPR scores) of
each participant were measured after the participants had read this information stimulus.
The (translated) text of the information stimulus may be found in the Appendix B1.
To test whether the provision of information about climate change can significantly influ-
ence the personal risk perception of individuals, first the difference in mean PPR scores be-
tween the control group and the treatment group was analysed using a Wilcoxon ranked
sum test. While it was found that the mean PPR scores of the treatment group were slightly
higher compared to the control group, this difference was not significant at the 10% level.
Hence, from this analysis it has to be concluded that providing information does in fact not

16
significantly influence people’s personal risk perception towards climate change. The results
of this analysis can be found in Table 6.
Variable Information group
N Mean* Wilcoxon rank sum
p-value (rejection of H1)
PPR (as summat-ed score of PPR items)*
Provision of information
104 60.11 8439.5 0.4066
No provision of information
53 58.14 3963.5
Table 6: Study B - Wilcoxon rank sum test for equality of distributions of PPR in different information treatments. H0: Distributions of PPR in both groups are equal – H1: Distribu-tions of PPR in both groups differ from each other.
Further on, a multivariate analysis using PPR as the dependent variable was carried out fol-
lowing the procedure explained before. The results of this regression analysis are in line with
the results from the Wilcoxon ranked sum test and also demonstrate a non-significant effect
of information on individual’s risk perception compared to the control group not receiving
any information. Therefore, the results of study B lead to the conclusion that the provision
of scientific information does not reliably influence the level of risk ratings of individuals with
regard to climate change.
While the current results challenge the assumption that informing people about the poten-
tial threats of climate change will increase their personal risk perception, they also raise the
question as to why such information campaigns might not be effective in causing a higher
level of risk awareness. In order to shed more light on this issue specific research in this area
is required. However, some general remarks shall be presented as to which processes might
underlie these findings.
One reason for the lack of a significant positive effect of information on the perceived level
of risk might be the relatively low severity of the communicated information. As can be seen
from the answers to various knowledge items, the participants of study B tended to overes-
timate the expected impacts of climate change and might hence have been rather “disap-
pointed” by the realistic, rather technical information they received. This hypothesis is given
support by the significant positive effect of “feeling influenced by mass media” on the risk
perception scores of our participants (see Table 5), as the images and information in the
media can usually be regarded as rather “dramatic” with regular coverage of extensive
flooding, dangerous heat waves or life threatening hurricanes. In contrast to the rather
strong, emotional mental images about climate change that seem to have been evoked with-
in the participants by mass media, the neutral information presented in the current study

17
might thus have led people to rate the risks of climate change as rather manageable and
thus score comparably low on the risk perception items.
6. Risk perception and insurance
Even if information campaigns about scientifically proven climate impacts may not yield the
effect of higher levels of personal perceived risk, the question remains whether perceived
risk with regard to climate change is relevant for private insurance demand, e.g. for natural
hazard insurance. This issue may arise because perceived risk may be influenced by other
measures or events, such as more populist media campaigns or – more important – personal
experiences of climate-induced extreme weather events. Both effects are plausible when
looking at the survey data of study B (Table 5).
Looking at the relationship of perceived risk and insurance demand, the data of both surveys
yield an ambiguous message. Both surveys raise the topic of natural hazard insurance, how-
ever in different manners. In study A participants were asked whether they have actually
signed an insurance police (casualty insurance, building insurance, household insurance). In
study B, in contrast, all participants were asked about their agreement to the statement ”I
think it is important to purchase insurance for climate induced damages now”, on a five-
point scale from “total agreement” to “total disagreement”. In other words, study A elicits
the insurance coverage in a revealed preference manner, whereas study B uses stated pref-
erences in order to measure the willingness to insure.
In study A we separated the respondents into two groups. One group was composed of indi-
viduals who had any kind of home and accident insurance and another group had none of
the abovementioned insurance products. Then we conducted a logistic regression with both
groups as dependent variable. It is not surprising that real estate owners had a higher prob-
ability of being insured than respondents who rent their accommodation since this has been
discovered by former national and international studies, too.15 People who already experi-
enced damages through an extreme weather event in the past also seem to have a higher
probability of owning insurance policies than those without such experiences. Households
with a higher number of members have a higher probability of being insured than those with
fewer members. These influencing factors are also known to international disaster and in-
surance research. The measured risk perception of climate change showed, however, no
significant correlation with the status of being insured or not. But we found a weak correla-
tion between not believing that climate change takes place and being insured. Respondents
who believe that climate change does not take place, have a higher probability of not having
bought home or accident insurance than persons who believe in climate change or who are
15
see, e.g., Plapp (2004), Grothmann and Patt (2005), Kunreuther and Pauly (2005)

18
undecided yet. Overall, the goodness of fit of this logistic regression is weak and the results
need further research (see Table 7).
Logistic Regression
Double-sided test:
*** = significant at the 1%-level
* = significant at the 10%-level
Group 1: Holding one or more poli-cies of home or accident insurance(n = 391)
Group 2: No such insurance (n = 119)
Real estate owner (yes) 0.921***
Experience with extreme weather event (yes) 0.823***
Believe that climate change does not take place -0.708*
Believe that climate change takes place 0.221
Number of household members 0.23*
Constant -0,087
Pseudo-R² 0.133
Table 7: Study A -Who tends to buy (home) insurance?
The results of study B, however, suggest that perceived risk has a significant effect on private
insurance demand. This could be shown by bivariate correlation analyses (Correlation coeffi-
cient of 0.30, significant at the 1%-level) and a multivariate (ordered logit) approach with the
data of study B (Table 8). However, the regression coefficient in Table 8 is very small.

19
Ordered Logit
Double-sided test:
*** = significant at the 1%-level
** = significant at the 5%-level
Understanding of the necessity to insure buildings against future cli-mate change related damages
N = 138
Personal Perceived Risk 0.0528 ***
Gender: female 0.3764
Age - 0.0017
Children - 0.3880
Education - 0.8521 **
Income 0.3263
Home-owner 0.3082
Agreement to statement “Climate change is biggest challenge for mankind”
- 0.1265
Interest for climate change - 0.5084
Revealed knowledge on climate change - 0.5038 **
Feeling influenced by mass media 0.1074
Stated experience of climate change impacts 0.0849
Stated Expectation of Public Relief in case of need 0.2726
Pseudo-R² 0.0791
Table 8: Study B - Factors influencing the understanding of the need to insure
These results show that the theoretical (positive) relation of personal perceived risk and mo-
tivation to protect, e.g. by insurance, exists in our samples. However, other factors may play
important roles, too. By the existing data we cannot exclude that variables not measured in
our surveys, e.g. personal risk attitude, and prior experience with insurance policies, have a
much greater effect on insurance demand than personal perceived risk with regard to cli-
mate change. This topic definitely deserves more and deeper research.
7. Conclusion
One main goal of the analysis was to check the correlations and interactions between
knowledge about climate change and the risk perception of climate change. In study A, we
found in fact no significant correlation between the score from the knowledge questions and
the hazard perception, but we found a correlation with the dread-factor as the main compo-

20
nent influencing risk perception of climate change. Respondents who revealed a better
knowledge in the questions about climate change perceived the climate change impacts as
less dreadful than those with weaker knowledge. This was confirmed in study B, where re-
spondents who revealed a better knowledge had perceived a lower degree of risk than those
with less accurate knowledge about the effects of climate change. Respondents in study A
who declared their own level of information about climate change as being rather high, ap-
praised climate change as a known phenomenon and ascribed to themselves a good ability
to imagine its effects. This, however, may lead to a higher degree of risk perception of cli-
mate change.
Strong trust in the function of external aid services in case of extreme weather events – fire-
fighters and other helpers as well as financial support – leads to decreased risk perception of
climate change.
Overall, both surveys independently from each other identified certain factors determining
risk perception. These are gender, experience of extreme weather events, and actual
knowledge about Climate Change.
The finding of study B regarding the non-effectiveness of climate impact information should
evoke concern about the cost and benefit of large-scale campaigns to inform the public
about expected climatic effects. Given the broad coverage of the topic in mass media with
partly quite drastic pictures and messages, scientifically grounded information may not en-
hance the awareness that climate change can impact everybody and that it is time to take
action on a personal level, too.
A significant effect of risk perception on the willingness to insure was exposed in study B, but
not in study A. However, in study A we found a significant influence of experience with dam-
ages through extreme weather events on insurance coverage.
Regarding the expected effects of climate change we – as a society – should be interested in
precautionary measures of all kinds and on all institutional levels. Instead of multiple large
scale information campaigns, other strategies, e.g. site-specific risk evaluation and commu-
nication about concrete protection measures may be more effective. Additionally, focussing
on concrete, tangible effects of climate change such as “inundation” or “storm hazard” could
help to ground the elusive concept of climate change. This may be a topic for further re-
search.

21
References
Brun, W. (1992) ‘Cognitive Components in Risk Perception. Natural Versus Manmade Risks’,
Journal of Behavioral Decision Making 5(2): 117–132.
Bundesregierung (2008) Deutsche Anpassungsstrategie an den Klimawandel – German Stra-
tegy for Adaptation to Climate Change,
http://www.bmu.de/klimaschutz/downloads/doc/42783.php.
Chaiken, S. and Trope, Y. (1999) Dual-Process Theories in Social Psychology, New York: Guil-
ford Press.
Earle, T.C., Siegrist, M. and Gutscher, H. (2007) Trust, Risk Perception and the TCC Model of
Cooperation. In Trust in Cooperative Risk Management. Uncertainty and Cooperation in the
Public Mind, ed. by Siegrist, M., Earle, T.C. and Gutscher, H., London: Earthscan Reader: 1-50.
Etkin, D. and Ho, E. (2007) ‘Climate Change: Perceptions and Discourses of Risk’, Journal of
Risk Research 10(5): 623-641.
Fischhoff, B., Slovic, P., Lichtenstein, S., Read, S. and Combs, B. (1978) ‘How Safe is Safe
Enough? A Psychometric Study of Attitudes Towards Technological Risks and Benefits’, Policy
Sciences, 9(2): 127-152.
Goersch, H. (2010) Empirische Untersuchung von Möglichkeiten der Förderung der Persönli-
chen Notfallvorsorge in Deutschland. Dissertation, University of Karlsruhe / KIT, dig-
bib.ubka.uni-karlsruhe.de/volltexte/1000016069.
Glenberg, A. M., Wilkinson, A. C. and Epstein, W. (1982) ‘The Illusion of Knowing. Failure in
the Self-Assessment of Comprehension’, Memory & Cognition 10(6): 597–602.
Grothmann, T. and Patt, A. (2005) ‘Adaptive Capacity and Human Cognition. The Process of
Individual Adaptation to Climate Change’, Global Environmental Change 15(3): 199–213.
IPCC (2007) Climate Change – Fourth Assessment Report of the Intergovernmental Panel on
Climate Change, Cambridge and New York: Cambridge University Press.
Karger, C. R. and Wiedemann, P. M. (1998) ‘Kognitive und affektive Komponenten der Be-
wertung von Umweltrisiken‘, Zeitschrift für experimentelle Psychologie 4(45): 334–344.
Kunreuther, H. and Pauly, M. (2005) ‘Insurance Decision-Making and Market Behavior’,
Foundations and Trends in Microeconomics 1(2): 63-127.
Osberghaus, D., Finkel, E. and Pohl, M. (2010) ‘Individual Adaptation to Climate Change: the
Role of Information and Perceived Risk’, Discussion Paper No. 10-061, Centre for European
Economic Research (ZEW), Mannheim.

22
Papke, L.E. and Wooldridge, J.M. (1996) ‘Econometric Methods for Fractional Response Vari-
ables with an Application to 401(k) Plan Participation Rates’, Journal of Applied Econometrics
11: 619-632.
Park, C. Y. (2001) ‘News Media Exposure and Self-Perceived Knowledge. The Illusion of
Knowing’, International Journal Of Public Opinion Research. 13(4): 19-425.
Plapp, T. (2004) Wahrnehmung von Risiken aus Naturkatastrophen. Eine empirische Untersu-
chung in sechs gefährdeten Gebieten Süd- und Westdeutschlands, Karlsruhe: Verlag Versi-
cherungswirtschaft.
Schuchardt, B., Wittig, S., Mahrenholz, P., Kartschall, K., Mäder, C., Hasse, C. and Daschkeit,
A. (2008) Germany in the Midst of Climate Change: Adaptation is Necessary, Umweltbun-
desamt, KomPass (Competence Centre on Climate Impacts and Adaptation), 4-13.
Sloman, S. A. (1996) ‘The Empirical Case for Two Systems of Reasoning’, Psychological Bulle-
tin 119(1): 3–22.
Slovic, P., Fischhoff, B. and Lichtenstein, S. (1986) ‘The Psychometric Study of Risk Percep-
tion’. In Covello, V.T., Menkes, J. and Mumpower, J. (Eds.), Risk Evaluation and Manage-
ment. New York, Plenum: 3-24.
Slovic, P. (1993) ’Perceived Risk, Trust, and Democracy’, Risk Anal. 13: 675–682.
Slovic, P. (1992) ‘Perceptions of Risk: Reflections on the Psychometric Paradigm’, in Krimsky,
S. and Golding, D. (eds.) Social theories of risk: Praeger, 117–152.
Starr, C. (1969) ‘Social Benefit Versus Technological Risk’ Science 165(3899): 1232-1238.
Swim, J., Clayton, S., Doherty, T., Gifford, R., Howard, G., Reser, J. et al. (2009) Psychology
and Global Climate Change. Addressing a Multi-Faceted Phenomenon and Set of Challenges.
American Psychological Association, Washington, DC.
UBA (2005) Klimawandel in Deutschland – Vulnerabilität und Anpassungsstrategien klima-
sensitiver Systeme, Forschungsbericht 201 41 253, Umweltbundesamt, Federal Environmen-
tal Agency, Dessau, Germany.
von Alten, G. (2008) Das Risikoverhalten von Landwirten. Eine Studie am Beispiel der Ernte-
mehrgefahrenversicherung. Dissertation. University of Göttingen, Germany.
Weber, E. (2006) ‘Experience-Based and Description-Based Perceptions of Long Term Risk.
Why Global Warming does not Scare Us (yet)’, Climatic Change 77(1): 103–120.
Werner, U. (1994) Aspects of Multicultural Marketing of Insurance Companies, The Geneva
Papers on Risk and Insurance 19: 196-214.

23
Appendix
B1: Informative text about climate change and expected impacts in study B
Note: In the survey, either the chapter on global impacts or on regional impacts has been
provided to the participants. The other chapters (e.g. causes of climate change) were dis-
tributed to all treated participants.
Global Climate Change [both subgroups]
Current available evidence indicates that there have already been significant changes in cli-
mate and climate-related effects throughout various regions of the world. According to sci-
entific consensus, climate change is “already happening, unequivocal and this change can
now be firmly attributed to human activity.” Over the past 100 years, the average global
temperature has risen 0.74C, with most of the warming occurring in the past 50 years. If
greenhouse gas emissions continue to increase at their present rate, average global temper-
ature could rise to about 3C by the end of this century. Further warming may induce many
changes in the global climate system during the 21st century that would very likely surpass
those that have occurred in the previous century.
A Definition of Climate Change [both subgroups]
A change in the state of the climate that can be identified (e.g. using statistical tests) by
changes in the mean and/or the variability of its properties, and that persists for an extend-
ed period, typically decades or longer. It refers to any change in climate over time, whether
due to natural variability or as a result of human activity.
Causes of Climate Change [both subgroups]
Climate scientists concur that principal reason for the increase in temperature and related
weather and climate events is the result of a century and a half of industrialization. Human
activities such as the burning of oil, gasoline and coal, the increase in deforestation and cer-
tain farming methods have increased the emissions of so-called “greenhouse gases” (GHGs)
in the atmosphere. These gases, which include carbon dioxide, methane and nitrous oxide
among others, have amassed in the atmosphere to a quantity that is interfering with the
balance of the world’s climate system.
GHGs are naturally occurring gases which affect the absorption, scattering and emission of
radiation within the atmosphere and at the Earth’s surface. These gases are vital for mediat-
ing the temperature of the planet and thus are essential for life on earth. However, global
atmospheric concentrations of carbon of GHGs have increased markedly since 1750 and now
far exceed pre-industrial values.

24
The largest growth in GHG emissions between 1970 and 2004 has come from energy supply,
transport and industry. Annual emissions of carbon dioxide, the most important anthropo-
genic GHG, have grown between 1970 and 2004 by about 80%, from 21 to 38 gigatonnes
(Gt), and represented 77% of total anthropogenic GHG emissions in 2004.
The clear increase in the atmospheric concentrations of these gases is augmenting global
temperatures to artificially high levels and, as a result, altering the climate. The 1990s have
been recorded as the warmest decade of the last millennium. Moreover it is deemed virtual-
ly certain that this trend of warmer and more frequent hot days over most land regions will
continue within the next century.
Predicted Global Impacts [subgroup ‘global impacts’]
Current projections state that trends in extreme weather events, along with other risks such
as glacier melting and sea level-rise, are already occurring at a lower level of temperature
rise than expected and are likely to increase within the next century. Between 1990 and
2008 almost 600,000 people died directly from more than 11,000 extreme weather events,
and losses of 1.7 trillion USD occurred (in 2008 values). Bangladesh, Myanmar and Honduras
have been identified to be the most affected. They are followed by Vietnam, Nicaragua, Haiti
and India. Further examples global impacts by sector are listed below.
Agricultural Effects:
Increased temperature is expected to enhance crop yields in temperate areas,
but decrease crop yields in tropical areas, increasing the risk of hunger.
Changes in agricultural and forestry management at Northern Hemisphere
latitudes are possible, such as earlier spring planting of crops and alterations
in disturbances to forests due to fires and pests.
Increases in the frequency of droughts and floods are projected to affect local
and crop production negatively especially in subsistence sectors at low lati-
tudes.
Agricultural production, including access to food, in many African and Latin
American countries is projected to be severely compromised. This would fur-
ther adversely affect food security and exacerbate malnutrition.
There may be an increased yield of rain-fed agriculture by 5-20 % in North
America, but with variability among regions.
Health Effects:
Predicted threats on some aspects of human health include excess heat-
related mortality in Europe and North America, changes in Infectious Disease
25
vectors in parts of Europe and an earlier onset and increases in seasonal pro-
duction of allergic pollen.
The changes will be mostly felt by those least able to adapt, such as the poor,
the very young and the elderly.
There are projected increases in malnutrition; increased deaths, diseases and
injury due to extreme weather events; increased burden of diarrhoeal diseases;
increased frequency of cardio-respiratory diseases due to higher concentrations
of ground-level ozone in urban areas related to climate change; and the altered
spatial distribution of some infectious diseases in many world regions.
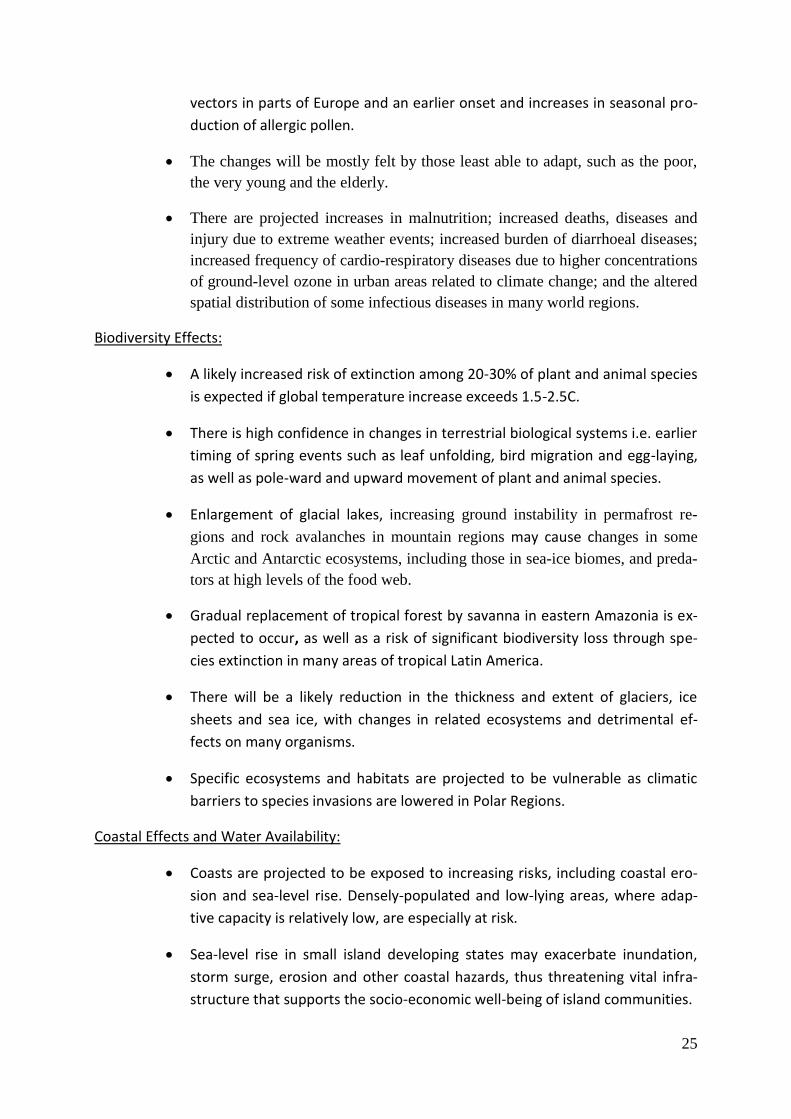
Biodiversity Effects:
A likely increased risk of extinction among 20-30% of plant and animal species
is expected if global temperature increase exceeds 1.5-2.5C.
There is high confidence in changes in terrestrial biological systems i.e. earlier
timing of spring events such as leaf unfolding, bird migration and egg-laying,
as well as pole-ward and upward movement of plant and animal species.
Enlargement of glacial lakes, increasing ground instability in permafrost re-
gions and rock avalanches in mountain regions may cause changes in some
Arctic and Antarctic ecosystems, including those in sea-ice biomes, and preda-
tors at high levels of the food web.
Gradual replacement of tropical forest by savanna in eastern Amazonia is ex-
pected to occur, as well as a risk of significant biodiversity loss through spe-
cies extinction in many areas of tropical Latin America.
There will be a likely reduction in the thickness and extent of glaciers, ice
sheets and sea ice, with changes in related ecosystems and detrimental ef-
fects on many organisms.
Specific ecosystems and habitats are projected to be vulnerable as climatic
barriers to species invasions are lowered in Polar Regions.
Coastal Effects and Water Availability:
Coasts are projected to be exposed to increasing risks, including coastal ero-
sion and sea-level rise. Densely-populated and low-lying areas, where adap-
tive capacity is relatively low, are especially at risk.
Sea-level rise in small island developing states may exacerbate inundation,
storm surge, erosion and other coastal hazards, thus threatening vital infra-
structure that supports the socio-economic well-being of island communities.

26
Large populations in Asian Mega deltas (i.e. Genges-Brahmaputra and the
Zhujiang) may have a high exposure to seal-level rise, storm surge and river
flooding.
Increased stress on coastal communities and habitats in North America is ex-
pected as a result of climate change impacts.
In Europe there will be an increased risk of inland flash floods, more frequent
coastal flooding and increased erosion, as well as glacier retreat in mountain-
ous areas.
By mid-century, water availability is predicted to increase by 10-40% at high
latitudes and in some wet tropical areas, and decrease by 10-30% over some
dry regions at mid-latitudes and in the dry tropics, some of which are present-
ly water stressed areas.
Water resources may be compromised in small island communities e.g. the
Caribbean and the Pacific, to the point where they become insufficient to
meet demand during low-rainfall periods.
Up to 250 million people in Africa at increased risk of water stress by 2020
due to water shortages.
Freshwater availability in Central, South, East and South-East Asia is predicted
to decrease by the 2050s
Warming in western North American mountains is projected to cause de-
creased snowpack, more winter flooding and reduced summer flows.
Economic effects:
Higher summer temperatures will lead to increased energy demand for space
cooling in many regions.
Climate change may lead to increased energy related costs, coastal and storm
damage related costs, health-related costs, etc. Economic impacts will be une-
venly distributed across regions and within the economy and society.
Impacts will place immense strains on public sector budgets and some sec-
ondary effects of climate impacts can include higher prices, reduced income
and job losses.
Climate change has the potential to push developing countries back into the
poverty trap and to undo many achievements that have been made to date
with regard to the Millennium Development Goals (MDGs)

27
Reduced snow cover and winter tourism is expected in some European coun-
tries.
Southern Europe will face higher temperatures and drought, reduced water
availability, hydropower potential, summer tourism and crop productivity.
Predicted Impacts within Germany [subgroup ‘local impacts’]
Current research shows that the annual mean temperature in Germany over the past 100
years rose by about 0.8C and in the past decades this warming trend has increased to nearly
double that rate at a pace of 0.15C per decade. By 2100 temperatures in Germany will be
likely to increase with regional and seasonal differences by 1.5 to 3.7C. In the past 100 years
precipitation has increased significantly, primarily in western Germany, with the greatest
increase taking place in winter. Climate change is also manifesting itself in the unusual inten-
sity of extreme weather events such as heat periods and heavy precipitation. They are long-
er in duration, more frequent or more intense. There will be fewer frost days, more hot days
and more tropical nights, and the number and duration of heat waves will increase. Studies
show that southwest Germany (Upper Rhine Graben), the central sections of eastern Ger-
many and the Alps have the highest vulnerability to climate changes.
Health Effects:
Illnesses and injuries caused by heat waves, storms, floods avalanches or landslides
expected to increase
Altered areas of spread of vector-borne diseases
Great heat intensities in cities may lead to more cardiovascular problems and even
deaths.
For the Upper Rhine Graben climate change will become manifest in particular by a
substantial increase in hot days and nights as well as in the number and duration of
hot seasons. This increase will be a challenge for the health care sector in particular.
Agriculture and Forestry:
Impairment of crop yields particularly in regions that will be more arid in the future
Increase in soil erosion, mounting risk of impeded drainage, flooding or drought
stress
Increased vulnerability of forests unsuitable for their location as well as greater risks
of forest fires
Increasing pressure due to pests and extreme weather conditions.

28
Above average rise in winter precipitation for the North Sea coast and the northwest
German lowlands and a particularly sharp decrease in summer precipitation for the
Baltic Sea coast and the north eastern lowlands. This may lead to problems in agricul-
ture or water management in the northeast regions, which have already been affect-
ed by drought.
Water Management:
Summer precipitation will decline by 30 percent on average. However, the frequency
of heavy precipitation will increase, with greater risk of floods in winter and spring
More frequent low water in summer and altered groundwater tables with possible
consequences for drinking water supply
The highest increase in average winter precipitation in all of Germany is expected in
the low mountain range region on both sides of the Rhine. Summer precipitation will
decline to a relatively minor extent. Consequences can be expected for agriculture
and forestry as well as for flood protection.
Nature conservation and biodiversity:
Threat to species diversity, especially in wetlands and mountainous regions, with
consequences for nature and conservation goals.
Tourism:
We must expect a shrinkage in glaciers and snow cover in the Alps
Reduced snow-reliability in mountainous regions for winter tourism, though im-
proved prospects of economic success for tourist destinations on the coasts
Possible negative consequences for tourists because of increased occurrence of jelly-
fish and toxic algae on the coasts.
Flood and Coastal Protection:
More frequent and intensive flood events place demands on flood and coastal pro-
tection facilities
The sea level could rise significantly by 30 cm on average, with a considerably higher
rise in sea level expected for part of the coasts in Germany due to land subsidence
and enlargement of the tidal range.
Economic effects:
Past extreme weather effects have amounted to very high damage costs in Germany.
The Elbe flood in 2002 caused total economic damage of €9.4 billion

29
The hurricanes “Lothar” and “Martin” in 1999 were responsible for damage amount-
ing to over €14 billion.
In addition, as a consequence of the hot summer in 2003, statisticians counted over
7,000 deaths more than in normal summers in Germany.
Mitigation and Adaptation to Climate Change [both subgroups]
Societies can respond to climate change through two processes: mitigation and adaptation.
The standard definitions of mitigation and adaptation agreed upon by scientists are the fol-
lowing:
Mitigation: Technological change and substitution that reduce resource inputs and emis-
sions per unit of output. Although several social, economic and technological policies would
produce an emission reduction, with respect to Climate Change, mitigation means imple-
menting policies to reduce greenhouse gas emissions and enhance sinks.
Adaptation: Initiatives and measures to reduce the vulnerability of natural and human sys-
tems against actual or expected climate change effects. Various types of adaptation exist,
e.g. anticipatory and reactive, private and public, and autonomous and planned. Examples
are raising river or coastal dikes, the substitution of more temperature-shock resistant plants
for sensitive ones, etc.
B2: Questions for eliciting Personal Risk Perception in study B How concerned are you about the issue of climate change?
Not at all con-
cerned
Rather not
concerned
Neutral Rather con-
cerned
Strongly con-
cerned
Don’t know
1 2 3 4 5 .

30
To what degree do you feel/think that climate change poses a serious hazard for the group of people
mentioned below?
No serious
danger at
all
Rather
no serious
danger
Neutral Rather
serious
danger
Very seri-
ous danger
Don’t
know
Myself
1 2 3 4 5 .
My children
1 2 3 4 5 .
Future Generations in
general
1 2 3 4 5 .
The region around
Mannheim
1 2 3 4 5 .
The people in Germany 1 2 3 4 5 .

31
How likely do you feel/think it is that the following expected effects of climate change will have a
personal impact on you?
Very un-
likely
Rather
unlikely
Neutral Rather like-
ly
Very likely Don’t
know
Increased flooding
due to heavy rain-
fall
1 2 3 4 5 .
Increasing droughts
1 2 3 4 5 .
Increasing illnesses
1 2 3 4 5 .
Strong heatwaves
1 2 3 4 5 .
Increasing number
of natural disasters
generally
1 2 3 4 5 .
Climate-related
refugees from for-
eign countries
1 2 3 4 5 .
Additional costs
due to climate-
tax/ climate- in-
surance
1 2 3 4 5 .
When do you expect the effects of climate change to take place?
Never In more
than 50
years
Whithin the next
50 years
Whithin the next
10 years
Already tak-
ing place
Don’t know
1 2 3 4 5 .
32
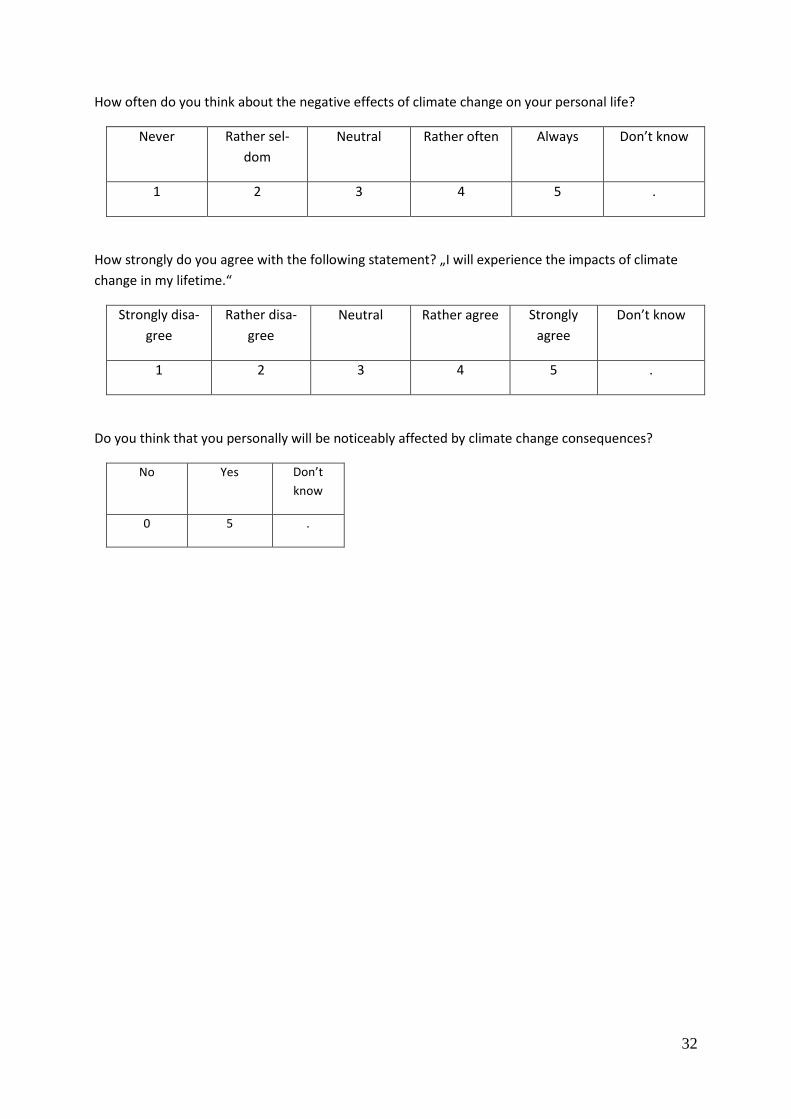
How often do you think about the negative effects of climate change on your personal life?
Never Rather sel-
dom
Neutral Rather often Always Don’t know
1 2 3 4 5 .
How strongly do you agree with the following statement? „I will experience the impacts of climate
change in my lifetime.“
Strongly disa-
gree
Rather disa-
gree
Neutral Rather agree Strongly
agree
Don’t know
1 2 3 4 5 .
Do you think that you personally will be noticeably affected by climate change consequences?
No Yes Don’t
know
0 5 .

33
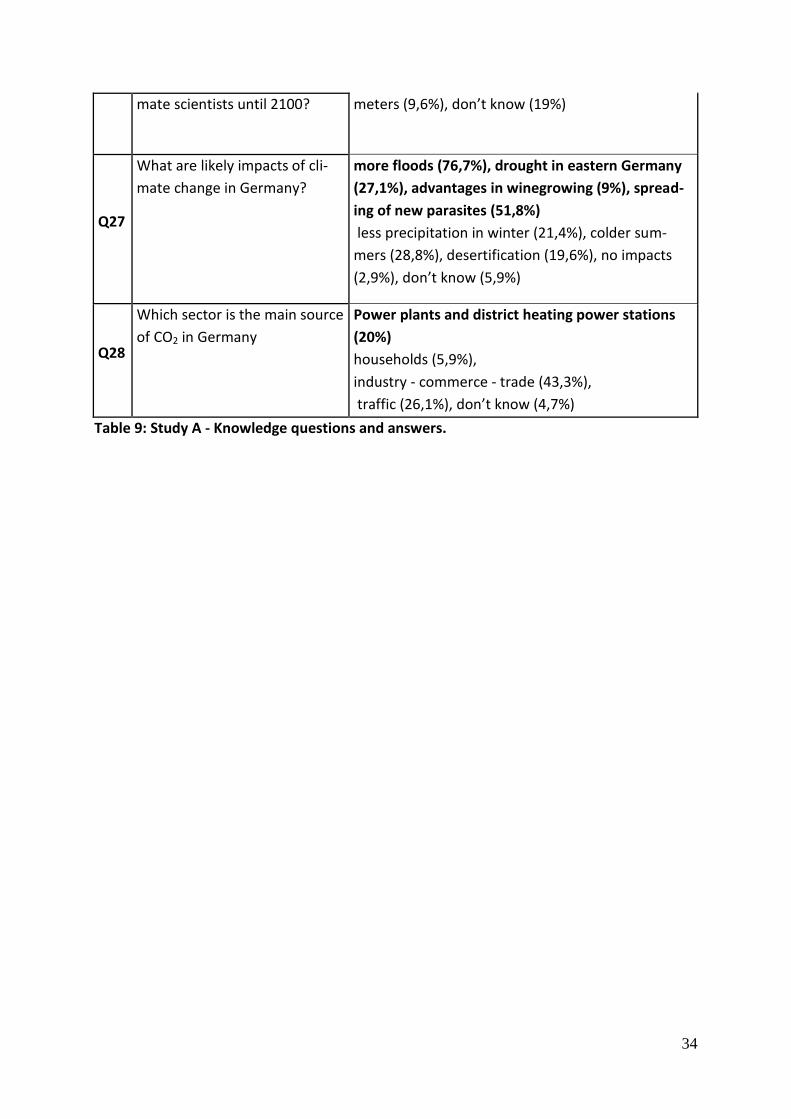
A1: Knowledge questions in study A
Question Answers[ correct answers are printed in bold
Q21
Which animals contribute sig-
nificantly to emissions of
greenhouse gases into the at-
mosphere?
Cattle (68.4%), dogs (4.3%), reptiles (2.5%), polar
bears (3.9%), none (19.4%), don’t know (9.2%)
Q22
Which of the following factors
are likely to contribute to cli-
mate change?
Co2 –emissions (82.9%), methane – emissions
(38.4%), deforestation (64.1%),
hydrogen sulfide emissions (19%), the ozone hole
(61.2%), none of those (1.6%), don’t know (2.5%)
Q23
What is the International Panel
on Climate Change (IPCC)?
An international body with the task to present the
state of research on climate change, the associated
risks and mitigation and adaptation strategies
(27.3%)
A UN forum for the coordination of environmental
and climate policy of all participating nations
(14.7%)
A supranational body to discuss and coordinate the
implementation of the decisions of the Kyoto Pro-
tocol (11.4%)
A non-profit organization that provides a platform
for trade of emission-certificates (2.4%).
don’t know (44.3%)
Q24
By how much did the global
temperature rise from the be-
ginning of the recordings in
1860 until today?
0,7°C (19,4%),
1,8°C (32.5%), 3°C (21.2%), 5°C(7,6%), don’t know
(16.1%)
Q25
Politicians of many countries
are trying to make arrange-
ments to limit climate change.
Which global climate target do
they intend to achieve? (In
comparison to preindustrial
times)
max. 2°C warming (31.2%)
no warming (6,9%)
max. 1°C warming (17.1%), max. 3°C warming
(9.8%), max. 4°C warming (3.1%), don’t know (32%)
Q26 Which average global sea level
rise is predicted by most cli-
Less than 2 meters (40,2%),
none (2%), less than 5 meters (29,2%), less than 7
34
mate scientists until 2100? meters (9,6%), don’t know (19%)
Q27
What are likely impacts of cli-
mate change in Germany?
more floods (76,7%), drought in eastern Germany
(27,1%), advantages in winegrowing (9%), spread-
ing of new parasites (51,8%)
less precipitation in winter (21,4%), colder sum-
mers (28,8%), desertification (19,6%), no impacts
(2,9%), don’t know (5,9%)
Q28
Which sector is the main source
of CO2 in Germany
Power plants and district heating power stations
(20%)
households (5,9%),
industry - commerce - trade (43,3%),
traffic (26,1%), don’t know (4,7%)
Table 9: Study A - Knowledge questions and answers.