geodate - monash university
TRANSCRIPT

GEODATE
GEODATE is published and distributed by:Warringal Publications, PO Box 299, Richmond, VIC 3121 P: (03) 8678 1118 W: www.warringalpublications.com.au
ISSN 1837-8161 / Copyright 2019 © GEODATE
GEODATEVolume 32, Issue 1, March 2019

2 GEODATE
International migration: causes, challenges and policy responses . . . . . . . . . . . . . 3
Introduction . . . . . . . . . . . . . . . . . . . . . . . . . . . . . . . . . . . . . . . . . . . . . . . . . . . . . . . . . 3
The demographic transition model . . . . . . . . . . . . . . . . . . . . . . . . . . . . . . . . . . . . . . . 3
Tunisia: The demographic pressure-cooker scenario . . . . . . . . . . . . . . . . . . . . . . . . 4
The Philipines: The emigration-instead-of-development scenario . . . . . . . . . . . . . . . 5
Japan: The tough-bluster scenario . . . . . . . . . . . . . . . . . . . . . . . . . . . . . . . . . . . . . . . 5
Summary . . . . . . . . . . . . . . . . . . . . . . . . . . . . . . . . . . . . . . . . . . . . . . . . . . . . . . . . . . 6
Remote sensing: keeping an eye on our environment . . . . . . . . . . . . . . . . . . . . . . . 8
Remote sensing - who cares? . . . . . . . . . . . . . . . . . . . . . . . . . . . . . . . . . . . . . . . . . . 8
In a world of change . . . . . . . . . . . . . . . . . . . . . . . . . . . . . . . . . . . . . . . . . . . . . . . . . . 8
Detail vs . coverage . . . . . . . . . . . . . . . . . . . . . . . . . . . . . . . . . . . . . . . . . . . . . . . . . . . 8
The power to make the invisible visibile . . . . . . . . . . . . . . . . . . . . . . . . . . . . . . . . . . . 9
Case study 1: The Great Barrier Reef . . . . . . . . . . . . . . . . . . . . . . . . . . . . . . . . . . . . 9
Case study 2: Hazard and disaster management . . . . . . . . . . . . . . . . . . . . . . . . . . 10
Case study 3: Mango farming . . . . . . . . . . . . . . . . . . . . . . . . . . . . . . . . . . . . . . . . . 10
Summary . . . . . . . . . . . . . . . . . . . . . . . . . . . . . . . . . . . . . . . . . . . . . . . . . . . . . . . . . 11
CONTENTS
3 GEODATE
IntroductionMigration, like birth and death, is a pattern found in all human populations, even though in some periods – like the one we are living through – it is perceived as a crisis . But why does migration happen in the first place? Why is it sometimes perceived positively and other times negatively? How do governments manage migration and its associated challenges?
This article identifies various demographic drivers of population movement, examines policy responses of different governments, and explores their outcomes in different places . First we review the classic demographic transition model, which shows the interaction of fertility, mortality and socio-economic ‘modernisation’, absent of migration . Then we scrutinize the role of migration in key sections of this model .
We will examine several case studies, as examples of three general scenarios of migration management: 1) the ‘demographic pressure cooker’ scenario of the so-called Arab Spring; 2) the Philippines’ ‘emigration-instead-of-development’ scenario; and 3) Japan’s ‘tough bluster’ scenario. In each scenario we will ask: How have specific governments responded to issues of human population movement and change?
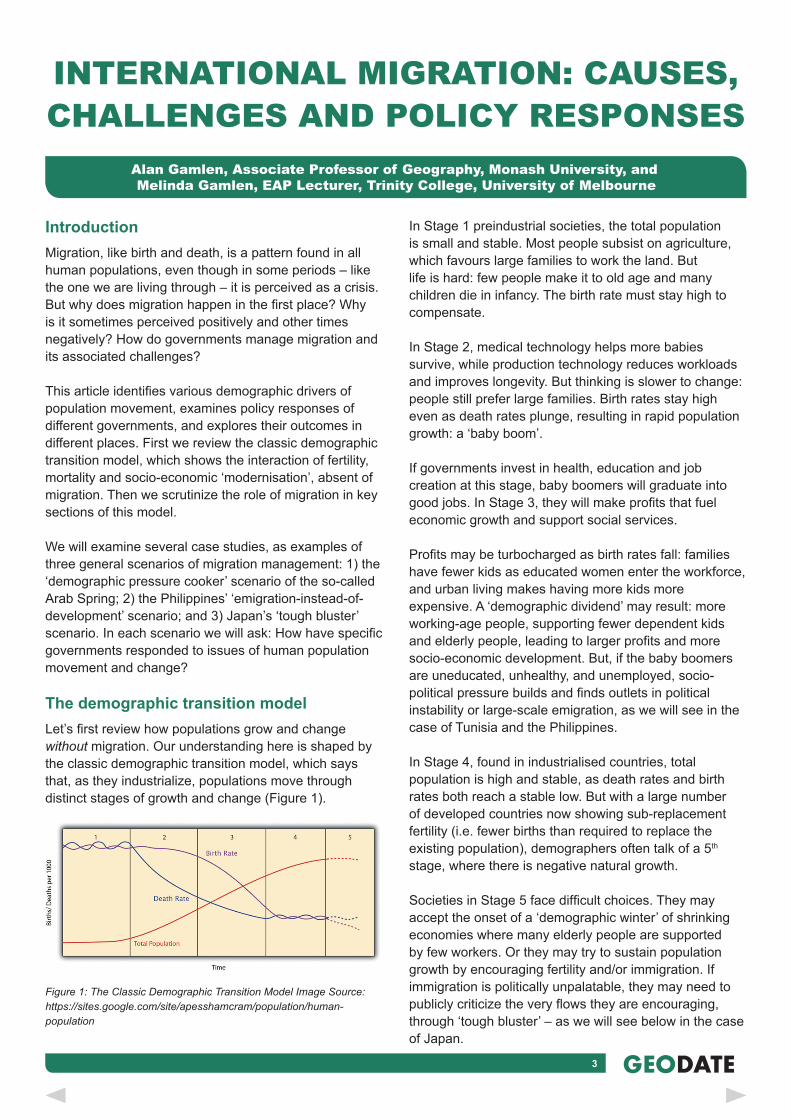
The demographic transition modelLet’s first review how populations grow and change without migration . Our understanding here is shaped by the classic demographic transition model, which says that, as they industrialize, populations move through distinct stages of growth and change (Figure 1) .
Figure 1: The Classic Demographic Transition Model Image Source: https://sites.google.com/site/apesshamcram/population/human-population
In Stage 1 preindustrial societies, the total population is small and stable . Most people subsist on agriculture, which favours large families to work the land . But life is hard: few people make it to old age and many children die in infancy . The birth rate must stay high to compensate .
In Stage 2, medical technology helps more babies survive, while production technology reduces workloads and improves longevity . But thinking is slower to change: people still prefer large families . Birth rates stay high even as death rates plunge, resulting in rapid population growth: a ‘baby boom’ .
If governments invest in health, education and job creation at this stage, baby boomers will graduate into good jobs. In Stage 3, they will make profits that fuel economic growth and support social services .
Profits may be turbocharged as birth rates fall: families have fewer kids as educated women enter the workforce, and urban living makes having more kids more expensive . A ‘demographic dividend’ may result: more working-age people, supporting fewer dependent kids and elderly people, leading to larger profits and more socio-economic development . But, if the baby boomers are uneducated, unhealthy, and unemployed, socio-political pressure builds and finds outlets in political instability or large-scale emigration, as we will see in the case of Tunisia and the Philippines .
In Stage 4, found in industrialised countries, total population is high and stable, as death rates and birth rates both reach a stable low . But with a large number of developed countries now showing sub-replacement fertility (i .e . fewer births than required to replace the existing population), demographers often talk of a 5th stage, where there is negative natural growth .
Societies in Stage 5 face difficult choices. They may accept the onset of a ‘demographic winter’ of shrinking economies where many elderly people are supported by few workers . Or they may try to sustain population growth by encouraging fertility and/or immigration . If immigration is politically unpalatable, they may need to publicly criticize the very flows they are encouraging, through ‘tough bluster’ – as we will see below in the case of Japan .
INTERNATIONAL MIGRATION: CAUSES, CHALLENGES AND POLICY RESPONSES
Alan Gamlen, Associate Professor of Geography, Monash University, andMelinda Gamlen, EAP Lecturer, Trinity College, University of Melbourne
4 GEODATE
Let’s focus on phases two, three and five – the most dynamic and interesting. What is the role of migration in these stages, and how do governments respond to it?
Tunisia: The demographic pressure-cooker scenarioIn Scenario 1, governments fail to invest in health, education and job-creation while the baby boomers are young, so they lack employment when they reach working age . To make matters worse, they are trapped by a lack of emigration options . Unemployment rises and socio-political unrest begins to boil .
This contributed to the political revolutions across North Africa and the Middle East from late 2010 . Things unravelled after December 17, when Mohamed Bouazizi, an uneducated 25-year-old Tunisian street vendor, harassed by local authorities over permits and fines, mounted his fruit-selling wheelbarrow yelling “I am tyrannised . I am oppressed”, then doused himself in petrol and set himself on fire in front of the local municipality building .
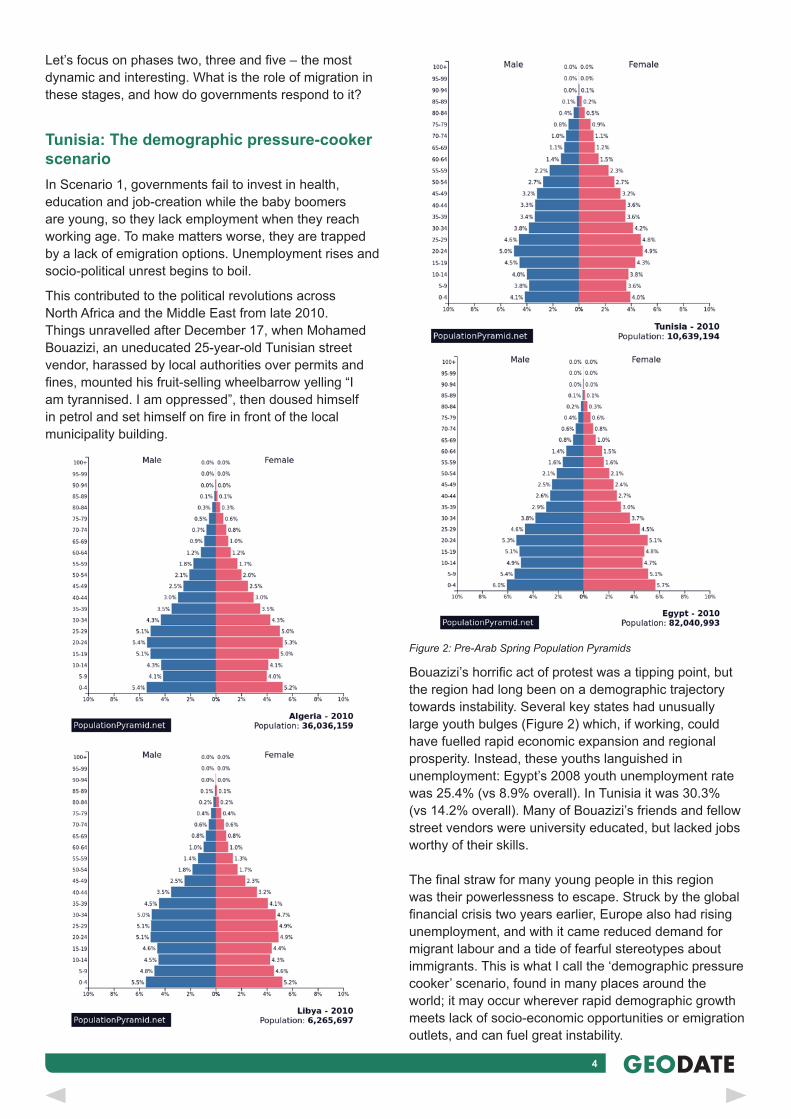
Figure 2: Pre-Arab Spring Population Pyramids
Bouazizi’s horrific act of protest was a tipping point, but the region had long been on a demographic trajectory towards instability . Several key states had unusually large youth bulges (Figure 2) which, if working, could have fuelled rapid economic expansion and regional prosperity . Instead, these youths languished in unemployment: Egypt’s 2008 youth unemployment rate was 25 .4% (vs 8 .9% overall) . In Tunisia it was 30 .3% (vs 14 .2% overall) . Many of Bouazizi’s friends and fellow street vendors were university educated, but lacked jobs worthy of their skills .
The final straw for many young people in this region was their powerlessness to escape . Struck by the global financial crisis two years earlier, Europe also had rising unemployment, and with it came reduced demand for migrant labour and a tide of fearful stereotypes about immigrants . This is what I call the ‘demographic pressure cooker’ scenario, found in many places around the world; it may occur wherever rapid demographic growth meets lack of socio-economic opportunities or emigration outlets, and can fuel great instability .

5 GEODATE
The Philippines: The emigration-instead-of-development scenarioThe most obvious solution to the demographic pressure cooker scenario is for policy makers to create emigration channels for their workers to leave . This can both reduce the number of unemployed, restless youth, and also increase supplies of hard cash sent home as ‘remittances’ by emigrants to their families . The Philippines has followed this strategy since the 1970s .
This ‘emigration-instead-of-development’ strategy first took off under President Marcos, who had run a populist campaign as a WWII hero in the late 1960s. As economic growth dried up, unemployment began to rise, and unrest began to simmer in protests demanding reform led by students and socialists . In response, Marcos declared martial law .
Alongside these repressive tactics, the regime began constructing a bureaucratic machine to export labourers, as a safety valve for unemployment and unrest . The Philippines now has a complex apparatus with multiple government organizations recruiting, training, marketing, brokering, protecting and repatriating emigrant workers .
About 10 million Filipinos – roughly 10 per cent of all Filipinos in the world – now live abroad, mainly as labour migrants, in a wide range of countries . This diaspora is augmented by some three thousand Filipino workers emigrating per week . In 2018, remittances to the Philippines totalled US$34 billion, about 10 percent of all Philippines’ economic activity .
This development model is not confined to the Philippines . Globally, remittances reached US$689 billion in 2018, $528 billion of which went to low- and middle-income countries. Remittance flows are several times larger than flows of Overseas Development Aid – and that is not even counting ‘informal’ remittances which are unrecorded .
Despite the vast sums involved, many economists criticize labour export schemes . They worry that remittances are wasted on conspicuous consumption, such as lavish houses filled with imported goods but empty of productive people .
Some compare remittances to a ‘resource curse’, which happens when the discovery of minerals like oil get in the way of necessary reforms in less-developed countries . Deferring them may lead to stagnation and instability, so this is sometimes called the ‘migration-instead-of-development’ scenario .
Japan: The tough-bluster scenarioScenario 3 may occur in Stage 5 of the demographic transition model, as societies slip into a so-called ‘demographic winter’, where sub-replacement fertility rates decimate economies and create huge, burdensome elderly populations .
Japan’s population, with fertility rates between 1 .25 and 1 .45 between 2005 and 2015 – well below the replacement level of 2 .1 – is shrinking, and so is its economy. What’s more, an increasing share of the population is elderly, and is supported by a dwindling working age population .
To grow the shrinking workforce quickly, the government has tried to increase female workforce participation in various ways – an approach it has called ‘womenomics’ . It has also tried to raise the birth rate, portraying the problem as “celibacy syndrome”.
But Japan has been reluctant to try the most obvious solution to its demographic problem: to import the extra workers needed to care for the elderly and do the jobs that native workers cannot or will not do . Approximately 2% of the Japanese population is overseas born – compared with over 28% in Australia .
This partly reflects that Japanese citizenship is defined on the basis of ancestry, expressing the country’s strong national myth of ethnic homogeneity, from which minority groups often feel excluded . Right-wing nationalists remain a strong political force in the country .
For a Japanese leader to openly advocate large-scale immigration would be politically unwise . Instead, successive governments have tried to keep people calm by looking tough on immigration, while talking up sexier solutions (including womenomics, and literally encouraging people to have more sex), to tackle the demographic challenge .
At the same time, however, governments have started to quietly increase the numbers and the diversity of immigrant workers. While still very low, immigration rates have risen rapidly . In the last two decades the share of foreign born has almost doubled . Till 1990 about 90% of immigrants were Korean; by 2016 more than 75% were from various countries .
The Japanese case is an example of a wider strategy in wealthy, ageing societies. When immigration is demographically and economically necessary but politically unacceptable, governments may play a double-game of talking closed to migrants but acting open behind the scenes . This is what I call the ‘tough-bluster’ scenario .
6 GEODATE
SummaryPopulation movement and change is at its most dynamic during stages 2, 3 and 5 of the demographic transition model . In these stages, management of migration becomes a crucial challenge .
Population growth without employment or emigration options can spell instability, as it did in Tunisia and other Arab countries during the Arab Spring .
Conversely, large-scale safety-valve emigration can lead to economic stagnation and remove pressure for necessary political changes, as in the Philippines and other remittance-dependent developing countries .
Meanwhile, ageing without politically preparing for immigration can foster the rise of populist politics – not only in Japan, but across Europe and North America in recent years .
As these three scenarios suggest, managing the pressures of immigration and population change in the coming decades will be one of the biggest global challenges we face .
Student activities1 . Keywords
a) Identify the keywords used in this article . b) Go-online to menti .com and enter these keywords to create a class word cloud . c) Identify the keywords that apply to each of the stages 2, 3 and 5 of the demographic transition model (DTM) and construct example scenarios of each of the keywords .
2 . Causes a) Migration (emigration and immigration) results from push and pull factors . b) Define the terms push and pull factors, and think of some common examples . c) Identify from the article, the push and pull factors associated with emigration from the Philippines . d) Identify barriers that may exist to international migration .
3 . Policy responses a) Explain why immigration is often seen as a solution to the economic and population issues faced by countries at stage 5 of the DTM . b) Suggest reasons why immigration may be politically unpopular .
4 . Population and migration a) In pairs, access the website https://www .populationpyramid .net/ b) Choose a country and describe the shape of its population pyramid . c) Identify the stage of the DTM that you think the country belongs to and explain the reasons for your decision . d) Identify the possible economic and population issues arising from the demographic profile of the country. e) Debate the role of migration (emigration or immigration) in solving the economic and population problems identified in (d).
5 . Patterns of international migration a) Examine the map of international migration flows at http://metrocosm.com/global-immigration-map/ b) Define the term net immigration. c) Describe the patterns of international migration flows. d) Suggest reasons for the patterns that you identify . e) From the article, what kinds of policy responses for these patterns do you expect?
7 GEODATE
BibliographyBarakat, B, 2014 . Family remember struggle of Mohamed Bouazizi. Available: https://www .alaraby .co .uk/english/features/2014/12/17/family-remember-struggle-of-mohamed-bouazizi . Last accessed 15 Feb 2019 .
Chotani, V M, 2017 . Five Years On, Where Does Abe’s ‘Womenomics’ Stand?. Available: https://jia .sipa .columbia .edu/online-articles/five-years-where-does-abe%E2%80%99s-%E2%80%98womenomics%E2%80%99-stand . Last accessed 15 Feb 2019 .
International Labour Organization, 2011 . Youth unemployment in the Arab world is a major cause for rebellion . Impact Stories . Available: https://www .ilo .org/global/about-the-ilo/newsroom/features/WCMS_154078/lang--en/index .htm . Last accessed 15 Feb 2019 .
Natter, K, 2015 . Revolution and Political Transition in Tunisia: A Migration Game Changer? Available: https://www .migrationpolicy .org/article/revolution-and-political-transition-tunisia-migration-game-changer . Last accessed 15 Feb 2019 .
World Bank, 2018. Accelerated remittances growth to low- and middle-income countries in 2018. Available: https://www .worldbank .org/en/news/press-release/2018/12/08/accelerated-remittances-growth-to-low-and-middle-income-countries-in-2018 . Last accessed 15 Feb 2019 .
8 GEODATE
Remote sensing – who cares?Remote sensing may sound like a technical term, but it’s really quite simple – getting information from something (sensing) without physically touching it (remote) . This encompasses a whole range of technologies including satellite images (think Google Earth), ultrasounds of unborn babies, fish finders on boats, and the camera in your phone . Even your eyes are remote sensors .I’m going to address the specific arm of remote sensing that we call Earth Observation, which is just as the name suggests, checking out what’s happening on Earth. We use it all the time in environmental science to see what’s going on in the world around us .
In a world of changeNot only is remote sensing great for helping us understand the current state of the environment, but with archives of aerial photos dating back to the mid 1800’s, we can see how things have changed over time . Some of the earliest aerial remote sensing images were taken by attaching cameras to kites, rockets, tethered balloons, and – can you believe it – pigeons (Lillesand et al . 2008) . Space based sensing or imaging began nearly a century later and remains a primary source of earth observation data today, as remote as up to 36,000km away .
Perhaps you are familiar with viewing weather reports, or watching the track of a cyclone as it progresses . This requires satellites to be capturing images several times an hour . Such high frequency is also required to look at changes within the atmosphere after a volcanic eruption . Other changes in the environment tend to occur over longer time scales, and high frequency data capture is not so critical . For example, some environmental changes like snow or ice extent may be viewed on a seasonal basis . Increase in urbanization may occur over an even longer time scale, and could be captured using annual imagery .
Regardless of the application or frequency of information required, monitoring change requires us to establish a baseline viewpoint to which we can compare subsequent images. Without understanding what the baseline looks like, it’s impossible to know if anything has changed, let alone what has changed, or by how much . This is where remote sensing is super useful, as the visual record it
provides is one that we can always refer back to or even re-analyze if required .
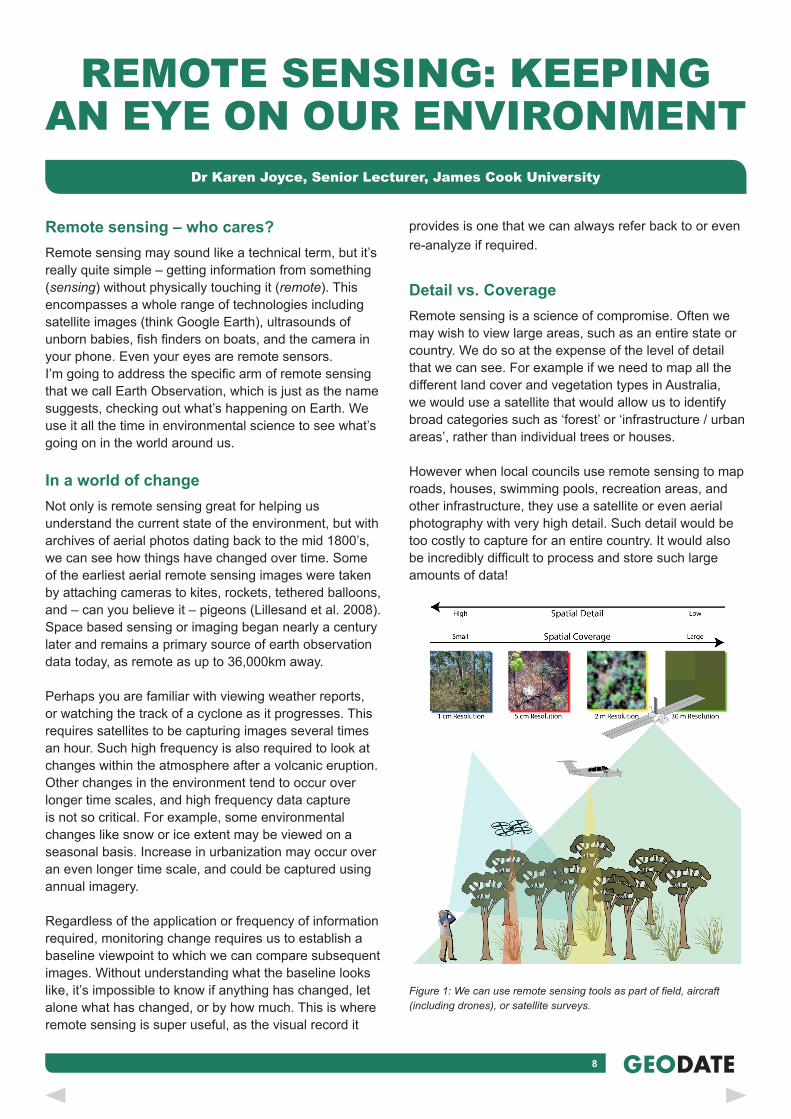
Detail vs . CoverageRemote sensing is a science of compromise . Often we may wish to view large areas, such as an entire state or country. We do so at the expense of the level of detail that we can see . For example if we need to map all the different land cover and vegetation types in Australia, we would use a satellite that would allow us to identify broad categories such as ‘forest’ or ‘infrastructure / urban areas’, rather than individual trees or houses .
However when local councils use remote sensing to map roads, houses, swimming pools, recreation areas, and other infrastructure, they use a satellite or even aerial photography with very high detail . Such detail would be too costly to capture for an entire country . It would also be incredibly difficult to process and store such large amounts of data!
Figure 1: We can use remote sensing tools as part of field, aircraft (including drones), or satellite surveys.
REMOTE SENSING: KEEPING AN EYE ON OUR ENVIRONMENT
Dr Karen Joyce, Senior Lecturer, James Cook University
9 GEODATE
This means that there is no single remote sensing option that can achieve everything . As such, we often employ multiple different methods to capture the information we need . Figure 1 demonstrates how we compromise between different methods of data collection . Generally speaking, the larger the area covered, the less detail captured . All scales and levels of detail are useful and valid in their own right and each tell a valuable part of the story .
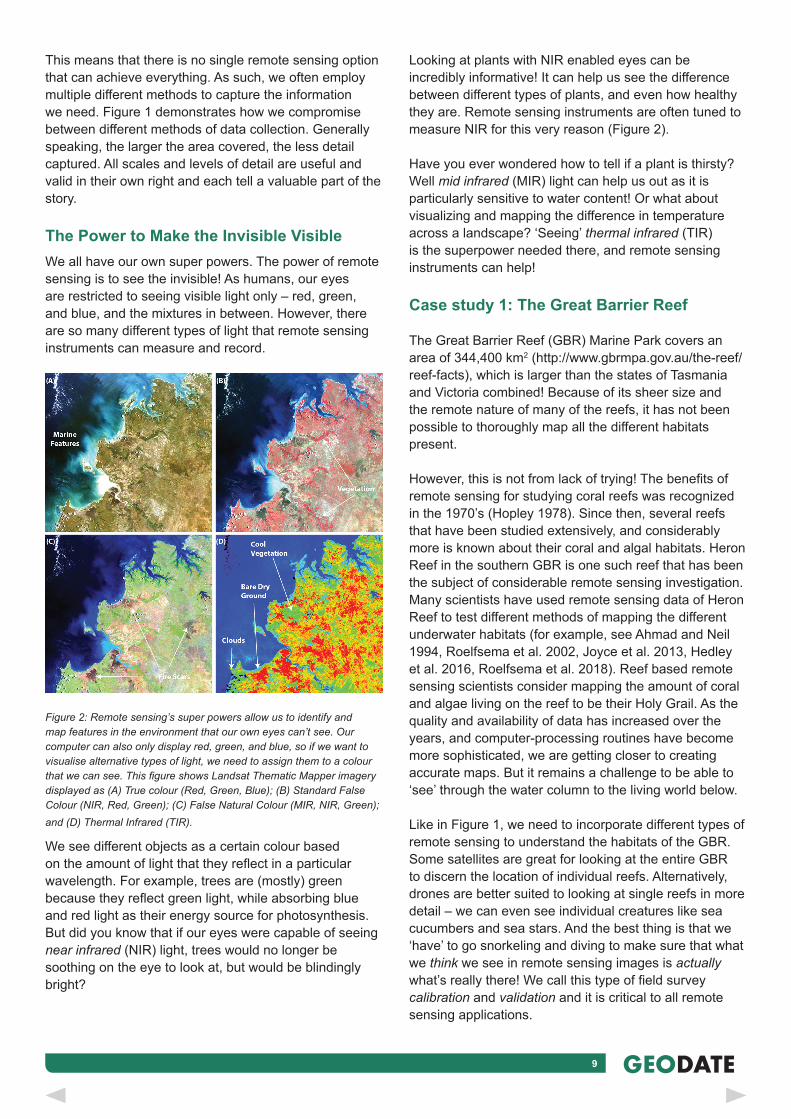
The Power to Make the Invisible VisibleWe all have our own super powers. The power of remote sensing is to see the invisible! As humans, our eyes are restricted to seeing visible light only – red, green, and blue, and the mixtures in between . However, there are so many different types of light that remote sensing instruments can measure and record .
Figure 2: Remote sensing’s super powers allow us to identify and map features in the environment that our own eyes can’t see. Our computer can also only display red, green, and blue, so if we want to visualise alternative types of light, we need to assign them to a colour that we can see. This figure shows Landsat Thematic Mapper imagery displayed as (A) True colour (Red, Green, Blue); (B) Standard False Colour (NIR, Red, Green); (C) False Natural Colour (MIR, NIR, Green); and (D) Thermal Infrared (TIR).
We see different objects as a certain colour based on the amount of light that they reflect in a particular wavelength . For example, trees are (mostly) green because they reflect green light, while absorbing blue and red light as their energy source for photosynthesis . But did you know that if our eyes were capable of seeing near infrared (NIR) light, trees would no longer be soothing on the eye to look at, but would be blindingly bright?
Looking at plants with NIR enabled eyes can be incredibly informative! It can help us see the difference between different types of plants, and even how healthy they are . Remote sensing instruments are often tuned to measure NIR for this very reason (Figure 2) .
Have you ever wondered how to tell if a plant is thirsty? Well mid infrared (MIR) light can help us out as it is particularly sensitive to water content! Or what about visualizing and mapping the difference in temperature across a landscape? ‘Seeing’ thermal infrared (TIR) is the superpower needed there, and remote sensing instruments can help!
Case study 1: The Great Barrier Reef
The Great Barrier Reef (GBR) Marine Park covers an area of 344,400 km2 (http://www .gbrmpa .gov .au/the-reef/reef-facts), which is larger than the states of Tasmania and Victoria combined! Because of its sheer size and the remote nature of many of the reefs, it has not been possible to thoroughly map all the different habitats present .
However, this is not from lack of trying! The benefits of remote sensing for studying coral reefs was recognized in the 1970’s (Hopley 1978) . Since then, several reefs that have been studied extensively, and considerably more is known about their coral and algal habitats . Heron Reef in the southern GBR is one such reef that has been the subject of considerable remote sensing investigation . Many scientists have used remote sensing data of Heron Reef to test different methods of mapping the different underwater habitats (for example, see Ahmad and Neil 1994, Roelfsema et al . 2002, Joyce et al . 2013, Hedley et al . 2016, Roelfsema et al . 2018) . Reef based remote sensing scientists consider mapping the amount of coral and algae living on the reef to be their Holy Grail . As the quality and availability of data has increased over the years, and computer-processing routines have become more sophisticated, we are getting closer to creating accurate maps . But it remains a challenge to be able to ‘see’ through the water column to the living world below .
Like in Figure 1, we need to incorporate different types of remote sensing to understand the habitats of the GBR . Some satellites are great for looking at the entire GBR to discern the location of individual reefs . Alternatively, drones are better suited to looking at single reefs in more detail – we can even see individual creatures like sea cucumbers and sea stars . And the best thing is that we ‘have’ to go snorkeling and diving to make sure that what we think we see in remote sensing images is actually what’s really there! We call this type of field survey calibration and validation and it is critical to all remote sensing applications .

10 GEODATE
Figure 3: Remote sensing at different scales is the only way that we can map and monitor the thousands of individual reefs within the Great Barrier Reef
Case study 2: Hazard and Disaster managementGetting information about the environment during a natural disaster can be a huge challenge, as often the affected areas are very difficult to access. Remote sensing is an invaluable asset in these situations as by its very nature, the information is captured from a distance .
Remote sensing is very powerful in capturing information about the extent and type of damage (e.g. floods, fire front, and surface lava following a volcanic eruption) . But its usefulness is not limited to the response phase of disaster management (Joyce et al. 2010). While we can’t use it to stop a particular event (e .g . heavy rainfall, volcanic eruption) occurring, it can certainly be used to reduce the impact of that event through informing the urban planning process (e.g. identifying landslide or flood prone regions and excluding development from those areas) . Once the event is impending, remote sensing helps communities get ready by providing information about potential impact extents (e .g . cyclone path prediction) . Finally, we use remote sensing to monitor the recovery of the environment and communities through looking at aspects like vegetation regrowth (e .g . following landslides - Figure 4) and building reconstruction . This process of recovery often takes years as can be seen in an example given by Joyce et al (2010) tracking an area affected by Hurricane Katrina in 2005. Roofing damage and temporary housing blocks were still evident in high spatial resolution remote sensing imagery up to three years later .
In the event of a disaster, the public relies on remote sensing imagery more than they know. We constantly consume imagery through traditional and social media,
and it is the job of a remote sensing scientist to turn the pictures into valuable information . Remote sensing scientists simplify the often-complicated data streams into easily digestible maps .
Figure 4: Remote sensing is a critical tool for monitoring the spread and impact of natural disasters, as well as the process of environmental recovery. The sequence of SPOT satellite images above show a heavily vegetated landscape in New Zealand (A) Before landsliding – April 2007; (B) After a severe rainstorm and subsequent landsliding in November 2007, and (C) Partially revegetated in September 2008. These images are standard false colour composites, where vegetation appears red (see Figure 2).
Case study 3: Mango FarmingYou are probably aware that farmers earn their income by selling their produce to markets and supermarkets around the country and sometimes around the world . But
11 GEODATE
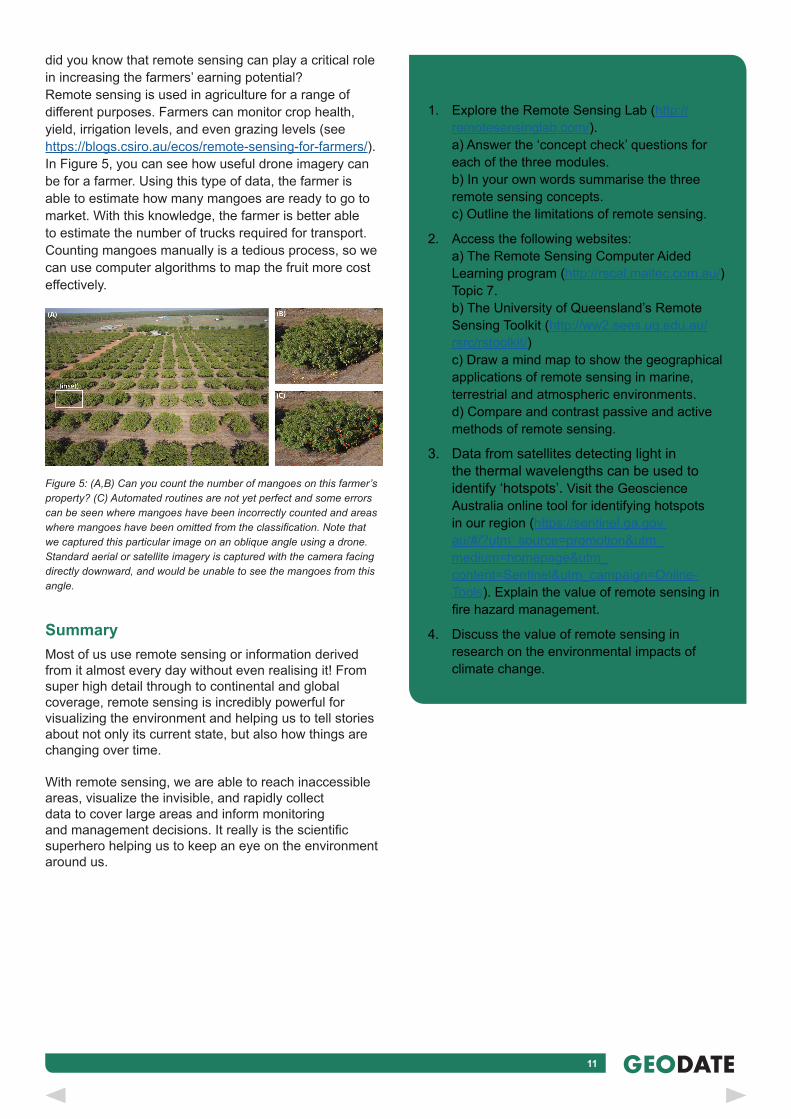
did you know that remote sensing can play a critical role in increasing the farmers’ earning potential?Remote sensing is used in agriculture for a range of different purposes . Farmers can monitor crop health, yield, irrigation levels, and even grazing levels (see https://blogs .csiro .au/ecos/remote-sensing-for-farmers/) . In Figure 5, you can see how useful drone imagery can be for a farmer . Using this type of data, the farmer is able to estimate how many mangoes are ready to go to market. With this knowledge, the farmer is better able to estimate the number of trucks required for transport . Counting mangoes manually is a tedious process, so we can use computer algorithms to map the fruit more cost effectively .
Figure 5: (A,B) Can you count the number of mangoes on this farmer’s property? (C) Automated routines are not yet perfect and some errors can be seen where mangoes have been incorrectly counted and areas where mangoes have been omitted from the classification. Note that we captured this particular image on an oblique angle using a drone. Standard aerial or satellite imagery is captured with the camera facing directly downward, and would be unable to see the mangoes from this angle.
SummaryMost of us use remote sensing or information derived from it almost every day without even realising it! From super high detail through to continental and global coverage, remote sensing is incredibly powerful for visualizing the environment and helping us to tell stories about not only its current state, but also how things are changing over time .
With remote sensing, we are able to reach inaccessible areas, visualize the invisible, and rapidly collect data to cover large areas and inform monitoring and management decisions. It really is the scientific superhero helping us to keep an eye on the environment around us .
Student activities1 . Explore the Remote Sensing Lab (http://
remotesensinglab .com/) . a) Answer the ‘concept check’ questions for each of the three modules . b) In your own words summarise the three remote sensing concepts . c) Outline the limitations of remote sensing .
2 . Access the following websites: a) The Remote Sensing Computer Aided Learning program (http://rscal .maitec .com .au/) Topic 7 . b) The University of Queensland’s Remote Sensing Toolkit (http://ww2 .sees .uq .edu .au/rsrc/rstoolkit/) c) Draw a mind map to show the geographical applications of remote sensing in marine, terrestrial and atmospheric environments . d) Compare and contrast passive and active methods of remote sensing .
3 . Data from satellites detecting light in the thermal wavelengths can be used to identify ‘hotspots’ . Visit the Geoscience Australia online tool for identifying hotspots in our region (https://sentinel .ga .gov .au/#/?utm_source=promotion&utm_medium=homepage&utm_content=Sentinel&utm_campaign=Online-Tools) . Explain the value of remote sensing in fire hazard management.
4 . Discuss the value of remote sensing in research on the environmental impacts of climate change .
12 GEODATE
ReferencesAhmad, W. and D. T. Neil (1994). "An evaluation of landsat thematic mapper (tm) digital data for discriminating coral reef zonation: Heron reef (gbr)." International Journal of Remote Sensing 15(13): 2583 - 2597 .
Hedley, J ., C . Roelfsema, I . Chollett, A . Harborne, S . Heron, S. Weeks, W. Skirving, A. Strong, C. Eakin, T . Christensen, V . Ticzon, S . Bejarano and P . Mumby (2016). "Remote sensing of coral reefs for monitoring and management: A review." Remote Sensing 8(2): 118 .
Hopley, D . (1978) . Aerial photography and other remote sensing techniques . Coral reefs: Research methods . D . R . Stoddart and R . E . Johannes . Paris, UNESCO . 5: 23 - 44 .
Joyce, K . E ., S . R . Phinn and C . M . Roelfsema (2013). "Coral cover index testing and application with hyperspectral airborne image data." Remote Sensing 5: 6116 - 6137 .
Joyce, K. E., K. C. Wright, S. V. Samsonov and V. G. Ambrosia (2010). "Incorporating remote sensing into disaster management." Australian Journal of Emergency Management 25(4): 14-23 .
Lillesand, T. M., R. W. Kiefer and J. W. Chipman (2008). Remote sensing and image interpretation . New York, John Wiley & Sons, Inc.
Roelfsema, C., E. Kovacs, J. C. Ortiz, N. H. Wolff, D. Callaghan, M. Wettle, M. Ronan, S. M. Hamylton, P. J. Mumby and S. Phinn (2018). "Coral reef habitat mapping: A combination of object-based image analysis and ecological modelling." Remote Sensing of Environment 208: 27-41 .
Roelfsema, C. M., W. C. Dennison and S. R. Phinn (2002). "Spatial distribution of benthic microalgae on coral reefs determined by remote sensing." Coral Reefs 21(3): 264 - 274 .
Editor: Anne Holland
www .warringalpublications .com .au
Email: warringalpublications@edassist .com .au
Phone: (03) 8678 1118
Fax: (03) 8678 1118
PO Box 299, Richmond, VIC 3121