geographia polonica vol. 87 no. 1 (2014) : the spatial and...
TRANSCRIPT

Geographia PolonicaVolume 87, Issue 1, pp. 47-59http://dx.doi.org/10.7163/GPol.2014.3
INSTITUTE OF GEOGRAPHY AND SPATIAL ORGANIZATIONPOLISH ACADEMY OF SCIENCES
www.igipz.pan.pl
www.geographiapolonica.pl
Introduction
At a time when the world’s population is increasing, the opposite trend is observed in certain countries of both the developed and developing world as national and regional demographic potentials shrink. Causes of depopulation tend to be complex, but they typically involve: (1) economic factors of both a macro-scale, i.e. national economic devel-opment, and micro-scale involving individual decisions of people weighing the costs and
benefits of migration to improve their material position and the standard of living (Eberhardt 1989; Massey et al. 1993; Bayona-i-Carrasco & Gil-Alonso 2013); (2) social factors, includ-ing changes in the realm of social norms and value systems; (3) spatial factors, e.g. the place of residence at the centre vs. periph-ery and town vs. countryside, as well as the degree of access to social infrastructure; and (4) administrative factors, such as the elimination of formal barriers limiting mobil-ity. This selection of factors is dictated by
THE SPATIAL AND NATIONALITY ASPECTS OF DEPOPULATION IN THE EUROPEAN PART OF THE RUSSIAN FEDERATION
Rafał Wiśniewski
Institute of Geography and Spatial OrganizationPolish Academy of SciencesTwarda 51/55, 00-818 Warsaw: Polande-mail: [email protected]
AbstractThe paper introduces the results of a statistical analysis of two components of depopulation, movement through migration and the natural growth of population in the European part of the Russian Federation dur-ing the period 1990-2010. The analysis also involves a breakdown by nationality, which is seen to be a driver of quantitative change. A typology analysis is presented with consideration given to trends to demographic growth or decline. The outcome of an analysis via Webb’s typology indicates that depopulation occurs due to natural decline with an increasing role of migration as a driver of depopulation.
Key wordsdepopulation • natural growth and decline • migration • nationalities and ethnic relations • Webb's typology • Russian Federation
GP_2014_1.indb 47GP_2014_1.indb 47 2014-03-13 15:21:512014-03-13 15:21:51

48 Rafał Wiśniewski
Geographia Polonica 2014, 87, 1, pp. 47-59
a neoclassical theory of migration whereby migration is a necessary process between economically highly different areas (Lewis 1954). Such differences lead to international differences in the levels of income that deter-mine migratory movements (Todaro 1976) as one of two components of depopulation. Migratory decisions are also influenced by a number of complex conditions occur-ring both at the place of residence and in the potential target area (push and pull factors Lee (1966), including specifically the level of unemployment, education, family and social bonds and individual migratory behaviour1 (see: migratory behavioural theo-ries, such as Woods 1982). At the regional scale, historical circumstances may also contribute to a demographic decline. Cur-rent migratory movements in Russia are also influenced by historical decisions taken at the time of a centrally planned economy and by the policy of development in peripher-al areas (Russian North). According to some researchers, the depopulating peripheral areas of Russia are indeed overpopulated (e.g. Heleniak 2003; Spies 2009) which results in the scale of the migratory outflow. The quality of the natural environment can also contribute to depopulation (Burke 2000), especially in areas subjected to intensive human impact, such as the town of Norilsk.
The second component of depopulation processes is a natural change in the popu-lation. The demographic changes observed in the Russian Federation are typical of the second demographic transition, which involves changes to the family model, social norms and value system (van de Kaa 1987) that have an influence on reproductive behaviour. As value systems vary between cultural and religious circles it may be argued that the demographic change in the study area is determined by the nationality compo-sition of the territorial units analysed. Indeed, adverse demographic processes seem to be
1 This individual variability between migrants means that different migratory decisions may be taken in identical circumstances (Massey et al. 1993).
linked to large proportions of ethnic Russians in the overall composition of a given region and are counterbalanced by a non-Slavic population component, which tends to be in a better demographic condition.
Depopulation processes in the European part of the Russian Federation2 may lack the pace observed in the Asian part of the coun-try, but have a longer history (Bogdanova et al. 2001; Terenina 2004). Indeed, between 1990 and 2010 European part of Russia lost more than one million people (1.0%) while the Asian part of the Russian Federation lost more than 4.3 millions (10.3%). This dispro-portionate rate of depopulation in Siberia and in the Russian Far East has contributed to a shift of researchers’ focus away from the processes occurring in the European part of the country. However, bringing the spot-light back to this area seems important if only because European part of Russia is a target for migrations (both domestic and internation-al), its demographic processes display a high degree of spatial variability and the popula-tion change is bipolarised. For these reasons a study of these processes in the European part of Russia may prove very useful.
This attempt to capture depopulation pro-cesses in the European part of the Russian Federation has two main objectives:• to investigate spatial dependencies
between the rate of depopulation and the nationality breakdown in the regions;
• and to identify the main drivers respon-sible for the rate of this process at the regional scale.The paper uses official data from the Rus-
sian Federal State Statistics Service (Feder-alnaya sluzhba gosudarstvennoy statistiki) from general censuses and current records kept in the period 1990-2010, which is also the core study period. For the population change analysis by nationality the authors used census data from 1989, 2002 and 2010.
2 The regional-scale analysis includes the European part of Russia with its administrative units grouped into five federal districts: Northwestern, Central, Southern, North-Caucasian and the Volga District.
GP_2014_1.indb 48GP_2014_1.indb 48 2014-03-13 15:21:512014-03-13 15:21:51

49The spatial and nationality aspects of depopulation in the European…
Geographia Polonica 2014, 87, 1, pp. 47-59
Demographic changes in the European part of Russia
According to the 1989 census, the last gen-eral census of the Soviet Union era, the Euro-pean regions of Russia had a population of 85.0 million (Fig. 1). By the time of the next census in 2002, this population increased by more than 736.6 thousand. A closer analysis of the quantitative change suggests a great variability in the rates of depopula-tion depending on nationality. The number of Russians dropped by 2.28 millions despite large numbers of Russians immigrating from the recently independent former Soviet republics. During the same period, the popu-lation of other national groups increased by more than 3.0 million. These values illus-trate a deep demographic crisis of the eth-nic Russian population. Between 2002 and 2010, when another census was held, there were further significant quantitative changes, as the overall population in the European regions of the Russian Federation dropped by nearly 5.2 million. More than 55% of this reduction was due to the drop in the ethnic Russian population. This time, however, oth-er nationalities were also affected, except nationalities originating in the Caucasus Mountains and certain titular nations (e.g. Mordvins & Kalmyks). Across the entire study period, there has been a reduction in the
ethnic Russian population and an increase in other nationalities.
The European part of Russia accounts for nearly 75% of Russia’s population and this proportion has been steadily increasing (from 71.7% in 1990 to 73.7% in 2010). At the same time, the proportion of ethnic Russians in that part of the country has been falling (from 80.6% in 1989 to 79.0% in 2010). The more oth-er nationalities are represented in the popula-tion of a given region, the stronger is this trend, especially in the titular national republics.
The decrease in the population of Euro-pean part of Russia is explained by the natu-ral decrease observed since 1993 (Fig. 2). After the break-up of the Soviet Union, the birth rate fell dramatically while the mortal-ity rate increased. Between 1990 and 2000, the natural population growth rate dropped from 1.2‰ to -7.2‰. Within the same peri-od, the marriages’ indicator dropped (from 8.9/1000 inhabitants in 1990 to 6.1/1000 in 2000), while the number of divorces rose (from 3.7/100 inhabitants in 1990 to 4.2/1000 inhabitants in 2000). Demo-graphic growth is not helped by high rates of abortion (4.1 million abortions in 1990 and 1.1 million in 2010), which is regarded in Russia as the main method of birth con-trol. Indeed, at 67 abortions per 100 births. Russia remains the regional leader by a sig-nificant margin when compared with 31/100 in Belarus and 36/100 in the Ukraine (all in 2010) (Fig. 3) (Sakevich 2003; Denisov et al. 2012). This figure, however, is a consider-able improvement on the 170 abortions per 100 births recorded in the early 21st centu-ry, when the total fertility rate was below the replacement fertility level (Fig. 4).
After the deep demographic crisis of the first decade of the 21st century, the rate of decline of the Russian population slowed down. It is difficult to determine at this stage to what extent this effect, comprising a decrease in the negative rate of natural growth and a minor increase in immigration, is a result of such effects as demographic gaps and booms or a change in the standard of living in the Russian Federation.
0
20
40
60
80
100
120
1989 2002 2010
mln
Russians other nations total
Figure 1. Population changes by nationalities in the European part of the Russia
Source: Figures from 1 to 10 and Table 1 are based on the Russian Federal Statistics Service data.
GP_2014_1.indb 49GP_2014_1.indb 49 2014-03-13 15:21:512014-03-13 15:21:51

50 Rafał Wiśniewski
Geographia Polonica 2014, 87, 1, pp. 47-59
Regional breakdown of demographic change including the national component
The overall change in the population between 1990 and 2010 in the European part of Rus-sia fails to fully reflect the quantitative change seen at the regional level. The demographic potential of many administrative units fell
by more than 20% (Fig. 5) while the average for European part of Russia was -4.8%. The most spectacular growth was recorded in the Caucasian republics and in the city of Moscow. In the Caucasus this was a result of a high nat-ural growth rate, while in Moscow the increase in population came from migration.
The rate of change in the population across the study area follows a zonal pattern from the strongly depopulating northern regions to a high rate of demographic increase in the Caucasus Mountains with some islands of exception in between. The central section of the area is an interesting case due to the impact of the bipolar Moscow-St. Petersburg system.
-1 000
-800
-600
-400
-200
0
200
400
600
800
1 000
1990 1991 1992 1993 1994 1995 1996 1997 1998 1999 2000 2001 2002 2003 2004 2005 2006 2007 2008 2009 2010
total increase/decrease natural increase/decrease migration increase
Figure 2. Components of total population size changes in the European part of Russia (in thousands)
406080
100120140160180200
2002 2004 2006 2008 2010
Central Federal District Northwestern Federal District
Southern Federal District Volga Federal District
Russia
1.0
1.2
1.4
1.6
1.8
2.0
2.2
1990 1994 1998 2002 2006 2010
Central Federal District Northwestern Federal District
Southern Federal District Volga Federal District
Russia
Figure 3. Number of abortions per 100 births by federal districtsa of the European part of Russiab
a In 2009, a North-Caucasian Federal District was carved out of the Southern Federal District. On Figures 3 and 4 the 2010 data from the two units was aggregated.b The selection of the period (2000-2010) was determined by the availability of statistical data.
Figure 4. Total fertility rate by federal districts of the European part of Russia
GP_2014_1.indb 50GP_2014_1.indb 50 2014-03-13 15:21:512014-03-13 15:21:51

51The spatial and nationality aspects of depopulation in the European…
Geographia Polonica 2014, 87, 1, pp. 47-59
This spatial illustration of the population change in administrative units reflects the demographics of individual national groups. Between 1989 and 2010, the greatest increase in population, by nearly 575 thou-sand, occurred in the Armenian community (Fig. 6) concentrated predominantly in the Southern Federal District (mainly in Kras-
nodar Krai). During the same period, high rates of increase were observed among the national groups in the Caucasus Mountains despite the region’s political instability. This has led to decreasing shares of ethnic Rus-sians in the national structures at the region-al level, which was particularly strong in titu-lar republics with high rates of population growth (Tab. 1).
The migration component of depopulation in a regional breakdown
There are two distinct factors influencing the current patterns of migratory behaviour in the Russian Federation: the current eco-nomic changes and institutional decisions taken in the Soviet Union.
In terms of external migrations, an impor-tant role is played by networks linking Rus-sia and the former Soviet republics, which determine the rate and scale of the migra-tion process and influence the development of individual migration networks. Other link-ing factors include culture, primarily involving Belarus and the Ukraine, and language. For this reason, the main source area for migra-tions into Russia is the post-Soviet area, espe-cially Central Asia. In the years before 2012 Russia’s migration policy ignored a need to compensate for the effects of the demo-graphic crisis in various areas of the economy. It even led to a deepening of existing adverse phenomena, such as the fuelling of the grey zone with immigrants finding work, for exam-ple, in the little-regulated open-air markets. The new policy, introduced by President Putin in June 2012, presents immigration as a positive phenomenon that is desirable for the labour market and in the light of the depopulation of the Russian Federation. The policy introduces a range of improvements for foreigners, including registration with the authorities, employment and obtaining Rus-sian citizenship (FMS 2012). Any impact of this policy will depend on how it is implemented in this very corrupt country.
St. Petersburg
Moscow
200 400 km0
increase
decrease
>20%
10-20
0-10
<–20
–10-(–20)
0-(–10)
Figure 5. Percentage changes in the population in 1990-2010
-60 -40 -20 0 20 40 60 80 100 120 [%]
Armenians
Avars
Chechens
Bashkirs
Tatars
Russians
Chuvash
Mordvins
Ukrainians
Belorusians
Figure 6. Percentage changes in the population in the 10 most populous nationalities in European part of Russia (1989-2010)
GP_2014_1.indb 51GP_2014_1.indb 51 2014-03-13 15:21:512014-03-13 15:21:51

Table 1. Population change in selected titular republics
Administrative unit/nationalities
Depopulation by nationality
(1989-2010) [%]
Share of population in the administrative unit [%]
1989 2002 2010
Republic of KalmykiaKalmyk – 45.4 53.3 57.4Russians 60.7 37.7 33.6 30.2Dargwa 9.0 4.0 2.5 2.7Chechens 8.5 2.6 2.0 1.2Kazakhs 2.3 1.9 1.7 1.7Turkish – 0.0 1.1 1.3Other nationalities 19.5 8.4 5.8 5.5Republic of BashkortostanRussians 41.7 39.3 36.4 36.1Bashkirs – 21.9 29.8 29.5Tatars 40.2 28.4 24.2 25.4Chuvash 4.0 3.0 2.9 2.7Mari 0.8 2.7 2.6 2.6Ukrainians 12.7 1.9 1.3 1.0Other nationalities 0.6 2.8 2.8 2.7Mari El RepublicRussians 48.4 47.4 47.6 47.4Mari 38.5 43.3 43.1 43.9Tatars 6.3 5.9 6.0 5.8Chuvash 3.4 1.2 1.0 0.9Other nationalities 3.4 2.2 2.3 2.0Republic of MordoviaRussians 93.9 60.9 61.1 53.4Mordvins – 32.5 32.1 40.1Tatars 2.6 4.9 5.2 5.2Other nationalities 3.5 1.7 1.6 1.4Republic of TatarstanTatars – 48.5 52.9 53.2Russians 68.2 43.3 39.5 39.7Chuvash 16.6 3.7 3.3 3.1Other nationalities 15.2 4.5 4.2 4.0Udmurt RepublicRussians 23.5 58.9 60.2 62.2Udmurts 61.8 30.9 29.4 28.0Tatars 8.4 6.9 7.0 6.7Other nationalities 6.3 3.3 3.4 3.0Chuvash RepublicChuvash 68.5 67.8 67.9 67.7Russians 25.2 26.7 26.6 26.9Tatars 1.1 2.7 2.8 2.8Mordvins 4.2 1.3 1.2 1.1Other nationalities 1.0 1.5 1.5 1.5Republic of AdygeaRussians 74.4 68.0 64.6 63.6Adyghs – 22.1 24.3 25.2Armenians – 2.4 3.5 3.7Ukrainians 25.6 3.2 2.1 1.4Other nationalities – 4.3 5.5 6.1
GP_2014_1.indb 52GP_2014_1.indb 52 2014-03-13 15:21:532014-03-13 15:21:53
53The spatial and nationality aspects of depopulation in the European…
Geographia Polonica 2014, 87, 1, pp. 47-59
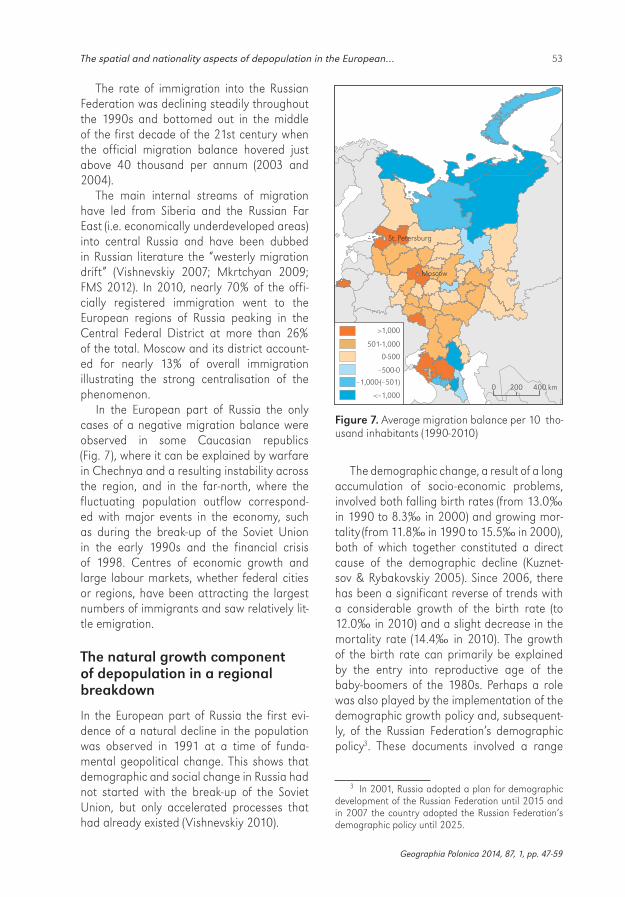
The rate of immigration into the Russian Federation was declining steadily throughout the 1990s and bottomed out in the middle of the first decade of the 21st century when the official migration balance hovered just above 40 thousand per annum (2003 and 2004).
The main internal streams of migration have led from Siberia and the Russian Far East (i.e. economically underdeveloped areas) into central Russia and have been dubbed in Russian literature the “westerly migration drift” (Vishnevskiy 2007; Mkrtchyan 2009; FMS 2012). In 2010, nearly 70% of the offi-cially registered immigration went to the European regions of Russia peaking in the Central Federal District at more than 26% of the total. Moscow and its district account-ed for nearly 13% of overall immigration illustrating the strong centralisation of the phenomenon.
In the European part of Russia the only cases of a negative migration balance were observed in some Caucasian republics (Fig. 7), where it can be explained by warfare in Chechnya and a resulting instability across the region, and in the far-north, where the fluctuating population outflow correspond-ed with major events in the economy, such as during the break-up of the Soviet Union in the early 1990s and the financial crisis of 1998. Centres of economic growth and large labour markets, whether federal cities or regions, have been attracting the largest numbers of immigrants and saw relatively lit-tle emigration.
The natural growth component of depopulation in a regional breakdown
In the European part of Russia the first evi-dence of a natural decline in the population was observed in 1991 at a time of funda-mental geopolitical change. This shows that demographic and social change in Russia had not started with the break-up of the Soviet Union, but only accelerated processes that had already existed (Vishnevskiy 2010).
St. Petersburg
Moscow
>1,000
501-1,000
0-500
<–1,000
–1,000-(–501)
–500-0
200 400 km0
Figure 7. Average migration balance per 10 tho-usand inhabitants (1990-2010)
The demographic change, a result of a long accumulation of socio-economic problems, involved both falling birth rates (from 13.0‰ in 1990 to 8.3‰ in 2000) and growing mor-tality (from 11.8‰ in 1990 to 15.5‰ in 2000), both of which together constituted a direct cause of the demographic decline (Kuznet-sov & Rybakovskiy 2005). Since 2006, there has been a significant reverse of trends with a considerable growth of the birth rate (to 12.0‰ in 2010) and a slight decrease in the mortality rate (14.4‰ in 2010). The growth of the birth rate can primarily be explained by the entry into reproductive age of the baby-boomers of the 1980s. Perhaps a role was also played by the implementation of the demographic growth policy and, subsequent-ly, of the Russian Federation’s demographic policy3. These documents involved a range
3 In 2001, Russia adopted a plan for demographic development of the Russian Federation until 2015 and in 2007 the country adopted the Russian Federation’s demographic policy until 2025.
GP_2014_1.indb 53GP_2014_1.indb 53 2014-03-13 15:21:532014-03-13 15:21:53

54 Rafał Wiśniewski
Geographia Polonica 2014, 87, 1, pp. 47-59
of solutions intended to increase the fertility rate and material support for families4.
The net natural growth ratios are spatially highly variable, which is largely due to the varied nationality structures in the respec-tive administrative units. (Generally, the greater the component of titular nationalities in a population, the higher the natural growth or lesser the natural decline).
A central Russian (or more broadly Slavic) core in the centre of the study area is charac-terised by a significant natural decline in the population, while hot spots of dynamic natu-ral growth are found in the Eastern Caucasus Mountains (Fig. 8). To the east of the core area there is a transitional area consisting largely of the titular republics. In their case, the large natural decline among Slavic nations is com-pensated to a high extent by high natural growth among the titular nations.
Typology of change in demographic potential over the period 1990-2010
An application of a typological and spa-tial framework to population change allows the territorial variability of demographic structures to be identified. For this purpose the authors selected a typology proposed by Webb (1963), which defined relationships between the natural change and migratory change components of population change. Application of this typology did not simply allow the population status in a given year to be determined, but it also enabled longer-term demographic trends (1990-2010) to be identified.
In 1990, a majority of the units in this study showed a growth in population (types A, B, C, D, including the whole Russian Federation as type C), which was primar-
4 In 2007, Russia adopted a system of material support for families with children based on the Ma-ternity (Family) Capital Law. The state pays a one-off benefit of 343,378 roubles, or ca. 8200 euros, for each second and subsequent child born to a family (Pension fund of the Russian Federation, http://www.pfrf.ru/fam-ily_capital/).
ily accounted for by high natural growth (Fig. 9A). Cases with net depopulation were found not just in the peripheries, but most importantly also in the Central Federal Dis-trict, a relatively economically prosperous area with a dominance of the Russian ethnos. The overall decline in population was mainly the result of a negative natural growth (i.e. decline), which was much greater than the migratory inflow.
200 400 km0
St. Petersburg
Moscow
people>5‰
0-5
–5-0
<–10
–10-(–5)
Figure 8. Average natural growth or decline in 1990-2010
The subsequent decade brought a huge demographic transformation. Russia has changed from a country with a relatively high rate of population growth (by nearly 800 thousand in 1990 and 343.1 thou-sand in European part of Russia) into one affected by strong depopulation processes (a real decline in the number of inhabitants of more than 700 thousand in 2000, includ-ing 534.2 thousand in European part of Rus-sia), which are observed in nearly all admin-istrative units of the study area (Fig. 9B). The negative change was primarily accounted for by a high rate of natural decline, mainly
GP_2014_1.indb 54GP_2014_1.indb 54 2014-03-13 15:21:542014-03-13 15:21:54

The spatial and nationality aspects of depopulation in the European. 55
Geographia Polonica 2014, 87, 1, pp. 47-59
Figure 9. Webb's typology of European pa r t of Russia
Data not availabli

56 Rafał Wiśniewski
Geographia Polonica 2014, 87, 1, pp. 47-59
among Slavic nations, which exceeded migra-tory growth (type E) several times over (up to more than ten times in certain cases). Units representing types F and G – the Arkhangelsk Oblast5 and the Murmansk Oblast as well as the Komi Republic) found themselves in the deepest demographic depression, as both of the components of demographic change were negative. Population growth was only recorded in four administrative units: Dag-estan, due to a high rate of natural growth (type A), and Moscow, Belgorod Oblast and the North-Ossetian Republic – all three due to migration. Moscow and Belgorod Oblast may have attracted migration due to the strong economy of the country’s capital (Mos-cow) and extensive and successful manufac-turing and mining industries (Belgorod)6.
5 According to the Constitution of Russia of 2008, the Russian Federation is made up of 83 federal sub-jects (constituent entities). These are inter alia oblasts (provinces), republics, krais (territories), autonomous okrugs (districts) and federal cities.
6 The real growth of the population in the Belgorod Oblast comes from the city itself and from its raion,
According to the national census of 2010, Russia remains a country with a real popu-lation decline, but the rate of the process is not as high as before (population decline of 81.5 thousand, including 66.9 thousand in European Russia).
While the typology carried out for the year 2000 revealed an overall negative picture of the country’s demographic situation, the latest census data suggest a mosaic nature of the depopulation problem (Fig. 9C). There was a considerable decrease in the migra-tory deficit and a positive balance of natural growth. Administrative units characterised by growing types of population fell into two groups. The first involved titular republics (mainly Caucasian) with high natural growth rates (primarily among non-Slavic nations)
which is the immediate administrative district, where the rate of population increase was very fast. The econ-omy of the oblast and its attractiveness to potential mi-grants is tied to rich iron ores within the famous Kursk magnetic anomaly. The example of the Belgorod Oblast suggests that depopulation phenomena vary greatly at a local scale and this would call for further research to focus at this level.
Table 2. Changes in Webb’s types in 1990-2010
Type no. Type name Description
Units per type
Spatial, national and economic profile
I Growth Depletion of population at the onset of the period (E, F, G, H) followed by an increase (A, B, C, D), e.g. E A
2 • Peripheral areas with unfavourable environmental conditions
• Large cities• Good economic condition
II Depopulating Growth of population at the onset of the period (A, B, C, D) followed by depletion (E, F, G, H), e.g. D H
31 • Russian domination in nationality structure
• Peripheral and central location• Spatial impact of poles of growth
III Stagnant with growth tendency
1. No change in types describing real population growth (A, B, C, D), e.g. A A
2. Change occurred in types describ-ing real population growth (A, B, C, D), e.g. A B
12 • Large proportion of titular nations• Large cities – poles of economic
growth• Peripheral areas with poor eco-
nomic condition
IV Stagnant with depopulating tendency
1. No change in types describing real population decline (E, F, G, H), e.g. E E
2. Change occurred in types describ-ing real population decline (E, F, G, H), e.g. E F
10 • Predominantly central location• Russian domination in nationality
structure
GP_2014_1.indb 56GP_2014_1.indb 56 2014-03-13 15:21:592014-03-13 15:21:59
57The spatial and nationality aspects of depopulation in the European…
Geographia Polonica 2014, 87, 1, pp. 47-59
that either far exceed any migration deficit or coincided with a positive migration bal-ance. The other group (type D) includes areas that are mainly economically prosperous (Moscow (city and oblast), St. Petersburg, Kali-ningrad Oblast, Belgorod Oblast and Kras-nodar Krai, the last of them known for being the country’s granary and for the extensive construction programme ahead of the 2014 Winter Olympic Games in the local town of Sochi).
The Webb typology analysis shows a gradual shift in the role of the depopulation components, especially during the last dec-ade of the study period (2000-2010). While in 2000 the depopulation effect was due to natural decline in a majority of the admin-istrative units affected, by 2010 migration outflow had gained in significance.
The various types were grouped to pro-vide a generalised picture and identify trends in demographic change (Tab. 2).
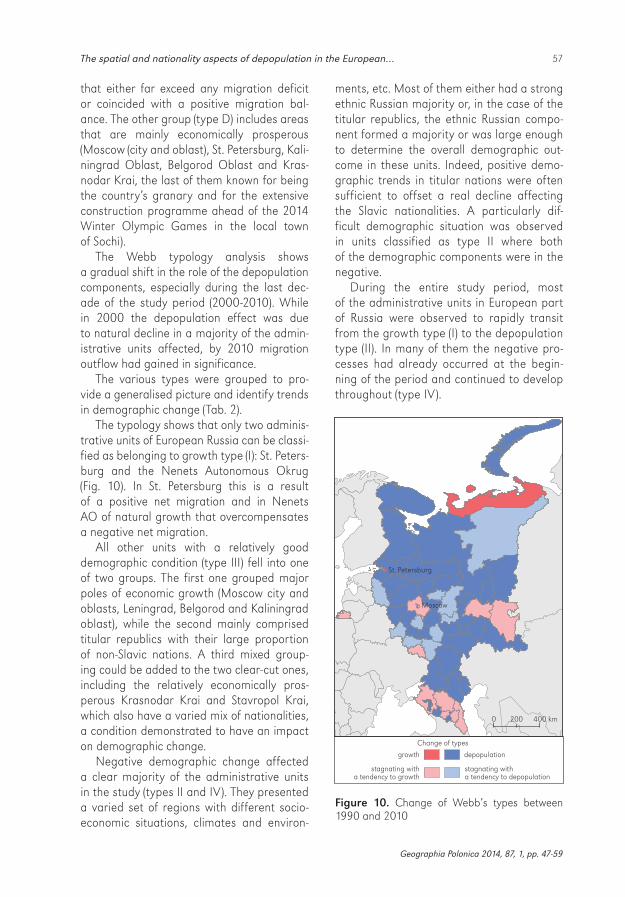
The typology shows that only two adminis-trative units of European Russia can be classi-fied as belonging to growth type (I): St. Peters-burg and the Nenets Autonomous Okrug (Fig. 10). In St. Petersburg this is a result of a positive net migration and in Nenets AO of natural growth that overcompensates a negative net migration.
All other units with a relatively good demographic condition (type III) fell into one of two groups. The first one grouped major poles of economic growth (Moscow city and oblasts, Leningrad, Belgorod and Kaliningrad oblast), while the second mainly comprised titular republics with their large proportion of non-Slavic nations. A third mixed group-ing could be added to the two clear-cut ones, including the relatively economically pros-perous Krasnodar Krai and Stavropol Krai, which also have a varied mix of nationalities, a condition demonstrated to have an impact on demographic change.
Negative demographic change affected a clear majority of the administrative units in the study (types II and IV). They presented a varied set of regions with different socio-economic situations, climates and environ-
ments, etc. Most of them either had a strong ethnic Russian majority or, in the case of the titular republics, the ethnic Russian compo-nent formed a majority or was large enough to determine the overall demographic out-come in these units. Indeed, positive demo-graphic trends in titular nations were often sufficient to offset a real decline affecting the Slavic nationalities. A particularly dif-ficult demographic situation was observed in units classified as type II where both of the demographic components were in the negative.
During the entire study period, most of the administrative units in European part of Russia were observed to rapidly transit from the growth type (I) to the depopulation type (II). In many of them the negative pro-cesses had already occurred at the begin-ning of the period and continued to develop throughout (type IV).
St. Petersburg
Moscow
stagnating witha tendency to growth
growth
Change of types
depopulation
stagnating with a tendency to depopulation
200 400 km0
Figure 10. Change of Webb’s types between 1990 and 2010
GP_2014_1.indb 57GP_2014_1.indb 57 2014-03-13 15:21:592014-03-13 15:21:59

58 Rafał Wiśniewski
Geographia Polonica 2014, 87, 1, pp. 47-59
Conclusions
The depopulation processes observed in European part of Russia are highly variable spatially. While the demographic structures are strongly affected in some areas leading to a sustained depletion of their demographic potential, others experience dynamic popula-tion growth.
The depopulation processes observed are a result of a combination of factors, including net migration outflow, falling fer-tility rates and high abortion and mortality rates, which lead to a natural demographic decrease, which is the main driver of depopu-lation in European part of Russia. Adverse demographic processes primarily affect Slavic nationalities, while non-Slavic nation-alities tend to increase in number, primar-ily due to their high rate of natural growth. In some titular republics this pattern leads to an overall population increase, while their internal nationality structures are affected with a shrinking proportion of ethnic Russians and other Slavic nations, mainly Ukrainians and Belarusians. Other titular republics also experience an overall population decline, which in most cases is explained by the same adverse trends among ethnic Russians, whose share of the local nationality mix is steadily reducing.
Migration is playing an increasingly important role in the depopulation process. It primarily affects administrative units with adverse climatic and environmental condi-tions, while the target areas include Moscow with its oblast, St. Petersburg and other large cities of European part of Russia.
The occurrence and rates of depopulation processes display a strong link with the local structure of nationalities, with their men-talities, world-views, attitudes and priorities (both individual and societal), which were established during the course of their his-torical development and which have an influ-ence on reproductive behaviour. Indeed, those very few ethnically uniform Russian regions that recorded population growth owed it exclusively to high migration inflows
that overcompensated for the natural popu-lation decline.
In Russia, depopulation not only affects peripheral areas, but also areas located cen-trally between poles of growth. In these latter areas the depopulation rates may be lower than in the former, but the processes started much earlier. This is explained by the closer proximity of migration targets offering eco-nomic and other types of opportunity for individuals. Poles of growth therefore have an adverse impact on change in the demo-graphic structures of areas within their reach.
The analysis of the change in Webb’s typology has shown that demographic change in European part of Russia contin-ues to have an adverse character, as most of the units analysed displayed sustained depopulation trends. Only very few adminis-trative units recorded demographic growth. There is also a structural shift between the drivers of these processes, as migration has an increased impact on the overall depopu-lation process.
A great deal of variation in the size of Rus-sia’s administrative units leads to a certain degree of analytical simplification. For this reason it would be desirable to conduct a demographic analysis at the raion level, which corresponds to a NUTS 4 analysis in the European Union. In this way depopula-tion could be studied at a local level by identi-fying depressed and growth regions. Besides spatial variability it would seem useful to also research depopulation in terms of the qualita-tive change of demographic structures.
Editors’ note:Unless otherwise stated, the sources of tables and fig-ures are the author(s), on the basis of their own research.
GP_2014_1.indb 58GP_2014_1.indb 58 2014-03-13 15:22:002014-03-13 15:22:00

© Rafał Wiśniewski© Geographia Polonica© Institute of Geography and Spatial Organization
Polish Academy of Sciences • Warsaw • 2014
Article first received • July 2013Article accepted • October 2013
59The spatial and nationality aspects of depopulation in the European…
ReferencesBAYONA-I-CARRASCO J., GIL-ALONSO F., 2013. Is for-
eign immigration the solution to rural depopula-tion? The case of Catalonia (1996–2009). Socio-logia Ruralis, vol. 53, no. 1, pp. 26-51.
BOGDANOVA L.P., TKACHENKO A.A., SHCHUKI-NA A.S., 2001. Demograficheskoe razvitie tverskogo regiona. Tver: Izdatel’stvo tverskogo gosudarstvennogo universiteta, 64 pp.
BURKE J., 2000. Internal migration: A civil society challenge. [in:] M.G. Field, J.L. Twigg (eds.), Rus-sia’s torn safety nets: Health and social welfare during the transition, New York: St. Martin’s Press, pp. 213-230.
DENISOV B.P., SAKEVICH V.I., JASILIONIENE A., 2012. Divergent trends in abortion and birth control practices in Belarus, Russia and Ukraine. PLoS ONE, vol. 7(11): e49986.
EBERHARDT P., 1989. Regiony wyludniające się w Pol-sce. Prace Geograficzne, no. 148, Warszawa--Wrocław: Instytut Geografii i Przestrzennego Zagospodarowania PAN, Ossolineum, 141 pp.
FMS, 2012. Kontseptsiya gosudarstvennoy migrat-sionnoy politiki Rossiyskoy Federatsii na period do 2025 goda. Federal’naya migratsionnaya slu-zhba, http://www.fms.gov.ru/law/868/details/53252/ [17 January 2014].
HELENIAK T., 2003. Geographic aspects of popu-lation aging in the Russian Federation. Eura-sian Geography and Economics, vol. 44, no. 5, pp. 345-367.
KUZNETSOV V.N., RYBAKOVSKIY L.L. (eds.), 2005. Strategiya demograficheskogo razvitiya Rossii. Moscow: Rossiyskaya akademiya nauk. Institut sotsial’no-politicheskikh issledovaniy, 208 pp.
LEE E.S., 1966. A theory of migration. Demogra-phy, vol. 3, no. 1, pp. 47-57.
LEWIS W.A., 1954. Economic development with unlimited supplies of labour. The Manchester School, vol. 22, no. 3, pp. 139-191.
MASSEY D.S., ARANGO J., HUGO G., KOUAOU-CI A., PELLEGRINO A., TAYLOR J.E., 1993. Theo-ries of international migration: A review and appraisal. Population and Development Review, vol. 19, no. 3, pp. 431-467.
MKRTCHYAN N.V., 2009. Vnutrennyaya migratsiya: velikoye proshloye i skromnoye budushcheye. [in:] A.G. Vishnevskiy, S. Bobylev (eds.), Doklad o raz-vitii chelovecheskogo potentsiala v Rossiyskoy Federatsii 2008. Rossiya pered litsom demogra-ficheskikh vyzovov, Moscow: UNDP, pp. 80-96.
SAKEVICH V.I., 2003. Abort ili kontratseptsiya: chto vybirayut rossiyskiye zhenshchiny? Demo-scope Weekly, no. 123-124, http://demoscope.ru/weekly/2003/0123/index.php. [17 January 2014].
SPIES M., 2009. Potentials for migration and mobil-ity among oil workers in the Russian North. Geografiska Annaler: Series B. Human Geogra-phy, vol. 91, no. 3, pp. 257-273.
TERENINA N.K., 2004. Osobennosti razvitiya depop-ulyatsionnykh protsessov v zone aktivnogo vliyaniya stolichnykh tsentrov – Moskvy i Sankt-Peterburga. Sankt-Peterburg: disserCat – elek-tronnaya biblioteka dissertatsii, 172 pp., http://www.dissercat.com/content/osobennosti-raz-vitiya-depopulyatsionnykh-protsessov-v-zone-ak-tivnogo-vliyaniya-stolichnykh-t [17 January 2014].
TODARO M.P., 1976. Internal migration in devel-oping countries. Geneva: International Labour Office, 106 pp.
VAN DE KAA D.J., 1987. Europe’s second demo-graphic transition. Population Bulletin, vol. 42, no. 1, Washington: The Population Reference Bureau, 59 pp.
VISHNEVSKIY A.G., 2007. Naseleniye Rossii 2005: Trinadtsatyy yezhegodnyy demograficheskiy doklad. Moscow: Institut demografii Gosudarst-vennogo universiteta Vysshey shkoly ekonomiki, 245 pp.
VISHNEVSKIY A.G., 2010. Sberezhenie naroda ili depopulyatsiya Rossii? Moscow: Izdatel’skiy dom Gosudarstvennogo universiteta Vysshey shkoly ekonomiki, 81 pp.
WEBB J.W., 1963. The natural and migrational components of population changes in England and Wales, 1921-1931. Economic Geography, vol. 39, no. 2, pp. 130-148.
WOODS R., 1982. Theoretical population geogra-phy. London-New York: Longman, 220 pp.
GP_2014_1.indb 59GP_2014_1.indb 59 2014-03-13 15:22:002014-03-13 15:22:00

GP_2014_1.indb 60GP_2014_1.indb 60 2014-03-13 15:22:002014-03-13 15:22:00
http://rcin.org.pl