geography and disparity in health - national academies of...
TRANSCRIPT

1
Geography and Disparity in Health Task: To provide guidance on how best to assess the impact of geographic location on: health
care access; health care service utilization; and health care quality.
Thomas C. Ricketts, Ph.D., M.P.H.
(with the assistance of Erin Kobetz, M.P.H. and Laurie Goldsmith, M.S.)
Cecil G. Sheps Center for Health Services Research
University of North Carolina at Chapel Hill
725 Airport Road, CBN 7590
Chapel Hill, NC 27599-7590
919-966-5541
Draft: Wednesday, March 13, 2002
This paper briefly describes how health status, access to health care and health outcomes vary by
geographic location and which aspects of location appear most to affect health care access,
services, and utilization. A key to measurement of differences in health is the unit of analysis:
the geographic unit that is used; and the paper describes the many potential geographies that can
be used for analysis and policy making. One of the goals of the paper is to develop evidence to
suggest a preferred geography to illuminate disparities as well as help structure policies to
eliminate those disparities. However, one leading researcher examining the relationship between
place and health has observed that:
“…there is no agreement about how to best define a geographical area in terms of
socioeconomic position or about which area-based measures of socioeconomic position
are most informative, especially across multiple kinds of health outcomes (Krieger
2001).
This paper does not contradict that conclusion but does recognize that there are options for
understanding the geography of health disparities as well as for implementing solutions in places.
One real problems that confronts those who would wish to understand better where and how
disparities in care emerge and how to eliminate them is the way we geographically structure data
to monitor our health and health system. The current small area geographies used most often to

2
depict health status—census geography including tracts and block groups, counties, ZIP code
areas clusters of ZIP codes—are appropriate to identify and verify health status disparities. But
the level of intervention appropriate to specific causes is not captured well by those boundaries.
While we may identify that a neighborhood’s relative health status is reflected in a comparison
among ZIP areas or census tracts, it is not easy to mobilize an intervention based on those
boundary sets. People do not feel a sense of “membership” or citizenship to such an area and
neither government not the health care system is structured to act at that level. Town, city and
county boundaries may create more of a sense of community, but they often mask disparities and
differences between groups and neighborhoods. There is no uniform geography for interventions,
no standardized health districting, and there may never be unless community groups take
responsibility for health and they are given support and authority by governments.
LOCATION AND HEALTH
Geographic disparities in health have been noted down through history; indeed “place” was long
considered more a determinant of health than vectors or micro-organisms. The rise of “specific
etiology” in theories of health displaced concern with the ecology of health (Meade and
Earickson 2000) until the emergence of a broader concern with the interaction of the physical
environment and health (Dubos 1961). That has been followed by a more general definition of
human ecology to include social structures and economic processes in a field sometimes termed
“social epidemiology” (Berkman and Kawachi 2000). We now seek to explain differences in
health through the interaction of theories of genetics, biology, sociology, economics and politics
accepting that a person’s surroundings and opportunities affect how well and how long they live.
Researchers have found areal or contextual differences in health that persist when carefully
controlled (Macintyre and Ellaway 2000) and see the need to develop our knowledge of the
ecology of health as a way to leverage improvements in population health. Clearly, the
distribution of disease and illness is closely linked to geography. Vector borne disease are more
evident in warmers areas and the effects of exposure and inactivity prevail in colder climates.
Travel between the two may increase risks, the high recent incidence of skin cancer among
Scandinavian populations is linked to their ability to vacation in sunnier southern European
countries for brief intensive exposure to sunlight (Holland 1988). There are certain aspects of
the built environment that create health risks. In the U.S. patterns of infection for syphilis and

3
HIV has been linked to locations of Interstate highways (Cook et al. 1999). There is evidence
that the location of outlets for alcohol and cigarettes affects life chances (Voorhees et al. 1997).
This recent sense of awareness of the geographic context of health has developed in parallel with
an explicit concern with geographic variations in health care, health status and health outcomes
that emerged from a medical perspective in the work of John Wennberg (Wennberg and
Gittelsohn 1973) which continues to motivate policy-making to improve the quality and
distribution of health care resources (Wennberg, Fisher, and Skinner 2002). However, these
associations have used various geographies to identify associations and suggest causal pathways.
The comparisons that have been made to identify disparities in health care use, costs, and health
status have depended upon the bounding of populations by geography as much as by other
factors including race, ethnicity, income and employment. The factors that drive disparities
often define them in a geographic sense; that is, we tend to speak of “low-income
neighborhoods,” or “minority communities” as the defining characteristic of the place. This is a
central problem that arises when examining disparities: How much does place determine health
chances and how much does the definition of the place determine the eventual health chances of
its population?
GEOGRAPHY
Geography is often thought of as the generation and interpretation of maps that describe the
physical world. Geography is far more than that, but the physical description of boundaries has a
great deal to do with how we view communities and how we construct society (Giddens 1984).
The physical aspects of a community are usually defined by boundaries that may have been
developed for a specific public purpose but which often create gradients that separate one
population group from another. This can be apparent in zoning rules or in the creation of
jurisdictions that have different systems of social support. Areas can also become different
through social and economic processes that create regions or communities whose boundaries are
essentially invisible; even the places themselves become invisible in a cartographic sense. They
can be “disappeared” like the parts of Atlanta that were not included on the maps distributed to
visitors to the 1996 Olympic Games. The Atlanta example was described by Tom Wolfe in A

4
Man in Full in the chapter entitled "The Lay of the Land" where the key characters ride through
various neighborhoods of Atlanta and the commentary traces the transitions from rich to poor
and visibility to invisibility (Wolfe 1999). The travelers learn to see the way the buildings reflect
the underlying social structure and how the lay of the land both reflects and creates the life
chances available to the people who live in those places. This kind of "landscape interpretation"
filled with social perception and interpretation and sensitivity to the meaning of the buildings and
space and human activity is an important part of the sub-discipline of human geography. In
contrast, when speaking of health, the domain of medical geography is most often invoked.
Medical geography, however, is more aligned with the study of disease and disease diffusion
without explicit consideration of other aspects of human interaction. The structure of health
services and how people use health services in ways that reflect and create disparities spans the
human and the medical parts of geography. The discourse of the geographer involved in
describing health care delivery and health status has become controversial within the discipline
itself. While space and place in health care delivery are important, their structure and
interpretation are, to some, either irrelevant to practical decision making because they are the
result of overwhelming social forces and power relationships, while, to others, a spatial and
landscape-regarding point of view can be useful locally and in broader policy development
(Mohan 1998). Nevertheless, the power of geographic comparisons and boundary setting are
real in the policy world and the application of policy is very sensitive to location and scale. This
paper describes how the geographic structure of society, health services, and policy making can
best interact to diminish health disparities.
The physical, map-related parts of geography are often thought of when considering health care
issues—where to locate an ambulance service? How to determine hospital markets to test for
competitive effects? Studies of the relationship of place to health are as old as the works of
Hippocrates (“On Airs, Waters, and Places”) and have dwelt more on the relationship between
environment and health. The effective use of geography in changing health policy is usually
traced to the mapping work done by John Snow as he explored the relationship between drinking
waters sources and cases of cholera (Snow 1936). The disease mapping did not become the
universal solution for public health but, over time, geography has had an important part in the
health policy process. In the United States geography has played a key role in the creation of

5
regions and divisions of states and sub-state areas for the purposes of planning and
regionalization (Florin et al. 1994).
There is no consensus fundamental unit of geography on which health and health care is
measured in the United States or elsewhere. There are many reasons for this including the
problems of relating individual events to population rates, but most importantly because of the
way in which health data are reported (Meade and Earickson 2000). Data are compiled
according to the political and administrative organization of governments and, to a lesser extent,
society. Denominators in rates are most often expressed as the population of some political unit;
a state, for example. It would be more clinically useful to express rates in terms of gender and
age, even occupation, since those relate more directly to the delivery of health care, to health
status and to outcomes since they more accurately characterize the individual. Rates based on
geographic denominators such as counties, census block groups, states, or urbanized areas, are
developed for collective reasons, usually to address the public health responsibilities of a
government or as a social indicator. Between the clinical and the political denominators lie rates
and indictors that reflect the community context and how to change the health and the health
services people receive. Again, no gold standard exists for expressing the degree of need in a
community nor at what scale to address those needs (Ricketts 2001; O'Keeffe, Lohr, and Brody
2001).
The geographic expression of measures of disparity ideally would reflect a level of aggregation
where those disparities could be reduced. Current policy emphasizes targeting “communities”
for interventions to improve health and reduce disparities (Dorch, Bailey, and Stoto 1997).
Community is, however, not treated with special attention in geography. The Dictionary of
Human Geography defines it as: “A social network of interacting individuals, usually
concentrated into a defined territory. The term is widely used in a range of both academic and
vernacular contexts generating a large number of separate (often implicit) definitions.”
Likewise, no special attributes are ascribed in the specific field of medical geography. Meade
and Earickson simply contrast the “British” usage as an interacting subgroup of the population
rather than the U.S. meaning of a place in which people interact.” (Meade and Earickson 2000, p.
291) The Robert Wood Johnson Foundation recently commissioned papers to explore the

6
appropriate geographic definition of a community that would allow the optimization of programs
to improve population health. The final recommendations of the contractor to the Foundation
were that:
Community is a difficult concept to work with empirically and it has many, often
overlapping, sometimes competing, definitions. Little consensus exists about boundaries
or membership either in a general sense or in the context of measuring capacity for
improving population health, or measuring a community’s performance with regard to
specific health status indicators. Race, income, sexual orientation, geography, and
service areas, inter alia, are all viewed as valid parameters for defining a community.
(O'Keeffe, Lohr, and Brody 2001)
The relationship between socio-economic characteristics and health in small areas has been
described and validated in multiple studies at the census block group, census tract and ZIP code
levels (Krieger, Williams, and Moss 1997; Krieger 1992; Kwok and Yankaskas 2001). The field
of “small area analysis” has amply demonstrated that variations can be found, but the
determination of what are unacceptable variations remains open especially for the investigation
of health services and access to health care (Stano 1991; Diehr et al. 1990; Diehr et al. 1992).
The Rural-Urban Continuum and Disparities One view of the geographic structure of the nation contrasts how the population is distributed
between cities and rural areas. The United States has developed from agrarian roots to an
urbanized industrial nation with vast stretches of land devoted to agriculture, recreation or
preserved as wilderness or parks. There are more than 60 million people classified by the
Census Bureau as “rural” (living in a place of fewer than 2,500 people) and 55 million living in
“nonmetropolitan” counties in 2000. This is a population group comparable in size to the United
Kingdom. Rural America would be among the top 20 nations in population. The structure of the
Congress which gives equal representation to states in the Senate, means that the rural issues that
are important in the sparsely populated western states including Idaho, Wyoming, Montana,
North and South Dakota, are given careful consideration in Congress. The political as well as
physical geography of the U.S. makes rurality an important concept.

7
The two most common designations of rurality used in describing populations are those of the
US Bureau of the Census and the US Office of Management and Budget (OMB). Persons are
classified as living in “urbanized areas” which are defined by the Census Bureau according to a
complex set of characteristics which take into consideration the economic nature of a place,
transportation patterns as well as how many people are living in a fixed area. That definition is
undergoing revision and a final rule is expected to be published before July 1, 2002 For the 2000
Census, rural areas are considered places outside urbanized areas which are defined as made up
of: “…core census block groups or blocks that have a population density of at least 1,000 people
per square mile and surrounding census blocks that have an overall density of at least 500 people
per square mile.” (www.census.gov/geo/www/ua/ua_2k.html) This delineation has not been
used often to determine effects on health and health care. More often the OMB Metropolitan-
Nonmetropolitan classification of counties is used for comparisons.
The OMB designation classifies counties Metropolitan or Nonmetropolitan, based on
whether the county has a large city and suburbs as well as a functional element which measures
how economically integrated peripheral counties are with their surrounding Metropolitan
counties. A Metropolitan Area (MA) must contain either a place with a population of at least
50,000 or a Census-defined urbanized area and a total MA population of at least 100,000 or
reflect the economic activities of such a place. Various attempts to sub-classify the counties
within the Metropolitan and Nonmetropolitan categories exist and they have been used to
examine health care resource use and distribution and health status. In 2001 the National Center
for health statistics included a rural-urban comparison in their Healthy People series. The NCHS
report found:
The Americans who generally fare best on the Health indicators are residents of fringe
counties of large metro areas …many measures of health, health care use and health care
resources vary by Urbanization level … the data reconfirm the existence of regional
variation..
Nationally, residents of the most rural counties have the highest death rates for children
and young adults, the highest death rates for unintentional and motor vehicle traffic
related injuries, and, among men, the highest mortality for ischemic heart disease and

8
suicide. (Eberhardt et al. 2001)
That comparison, while troubling, did not compel an immediate response on the part of the
administration and did not dispel the observations made by some researchers that, when
compared to urban, rural populations do not show an overall disadvantage for rural places
(Miller, Farmer, and Clarke 1994). But these general comparisons are plagued by the problem of
aggregation of widely divergent nonmetropolitan populations and communities into large, gross
classifications that are meant to be consistent across the nation. There are clear regional patterns
of rural disadvantage—much higher infant mortality in the rural southeast, for example, and
those conditions are clearly related to the income and education differences between those rural
regions and other parts of the nation. Geographic patterns of morbidity and mortality vary by
race and ethnicity (Albrecht, Clarke, and Miller 1998) and these differences are sometimes
reinforced by rural location; blacks and whites living in nonmetropolitan counties have higher
death rates from diabetes (Ricketts 2001) and heart disease (Slifkin, Goldsmith, and Ricketts
2000). The ecological interaction of income and health has been widely reported (Kawachi et al.
1997) with a clear and consistent relationship shown to exist between the two—the lower the
income of the place, the worse the health chances. The same has been found with income
inequality but with less convincing evidence (Mellor and Milyo 2001). However, when
examining income inequality and health at the state level, one study found an interesting stronger
relationship between inequality and self-reported health for nonmetropolitan residents (Blakely,
Lochner, and Kawachi 2002). That finding suggest that the structure of income inequality differs
for rural areas, but it also might be an artifact of the clustering of respondents in nonmetropolitan
counties.
Access to Care Access to health care services in rural versus urban areas has been explored by health services
researchers for decades. Rural residents are, on average, poorer, older, and, for those under age
65, less insured than persons living in urban areas (American College of Physicians 1995;
Hartley, Quam, and Lurie 1994; Braden and Beauregard 1994; Schur and Franco 1999). Rural
Americans also report more chronic conditions and describe themselves in poorer health than
urban residents. Further, injury-related mortality and the number of days of restricted activity

9
are higher in nonmetropolitan areas. The degree to which lower levels of access affect health
outcomes and utilization for rural persons is at issue, however, given the conclusions drawn by
the MedPAC June 2001 Report to Congress. Their examination of the 1999 Access to Care files
of the Medicare Current Beneficiary Survey data found that Medicare beneficiaries living in the
most rural counties reported difficulty in seeing a doctor and lack of a usual source of care more
often that urban or other rural beneficiaries (MedPAC 2001). This analysis used the Urban
Influence Codes to classify nonmetropolitan counties (Ghelfi and Parker 1997), identifying
counties that were not adjacent to metro counties and which did not have a central town of
10,000 or more population as the most rural group. The MedPAC report concluded and stated in
its Executive Summary that there was no difference in the overall access to care for rural and
urban Medicare beneficiaries. They did, however, comment that there may be some underserved
areas where Medicare beneficiaries might be more vulnerable. The flat assertion that there was
no access gap is easily challengeable, the analysis did not always include controls for health
status, and when it did the risk adjustment for prior use may have made the analyses inaccurate.
The access study also did not differentiate between underserved and adequately served
communities and whether there was a an independent rural or travel effect for the measures of
access. But most importantly, the sample was drawn with the assumption that rural places
composed a homogenous sample stratum. While the wide variation in access in urban systems is
accepted and comparisons within and between metropolitan areas are usual in national surveys,
this is not feasible for rural places given the current construction of these surveys (Schur, Good,
and Berk 1998).
The interaction of race and ethnicity and rurality has been examined in a review of studies of six
conditions emphasized by the US DHHS in their disparities initiative: infant mortality, cancer
screening and management, cardiovascular disease, diabetes, HIV infection, and child and adult
immunizations (Slifkin, Goldsmith, and Ricketts 2000). That review found that rural minorities
are further disadvantaged than their urban counterparts in cancer screening and management,
cardiovascular disease and diabetes. The gaps between whites and minorities appears to be
greater for these conditions in rural places but the studies which made up the review did not
carefully control for many variables that might describe problems with access to care. Likewise,

10
the comparisons were not controlled for regional effects. There are clear limitations to drawing
inferences from geographical classifications at the county level.
In sum, there is credible evidence that being in a rural place has a strong and relatively consistent
negative effect on one’s economic chances but there is some difficulty in creating a strong claim
that rurality has an independent and significant impact on people’s health. The problem, it
seems, is that the definitions of what is rural and nonmetropolitan are more closely tied to factors
related to population and its density which have a consistent economic effect but an inconsistent
health effect. Unfortunately, a definition of medical rurality isn’t at hand, what is available are
various measures of medical underservice, health professional shortages and vulnerability.
While those measures are place-specific and tend to be more rural, they are also applicable in
urban, even the most urban places. The search for a perfect measure of rurality that will capture
its health effects may be a useful exercise if the strong prejudice toward the existing, well-
documented, and relatively consistent systems of classification were ignored.
Distance and Health One of the most important geographic features that may affect health status and health outcomes
and which may contribute to disparities is distance to health care. The effects of distance on
access to health care services has been a subject of research for some time. For example, Weiss
examined how distance to a hospital combined with social class to determine patterns of use
(Weiss and Greenlick 1970). Joseph and Phillips (Joseph and Phillips 1984) reviewed empirical
studies of the effects of distance on use of care and found some anomalies summed up in the
quotation from a study by Girt:
“distance has both a positive and negative effect on behavior. Individuals are likely to
become the more sensitive to the development of disease the farther they live from a
physician but those at a distance may be more discouraged about actually consulting than
one living neared because of the additional effort involved.” (Girt 1973)
Conner and colleagues examined studies of distance to care to attempt to find standards for
access (Conner, Kralewski, and Hillson 1994). While they found evidence of distance decay in
use and some indication that quality of care suffered when care was provided to people who
lived at some remove from services, they were unable to develop clear guidance for what would

11
be a fair standard for physical accessibility nor how to measure it. They were able to contrast
units of analysis classifying areas as “town/community/ZIP”; county; “market-share defined;”
and national; but made no recommendations concerning their ability to detect differences that
might reflect disparity. There is evidence that underserved populations are located at a greater
physical distance form services in rural communities, but in urban places, due to demographic
shifts, low-income populations are often adjacent to high density of health care resources
(Bohland and Know 1989).
Political-Statistical Geographies
In the US, the states are the fundamental polities for the support and regulation of most local
health care delivery and when the federal government chooses to provide support for nationwide
public health programs, it has three major options all of which involve the states: 1. Grants-in-aid
to states based on their population, so-called block grants; 2. Formula grants that take into
consideration some factors of need, the Medicaid program is an example of such a system; and
3. Program or project grants that involve states either as an umbrella applicant or as a passive
reviewer; community health centers are an example. States have substantial direct power in
public health matters, but even in programs and issues that appear to be strictly federal in nature,
the power balance within the United States Senate that gives states with small populations
immense leverage in the appropriations process tends to shift emphasis toward state autonomy.
By the start of the twentieth century, the county had become the basic unit of government in
most parts of the nation. The proven efficacy of preventive measures on health status and the
subsequent imposition of regulations in the food, drug and housing sectors created the impetus
for rapid development of public health law and public health agencies. The county, as the local
extension of the state’s police power, became the most common political body either willing or
situated appropriately to apply public health policies. There were exceptions and states
sometimes retained central authority over public health. Those exceptions were primarily in the
Northeast where townships were and remain the basic units of government; in Virginia (and
selectively in other states) where independent cities are separate from county government; and
Alaska whose boroughs were the dominant form of local government. There are approximately
3,070 county or county equivalent government units, though there remains some disagreement

12
over the number; the national Association of Counties (www.naco.org) reports that there are
3,066 counties, the Census Bureau lists 3,070.
Census and Postal Geography
Key to the collection of denominator statistics for local health measurement are the census
geographies used to organize the extensive data collection done regularly by the U.S. Bureau of
the Census. The Bureau employs geographers and cartographers who assist the Bureau in
identifying and delineating spatial areas for the purposes of enumerating the population as well
as characterizing the social and economic activity of the population and the nation. There is
within the Bureau, a Geography Division which prepares and distributes a wide range of maps
and geographic products that assists marketers, planners, researchers and citizens in
understanding the distribution of the nation’s population, housing, and economic activity.
Among these products are a comprehensive guide to the areas, concepts and methods used for
data collection and presentation by the Census Bureau as well as descriptions of other geographic
and boundary systems. The Geographic Areas Reference Manual is intended primarily as a
reference for local census statistical committees and others working within the Census Bureau or
with cooperating organizations, but is also useful to others. The manual is available online at
http://www.census.gov:80/geo/www/garm.html. Table 1 lists of the various levels of
government and the range of statistical reporting areas in the nation.
Table 1. United States Political and Statistical Jurisdictions Political Jurisdictions number Statistical Reporting Areas number
State and equivalent entities 57 Region 4 State 50 Division 9 District of Columbia 1 Metropolitan Statistical Areas (MSAs) 268 Outlying Areas 6 CMSAs (Comprehensive MSAs) 21
Counties and equivalent entities 3,248 PMSAs (Primary MSAs) 73 Minor civil divisions (MCDs) 30,386 Urbanized areas 403 Sub-MCDs 145 Alaska Native Village statistical areas 217 Incorporated places 19,365 Tribal jurisdiction statistical areas 17 Consolidated cities 6 Tribal designated statistical areas 19 American Indian reservations 310 County subdivisions 5903 American Indian trust lands 52 Census county divisions 5,581 Alaska Native Villages 217 Unorganized territories 282 Alaska Native Regional Corporations 12 Other statistically equivalent areas 40 Congressional Districts 435 Special economic urban areas 4423 Voting Districts 148,872 Census Tracts 50,690 School districts 16,000 Block Numbering Areas, now Census Tracts 11,586

13
Neighborhoods (used only in 1980) 28,381 Block Groups 22,9192 ZIP Codes 39,850 Tabulated parts 36,3047 Blocks 7,017,427 Traffic Analysis Zones 200,000 ZIP Code Tabulations Zones 40,000.
One common geographic unit is the Zone Improvement Plan Code, or ZIP Code. ZIP codes are
not always bounded areas; they are, be definition, a collection of postal addresses aggregated to
improve mail delivery. A ZIP code may be assigned to a single building, a post office, or an
institution. ZIP codes that cover a defined area may be interlaced as one delivery route passes
and even crosses another—although that is rarely the case. ZIP code boundaries and route
aggregations change continuously and do not require clearance at a central national level. They
are reported, however, quarterly in the publication ZIP ALERT which is issued quarterly by the
United State Postal Service1 (www.ribbs.usps.gov/files/zipalert/). The Census Bureau has
developed a ZIP Code Tabulation Area (ZCTA) geographic unit which approximates the
geographic boundaries of ZIP codes areas that can be geographically defined, some ZIP codes
are buildings, agencies, or postal facilities (http://www.census.gov:80/geo/). The Census Bureau
has begun to release data linked to these ZCTAs and intends to use them as a regular geographic
unit. The intention is to standardize these areas and report census data using these units which is
roughly comparable to the ZIP code areas used by marketing and data reporting firms and
familiar to most Americans. The federal government is currently testing the use of ZCTA areas
to identify shortage areas to prioritize funding for safety net programs.
Market Areas
Markets are both observed, empirically derived assessments of human commercial behavior as
well as conceptualizations of an intended consumption or activity pattern. While markets are
most often associated with the buying and selling of goods and services in a commercial sense,
markets can also be applied to activity spaces that describe general behavior. In the health
sector, a hospital’s market area may reflect where its patients come from, but also the people it
1 The Census Bureau maintains a Master Area Block Level Equivalency file (MABLE) which cross lists ZIP codes with the census boundary files. Using that cross-walk, the Census reports data at the ZIP code level on “Summary Tape File-3” (STF-3) but the ZIP codes included on that file are modified in that they are the ZIP codes that have some boundary characteristics and they include within those boundaries the ZIP codes that are assigned, for example, to a post- office and its related boxes or a “point” ZIP which is a building or institution.

14
reaches in information dissemination and prevention programs acting through intermediary
agents. Markets are defined at varying levels of geography:
• for local goods and services (e.g. hardware stores, primary medical care, grade school
education); these take the form of neighborhood bounded by streets or roads, collections
of ZIP codes, a city and its surrounding area.
• for regional markets (e.g. heavy construction equipment sales, secondary and tertiary
hospitals, specialty surgery, and colleges); These are usually described in terms of a set of
counties or a region of a state or states (examples include: central Missouri, the Delmarva
Peninsula).
• to national and global markets (e.g. research universities, quaternary hospitals, multiple
transplant surgery, and drug manufacturing). (for example: the east coast, North
America).
There are theories or generalizations about markets and market areas that may apply to the
questions at hand. Health as a function of lifestyle, diet and exercise may be considered
exclusively within an individual’s control but the ability to exercise and the diet choices
available to a person are tied to their lived space. The forces that shape those choices or, in turn
influenced by national trends and policies and the structure of health care delivery systems
related to a higher order market befitting a complex, technology-associated service industry.
Health promoting or shaping goods and services are usually “produced” in central places where
local economies can support the people and systems necessary to produce those services and
goods. This applies even to food choice due to the centrally controlled content of fast food and
mass-marketed groceries.
Even the development of data that might identify local disparities depends on geographically
large market areas. Epidemiological and statistical analysis and interpretation is efficiently done
for markets that are centered on the larger state health departments and research universities.
Nationally, this market might be made up of perhaps 100 centers which “sell” or provide these
services. The idea of devolving this process of statistical abstraction to localities may not
adequately consider the realities of this market structures.

15
There are a number of potential general market-derived geographies that are candidates for
assessment of disparities in health. These include Labor market areas (LMAs)2 and ZIP code
clusters. Currently, there are 394 multi-county LMAs in the U.S. which are constructed from
741 multi-county “commuting zones” which are defined using Census data. Labor market areas
are generally considered too large for meaningful local or community interventions.
The inception of the Zone Improvement Plan (ZIP-code) system by the postal service and the
proven effectiveness of direct-mail marketing brought regional marketing down to the “pin-
point” level. The most commonly encountered, current example of this is the use of the PRIZM
(Potential Rating Index for ZIP Markets) marketing clusters which characterize ZIP codes areas
on the basis of patterns of consumption of residents in those areas. The original classifications,
which appeared in 1978, with names such as “wine and cheese”, “shotguns and pickups”, were
based, initially, on Census and magazine subscription data. Their use and construction has
become much more complex and sophisticated. In a recent revision of the system (which is now
owned by the Claritas Company) the original 40 clusters were modified and the number of
clusters expanded to 62. These clusters currently reflect groupings of as few as 22 households
identified through census geography or ZIP+4 addresses. The originator of this systems of ZIP
area clustering, Jonathan Robbin, called this approach to marketing, "geodemographics." The
clustering logic rests on the notion that neighborhoods are alike in many ways, that you are "like
your neighbor" and that your neighborhood will be like many others, even those very distant
from where you live. The question may be asked: Are these real clusters? And do the clusters
represent unified neighborhoods or communities that could be used for influencing health?
Communities developed along the lines of segment clusters proposed by Claritas can be tested
along several conceptual lines, provided the data are available and reliable at the market segment
level. From a technical viewpoint, clustering systems like PRIZM, despite their apparent
locational accuracy, represent a very rough characterization of community type which is
2 LMAs are formally described using county level data and are based on a clustering algorithm that makes use of county-to-county commuting flows that are part of the Census data collection process. The basic clusters of counties that are used to develop labor market areas are called commuting zones (CZs). In 1990, 741 commuting zones were delineated for all U.S. counties and county equivalents. These commuting zones are intended to represent more local labor markets. They are then aggregated into 394 Labor Market Areas (LMAs) by the Bureau of the Census which uses a population threshold of 100,000 for the LMA designation. In health care policy LMAs are used for the calculation of certain inputs to HCFA payment systems and have been used in the analysis of the ability of rural areas to recruit physicians (Brasure et al. 1999).

16
essentially dimension-less and not well tied to health care use, need, or health policy capacity.
However, their use for these purposes has not been empirically investigated.
Natural Communities and Social Networks
“Natural” communities or natural areas are described by the activities of people living in a
named place or neighborhood. There are empirical techniques for identifying and summarizing
natural areas in geography and sociology. The geographic relationship of health care seeking
behavior of people in comparison to their work, shopping and leisure spaces has been described
using maps that show areas of higher potential and actual use (Gesler and Meade 1988). The
natural communities that might emerge from secondary analysis of rates that show contrasts
could be developed and compared using the techniques of geographical and sociological
analysis. The development of a “landscape of disparities” may be more of a visualization
exercise than an empirical problem, but there is some movement toward using GIS systems to
relate problem locations to populations and population activity to suggest solutions (Rushton,
Elmes, and McMaster 2000).
Epling, Vandale and Steuart (1975, p. 87) describe extended family networks as perhaps the
most appropriate denominator for epidemiological characterization of populations because this
would allow for “more efficient units of diagnosis and therapy.” In this case the denominators
and numerators used to determine disparities in health would be developed on the basis of
kinship and connection. They suggest that the validity of the construction of household networks
can be determined by testing the hypothesis that there is greater similarity of health/disease
episodes and behaviors within distinct social networks than between them. Social networks and
social support are understood to be important in determining health status (Weissbourd 2000).
But the only tractable way to understand these ties that bind seems to be through anthropological
and ethnographical study which involve primary data collection.

17
GEOGRAPHIES FOR HEALTH POLICY AND
HEALTH SYSTEM ANALYSIS
Local Health Department Jurisdictions
One likely focus for the implementation of health enhancing and disparity reducing policies on a
geographic basis is the local health department. However, only half of the states currently have
local health departments which are controlled by local government (Turnock 2001). Fifteen
states have centralized systems with control over local health units exercised by a state health
agency and the balance have some form of mixed or shared control. The population coverage
for local health departments may be very small and local—one-quarter of health departments are
responsible for 14,000 people or less. Health department districts or units represent the local
presence of public health and these units have a responsibility for monitoring health status. It is
less clear that there is any responsibility for them to measure their capacity for affecting health
although there are currently energetic efforts on the part of the Centers for Disease Control and
Prevention to promote the evaluation and assessment of the performance of local health
departments (Halverson, Nicola, and Baker 1998; Halverson 2000; Mays and Halverson 2000).
These assessment measures for public health may provide some input to “actionability” since the
health department is often a key element in identifying local health priorities and developing
programs.
Describing Localities with Data and Relating The Data to Levels Appropriate
for Action
In describing localities, data are often drawn from systems that use the county as the
denominator for a population rate, or the state as the sampling frame for a survey. The problems
of applying data from multiple levels of aggregation to analyze conceptually coherent
neighborhoods or communities in the U.S. has been described in several places (Diez-Roux
1998; Duncan, Jones, and Moon 1998). The analytical difficulties inherent in this type of
statistical work can be generalized as either creating an “ecological fallacy,” which attributes
collective characteristics to very dissimilar individuals or the lack of agreement on the power and
specificity of multi-level modeling. The geographic unit of analysis is often key to the ability of
a measure to be sensitive to the underlying construct or local characteristic that is being

18
measured. In a review of studies of geographic access to health care in rural areas, Connor and
colleagues described studies that used “town/community/ZIP code areas”, counties, “market
share defined areas,” and “other areas” which were usually aggregates of ZIP codes or clusters of
counties (Conner, Kralewski, and Hillson 1994). They were seeking guidance on the appropriate
unit of analysis for assessments of the adequacy of access and guidance for allocating resources.
The idea of access as a unifying concept that would lead to a consensus definition of an
appropriate geographic unit was not supported by that review. The general geographic size of
places where access was most effectively measured was at the local level, usually small counties
or clusters of ZIP areas and was closely associated with the system that was meant to affect or
provide access to primary care. These areas represent where the fit between a measurable
disparity in access closely fit the area in which a solution could be achieved either through the
enhancement of availability (creating a clinic) or modifying some factor that reduced access
(developing a subsidy for care). However, many of the studies they reviewed made note of (but
seldom measured) important effects and influences on the programs and projects from adjacent
areas or state systems.
Neighborhoods were once considered the appropriate level at which to measure and intervene in
health (Kivell, Turton, and Dawson 1990). Geographers in England working to develop a local
focus for the National Health Service were able to say, in 1990, that: “Health and social service
administrators are increasingly realizing the importance of adopting a community or
neighborhood scale for the organization and delivery of many different services.” (Kivell,
Turton, and Dawson 1990, p 701) They went on to suggest a method for determining what those
neighborhoods were, based on a review of data, followed by an overlay of existing boundaries of
areas for which data were available. They then aggregated census enumeration districts and
postal code areas as the building blocks for a data system; its subsequent use has not been widely
reported.
Technical Problems with Community Indicators
The determination of small area rates and indices describing the health status and health care
resources available to populations is subject to varying degrees of error. In creating these rates
and indicators, analysts rely on a largely dispersed and cooperative system of reporting that is

19
based on local and state rules and laws although the standards and guidelines are centrally agreed
upon. Mortality rates, overall, are generally considered accurate but there is evidence that cause
of death is often miscoded on death certificates which are the source of mortality data (Kircher
1985; Goodman and Berkelman 1987). The accuracy of health care resource data is not often
called into question, but for secondary data analysis, there are problems with national data
sources which may skew a picture of a county or community. The AMA Masterfile is the most
often used source for national estimates of physician supply down to the county level but it has
been shown to have a degree of error due to reporting lags and the high mobility of physicians
(Cherkin and Lawrence 1977; Grumbach et al. 1995; Kessler, Whitcomb, and Williams 1996;
Williams, Whitcomb, and Kessler 1996). For rural areas, the difference between the number of
physicians reported in the Masterfile and the actual, locally verified number is striking in many
places (Konrad et al. 2000; Ricketts, Hart, and Pirani 2000). At the state level, license and
survey data indicate that the Masterfile may overestimate primary care physician supply by as
much as 20%. Data for nurses, pharmacists, and other health professionals are far less accurate
when drawn from national sources due to the lack of a national inventory system. (Kresiberg et
al. 1976; Osterweis et al. 1996).
Health Service and Health Market Areas
The involvement of communities in planning health care delivery systems reached its peak in the
U.S with the passage of P.L. 93-641, The Comprehensive Health Planning And Resource
Development Act of 1974. The language of the Act included guidance for communities to assess
their needs and capacity to improve health. Under the Act, the nation was divided into HSAs—
Health Service Areas, that represented a potential set of “communities of solution”3 for the
problems of resource distribution. The argument for a de-centralized, plural system that “went to
the people” for advice was thought to strengthen democracy and make health systems more
“responsive” to the consumer. James Morone views this form of devolution in health planning
as one example of the abrogation of responsibility by government when decision-making
becomes too difficult (Morone 1990). Morone sees community participation as an often
3 The idea of a “community of solution” was proposed in 1966 by the National Commission on Community Health in Health is a Community Affair (National Commission on Community Health Services 1966). It emphasized that communities of solution should overlap as much as possible “communities of need.” In the search for the right geography to determine where disparities exist, we are seeking to find the appropriate level to bound disparity as well as identify the proper scale at which to target solutions.

20
unproductive process to which the elites and interest groups turn when re-distributive policies are
necessary because of all-too-apparent imbalances and because favored interests must give
something up and politicians don’t want to be blamed. Morone’s interpretation of the
relationship among institutions, professionals and the democratic process doesn’t provide much
support for the idea of identifying communities and their capacity and then letting them decide
how to improve health. Nevertheless, the local health planning agencies did compile impressive
amounts of local resource and need data and their services were so appreciated in some states
and communities that they survived the de-funding then repeal of the national health planning act
and a continuous drum-beat of ridicule as one of a series of failed experiments in national health
coverage. The more recent failure of the Health Security Act, Clinton’s health reform plan, in
1993-4 may have replaced health planning as the primary target of anti-reform factions, but those
who care more for market solutions have successfully linked health reform to health planning
and made the two unfashionable even among liberals (Johnson and Broder 1995).
Hospital Service Areas
Hospitals in many communities have been actively developing community-focused programs
that attempt to coordinate preventive, primary care, and specialty outpatient care with their more
traditional inpatient services. In places where the hospital is the hub of health activity, its market
area would form the appropriate boundaries for a “community of solution” for improving
population health. The determination of medical service areas became an important part of
health policy considerations in the1980s due to the attention being paid to legal and economic
issues surrounding competition (Morrisey, Sloan, and Valvona 1988; Morrisey 1993).
Geographic methods for health care service area construction were the subject of a
comprehensive review in the context of geography (Simpson et al. 1994). There are three major
types of methods for creating service areas: 1. Geographic Distance, 2. Geopolitical Areas, and
3. Patient Origins.
A distance approach would create radii or ellipses that surround a central place or a limited
number of nodes that represent core activities. This method is appropriate where a legislature or
a regulator wishes to set a general standard for access, e.g. “all enrollees must have a primary
care clinic or office within 30 miles of their home.” These systems usually create a “crow-fly”
21
or straight line standard, but occasionally travel time is used. Distance measurement can now be
done along road networks with GIS systems and very detailed areas can be described based on
actual over-the-road distance from a central point along all available routes. The road network
can be converted into time-based increments based on the road type, the number of intersections,
the presence of traffic lights, traffic volume or periodically dense traffic and travel times
computed (Walsh, Page, and Gesler 1997). The use of distance and time have not been used
extensively in the development of areal boundaries for health policy of for the analysis of health
status largely due to the difficulties of calculation. There is potential for greater use of liner
distances or approximations of travel time through GIS systems which can easily calculate
“buffers” or radii and include or exclude populations within defined boundaries that are included
within those buffers or which touch them.
Geopolitical boundaries are most commonly used to define health care service areas largely due
to their close links to policy-making bodies including local and state governments which often
operate health services or have public health responsibility. The use of public funds are most
often restricted to benefit specific, pre-existing jurisdictions and crossing those boundaries runs
counter to the mutually exclusive nature of local government and its operations. If taxes are
collected by local governments, then the expenditures will most likely be required to be on
behalf of the citizens of the polity, or spent within the boundaries of the polity in order to benefit
them indirectly. County hospitals and health departments have obligations to the citizens of their
county based on this civil-fiduciary relationship and politicians and bureaucrats face voter
retribution if they don’t “keep the money at home.”.
The use of patient origins to create service boundaries usually aggregates smaller geographic
units such as ZIP codes or census tracts into areas using an inclusion rule based on proportion of
total hospital admissions or hospitalizations from the small area. In creating the Dartmouth Atlas
of Health Care, the Dartmouth Medical School team, led by John Wennberg with the assistance
of professional geographers, created an algorithm for the development of hospital service areas
for the entire United States (Dartmouth Medical School. Center for the Evaluative Clinical
Sciences 1998). The algorithm was created to identify the appropriate population denominators
for the comparison of rates of surgery and the supply of physicians. The approach used for the

22
Atlas was to aggregate by ZIP code all Medicare hospitalizations for 1992 and 1993 into hospital
service areas. The ZIP code was assigned to the hospital (or town in which there were more than
one hospital) to which the plurality of patients went. This initially created discontinuities in the
resulting geography; ZIP codes that were not contiguous were identified. To solve the problems
of “islands” or “doughnuts” that appeared after the algorithm was applied, ZIP areas that were
not properly attached were assigned to the closest service area. The specific method used for
assignment of wayward ZIPs is not clearly described in the Atlas and likely depended heavily on
visual inspection and hand-adjustment. The final service area map constructed for the Atlas
created 3,436 hospital service areas for the 4,900 general hospitals in the nation. The Atlas and
its derivative products are being used for benchmarking of many rates of treatment and resource
allocation, The very wide apparent range of distributions across the service areas is seen as
evidence for the need for change in the health care delivery system. The distributions themselves
are seen as giving guidance for the setting of benchmarks for system performance with the
desirable rate or resource seen to be somewhere in the lower half of national distributions. The
Atlas also provides data for the determination of comparative needs and points to important
disparities in the healthy care system. However, the suggestion that the service areas that are
described in the Atlas are potential “communities of solution” has not been directly made. The
ubiquity of the Atlas may, however, create a perception that these areas can be used for such
analysis as more and more policy makers refer to it and its structure.
Primary Care Service Areas
In the delivery of health services, there is a prevailing belief that the fundamental unit for
constructing a rational health care delivery system is the primary care practice. In the COPC
paradigm these areas often become coterminous with public health target areas. Primary care
practices staffed by a generalist physician or other primary care practitioner are, under this
regionalized scheme, appropriate care givers for the small village or community of 1,000 or so
people. Such a systematic allocation of primary care is often seen in the context of a
comprehensive scheme that allocates population to “higher” levels of care. The specialty clinic
and local hospital are the next level, followed by the regional or secondary hospital, then the
tertiary or referral hospital and an even “higher” level of complexity is reached at the quaternary
medical center, usually a teaching facility with the most complex technology and research

23
undertaken within its walls or on its campus. The national institutes or centers may also be seen
as a separate, apex level of care or investigation. Recommendations for the appropriate match of
population to services for each level have been proposed starting early in the century and the
appropriate mix of professionals and services for communities continues to this day (Hicks and
Glenn 1991).
Primary care service areas have been developed in several states including Arizona, California,
Maine, North Carolina and Tennessee for the analysis of access to care or to create sub-county
areas for designation for federal programs. These are clusters of ZIP codes (NC) and sub-county
census geography (AZ, ME, CA). The system used in California is perhaps the oldest
continuously used system and may present a template for other states to consider in developing a
set of communities of solution for health services at a geographic level that is appropriate to local
action (Smeloff and Kelzer 1981). Whether these areas represent communities of solution for
health improvement has not been addressed. But their use in California and North Carolina in
the examination of preventable hospitalizations, points to a broader set of causal factors for
health beyond health care (Ricketts et al. 2001; Bindman et al. 1995).
The primary care service areas in California were mandated by the planning regulations in that
state and, in 2001, are made up of 487 geographic areas called Medical Service Study Areas
(MSSAs) and MSSA Urban Subdivisions. These areas are composed of one or more census
tracts. The responsibility for determining and modifying the boundaries of each of these areas
resides with the California Health Manpower Policy Commission. The Office of Statewide
Health Planning and Development provides staff services to the Commission. The MSSAs must
include one or more complete census tracts and not cross county line, all communities must be
within 30 minutes travel time of a “population center,” and the population of the MSSA should
be in the range of 75,000 to 125,000.
North Carolina has used clusters of ZIP codes to assess the relationship of workforce and
healthcare resources to medical outcomes (Ricketts et al. 2001). The ZIP clusters are centered
on places where there are concentrations of primary care physicians. The ZIP areas where
physician practice are ordered from those with the most to those with the fewest and a “natural

24
break” in the distribution separates the “seed” nodes for the creation of clusters. Based on the
number of physicians in the “seed” ZIP code, the population of the outlying ZIP areas and the
distance to those areas, other ZIP areas are attached to the seed using a computer algorithm that
minimizes the net weighted distances. Effectively, ZIP areas with more physicians are able to
attract more populous and more distant ZIP areas. The resulting map of clusters agrees with
expert informants’ opinions of the structure of primary care service areas in the state. The
advantage of this approach is that it can be repeated in other states with readily available
secondary data.
The U.S. Bureau of Health Professions in cooperation with the U. S. Bureau of Primary Health
Care is currently (1998-2001) supporting a project to determine a national set of “rational”
primary care service areas (RPCSAs). This work is being done at Dartmouth Medical College
with the collaboration of several states which will test the validity of the proposed areas with
locally available data. The project makes use of Medicare Part B data to create clusters of ZIP
code areas following the methods used by the Dartmouth Atlas of Health Care in the creation of
hospital service areas. As of late, 2001, the project had identified over 6,000 RPCSAs. Once
these primary care service areas are put in place on a national level, they are likely to be viewed
as the appropriate boundary for a range of local interventions that address access and disparity
issues.
Measures of Underservice and Underserved Areas
One example of the use of secondary data to characterize the health and resource capacity of
communities has been the development and use of indices of professional shortage or of medical
underservice. Currently, in the United States. These include the Index of Medical Underservice
(IMU) and the Health Professional Shortage Area designation (HPSA) designation. Both are
used to allocate resources for federal and sometimes state programs including the assignment of
National Health Service Corps Physicians or allowing International Medical Graduates with J-1
visas to practice in a community. Each of these designations requires that the population that is
to be qualified be part of a “rational service area” or, if such an area cannot be drawn, be an
identifiable population (e.g., Medicaid recipients, migrant farmworkers) or an institution that
serves low-income populations or groups with difficulties accessing health care (e.g., a public
25
mental health hospital may be designated). The MUA designation is most often applied to an
entire county; HPSAs are defined as often by a sub-county collection of census tracts as it is by
county boundaries. The designation of a community as a MUA is required prior to funding as a
Federally Qualified Health Center (FQHC) Physicians practicing in HPSAs are able to receive
bonuses up to 20% of the normal payment under Medicare. In all, over 30 discrete federal
programs make use of one or both of these measures to qualify a community for assistance (Lee
1979; Lee 1991; Taylor and Ricketts 1994). In 1999, there were 833 whole county HPSAs, 723
part county HPSAs, 1,410 whole county MUAs, and 1,003 part county or population based
MUAs.
The designation process initially made use of existing boundary sets but over the years, many
more sub-county, or customized geographies have been developed to identify underserved areas.
These include clusters of census tracts, townships, or block groups that often cross county lines,
even state boundaries. This process of identifying more precisely areas of underservice has
tended to increase the statistical contrast in health status by more carefully defining boundaries
around areas and populations in need.
Policy makers in the United Kingdom look at underservice in a slightly different way. Access,
for example, has not been considered a central, organizing concept for the National Health
Service, mostly because the system was developed to eliminate any disparity in availability
(Taylor 1998). The classification systems that were developed to allocate resources have used
terms such as “underprivileged” and “deprivation.” Three measures that have been widely
discussed include: the “Jarman Index of Deprivation” or the “Jarman Underprivileged Area
(UPA) score (Jarman 1983, 1984); the Carstairs Deprivation Index (Carstairs 1995); and a
measure of material deprivation proposed by Townsend (Townsend 1987). These have been
applied in various contexts in Great Britain and debated vigorously in the health services
literature and the popular press (Jarman 1983, 1984; Morris and Carstairs 1991; Sundquist et al.
1996). Common components of these indices include unemployment, crowding and no car
access. All are applied at the Post Code level.

26
These indices, both in the U.S. and the U.K., recognize some threshold value for underservice or
deprivation as opposed to some localized measure of disparity of inequality. There was,
however, an attempt to scale the degree of severity of health professional shortage in the U.S. in
the 1980s but was phased out. The level at which underservice is apparent on any scale is
heavily debated; but, to date, no concrete proposal to include an index of disparity or inequality
has been considered by the government agencies that make use of these score.
Geographic Information Systems: GIS as Savior?
Geographic(al) Information Systems (GIS) have been proposed by some as an all-purpose
answer to problems of community characterization, and are touted as capable of solving
resource allocation problems as well as being an essential part of the field epidemiologist’s
armamentarium. The widespread use of GIS in public health came relatively late4 in the
development of computer assisted cartography and geographic analysis largely due to the lack
of useful data to attach to geographic coordinates (Rushton, Elmes, and McMaster 2000). A
working group of federal agencies, geographers, GIS users and policy makers met in
Washington in December, 1999 to discuss the potential for using GIS for health policy
making at “A Symposium on Uses of Spatial Data Analysis and Geographic Information
Technologies for Health and Human Services Policy and Planning,” sponsored by the Office
of the Assistant Secretary for Health, DHHS. That meeting demonstrated that there was
widespread use of GIS systems for health policy development but that the federal government
was perhaps the last governmental level to formally consider the use of such systems. Since
that meeting there have been more conscious initiatives to set a standard for the use of GIS in
federal health policy making. Healthy People 2010 includes the goal of increasing “the
proportion of all major national, State, and local health data systems that use geocoding to
promote nationwide use of geographic information systems (GIS) at all levels” from a
baseline of 45 percent to 90 percent (Office of Disease Prevention and Health Promotion
2001). and the decision by the National Cancer Institute to give priority to “geographic-based
research on cancer control and epidemiology” .
4 Although some of the first applications of automated cartography were used to address health services problems.

27
There are notable recent examples of how neighborhoods and communities can make use of
data describing local needs and capacity to effect change. One of the more recent initiatives
to promote the use of social indicators for more local applications has been through the
National Neighborhood Indicators Partnership (NNIP) (Kingsley 1999). They have developed
a guidebook and supported teams of technical advisers to assist communities in setting up
systems and recommending specific software and data sources (Kingsley 1999; Kingsley et al.
1997). The program also makes extensive use of Geographic Information System (GIS)
technology to gather and disseminate data for decision making. The indicators include
considerations of local, geographic conditions that may affect health and health care and
imply the creation of measures of disparity and difference between racial and ethnic groups
but do not provide specific guidance for measures of inequality or for the geographic unit to
be used for such measures. The goals of the indicators project is to identify contrasts that
suggest problems and to match local resources to them at the appropriate level of geography.
Those contrasts and the geography are dependent on existing boundary systems and boundary
sets.
Additional Community Health Information Resources
One example of the use of geographic information systems as a mechanism for disseminating
health status and health resource information is provided by the HealthQuery® system which
is being piloted in Los Angeles (www.healthquery.org). The system describes it mission as:
"To place in the public domain a unique aggregation of health-related Internet-based tools,
which enhance the health and healthcare of Californians and potentially the nation. The tools
utilize existing software products that contributing organizations agree to have integrated into
new applications available only at the non-commercial HealthQuery® site." The
demonstration site active in early 2001 includes small area data for demographics, facilities
and resources and includes a route finder to direct people to the nearest clinic, hospital or
emergency room. The site include community health indicators and promises to provide
projections and models of trends at a future date.
A summary of “Social Indicators at the Community Level” is included in the Handbook of
Research Design and Social Measurement by Delbert Miller (Miller 1991). The community

28
indicators reviewed there that might reflect community capacity to improve population health
and reduce disparities were usually based on survey data collected for specific studies. Some
constructs that are related to community capacity include the “goodness” rating system for cities
(Thorndike 1939); the “Community Attitude Scale” (Bosworth 1955); the “Community
Solidarity Index” (Fessler 1952); the “Community Leadership Index” (Hunter 1980). The
references in Miller’s book list multiple other scales and measures that might apply to the idea of
“capacity.”
The Community Health Status Indicators Project
The Public Health Foundation has joined with the Health Resources and Services Administration
(HRSA) to identify a set of community measures of health and publicize these for counties as a
rough guide to the comparative health status and resources available to counties. This program,
“Community Health Status Indicators” (CHSI) posted data for all US counties on a web site
maintained by the U.S. Health Resources and Services Administration (HRSA) in July of 2000
(www.communityhealth.hrsa.gov). All U.S. counties are clustered into 88 strata that were
developed through “expert input.” The method as described on the web site, set a target number
of counties per strata, between 20 and 50, with the intention of allowing for comparisons of
similar counties by size, population, age structure and density. The resulting system identified
roughly equivalent peer groups that range in number from 14 to 58 counties with an average of
35. The data are presented in a way that allows counties to identify their priority conditions or
problems and compare themselves to their peer group. The clustering system was developed in
cooperation with work for the Comprehensive Approach to Tracking Community Health
(CATCH) program at the University of South Florida (Studnicki et al. 1997).
MEASURING DIFFERENCES Key to the identification of a substantial difference in health status or access between
geographically defined populations or population segments is the degree to which the boundaries
separate or include the population which is negatively affected or the degree to which the nature
of the area itself affects health and health care. Maps of the United States at the state level show
strong and important differences in mortality, morbidity and access to care measures. There are
different ranking and ratings systems that reveal health disparities at the state level and include
those distributed by the UnitedHealth Group (UnitedHealth Group 2000), Morgan Quitno
29
(Morgan and Morgan 2001) the National Conference of State Legislatures (Siegel 1998), The
American Association of Retired Persons (AARP) (Lamphere et al. 1999), the Urban Institute
(Liska, Brennan, and Bruen 1998). The CDC’s National Center for Vital and Health Statistics
does not explicitly rank states in a comparisons but data they distribute are easily subject to
ranking and grouping. Those rating systems are criticized for their accuracy and the inclusion of
subjective judgments as to what constitutes a summary measure of health (Gerzoff and
Williamson 2001). Comparisons of state rates of key health indicators result in variations that
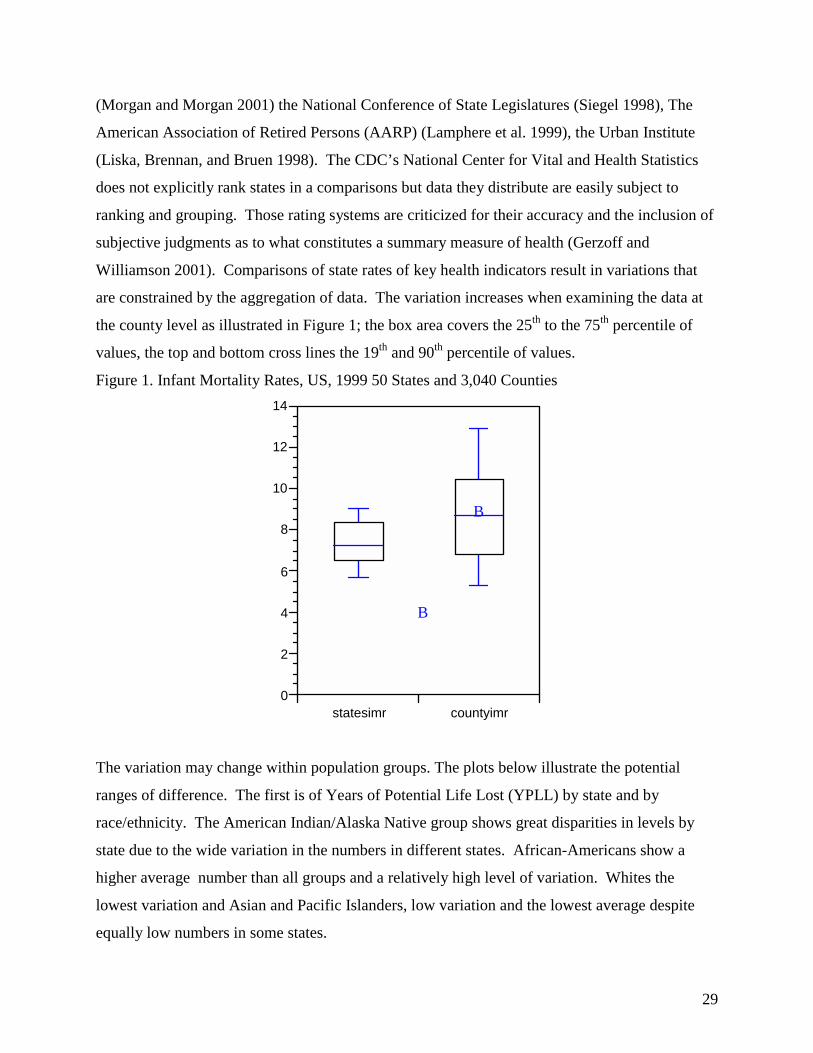
are constrained by the aggregation of data. The variation increases when examining the data at
the county level as illustrated in Figure 1; the box area covers the 25th to the 75th percentile of
values, the top and bottom cross lines the 19th and 90th percentile of values.
Figure 1. Infant Mortality Rates, US, 1999 50 States and 3,040 Counties
B
B
statesimr countyimr0
2
4
6
8
10
12
14
The variation may change within population groups. The plots below illustrate the potential
ranges of difference. The first is of Years of Potential Life Lost (YPLL) by state and by
race/ethnicity. The American Indian/Alaska Native group shows great disparities in levels by
state due to the wide variation in the numbers in different states. African-Americans show a
higher average number than all groups and a relatively high level of variation. Whites the
lowest variation and Asian and Pacific Islanders, low variation and the lowest average despite
equally low numbers in some states.

30
Figure 2. Years of Potential Life Lost before age 75/100,000, US States, 1999
B
B
B
B
BB
Hispanic AI/AN Black A/PI White All Race0
2000
4000
6000
8000
10000
12000
14000
16000
18000
Many measures of health status are difficult to compare across counties and other levels of
geography are used. For example, in the United State Atlas of Mortality (Pickle et al. 1996) for
most causes of death, the county was too fine a level of analysis due to the low number of deaths
in a majority of counties. The rates were clustered into 805 Health Service Areas based on
hospital usage for people over 65 (Makuc et al. 1991) and adjustment to aggregate areas for
visibility on maps. The maps in the Atlas show broad variations in rates and a significant degree
of clustering of higher and lower rates by region (view sample maps at:
www.cdc.gov/nchs/products/pubs/pubd/other/atlas/atlas.htm). The Atlas went one step further
and spatially smoothed the mortality rates and created quintiles of the distribution. These maps
show remarkable clustering by region for various causes of death in age and race categories. For
example colorectal cancer for white males age 40 shows a very high rate in the mid-Atlantic
region. The geographic distribution changes at age 70 with the highest rate shifting to the
northeast. Among blacks, the rates remain highest in the coastal southeast, Mississippi Delta and
east Texas for both age specific groups. The Atlas identifies regional difference and shows the
diversity of disparities across race groups by both age, geography and cause of death.
The Dartmouth Atlas of Health Care series uses a set of hospital service areas made up of
clusters of ZIP codes to illustrate differences in the use of resources and rates of procedures
among Medicare beneficiaries. Many of those 3,436 service areas do not include sufficient
populations to compare morbidity and mortality as well as the rates included in the Dartmouth

31
Atlas. This led to the construction of 306 hospital referral regions each with a minimum of
120,000 residents. These regions allow for comparisons of outcomes and health status rates
linked to health system structure. Linking the geographic analysis of health status data to the
health care resources that may be mobilized to affect those rates is a powerful step toward
reducing disparities. The link between the reporting of data and the development of policies to
address identified disparities has generally not spanned political boundaries to more functional
health system regions. There are some signal exceptions of systems that attempt to do so.
SYSTEMS TO AFFECT LOCAL HEALTH While it is more common to use data to describe places which are statistically separate from the
direct delivery of health services, there are examples of the integration of community
surveillance into health care delivery systems. Community health and community medicine are
accepted as rubrics for a recognizable component in the organization of health care services.
Communities have within them individuals and families who communicate and learn jointly and
they have “interesting etiological and intervention potentialities.”(Epling, Vandale, and Steuart
1975). Yet, in the eyes of medical anthropologists who, in 1975, sought the proper level at
which to investigate the spread of disease and the effects of social structure on disease found that
the search for the proper area was not fruitful: “Unfortunately, there is, to our knowledge, very
little concrete epidemiological evidence that supports these general notions of a community
effect on illness.” (Epling, Vandale, and Steuart 1975, p. 86) On the other hand are experts and
advocates who see the community as the appropriate and inevitable location for control or
influence of the health system (Institute of Medicine. Committee for the Study of the Future of
Public Health 1988; Stoto, Abel, and Dievler 1996). Others see it as the loser in a struggle for
dominance as health care becomes more and more a corporate enterprise (Spitz 1997).
Epidemiologists see their discipline as offering a special contribution to the improvement of
health by being able to determine the appropriate denominator and apply sensitive methods to the
prioritization of problem solution sets (Morrow 2000).
Community Oriented Primary Care.
Community oriented primary care (COPC) is an important contemporary conceptualization of
how health care should be organized and COPC has been applied to systems that integrate public
health with individual health care delivery (Bogue and Claude H. Hall 1997). The origins of

32
COPC can traced to early organized structures for identifying local needs and addressing them
but the name and the elaboration of the concept is the legacy of Sidney Kark, Guy Steuart,
Joseph Abramson and their colleagues in South Africa (Kark and Steuart 1962). The COPC
process involves four common steps: 1. Identify the community; 2. determine its needs; 3.
implement changes in practice to meet those needs; 4. assess progress and adapt to remaining or
emerging needs. Hal Strelnick, an early American practitioner of COPC, described the
community-defining process as an ongoing, dialectical process where there was a changing
emphasis and refining of the community among the three major types of community and
population, the predefined, the practice-defined, and the problem defined (Strelnick 1990).
Thomas Mettee offers an approach to the development of a larger set of options for building
health within the COPC structure when he integrates the idea of community diagnosis into
planning for community health (Mettee 1987). He develops the ideas of Edward McGavran to
view the "community as patient" ascribing a hierarchy of needs, like Maslow's, to the
community. Maslow saw the individual's needs for nutrition, air and water as basic; followed by
safety, then family and society through self-esteem to independence and finally growth. The
community hierarchy of needs is depicted in Figure 3 and describes the most important needs of
communities as, first, clean air and water and safe food; then safe housing, medical care and fire
and police protection; moving up to growth and prosperity.
Mettee compared the information gathering process in the care of individuals with a parallel
process for communities. In McGvaran’s and Metee’s formulation, various types of information
collected from the individual patient would be compared to data describing the community and a
combined diagnosis made. This parallel system offers important suggestions for how to arrive at
a sense of community needs as well as community capacity. Mettee's and McGavran's ideas
were reflected in the subsequent push for “community diagnosis,” a process that was refined and
elaborated in public health in forms such as the Planned Approach to Community Health
(PATCH), the Assessment Protocol for Excellence in Health (APEX), and the current Mobilizing
for Action through Planning and Partnerships (MAPP) (National Association of County & City
Health Officials 2002), all models for the assessment of community needs. These models were
largely meant for local application and not meant to compare or rank communities or to assess

33
disparities. However, they do emphasize contrasts and “problems” which are equivalent to
“deficits” in health in the localities.
Identifying The “Healthy Community”
The characteristics of healthy communities have been described by organizations like the
Healthy Communities movement associated with the Civic League. Healthy communities,
according to Norris and Pittman, exhibit seven patterns with four core characteristics that unite
mind, spirit and body (Norris and Pittman 2000); a community that is healthy: shapes its future;
cultivates leadership everywhere; creates a sense of community; connects people and resources;
knows itself; practices ongoing dialog; and embraces diversity These characteristics would
provide a direct contrast to disparities and the questions arises, are healthy communities with
these characteristics but residual health outcomes to be considered in a “disparity” column?.
In the recent past, the idea of “social capital” as contributing to the capacity of a community to
improve health has been proposed. As an example of a social capital index, Joshua Galper, in a
paper developed for the Urban Institute (Galper 1998), describes an empirical approach to
clustering and ranking counties on the basis of their social or civic capital. His indicators include
the structure of the local economy, including number of large firms, payroll of membership
organizations, number of museums, gardens and zoos, the crime rate, unemployment rate,
education levels, the age distribution, and newspaper readership, among other variables. This
grouping and ranking system is similar to that used in the article “How To Build Strong Home
Towns” which appeared in American Demographics in 1997 (Irwin, Tolbert, and Lyson 1997).
The Pew Charitable Trusts, the Population Association of America, and community and
government agencies in Canada and Australia have also created approaches to measure social
capital or community capacity (Pew Charitable Trusts 1997; Teachman, Carver, and Paasch
1997; Bullen and Onyx 1998). These assessments of social capital have many of the same
limiting characteristics that are encountered in community indicators of health care needs: they
depend on fixed and often irrelevant units of analysis or denominators, they are made up of
indicators whose original purpose was to characterize some other element of the society or
discrete activity, and they are not very predictive of "outcomes"—whether they are health status
or economic performance.

34
CONCLUDING REMARKS Geographers who examine the relationship between place and health don't sense a relationship
with fixed places so much as how people have interacted across space to make a particular place
more or less healthy. The relationship between HIV infection and interstate highway locations
represents a perfect example of a health consequence that is literally in motion and dependent
upon place only to facilitate transmission. The consequences are felt at a distance. Injury
prevalence is dependent on risks which are tied to geography: higher rates of trauma in rural
areas are due to factors related to exposure and behavior (snowmobile use, chainsaws, tractors,
higher highway speeds, lower seatbelt use) that reflect the interaction between human activity
and space and places. These are disparities in risks related to geography. Paradoxically, urban
places tend to be a bit safer in terms of trauma; there are more guns in rural places and firearm
injury rates are higher and the urban-rural differential in drug and substance abuse is no longer so
great as to create clear contrasts in the net health effects of crime.
There are obvious structural and physical differences between the decaying inner city of
Scranton, PA and of the "cotton trail" area of South Carolina. However, the health disparities in
access, services, and quality are fundamentally the same and described in the same terms.
Across geographies there is a convergence of human health status and of how we deal with it.
Geographic location has very few absolute effects on access, use and health status. Those are:
distance (time and topography fit under this heading as well) and weather. If the task is "how
best to measure" then there are two ways: classify populations by place or measure individual's
distance to care, net of other opportunities. However, we often “control” for differences in
weather and the effects of distance are accepted as part of the condition of human settlement
leaving pure geography outside of the causal structure for health policy. The “neighborhood”
may be considered a form of pure geographic effect. However, it’s definition is difficult and
bringing some form of consistency to its measurement may be antithetical to a concept that
reflects the variety of human interaction. If one is to measure disparity in terms of rates with
delimited denominators, it is the choice of the unit of analysis—the geography—that will affect
any measure of disparity in access, etc.

35
REFERENCES
Albrecht, Stan L., Leslie L. Clarke, and Michael K. Miller. 1998. Community, family, and race/ethnic differences in health status in rural areas. Rural Sociology 63 (2):235-52.
American College of Physicians. 1995. Rural primary care. Annals of Internal Medicine 122 (5):380-90.
Berkman, Lisa F., and Ichiro Kawachi, eds. 2000. Social Epidemiology. New York: Oxford University Press.
Bindman, Andrew B., K. Grumbach, D. Osmond, M. Komaromy, K. Vranzian, N. Lurie, J. Billings, and A. Stewart. 1995. Preventable hospitalizations and access to health care. JAMA 264 (4):305-311.
Bogue, Richard, and Jr. Claude H. Hall, eds. 1997. Health Network Innovations: How 20 Communities are Improving Their Systems Through Collaboration. Chicago: American Hospital Publishing.
Bosworth, Claud A. 1955. A study of the development and the validation of a measure of citizens' attitudes toward progress and some variables related thereto, University of Michigan, Ann Arbor, MI.
Braden, JJ, and K Beauregard. 1994. Health Status and Access to Care of Rural and Urban Populations. Rockville, MD: Agency for Health Care Policy and Research.
Brasure, Michelle, Sally C. Stearns, Edward C. Norton, and Thomas C. Ricketts. 1999. Competitive behavior in local physician markets. Medical Care Research and Review 56 (4):395-414.
Bullen, Paul, and Jenny Onyx. 1998. Measuring social capital in five communities in New South Wales: Neighborhood and Community Health Centres in New South Wales.
Cherkin, D., and D. Lawrence. 1977. An Evaluation of the American Medical Association's Physician Masterfile as a Data Source—One State's Experience. Medical care 15 (9):767-769.
Conner, Robert A., John E. Kralewski, and Steven D. Hillson. 1994. Measuring geographic access to health care in rural areas. Medical Care Review 51 (3):337-377.
Dartmouth Medical School. Center for the Evaluative Clinical Sciences. 1998. The Dartmouth Atlas of Health Care 1998. Edited by J. E. Wennberg, The Dartmouth Atlas of Health Care in the United States. Chicago: American Hospital Publishing , Inc.
Diehr, P., K. C. Cain, W. Kreuter, and S. Rosenkranz. 1992. Can small-area analysis detect variation in surgery rates? The power of small-area variation analysis. Medical Care 30 (6):484-502.
Diehr, P., K. Cain, F. Connell, and E. Volinn. 1990. What is too much variation? The null hypothesis in small-area analysis. Health Services Research 24 (6):741-71.
Diez-Roux, Anna V. 1998. Bringing context back into epidemiology: variables and fallacies in multi-level analysis. American Journal of Public Health 88:216-222.
Dubos, Rene. 1961. Mirage of Health. Utopias, Progress, and Biological Change. Garden City, NY: Anchor Books. Original edition, Reprint of Volume XXII of the World Perspectives Series.
Duncan, C., K. Jones, and Graham Moon. 1998. Context, composition, and heterogeneity: using multi-level models in health research. Social Science and Medicine 46:97-117.

36
Eberhardt, M. S., D. D. Ingram, Diane M. Makuc, Else R. Pamuk, Virginia M. Freid, Sam B. Harper, Charlotte A. Schoenorn, and Henry Xia. 2001. Urban and Rural Chartbook. Health United States, 2001, Health, United States. Washington, DC: U.S. Government Printing Office.
Epling, Philip J., Susan E. Vandale, and Guy W. Steuart. 1975. Beyond the individual for the practice of social medicine: household networks as etiologic-diagnostic units. In Topias and Utopias in Health. Policy Studies, edited by S. R. Ingman and A. E. Thomas. The Hague: Mouton.
Fessler, Donald R. 1952. The development of a scale for measuring community solidarity. Rural Sociology 17:144-52.
Florin, John, Wilbert M. Gesler, Lucy A. Savitz, and Lise K. Fondren. 1994. Regionalization of health care. In Geographic Methods for Health Services Research, edited by T. C. Ricketts, L. A. Savitz, W. M. Gesler and D. N. Osborne. Lanham, MD: University Press of America.
Galper, Joshua. 1998. An exploration of social capital, giving, and volunteering at the United States county level. Washington, DC: The Urban Institute.
Gerzoff, Robert B., and G. David Williamson. 2001. Who's Number One? The impact of variablility on rankings based on public health indicators. Public Health Reports 116 (2):158-64.
Gesler, W. M., and M. S. Meade. 1988. Locational and population factors in health care-seeking behavior in Savannah, Georgia. Health Services Research 23 (3):443-62.
Ghelfi, Linda, and Timothy Parker. 1997. A county-level measure of urban influence. Washington, DC: Economic Research Service, U.S. Department of Agriculture.
Giddens, Anthony. 1984. The Constitution of Society. First paperback edition ed. Berkeley, CA: University of California Press.
Goodman, R., and R. Berkelman. 1987. Physicians, vital statistics, and disease reporting. New England Journal of Medicine 258:379.
Grumbach, K., S. H. Becker, E. H. Osborn, and A. B. Bindman. 1995. The challenge of defining and counting generalist physicians: an analysis of Physician Masterfile data. American Journal of Public Health 85 (10):1402-7.
Halverson, P. K. 2000. Performance measurement and performance standards: old wine in new bottles [editorial]. Journal of Public Health Management and Practice 6 (5):vi-x.
Halverson, P. K., R. M. Nicola, and E. L. Baker. 1998. Performance measurement and accreditation of public health organizations: a call to action. Journal of Public Health Management and Practice 4 (4):5-7.
Hartley, David, L. Quam, and Nicole Lurie. 1994. Urban and Rural Differences in Health Insurance and Access to care. The Journal of Rural Health 10 (2):98-108.
Hicks, L. L., and J. K. Glenn. 1991. Rural populations and rural physicians: estimates of critical mass ratios, by specialty. Journal of Rural Health 7 (4):357-72.
Hunter, Albert. 1974. Symbolic Communities. Chicago: University of Chicago Press. Hunter, Floyd. 1980. Community Power Succession: Atlanta's Policymakers Revisited. Chapel
Hill, NC: University of North Carolina Press. Institute of Medicine. Committee for the Study of the Future of Public Health. 1988. The Future
of Public Health. Washington, DC: National Academy Press. Irwin, Michael, Charles Tolbert, and Thomas Lyson. 1997. How to build strong home towns.
American Demographics 19 (February):42-48.

37
Jarman, B. 1983. Identification of underprivileged areas. British Medical Journal (Clin Res Ed) 286 (6379):1705-9.
———. 1984. Underprivileged areas: validation and distribution of scores. British Medical Journal (Clin Res Ed) 289 (6458):1587-92.
Johnson, Haynes, and David Broder. 1995. The System, the American Way of Politics at the Breaking Point. Boston: Little, Brown and Company.
Kark, Sidney L., and Guy W. Steuart. 1962. A Practice of Social Medicine. Edinburgh: E. & S. Livingston Ltd.
Kessler, J., M. Whitcomb, and P.T. Williams. 1996. Quality of the Family Physician Component of the AMA Masterfile. Journal of Family Practice 9:94-99.
Kingsley, G. Thomas, ed. 1999. Building and Operating Neighborhood Indicator Systems: A Handbook. Washington, DC: The Urban Institute. National Neighborhood Indicators Partnership.
Kingsley, G. Thomas, Claudia J. Coulton, Michael Barndt, David S. Sawicki, and Peter Tatian. 1997. Mapping Your Community: Using Geographic Information to Strengthen Community Initiatives. Washington, DC: US Department of Housing and Urban Development.
Kircher, T. 1985. The autopsy as a measure of accuracy of the death certificate. New England Journal of Medicine 313:1263-9.
Kivell, P. T., B. J. Turton, and B. R. P. Dawson. 1990. Neighborhood for health service administration. Social Science and Medicine 30 (6):701-711.
Konrad, Thomas R., Rebecca Slifkin, C. Stevens, and J. Miller. 2000. Using the AMA Physician Masterfile to measure physician supply in small towns. Journal of Rural Health 16 (2):162-167.
Kresiberg, Harriet M., John Wu, Edward Hollander, and Joan Bow. 1976. Methodological Approaches for Determining Health Manpower Supply and Requirements. Volume I. Analytical Perspective. In Health Planning Methods and Technology Series. Rockville, MD: National Health Planning Information Center.
Krieger, N. 1992. Overcoming the absence of socioeconomic data in medical records: validation and application of a census-based methodology. American Journal of Public Health 82 (5):703-10.
Krieger, Nancy. 2002. Researcher tries to accurate measure socioeconomic differences and health disparities. Harvard School of Public Health, January 12, 2001 2001 [cited February 21 2002]. Available from www.hsph.harvard.edu/ats/Jan12/jan12_03.html.
Krieger, Nancy, D. R. Williams, and N. E. Moss. 1997. Measuring social class in U.S. public health research: concepts, methodologies and guidelines. Annual Review of Public Health 18:342-78.
Kwok, R. K., and B. C. Yankaskas. 2001. The use of census data for determining race and education as SES indicators: a validation study. Annals of Epidemiology 11 (3):171-7.
Lamphere, JoAnn, Normandy Brangan, Sharon Bee, and Kelly Griffin. 1999. Reforming the Health Care System: State Profiles 1999. Washington, DC: AARP Public Policy Institute.
Lee, Richard. 1979. Designation of health manpower shortage areas for use by Public Health Service programs. Public Health Reports 94 (1):48-59.
Lee, Richard C. 1991. Current approaches to shortage area designation. Journal of Rural Health 7 (4):437-450.

38
Liska, David W., Niall J. Brennan, and Brian K. Bruen. 1998. State-Level Databook on Health Care Access and Financing. Washington, DC: The Urban Institute Press.
Macintyre, Sally, and Anne Ellaway. 2000. Ecological apporaches: rediscovering the role of the physical and social environment. In Social Epidemiology, edited by L. F. Berkman and I. Kawachi. New York: Oxford University Press.
Makuc, D.M., B. Haglund, D.D. Ingram, J.C. Kleinman, and J.J. Feldman. 1991. Health service areas for the United States. Vital & Health Statistics - Series 2: Data Evaluation & Methods Research 112:1-102.
Mays, G. P., and P. K. Halverson. 2000. Conceptual and methodological issues in public health performance measurement: results from a computer-assisted expert panel process. Journal of Public Health Management and Practice 6 (5):59-65.
Meade, Melinda S., and Robert J. Earickson. 2000. Medical Geography. Second ed. New York: The Guilford Press.
MedPAC. 2001. Report to the Congress: Medicare in Rural America. Washington, DC: Medicare Payment Advisory Commission.
Mettee, Thomas M. 1987. Community diagnosis: a tool for COPC. In Community Oriented Primary Care: From Principle to Practice, edited by P. A. Nutting. Albuquerque, NM: The University of New Mexico Press.
Miller, Delbert C. 1991. Handbook of Research Design and Social Measurement. 5th ed. Newbury Park, CA: Sage Publications.
Miller, Michale K., Frank L. Farmer, and Leslie L. Clarke. 1994. Rural Populations and Their Health. In Rural Health Services. A Management Perspective, edited by J. E. Beaulieu and D. E. Berry. Ann Arbor, MI: AUPHA Press/Health Administration Press.
Mohan, John F. 1998. Explaining geographies of health care: a critique. Health & Place 4 (2):113-124.
Morgan, Kathleen O'Leary, and Scott Morgan, eds. 2001. Health Care State Rankings, 2001. Lawrence, KS: Morgan Quitno Press.
Morone, James A. 1990. The Democratic Wish, Popular Participation and the Limits of American Government. New York: Basic Books.
Morris, R., and V. Carstairs. 1991. Which deprivation? A comparison of selected deprivation indexes. J Public Health Med 13 (4):318-26.
Morrisey, M. A. 1993. On defining small areas. Medical Care 31 (5 Suppl):YS89-95. Morrisey, M. A., F. A. Sloan, and J. Valvona. 1988. Defining geographic markets for hospital
care. Law and Contemporary Problems 51 (2):165-94. Morrow, A. 2000. Empowering communities to remove the pump handle. An emerging role in
epidemiology. Annals of Epidemiology 10 (7):451. National Association of County & City Health Officials. 2002. Mobilizing Action through
Planning and Partnerships [Internet]. National Association of County & City Health Officials, US Center for Disease Control and Prevention 2002 [cited February 20 2002]. Available from http://nacchoweb.naccho.org/mapp_introduction.asp.
National Commission on Community Health Services. 1966. Health is a Community Affair. Report. Cambridge, MA: Harvard University Press.
Norris, Tyler, and Mary Pittman. 2000. The healthy communities movement and the Coalition for Healthier Cities and Communities. Public Health Reports 115 (2-3).
39
O'Keeffe, Janet, Kathleen N. Lohr, and Erica R. Brody. 2001. Community Capacity for Improving Population Health: Feasibility and Design Study. Research Triangle Park, NC: Research Triangle Institute.
Office of Disases Prevention and Health Promotion. 2002. Healthy People 2010. US Department of Health and Human Services 2001 [cited February 21 2002]. Available from http://www.health.gov/healthypeople/document/HTML/Volume2/23PHI.htm.
Osterweis, M., C. J. McLaughlin, H. R. Manasse, and C. L. Hopper. 1996. The U.S. Health Workforce: Power, Politics and Policy. Washington, DC: Association of Academic Health Centers.
Pew Charitable Trusts. 1997. Trust and Citizen Engagement in Metropolitan Philadelphia: A Case Study. Philadelphia: Pew Research Center for the People & The Press.
Pickle, Linda Williams, Michael Mungiole, Gretchen K. Jones, and Andrew A. White. 1996. Atlas of United States Mortality. Hyattsville, MD: U.S. Department of Health and Human Services.
Ricketts, Thomas C. 2001. Community Capacity to Improve Population Health: Defining Community. Research Triangle Park: Research Triangle Institute.
———. 2001. The Rural Patient. In Textbook of Rural Medicine, edited by J. P. Geyman, T. E. Norris and L. G. Hart. New York: McGraw-Hill.
Ricketts, Thomas C., L. Gary Hart, and Michael Pirani. 2000. How many rural physicians are there? Journal of Rural Health 16 (3).
Ricketts, Thomas C., Randy Randolph, Hilda Ann Howard, Donald Pathman, and Timothy Carey. 2001. Hospitalization Rates as Indicators of Access to Primary Care. Health & Place 6 (4).
Rushton, Gerald, Gregory Elmes, and Robert McMaster. 2000. Public Health and Human Services. URISA Journal 2000 (under review).
Schur, Claudia L., and Sheila J. Franco. 1999. Access to Health Care. In Rural Health in the United States, edited by T. C. Ricketts. New York: Oxford University Press.
Schur, Claudia L., Cynthia D. Good, and Marc L. Berk. 1998. Barriers to Using National Surveys for Understanding Rural Health Policy Issues. Bethesda, MD: Project HOPE Walsh Center for Rural Health Analysis.
Siegel, Sari. 1998. Access to Primary Health Care: Tracking the States. Washington, DC: National Conference of State Legislatures.
Simpson, Kit N., Susan DesHarnais, Anne Jacobs, and Adrian Menapace. 1994. Methods for defining medical service areas. In Geographic Methods for Health Services Research, edited by T. C. Ricketts, L. A. Savitz, W. Gesler and D. Osborne. Lanhman, MD: University Press of America.
Slifkin, Rebecca T., Laurie J. Goldsmith, and Thomas C. Ricketts. 2000. Race and Place: Urban-Rural Differences in Health for Racial and Ethnic Minorities. Chapel Hill, NC: Rural Health Research and Policy Analysis Program, University of North Carolina at Chapel Hill.
Smeloff, E., and B.W. Kelzer. 1981. A geographic framework for coordination of needs assessment for primary medical care in California. Public Health Reports 96:310-14.
Snow, John. 1936. Snow on Cholera. New York: The Commonwealth Fund. Spitz, Bruce. 1997. Community control in a world of regional delivery systems. Journal of
Health Politics, Policy and Law 22 (4):1021-50.

40
Stano, M. 1991. Further issues in small area variations analysis. Journal of Health Politics, Policy and Law 16 (3):573-88.
Stoto, Michael L., Cynthia Abel, and Anne Dievler, eds. 1996. Health Communities: New Partnerships for the Future of Public Health. Washington, DC: National Academy Press.
Strelnick, A. H. 1990. The community-defining process in COPC. In Community-Oriented Primary Care: From Principle to Practice, edited by P. A. Nutting. Albuquerque: University of New Mexico Press.
Studnicki, J., B. Steverson, B. Myers, A. R. Hevner, and D. J. Berndt. 1997. A community health report card: comprehensive assessment for tracking community health (CATCH). Best Practices and Benchmarking in Healthcare 2 (5):196-207.
Sundquist, J., M. Bajekal, B. Jarman, and S. E. Johansson. 1996. Underprivileged area score, ethnicity, social factors and general mortality in district health authorities in England and Wales. Scandinavian Journal of Primary Health Care 14 (2):79-85.
Taylor, D. H., Jr. 1998. The natural life of policy indices: geographical problem areas in the U.S. and U.K. Social Science & Medicine 47 (6):713-25.
Taylor, Donald H., and Thomas C. Ricketts. 1994. The measurement of underservice and provider shortage in the United States. Chapel Hill, NC: Rural Health Research Program, Cecil G. Sheps Center for Health Services Research, University of North Carolina.
Teachman, Jay D., Karen Carver, and Kathleen Paasch. 1997. Social capital and the generation of human capital: Department of Human Development, Washington State University.
Thorndike, E. L. 1939. Our City. New York: Harcourt Brace. Turnock, Bernard J. 2001. Public Health: What It Is and How It Works. Second ed. Gaithersberg,
MD: Aspen Publishers, Inc. UnitedHealth Group. 2000. The UnitedHealth Group State Health Rankings, 2000 Edition. St.
Paul, MN: UnitedHealth Group. Walsh, S. J., P. H. Page, and W. M. Gesler. 1997. Normative models and healthcare planning:
network-based simulations within a geographic information system environment. Health Services Research 32 (2):243-60.
Weiss, J. E., and M. B. Greenlick. 1970. Determinants of medical care utilization: The effects of social class and distance on contacts with the medical care system. Medical Care 8 (6):456-62.
Weissbourd, Bernice. 2000. Supportive communities for children adn familes. Public Health Reports 115 (2/3):167-173.
Wennberg, JE, and A Gittelsohn. 1973. Small area variations in health care delivery. Science 182:1102-1107.
Wennberg, John E., Elliott S. Fisher, and Jonathan S. Skinner. 2002. Geography and the debate over health reform [Internet]. Preoject HOPE, Health Affairs 2002 [cited February 18, 2002 2002]. Available from www.healthaffairs.org/WebExclusives/Wennberg_Web_Excl_021302.htm.
Williams, P. T., M. Whitcomb, and J. Kessler. 1996. Quality of the family physician component of AMA Masterfile. Journal of the American Board of Family Practice 9 (2):94-9.
Wolfe, Tom. 1999. A Man in Full. New York: Bantam. Albrecht, Stan L., Leslie L. Clarke, and Michael K. Miller. 1998. Community, family, and
race/ethnic differences in health status in rural areas. Rural Sociology 63 (2):235-52.

41
American College of Physicians. 1995. Rural primary care. Annals of Internal Medicine 122 (5):380-90.
Berkman, Lisa F., and Ichiro Kawachi, eds. 2000. Social Epidemiology. New York: Oxford University Press.
Bindman, Andrew B., K. Grumbach, D. Osmond, M. Komaromy, K. Vranzian, N. Lurie, J. Billings, and A. Stewart. 1995. Preventable hospitalizations and access to health care. JAMA 264 (4):305-311.
Blakely, Tony A., Kimberly Lochner, and Ichiro Kawachi. 2002. Metropolitan area income inequality and self-rated health—a multi-level study. Social Science & Medicine 54:65-77.
Bogue, Richard, and Jr. Claude H. Hall, eds. 1997. Health Network Innovations: How 20 Communities are Improving Their Systems Through Collaboration. Chicago: American Hospital Publishing.
Bohland, James, and Paul L. Know. 1989. Growth of Proprietary Hospitals in the United States: A Historical Geograhic Perspective. In Health Services Privatizatrion in Industrial Societies, edited by J. L. Scarpaci. New Brinswick, NJ: Rutgers University Press.
Bosworth, Claud A. 1955. A study of the development and the validation of a measure of citizens' attitudes toward progress and some variables related thereto, University of Michigan, Ann Arbor, MI.
Braden, JJ, and K Beauregard. 1994. Health Status and Access to Care of Rural and Urban Populations. Rockville, MD: Agency for Health Care Policy and Research.
Brasure, Michelle, Sally C. Stearns, Edward C. Norton, and Thomas C. Ricketts. 1999. Competitive behavior in local physician markets. Medical Care Research and Review 56 (4):395-414.
Bullen, Paul, and Jenny Onyx. 1998. Measuring social capital in five communities in New South Wales: Neighborhood and Community Health Centres in New South Wales.
Carstairs, V. 1995. Deprivation indices: their interpretation and use in relation to health. Journal of Epidemiology and Community Health 49 ((Supp) 2):S3-8.
Cherkin, D., and D. Lawrence. 1977. An Evaluation of the American Medical Association's Physician Masterfile as a Data Source—One State's Experience. Medical care 15 (9):767-769.
Conner, Robert A., John E. Kralewski, and Steven D. Hillson. 1994. Measuring geographic access to health care in rural areas. Medical Care Review 51 (3):337-377.
Cook, R. L., R. A. Royce, J. C. Thomas, and B. H. Hanusa. 1999. What's driving an epidemic? The spread of syphilis along an interstate highway in rural North Carolina. American Journal of Public Health 89 (3):369-73.
Dartmouth Medical School. Center for the Evaluative Clinical Sciences. 1998. The Dartmouth Atlas of Health Care 1998. Edited by J. E. Wennberg, The Dartmouth Atlas of Health Care in the United States. Chicago: American Hospital Publishing , Inc.
Diehr, P., K. C. Cain, W. Kreuter, and S. Rosenkranz. 1992. Can small-area analysis detect variation in surgery rates? The power of small-area variation analysis. Medical Care 30 (6):484-502.
Diehr, P., K. Cain, F. Connell, and E. Volinn. 1990. What is too much variation? The null hypothesis in small-area analysis. Health Services Research 24 (6):741-71.
Diez-Roux, Anna V. 1998. Bringing context back into epidemiology: variables and fallacies in multi-level analysis. American Journal of Public Health 88:216-222.

42
Dorch, Jane S., Linda A. Bailey, and Michael A. Stoto, eds. 1997. Improving Health in the Community. A Role for Performance Monitoring. Washington, DC: National Academy Press.
Dubos, Rene. 1961. Mirage of Health. Utopias, Progress, and Biological Change. Garden City, NY: Anchor Books. Original edition, Reprint of Volume XXII of the World Perspectives Series.
Duncan, C., K. Jones, and Graham Moon. 1998. Context, composition, and heterogeneity: using multi-level models in health research. Social Science and Medicine 46:97-117.
Eberhardt, M. S., D. D. Ingram, Diane M. Makuc, Else R. Pamuk, Virginia M. Freid, Sam B. Harper, Charlotte A. Schoenorn, and Henry Xia. 2001. Urban and Rural Chartbook. Health United States, 2001, Health, United States. Washington, DC: U.S. Government Printing Office.
Epling, Philip J., Susan E. Vandale, and Guy W. Steuart. 1975. Beyond the individual for the practice of social medicine: household networks as etiologic-diagnostic units. In Topias and Utopias in Health. Policy Studies, edited by S. R. Ingman and A. E. Thomas. The Hague: Mouton.
Fessler, Donald R. 1952. The development of a scale for measuring community solidarity. Rural Sociology 17:144-52.
Florin, John, Wilbert M. Gesler, Lucy A. Savitz, and Lise K. Fondren. 1994. Regionalization of health care. In Geographic Methods for Health Services Research, edited by T. C. Ricketts, L. A. Savitz, W. M. Gesler and D. N. Osborne. Lanham, MD: University Press of America.
Galper, Joshua. 1998. An exploration of social capital, giving, and volunteering at the United States county level. Washington, DC: The Urban Institute.
Gerzoff, Robert B., and G. David Williamson. 2001. Who's Number One? The impact of variablility on rankings based on public health indicators. Public Health Reports 116 (2):158-64.
Gesler, W. M., and M. S. Meade. 1988. Locational and population factors in health care-seeking behavior in Savannah, Georgia. Health Services Research 23 (3):443-62.
Ghelfi, Linda, and Timothy Parker. 1997. A county-level measure of urban influence. Washington, DC: Economic Research Service, U.S. Department of Agriculture.
Giddens, Anthony. 1984. The Constitution of Society. First paperback edition ed. Berkeley, CA: University of California Press.
Girt, L. L. 1973. Distance to general medical practice and its effects on revealed ill-health in a rural environment. Canadian Geographer 17:154-166.
Goodman, R., and R. Berkelman. 1987. Physicians, vital statistics, and disease reporting. New England Journal of Medicine 258:379.
Grumbach, K., S. H. Becker, E. H. Osborn, and A. B. Bindman. 1995. The challenge of defining and counting generalist physicians: an analysis of Physician Masterfile data. American Journal of Public Health 85 (10):1402-7.
Halverson, P. K. 2000. Performance measurement and performance standards: old wine in new bottles [editorial]. Journal of Public Health Management and Practice 6 (5):vi-x.
Halverson, P. K., R. M. Nicola, and E. L. Baker. 1998. Performance measurement and accreditation of public health organizations: a call to action. Journal of Public Health Management and Practice 4 (4):5-7.

43
Hartley, David, L. Quam, and Nicole Lurie. 1994. Urban and Rural Differences in Health Insurance and Access to care. The Journal of Rural Health 10 (2):98-108.
Hicks, L. L., and J. K. Glenn. 1991. Rural populations and rural physicians: estimates of critical mass ratios, by specialty. Journal of Rural Health 7 (4):357-72.
Holland, W. W., ed. 1988. European Community Atlas of 'Avoidable Death'. Oxford: Oxford University Press.
Hunter, Floyd. 1980. Community Power Succession: Atlanta's Policymakers Revisited. Chapel Hill, NC: University of North Carolina Press.
Institute of Medicine. Committee for the Study of the Future of Public Health. 1988. The Future of Public Health. Washington, DC: National Academy Press.
Irwin, Michael, Charles Tolbert, and Thomas Lyson. 1997. How to build strong home towns. American Demographics 19 (February):42-48.
Jarman, B. 1983. Identification of underprivileged areas. British Medical Journal (Clin Res Ed) 286 (6379):1705-9.
———. 1984. Underprivileged areas: validation and distribution of scores. British Medical Journal (Clin Res Ed) 289 (6458):1587-92.
Johnson, Haynes, and David Broder. 1995. The System, the American Way of Politics at the Breaking Point. Boston: Little, Brown and Company.
Joseph, Alun E., and David R. Phillips. 1984. Accessibility & Utilization. Geographical Perspectives on Health Care Delivery. New Yor: Harper & Row.
Kark, Sidney L., and Guy W. Steuart. 1962. A Practice of Social Medicine. Edinburgh: E. & S. Livingston Ltd.
Kawachi, I., B. P. Kennedy, K. Lochner, and D. Prothrow-Stith. 1997. Social capital, income inequality, and mortality. American Journal of Public Health 87 (9):1491-8.
Kessler, J., M. Whitcomb, and P.T. Williams. 1996. Quality of the Family Physician Component of the AMA Masterfile. Journal of Family Practice 9:94-99.
Kingsley, G. Thomas, ed. 1999. Building and Operating Neighborhood Indicator Systems: A Handbook. Washington, DC: The Urban Institute. National Neighborhood Indicators Partnership.
Kingsley, G. Thomas, Claudia J. Coulton, Michael Barndt, David S. Sawicki, and Peter Tatian. 1997. Mapping Your Community: Using Geographic Information to Strengthen Community Initiatives. Washington, DC: US Department of Housing and Urban Development.
Kircher, T. 1985. The autopsy as a measure of accuracy of the death certificate. New England Journal of Medicine 313:1263-9.
Kivell, P. T., B. J. Turton, and B. R. P. Dawson. 1990. Neighborhood for health service administration. Social Science and Medicine 30 (6):701-711.
Konrad, Thomas R., Rebecca Slifkin, C. Stevens, and J. Miller. 2000. Using the AMA Physician Masterfile to measure physician supply in small towns. Journal of Rural Health 16 (2):162-167.
Kresiberg, Harriet M., John Wu, Edward Hollander, and Joan Bow. 1976. Methodological Approaches for Determining Health Manpower Supply and Requirements. Volume I. Analytical Perspective. In Health Planning Methods and Technology Series. Rockville, MD: National Health Planning Information Center.

44
Krieger, N. 1992. Overcoming the absence of socioeconomic data in medical records: validation and application of a census-based methodology. American Journal of Public Health 82 (5):703-10.
Krieger, Nancy. 2002. Researcher tries to accurate measure socioeconomic differences and health disparities. Harvard School of Public Health, January 12, 2001 2001 [cited February 21 2002]. Available from www.hsph.harvard.edu/ats/Jan12/jan12_03.html.
Krieger, Nancy, D. R. Williams, and N. E. Moss. 1997. Measuring social class in U.S. public health research: concepts, methodologies and guidelines. Annual Review of Public Health 18:342-78.
Kwok, R. K., and B. C. Yankaskas. 2001. The use of census data for determining race and education as SES indicators: a validation study. Annals of Epidemiology 11 (3):171-7.
Lamphere, JoAnn, Normandy Brangan, Sharon Bee, and Kelly Griffin. 1999. Reforming the Health Care System: State Profiles 1999. Washington, DC: AARP Public Policy Institute.
Lee, Richard. 1979. Designation of health manpower shortage areas for use by Public Health Service programs. Public Health Reports 94 (1):48-59.
Lee, Richard C. 1991. Current approaches to shortage area designation. Journal of Rural Health 7 (4):437-450.
Liska, David W., Niall J. Brennan, and Brian K. Bruen. 1998. State-Level Databook on Health Care Access and Financing. Washington, DC: The Urban Institute Press.
Macintyre, Sally, and Anne Ellaway. 2000. Ecological apporaches: rediscovering the role of the physical and social environment. In Social Epidemiology, edited by L. F. Berkman and I. Kawachi. New York: Oxford University Press.
Makuc, D.M., B. Haglund, D.D. Ingram, J.C. Kleinman, and J.J. Feldman. 1991. Health service areas for the United States. Vital & Health Statistics - Series 2: Data Evaluation & Methods Research 112:1-102.
Mays, G. P., and P. K. Halverson. 2000. Conceptual and methodological issues in public health performance measurement: results from a computer-assisted expert panel process. Journal of Public Health Management and Practice 6 (5):59-65.
Meade, Melinda S., and Robert J. Earickson. 2000. Medical Geography. Second ed. New York: The Guilford Press.
MedPAC. 2001. Report to the Congress: Medicare in Rural America. Washington, DC: Medicare Payment Advisory Commission.
Mellor, Jennifer M., and Jeffrey Milyo. 2001. Re-examining the evidence of an ecological association between income inequality and health. Journal of Health Politics, Policy and Law 26 (3):487-522.
Mettee, Thomas M. 1987. Community diagnosis: a tool for COPC. In Community Oriented Primary Care: From Principle to Practice, edited by P. A. Nutting. Albuquerque, NM: The University of New Mexico Press.
Miller, Delbert C. 1991. Handbook of Research Design and Social Measurement. 5th ed. Newbury Park, CA: Sage Publications.
Miller, Michale K., Frank L. Farmer, and Leslie L. Clarke. 1994. Rural Populations and Their Health. In Rural Health Services. A Management Perspective, edited by J. E. Beaulieu and D. E. Berry. Ann Arbor, MI: AUPHA Press/Health Administration Press.
Mohan, John F. 1998. Explaining geographies of health care: a critique. Health & Place 4 (2):113-124.

45
Morgan, Kathleen O'Leary, and Scott Morgan, eds. 2001. Health Care State Rankings, 2001. Lawrence, KS: Morgan Quitno Press.
Morone, James A. 1990. The Democratic Wish, Popular Participation and the Limits of American Government. New York: Basic Books.
Morris, R., and V. Carstairs. 1991. Which deprivation? A comparison of selected deprivation indexes. Journal of Public Health Medicine 13 (4):318-26.
Morrisey, M. A. 1993. On defining small areas. Medical Care 31 (5 Suppl):YS89-95. Morrisey, M. A., F. A. Sloan, and J. Valvona. 1988. Defining geographic markets for hospital
care. Law and Contemporary Problems 51 (2):165-94. Morrow, A. 2000. Empowering communities to remove the pump handle. An emerging role in
epidemiology. Annals of Epidemiology 10 (7):451. National Association of County & City Health Officials. 2002. Mobilizing Action through
Planning and Partnerships [Internet]. National Association of County & City Health Officials, US Center for Disease Control and Prevention 2002 [cited February 20 2002]. Available from http://nacchoweb.naccho.org/mapp_introduction.asp.
National Commission on Community Health Services. 1966. Health is a Community Affair. Report. Cambridge, MA: Harvard University Press.
Norris, Tyler, and Mary Pittman. 2000. The healthy communities movement and the Coalition for Healthier Cities and Communities. Public Health Reports 115 (2-3).
O'Keeffe, Janet, Kathleen N. Lohr, and Erica R. Brody. 2001. Community Capacity for Improving Population Health: Feasibility and Design Study. Research Triangle Park, NC: Research Triangle Institute.
Office of Disases Prevention and Health Promotion. 2002. Healthy People 2010. US Department of Health and Human Services 2001 [cited February 21 2002]. Available from http://www.health.gov/healthypeople/document/HTML/Volume2/23PHI.htm.
Osterweis, M., C. J. McLaughlin, H. R. Manasse, and C. L. Hopper. 1996. The U.S. Health Workforce: Power, Politics and Policy. Washington, DC: Association of Academic Health Centers.
Pew Charitable Trusts. 1997. Trust and Citizen Engagement in Metropolitan Philadelphia: A Case Study. Philadelphia: Pew Research Center for the People & The Press.
Pickle, Linda Williams, Michael Mungiole, Gretchen K. Jones, and Andrew A. White. 1996. Atlas of United States Mortality. Hyattsville, MD: U.S. Department of Health and Human Services.
Ricketts, Thomas C. 2001. Community Capacity to Improve Population Health: Defining Community. Research Triangle Park: Research Triangle Institute.
———. 2001. The Rural Patient. In Textbook of Rural Medicine, edited by J. P. Geyman, T. E. Norris and L. G. Hart. New York: McGraw-Hill.
Ricketts, Thomas C., L. Gary Hart, and Michael Pirani. 2000. How many rural physicians are there? Journal of Rural Health 16 (3).
Ricketts, Thomas C., Randy Randolph, Hilda Ann Howard, Donald Pathman, and Timothy Carey. 2001. Hospitalization Rates as Indicators of Access to Primary Care. Health & Place 6 (4).
Rushton, Gerald, Gregory Elmes, and Robert McMaster. 2000. Public Health and Human Services. URISA Journal 2000 (under review).
Schur, Claudia L., and Sheila J. Franco. 1999. Access to Health Care. In Rural Health in the United States, edited by T. C. Ricketts. New York: Oxford University Press.

46
Schur, Claudia L., Cynthia D. Good, and Marc L. Berk. 1998. Barriers to Using National Surveys for Understanding Rural Health Policy Issues. Bethesda, MD: Project HOPE Walsh Center for Rural Health Analysis.
Siegel, Sari. 1998. Access to Primary Health Care: Tracking the States. Washington, DC: National Conference of State Legislatures.
Simpson, Kit N., Susan DesHarnais, Anne Jacobs, and Adrian Menapace. 1994. Methods for defining medical service areas. In Geographic Methods for Health Services Research, edited by T. C. Ricketts, L. A. Savitz, W. Gesler and D. Osborne. Lanhman, MD: University Press of America.
Slifkin, Rebecca T., Laurie J. Goldsmith, and Thomas C. Ricketts. 2000. Race and Place: Urban-Rural Differences in Health for Racial and Ethnic Minorities. Chapel Hill, NC: Rural Health Research and Policy Analysis Program, University of North Carolina at Chapel Hill.
Smeloff, E., and B.W. Kelzer. 1981. A geographic framework for coordination of needs assessment for primary medical care in California. Public Health Reports 96:310-14.
Snow, John. 1936. Snow on Cholera. New York: The Commonwealth Fund. Spitz, Bruce. 1997. Community control in a world of regional delivery systems. Journal of
Health Politics, Policy and Law 22 (4):1021-50. Stano, M. 1991. Further issues in small area variations analysis. Journal of Health Politics,
Policy and Law 16 (3):573-88. Stoto, Michael L., Cynthia Abel, and Anne Dievler, eds. 1996. Health Communities: New
Partnerships for the Future of Public Health. Washington, DC: National Academy Press. Strelnick, A. H. 1990. The community-defining process in COPC. In Community-Oriented
Primary Care: From Principle to Practice, edited by P. A. Nutting. Albuquerque: University of New Mexico Press.
Studnicki, J., B. Steverson, B. Myers, A. R. Hevner, and D. J. Berndt. 1997. A community health report card: comprehensive assessment for tracking community health (CATCH). Best Practices and Benchmarking in Healthcare 2 (5):196-207.
Sundquist, J., M. Bajekal, B. Jarman, and S. E. Johansson. 1996. Underprivileged area score, ethnicity, social factors and general mortality in district health authorities in England and Wales. Scandinavian Journal of Primary Health Care 14 (2):79-85.
Taylor, D. H., Jr. 1998. The natural life of policy indices: geographical problem areas in the U.S. and U.K. Social Science & Medicine 47 (6):713-25.
Taylor, Donald H., and Thomas C. Ricketts. 1994. The measurement of underservice and provider shortage in the United States. Chapel Hill, NC: Rural Health Research Program, Cecil G. Sheps Center for Health Services Research, University of North Carolina.
Teachman, Jay D., Karen Carver, and Kathleen Paasch. 1997. Social capital and the generation of human capital: Department of Human Development, Washington State University.
Thorndike, E. L. 1939. Our City. New York: Harcourt Brace. Townsend, P. 1987. Deprtivation. Social Policy 16:125-46. Turnock, Bernard J. 2001. Public Health: What It Is and How It Works. Second ed. Gaithersberg,
MD: Aspen Publishers, Inc. UnitedHealth Group. 2000. The UnitedHealth Group State Health Rankings, 2000 Edition. St.
Paul, MN: UnitedHealth Group.

47
Voorhees, C. C., R. T. Swank, F. A. Stillman, D. X. Harris, H. W. Watson, Jr., and D. M. Becker. 1997. Cigarette sales to African-American and white minors in low-income areas of Baltimore. American Journal of Public Health 87 (4):652-4.
Walsh, S. J., P. H. Page, and W. M. Gesler. 1997. Normative models and healthcare planning: network-based simulations within a geographic information system environment. Health Services Research 32 (2):243-60.
Weiss, J. E., and M. B. Greenlick. 1970. Determinants of medical care utilization: The effects of social class and distance on contacts with the medical care system. Medical Care 8 (6):456-62.
Weissbourd, Bernice. 2000. Supportive communities for children adn familes. Public Health Reports 115 (2/3):167-173.
Wennberg, JE, and A Gittelsohn. 1973. Small area variations in health care delivery. Science 182:1102-1107.
Wennberg, John E., Elliott S. Fisher, and Jonathan S. Skinner. 2002. Geography and the debate over health reform [Internet]. Preoject HOPE, Health Affairs 2002 [cited February 18, 2002 2002]. Available from www.healthaffairs.org/WebExclusives/Wennberg_Web_Excl_021302.htm.
Williams, P. T., M. Whitcomb, and J. Kessler. 1996. Quality of the family physician component of AMA Masterfile. Journal of the American Board of Family Practice 9 (2):94-9.
Wolfe, Tom. 1999. A Man in Full. New York: Bantam.