geology and ground-water resources of the balmorhea · pdf filegeology and ground-water...
TRANSCRIPT
PLANNING FILES
If you do not need this publication after it has served your purpose, please return it to the Geological Survey, using the official mailing label at the end
UNITED STATES DEPARTMENT OF THE INTERIOR
GEOLOGY AND GROUND-WATER
RESOURCES OF THE BALMORHEA AREA
WESTERN TEXAS
Prepared in cooperation with the
TEXAS BOARD OF WATER ENGINEERS
GEOLOGICAL SURVEY WATER-SUPPLY PAPER 849-C
UNITED STATES DEPARTMENT OF THE INTERIOR Harold L. Ickes, Secretary
GEOLOGICAL SURVEY W. C. Mendenhall, Director
Water-Supply Paper 849-C
GEOLOGY AND GROUND-WATERRESOURCES OF THE BALMORHEA AREA
WESTERN TEXAS
BY
WALTER N. WHITE, HOYT S. GALE, AND S. SPENCER NYE
Prepared in cooperation with the
TEXAS BOARD OF WATER ENGINEERS
Contributions to the hydrology of the United States, 1940 (Pages 83-146)
UNITED STATES
GOVERNMENT PRINTING OFFICE
WASHINGTON : 1941
For sale by the Superintendent of Documents, Washington, D. C. ....... Price 15 cents

CONTENTS
Abstract____.______________________________________ 83Introduction ______________________________________________________ 84
Purpose and scope of the investigation__________________________ 84Acknowledgments ______________________________________ _ ____ 85
Topography and drainage._________________________________________ 86Climate. _______________________________________________ 87General geology___________________________________________________ 90'
Lower Cretaceous rocks________________________________________ 90Upper Cretaceous rocks._______________________________________ 91Tertiary volcanic rocks_______________________________________ 9£Late Tertiary, Pleistocene, and Recent alluvial deposits.__________ 94
Geologic structure and its relation to the occurrence of the ground water. _ ' 94Springs_______________________________________________________ 97
Artesian springs.______________________________________________ 98Gravity springs______________________________________________ 102
Shallow ground water._____________________________________________ 104Records of wells_______________________________________________ 107Depth to water level_________________._________________________ 108
Intake of ground water.____________________________________________ 112Areas of intake______-_________________________________________ 112Intake from streams.__________________________________________ 113
Limpia Creek.____________________________________________ 114Madera Canyon.__________________________________________ 116Cherry Canyon__________________________________________ 117Big Aguja Canyon_______________________________________ 117Little Aguja Canyon_______________________________________ 118
Discharge of ground water__________________________________________ 118Conclusions.______________________________________________________ 119Records of discharge and seepage__________-_____________------______ 121Index__________________________________________________________ 145
ILLUSTRATIONS
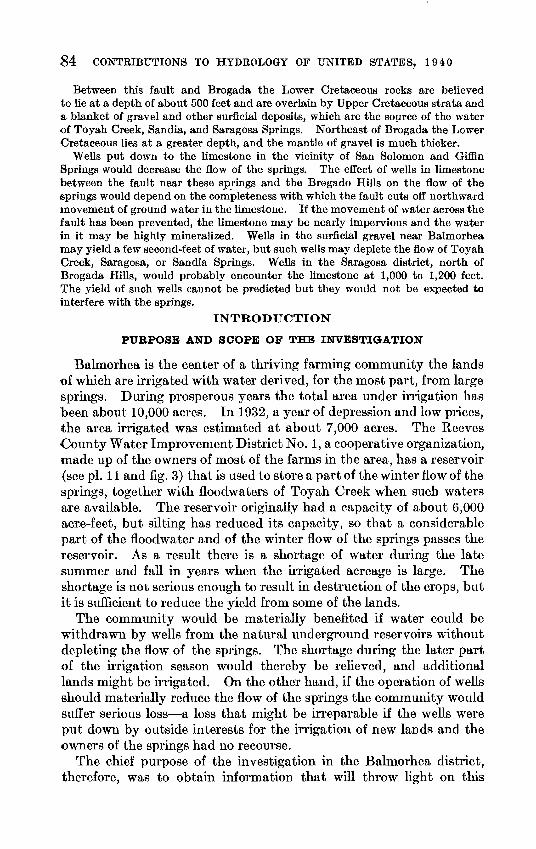
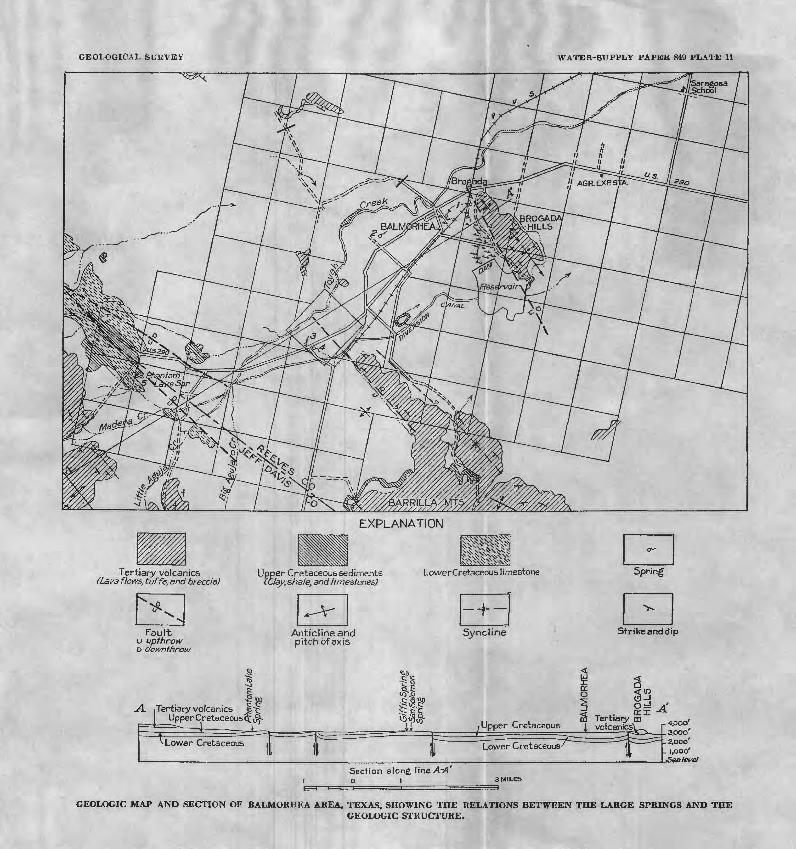
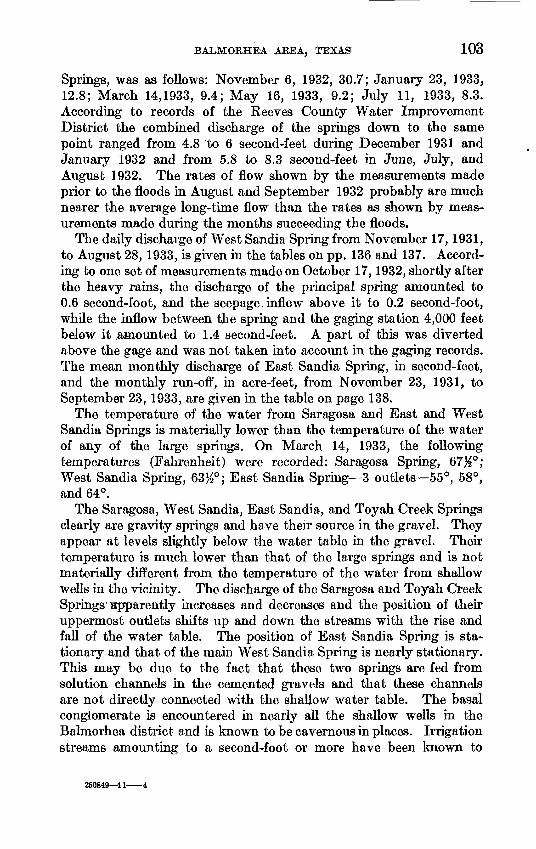
Page PLATE 11. Geologic map and section of Balmorhea area, Tex., showing the
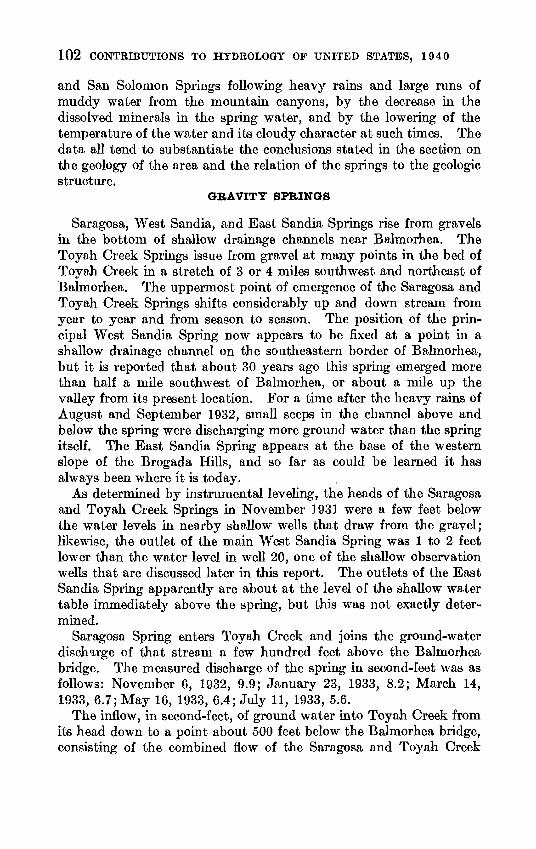
relations between the large springs and the geologic structure. 94 FIGURE 3. Map of the vicinity of Balmorhea, Tex., showing wells and
springs and approximate shape and slope of water table.___ 105 4. Map of part of Toyah Basin, Tex., showing the springs and
areas of ground-water intake near Balmorhea _____________ 113-
GEOLOGY AND GROUND-WATER RESOURCES OP THE BALMORHEA AREA, WESTERN TEXAS
By WALTER N. WHITE, HOYT S. GALE, and S. SPENCER NYE
ABSTRACT
Balmorhea is the center of a thriving farming community, the landa of which are irrigated with water derived chiefly from large springs but partly from the storm flow of Toyah Creek. The storm flow of the creek and a part of the winter flow of the springs is stored in a reservoir near Balmorhea and used later to supplement the flow of the springs. The present investigation was made to determine the geologic and hydrologic relations of the springs, whether additional water can be obtained from wells, and what effect the withdrawal of large amounts of water from wells would have upon the discharge of the springs.
Balmorhea is situated near the foot of the Davis and Barrilla Mountains and along the southwestern margin of the Toyah Basin. The mountains and adjacent basin are drained by Toyah and Limpia Creeks. The group of springs around Balmorhea occur in the floor of the valley of Toyah Creek. They have been divided into artesian springs Phantom Lake, Giffin and San Solomon Springs; and gravity springs Toyah Creek, Saragosa, East Sandia and West Sandia Springs. The combined discharge of the springs during dry years is about 23,000 gallons a minute, of which amount the artesian springs supply more than 90 percent.
The underground reservoir which supplies the artesian springs is the fractured and cavernous Lower Cretaceous limestone. This limestone, about 500 feet thick, is underlain by impermeable rocks, probably of Permian age, and is overlain by impermeable Upper Cretaceous strata that have a maximum thickness of about 500 feet. These are in turn overlain in the mountains by Tertiary lava and on the plains by gravel and other surficial deposits. The Lower Cretaceous limestone is at the surface or covered by a thin layer of gravel in a belt that lies athwart the stream channels and extends from Gomez Peak southeastward along the foothills of the Davis Mountains. In this belt all the streams suffer heavy seepage losses. From this belt the limestone dips gently northeastward to the axis of a northwest ward-trending syncline and then rises to the surface in the vicinity of Phantom Lake, where a part of the water is discharged. About 1,000 feet northeast of this lake is a northwestward-trending fault of small displacement, on the northeast side of which the limestone is downthrown. Northeastward from this fault the lime stone rises gently and appears at the surface about a mile to the northeast, where it is again downfaulted, but the throw is not sufficient to affect the movement of the water. For several miles to the north the water-bearing Lower Cretaceous limestone is covered by 400 to 500 feet of impermeable Upper Cretaceous strata.
It is believed that the Lower Cretaceous rocks are again near the surface and covered by only a thin mantle of gravel and other surficial deposits at San Solomon and Giffin Springs and that just northeast of the springs a fault crosses the valley along which the impermeable Upper Cretaceous rocks are faulted into a position opposite the Lower Cretaceous rocks, thus obstructing further northward move ment of the water in the Lower Cretaceous limestone and forcing it to issue as large springs.
83
84 CONTRIBUTIONS TO HYDROLOGY OF UNITED STATES, 1940
Between this fault and Brogada the Lower Cretaceous rocks are believed to lie at a depth of about 500 feet and are overlain by Upper Cretaceous strata and & blanket of gravel and other surficial deposits, which are the source of the water of Toyah Creek, Sandia, and Saragosa Springs. Northeast of Brogada the Lower Cretaceous lies at a greater depth, and the mantle of gravel is much thicker.
Wells put down to the limestone in the vicinity of San Solomon and Giffin Springs would decrease the flow of the springs. The effect of wells in limestone between the fault near these springs and the Brogado Hills on the flow of the springs would depend on the completeness with which the fault cuts off northward movement of ground water in the limestone. If the movement of water across the fault has been prevented, the limestone may be nearly impervious and the water in it may be highly mineralized. Wells in the surficial gravel near Balmorhea may yield a few second-feet of water, but such wells may deplete the flow of Toyah Creek, Saragosa, or Sandia Springs. Wells in the Saragosa district, north of Brogada Hills, would probably encounter the limestone at 1,000 to 1,200 feet. The yield of such wells cannot be predicted but they would not be expected to interfere with the springs.
INTRODUCTION
PURPOSE AND SCOPE OF THE INVESTIGATION
Balmorhea is the center of a thriving farming community the lands of which are irrigated with water derived, for the most part, from large springs. During prosperous years the total area under irrigation has been about 10,000 acres. In 1932, a year of depression and low prices, the area irrigated was estimated at about 7,000 acres. The Reeves County Water Improvement District No. 1, a cooperative organization, made up of the owners of most of the farms in the area, has a reservoir (see pi. 11 and fig. 3) that is used to store a part of the winter flow of the springs, together with floodwaters of Toyah Creek when such waters are available. The reservoir originally had a capacity of about 6,000 acre-feet, but silting has reduced its capacity, so that a considerable part of the floodwater and of the winter flow of the springs passes the reservoir. As a result there is a shortage of water during the late summer and fall in years when the irrigated acreage is large. The shortage is not serious enough to result in destruction of the crops, but it is sufficient to reduce the yield from some of the lands.
The community would be materially benefited if water could be withdrawn by wells from the natural underground reservoirs without depleting the flow of the springs. The shortage during the later part of the irrigation season would thereby be relieved, and additional lands might be irrigated. On the other hand, if the operation of wells should materially reduce the flow of the springs the community would suffer serious loss a loss that might be irreparable if the wells were put down by outside interests for the irrigation of new lands and the owners of the springs had no recourse.
The chief purpose of the investigation in the Balmorhea district, therefore, was to obtain information that will throw light on this
BALMORHEA AREA, TEKAS 85
problem. A necessary part of the investigation was the compiling of an authoritative record of the flow of the springs, which will serve as evidence, if necessary, to protect the rights of the owners of the springs.
The field work was done chiefly in the years 1931-33. The geology of the Davis and Barrilla Mountains and the Bahnorhea district was studied. Weirs and automatic water-stage recorders were maintained for about 2 years on Phantom Lake, San Solomon, Gifiin, West Sandia, and East Sandia Springs, by means of which continuous records were obtained. Gages were installed on Limpia Creek and the streams in Cherry, Madera, Big Aguja, and Little Aguja Canyons, and a water- stage recorder was maintained hi Madera Canyon. Several series of measurements were made with current meters along these streams in order to determine losses by seepage and gains by ground-water inflow in several relatively short stretches. Discharge measurements were made to determine losses by seepage from the main canal and laterals of the Reeves County Water Improvement District No. 1. The water table in the valley of Toyah Creek near Bahnorhea was mapped. The depths to the water levels in 13 selected shallow wells were measured monthly and sometimes weekly for nearly two years, and a water-stage recorder was maintained on one of the wells for about 1% years. Analyses were made of the waters of the large springs.
In general, the parts of this report dealing with geology were pre pared by Hoyt S. Gale, and the parts dealing with ground water condi tions by Walter N. White and S. Spencer Nye. Preliminary studies of the geology and ground water conditions of this area and the suiTounding region were made by S. S. Nye. Most of the measure ments of the flow of the springs and streams were made by V. W. Rupp. The investigation was conducted under the general direction of O. E. Meinzer, geologist in charge of the Ground Water Division of the Geological Survey.
ACKNOWLEDGMENTS
The writers are indebted to H. P. Bybee, of the University of Texas, and to P. B. King, of the Geological Survey of the United States Department of the Interior, for geologic data supplied by them and for their helpful criticism, and to J. J. Bayles, in charge of the Texas Agricultural Farm near Bahnorhea, for climatologic and other data. Special acknowledgments are due the board of directors of the Reeves County Water Improvement District No. 1 for their cooperation. Mr. A. C. Shreyer gave valuable assistance and advice. Mr. Edgar George and Mr. T. M. Delaiiey gave efficient assistance in the field and otherwise expedited the investigation.
86 CONTRIBUTIONS TO HYDROLOGY OF UNITED STATES, 1940
TOPOGRAPHY AND DRA NAGE
Balmorhea has an altitude of about 3,200 feet. It is situated on the southwestern margin of the Toyah Basin outwash plain, on Toyah Creek, near the foot of the Davis and Barrilla Mountains (see fig. 3). These mountains are characterized by flat tops, steep slopes, and narrow V-shaped canyons. Most of the summits of the Davis Mountains are 5,000 to 6,000 feet above sea level, but Star Mountain and Timber Mountain, two of the most conspicuous flat-topped mountains in this part of the range, rise to 6,350 and 6,442 feet, respectively. The highest peak in the Barrilla Range reaches an altitude of 5,560 feet. The surface between the mountains and Balmorhea and around Balmorhea is broken by several low ridges or isolated hills. These include a ridge or line of low hills between Balmorhea and the Davis Mountains, which is parallel to the front of the mountains, and a narrow northwest-southeast ridge about 3 miles long east of Balmorhea, which is known as the Brogada Hills. The mountains and adjacent plain are drained by Toyah Creek, which is formed about 6 miles southwest of Balmorhea by the junc tion of streams flowing from Big Aguja, Little Aguja, and Madera Canyons. Toyah Creek at times carries great quantities of storm water, but generally it is dry except for a short stretch of about 4 miles near Balmorhea, in which there is a perennial flow of spring water. Most of the storm water is diverted near Balmorhea into a reservoir belonging to the Reeves County Water Improvement Dis trict No. 1. During heavy floods a part of the water passes the reservoir diversion dam and either seeps into the gravels of the out- wash plain or empties into Toyah Lake, which is about 30 miles to the north. The adjacent area on the north is drained by a creek flowing from Cherry Canyon and that on the south by Limpia Creek, which in part of its course is called Barrilla Draw. Both have peren nial flow in the mountains but lose their water soon after reaching the foothills. Both carry large amounts of floodwater at times.
The Toyah Basin is noted for its two groups of large springs, one of which is located near Bahnorhea and the other near Fort Stockton. The Balmorhea group consists of six springs, or groups of springs, that appear at irregular intervals in the floor of the valley of Toyah Creek, called Phantom Lake, San Solomon, Giffin, Saragosa, West Sandia, and East Sandia Springs, and another minor group of springs and seeps that rise in the bed of Toyah Creek. The location of all these springs is shown on plate 11 and on figures 3 and 4. San Solo mon Spring, Phantom Lake Spring, and Giffin Spring rise from a vast reservoir in cavernous limestone. The others have their source
BALMORHEA AREA, TEXAS' 87
in relatively shallow sand and gravel and are essentially water-table springs.
The springs have a combined discharge of about 23,000 gallons a minute during dry years and a much larger discharge during wet years. Measurements of the discharge of all the springs are given on pages 121-144.
CLIMATE
The climate of Balmorhea and the adjacent region is semiarid, and in most years farming cannot be carried on successfully without irrigation. In summer the days are hot but the nights are cool. The winters are comparatively mild, but killing frosts are not un common between November and March.
The United States Weather Bureau has obtained records of pre cipitation at the State Agricultural Experiment Station, near Bal morhea, since 1923; at Fort Davis, 30 miles south of Balmorhea, dur ing 55 years since 185.7; and at Fort Stockton, 50 miles east of Bal morhea, during 60 years since 1870. The average annual precipita tion during the periods of observation down to 1936, inclusive, was as follows: Balmorhea, 13.43 inches; Fort Davis, 16.51 inches; and Fort Stockton, 14.89 inches.
In most years between 1924 and 1936 the precipitation at the three stations showed a similar trend, but there were exceptions to that general rule. For example, in 1933 the precipitation was about the average at Fort Stockton, but it was much below the average at Balmorhea and at Fort Davis; in 1936 it reached well above the average at Fort Davis and about the average at Balmorhea, but it was below the average at Fort Stockton. If the long-time records at Fort Davis and Fort Stockton are accepted as a basis for estimate, it would appear that the average annual precipitation at Bahnorhea from 1924 to 1936 did not differ materially from the long-time average in that vicinity but that the proportion of very dry years, namely 4 out of 13, was unusually high. Exceptional years in the Balmorhea record were 1932, with a precipitation of 28.15 inches; 1933, with only 6.43 inches, and 1934, with 3.89 inches.
The precipitation in the Davis Mountains averages considerably higher than that at Bahnorhea, but no accurate information is avail able from which a comparison can be made. Some pine timber is found on the tops of the mountains, notably on Timber Mountain, but the mountain vegetation in general consists of cedars and brush and shrubs that are common to semiarid regions. The rain storms, par ticularly in summer, are erratic. Rain often falls in the mountains when none falls at Balmorhea, and sometimes the opposite occurs.
260849-41-
88 CONTRIBUTIONS TO HYDROLOGY OF UNITED STATES, 1940
At times rain falls on a part of the mountains and produces a run of storm water in one canyon, while in adjacent areas the canyon streams remain dry.
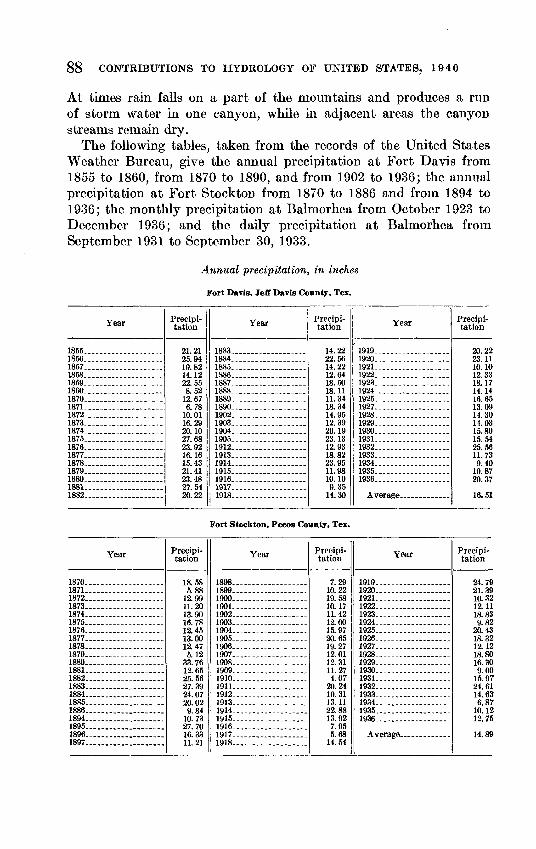
The following tables, taken from the records of the United States Weather Bureau, give the annual precipitation at Fort Davis from 1855 to 1860, from 1870 to 1890, and from 1902 to 1936; the annual precipitation at Fort Stockton from 1870 to 1886 and from 1894 to 1936; the monthly precipitation at Balmorhea from October 1923 to December 1936; and the daily precipitation at Balmorhea from September 1931 to September 30, 1933.
Annual precipitation, in inches
Fort Davis, Jeff Davis County, Tez.
Year
1855....................1856.. ............... ...1857........ ...... ......1858...................1859 -_.--- - I860.. __ _-. ..........1870- .- - -1871 .................1872... . .............. ..1873-.-..-........-...1874........ ............1875.. ................ ..1876...... ..............1877- ..............1878 - 1879 1880.. ...............1881 ...... ...... ..1882 .................
Precipi tation
21.21
14.12
8.5212.676.78
10.0116.2920.1027.6823.9216.1615.4321.4123.4827.5420.22
Year
1883.... ............ ...1884 .1885.... ... ............1886... ...... ........ -1887 . .......... ....1888. . .........1889. 1890-...... .........1902.. ........ ......1903. _ . _ _._1904...... ___ .... _ .1905. . ............1912. 1913 . 1914. 1915 1916 1917 1918 .
Precipi tation
14.2222.5614.2212.6418.5018.1111.3418.3414.9512.3920.1923.1312.9318.8223.9511.9810.109.35
14.30
Year
1919 1920 1921. 1922 1923.... .... 1924 1925 . 1927 1928 ..........1929. 1930...... ..... ...... ..1931. 1932.- .-. 1933 .1934... ... ...... .1935... ... _ .......1936
Precipi tation
20.22
12.3318.1714.1416.6513. Oft14.3014.0315,8015.5425.56
9.4010.8720.37
16.51
Fort Stockton, Pecos County, Tez.
Year
1870 1871 1872 1873 1874 1875 1876 ..1877 1878 1879 ... 1880 1881 1882 . 1883 ...1884 ..1885........ ............1886 . __ .......1894 1895- __ .... _ .......1896 . ___ ........1897- ____ ...........
Precipi tation
18.585.88
19 QQ
11.2013.9016.7812.4513.0012.47
5 19
33.7612.6525.5627.3924.07
9.8410.7327.7016.3311.21
Year
1898. . 1899 . 1900 .. ..1901 1902... ........ ..._..._1903.-..- .- __ ..1904. ... 1905 ...... ...1906. ...
1908 . 1909 ..1910 . 1911 - 1912. ..1913. .. .......1914....... .... ...... ..1915 ..1916. . 1917 1918 .
Precipi tation
7.2910.2219.5810.1711.4212.0015.9720.6519.2712.0112.3111.274.07
20.2410.3113.1122.8813.927.955.68
14.54
Year
1919 . 1920 . 1921....... ............1922. ...... .. .1923 1924. 1925. . . 1926. ..1927 1928 1929 1930. . 1931........ ...........1932 ............1933 1934... . 1935. 1936........... ........
Precipi tation
24.7921.3910.3212.1118.839.82
20.4318.3212.1218.8016.309.00
24.6114.636.87
10.1212.75
14.89

BALMORHEA AREA, TEXAS 89
Monthly precipitation, in inches, at Balmorhea, Reeves County, Tex., 1923-36
Year
1923__ _1924 1925__ ___ _.1926 1927__ . _ ____1928 -1929__._ _-1930 1931 1932____-___ __1933____ 1934_. . 1935 1936 -
Jan.
Tr.Tr..60.13.01.00.32
1.13.48.08.39Tr..54.28
Feb.
i. 98.00.00.44.12.77.16.90
3.79.61.07.71.00.73
Mar.
0.33
1.68.63.03.93.47.89.58Tr..29Tr..82.55
Apr.
6.46
Tr..3984
1.503.47.45.03.32.45.09.85
May
0.021.431.50.37
1.331.28.93
1.352.19.22.23
1.582.651.16
June
Tr.10
.54
.66
4.871.69.48.42
.97
.481.07
July
1.502.13
.944.97
EQ
.721.251.55.60.52.50.95
1.45
Aug.
0.213 70
2.68.46
4.62Q9
2 QO
1.473.601.09.81
3.20.59
2.01
Sept.
0.902.642 97o no3 7d
3.062.13.47.43
11.64.92.14
2.575.152.72
Oct.
1.481.742.652.69.37.93
1.811.98.21
1.202.20Tr.
1.06.56
1.34
Nov.
1.48Tr.Tr..74.00.64.33.85.86Tr..23.08.34
1.81.52
Dec.
2.170.23.09
.58
.12
.23
.732.252.19.03.01
1.95.11.87
Annual
9.11
18.3181 20
16.88
15.9028.156.433.89
12.4313.7513.43
Rainfall, in inches, at Balmorhea, Tex., Oct. 1, 1931, to Sept. 30, 1933
1931
Oct. 11. ....Oct. 12-. Oct. 13...
Total..
Nov. 16 Nov. 17... ... Nov. 25 Nov. 26.
Total.
Dec. 1 .
Dec. 7_
Dec. 17.. .Dec. 18-. -
Total..irioo
Jan. 22
Total. .
Feb 14Feb. 15 -Feb. 17. _.Feb. IS. __..Feb. 19. Feb.20._.._.
Feb. 23
Total..
Mar. 4_._... Mar. 5 ._
Total..
Inches 0.06.09.06
.23
.03
.21
.01
.05
.56
.86
.92
.15
.47
.1215'.44
2. 25
.03
.34
.08
.03
.48
13.37.03.17.40.75
l.Ofi.80.08
3.79
.01
.38
.14
.05
.58
1932
Apr. 26__. ___.Apr. 27
Total
May 11. ......May 14. ______Mav 16 . _ _.
Mav 25. ______May 27 .May29 _.__.
Total...
Tnno 1Q
July3_. .____.July4. .__.__. July 7. .____._Julys. Julv9 .......
July 22. July 26. ......
A nor Q
Aug. 18 ..
A 11 pr OQ
Aug. 30.
Total .-
Sept. 2.- _ Sept. 3__.____Sept. 4__._ Sept. 5. ..... Sept. 6..
Inches 0.27.18
.45
.34
.14
.03
.48
.35
.10
.40
2.19
.20OQ
48
.17
.14
.70
.08
.03
.07
.26
.05
.05
1.55
.0419
.20
.0703
.052.72
3.60
1.03 .05
2.63 .10 .39
1932
Sept. 22__. Sept.23--
Sept. ?5_ ______Sept. 26 Sept. 27. _____
Total____
Oct. 1. .Oct. 2. -Oct. 10_. ------Oct. 13_ _...._Oct 14Oct. 15. ._-_--
Oct. 21. Oct. 25.. ...
Nov _ . _ --._
T^on Q
Dec. 10 Dec. 14-. __ __Dec. 15 Dec. 17 -Dqp. 22 Dec. 23 ___ _.Dec. 29_._._.._Dec. 30 -
Total-
1933
Jan. 7...... ...
Total
Inches 1.83.44.01.26.16 .03.13.44 .02.35
3.30.47
11.64
.07
.07
.05
.39
.19
.01
.28
.05
1.20
(')
.13
.05
.34
.13
.07
.07
.91
.03
.46
2.19
.06
.02
.08
1933
Feb. 8- -----Feb. 25 ... __Feb. 26 ...
Total.
Mar ..
Apr. 25 ..
May 17 Mav 24.. .May 25 ........
Total
TrinA 1QTUTIA 9Q
Total....
July 17.. ......July 18.... July 19. July 31.. ...
Total... .
Aug. 2__ .....
Aug. 16.. ..
Aug. 27
Aug. 29 . ....Aug. 30 .Aug. 31 -
Total
Sept. 1_ ..--.- Sept. 2. ------Sept. 9_ .-._-_ Sept. 13-
Total.. __
Inches 0.05.28.28
.61
0)
.03
.08
.04
.10
.22
.13
.05f\K
1Q
.42
.09
.27
.18
.06
.60
.02AQ
.04
.08
.04
.06
.04
.58
.13
.01
!.<#
.75
.01
.05
.04
.07
.92
i Trace.
90 CONTRIBUTIONS TO HYDROLOGY OF UNITED STATES, 1940
GENERAL GEOLOGY
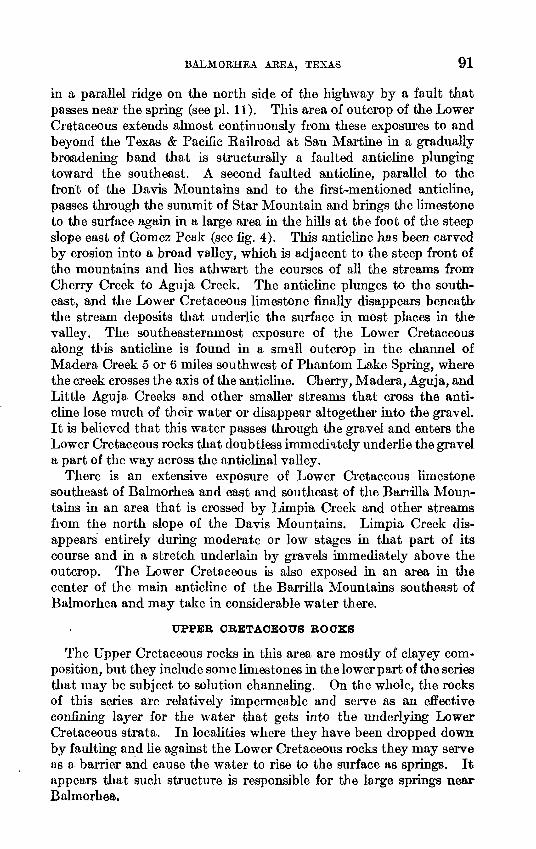
The rocks exposed in the vicinity of Balmorhea comprise Lower and Upper Cretaceous marine sediments, Tertiary volcanic deposits and lava flows, and Quaternary alluvial deposits. The Cretaceous sedi ments are probably underlain by a succession of Triassic, Permian, and older strata that are exposed in adjoining areas, particularly in the Delaware and Guadalupe Mountains to the northwest and in the Glass Mountains and Marathon area to the southeast. The occur rence of these rocks has been extensively studied in recent years by geologists working for the various oil companies, and a large amount of information has been published concerning them. This material and field study centering in the Toyah Basin, including the Balmorhea area, made by Mr. Gale in the spring and fall of 1932 and a part of the spring of 1933 provide the basis for the following summary of the geology of the area.
LOWER CRETACEOUS ROCKS
The big springs of Balmorhea and Fort Stockton are believed to have their source in an extensive network of fissures and solution passages in limestones of the Comanche series of Lower Cretaceous age, which are the oldest strata exposed near Balmorhea. The Comanche section includes, besides the limestones, interbedded calcareous shale and a basal unit composed of sand or sandstone, at places containing gravel, which, although not exposed near Balmorhea, is found in outcrops near Kent to the northwest and in the foothills of the Glass Mountains near Hovey to the southeast. The limestones are mainly massive, thick-bedded, and very fossiliferous. They weather characteristically to dark-colored craggy or solution-rounded ledges and low rolling to hilly topography.
The total thickness of the Lower Cretaceous at Balmorhea is not known, because the base of the series is not exposed near that place and, so far as is known, none of the wells that have been drilled in the area have penetrated the series. Near Fort Stockton, east of Balmor hea, it has been shown that the maximum thickness of the series is about 600 feet, and near Limpia postoffice, 16 miles due south of Balmorhea, a deep well passed through about 700 feet of Lower Cretaceous rocks. It is believed that the Lower Cretaceous thins toward the northwest and that in the vicinity of Balmorhea the series is approximately 500 feet thick.
The uppermost limestone of the Lower Cretaceous series is well exposed near Phantom Lake Spring in a ridge that extends northwest from the spring along the south side of the Old Spanish Trail Highway. This limestone contains several "sinks" or deep, cavernous channels and crevices in this general vicinity, and from one of these crevices emerges the water that feeds Phantom Lake. The section is repeated
BALMORHEA AREA, TEXAS 91
in a parallel ridge on the north side of the highway by a fault that passes near the spring (see pi. 11). This area of outcrop of the Lower Cretaceous extends almost continuously from these exposures to and beyond the Texas & Pacific Railroad at San Martine in a gradually broadening band that is structurally a faulted anticline plunging toward the southeast. A second faulted anticline, parallel to the front of the Davis Mountains and to the first-mentioned anticline, passes through the summit of Star Mountain and brings the limestone to the surface again in a large area in the hills at the foot of the steep slope east of Gomez Peak (see fig. 4). This anticline has been carved by ierosion into a broad valley, which is adjacent to the steep front of the mountains and lies athwart the courses of all the streams from Cherry Creek to Aguja Creek. The anticline plunges to the south- east, and the Lower Cretaceous limestone finally disappears beneath the stream deposits that underlie the surface in most places in the- valley. The southeasternmost exposure of the Lower Cretaceous along this anticline is found in a small outcrop in the channel of Madera Creek 5 or 6 miles southwest of Phantom Lake Spring, where the: creek crosses the axis of the anticline. Cherry, Madera, Aguja, and Little Aguja Creeks and other smaller streams that cross the anti cline lose much of their water or disappear altogether into the gravel. It is believed that this water passes through the gravel and enters the Lo^er Cretaceous rocks that doubtless immediately underlie the gravel a part of the way across the anticlinal valley.
There is an extensive exposure of Lower Cretaceous limestone southeast of Balmorhea and east and southeast of the Barrilla Moun tains in an area that is crossed by Limpia Creek and other streams from the north slope of the Davis Mountains. Limpia Creek dis appears entirely during moderate or low stages in that part of its course and in a stretch underlain by gravels immediately above the outcrop. The Lower Cretaceous is also exposed in an area in the center of the main anticline of the Barrilla Mountains southeast of Balmorhea and may take in considerable water there.
UPPER CRETACEOUS BOCKS
The Upper Cretaceous rocks in this area are mostly of clayey com position, but they include some limestones in the lower part of the series that may be subject to solution channeling. On the whole, the rocks of this series are relatively impermeable and serve as an effective confining layer for the water that gets into the underlying Lower Cretaceous strata. In localities where they have been dropped down by faulting and lie against the Lower Cretaceous rocks they may serve as a barrier and cause the water to rise to the surface as springs. It appears that such structure is responsible for the large springs near Balmorhea.
92 CONTRIBUTIONS TO HYDROLOGY OF UNITED STATES, 1940
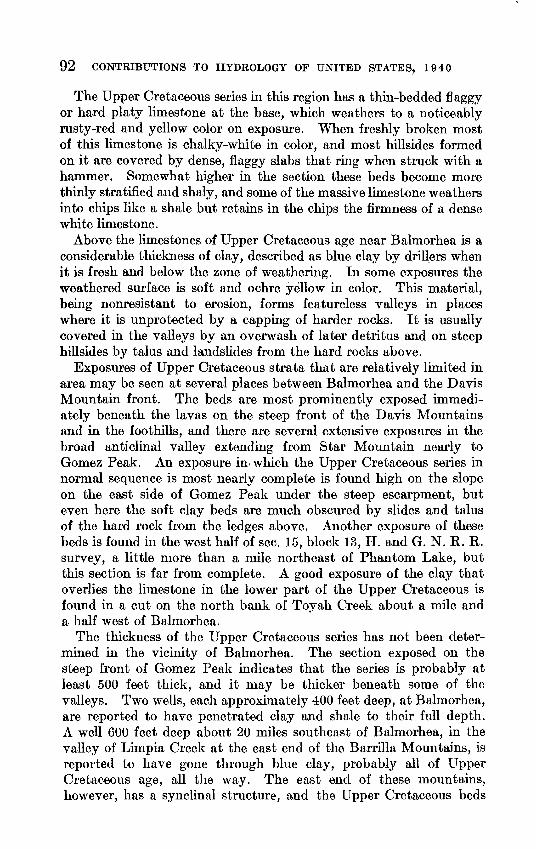
The Upper Cretaceous series in this region has a thin-bedded flaggy or hard platy limestone at the base, which weathers to a noticeably rusty-red and yellow color on exposure. When freshly broken most of this limestone is chalky-white in color, and most hillsides formed on it are covered by dense, flaggy slabs that ring when struck with a hammer. Somewhat higher in the section these beds become more thinly stratified and shaly, and some of the massive limestone weathers into chips like a shale but retains in the chips the firmness of a dense white limestone.
Above the limestones of Upper Cretaceous age near Balmorhea is a considerable thickness of clay, described as blue clay by drillers when it is fresh and below the zone of weathering. In some exposures the weathered surface is soft and ochre yellow in color. This material, being nonresistant to erosion, forms featureless valleys in places where it is unprotected by a capping of harder rocks. It is usually covered in the valleys by an overwash of later detritus and on steep hillsides by talus and landslides from the hard rocks above.
Exposures of Upper Cretaceous strata that are relatively limited in area may be seen at several places between Balmorhea and the Davis Mountain front. The beds are most prominently exposed immedi ately beneath the lavas on the steep front of the Davis Mountains and in the foothills, and there are several extensive exposures in the broad anticlinal valley extending from Star Mountain nearly to Gomez Peak. An exposure in which the Upper Cretaceous series in normal sequence is most nearly complete is found high on the slope on the east side of Gomez Peak under the steep escarpment, but even here the soft clay beds are much obscured by slides and talus of the hard rock from the ledges above. Another exposure of these beds is found in the west half of sec. 15, block 13, H. and G. N. R. R. survey, a little more than a mile northeast of Phantom Lake, but this section is far from complete. A good exposure of the clay that overlies the limestone in the lower part of the Upper Cretaceous is found in a cut on the north bank of Toyah Creek about a mile and a half west of Balmorhea.
The thickness of the Upper Cretaceous series has not been deter mined in the vicinity of Balmorhea. The section exposed on the steep front of Gomez Peak indicates that the series is probably at least 500 feet thick, and it may be thicker beneath some of the valleys. Two wells, each approximately 400 feet deep, at Balmorhea, are reported to have penetrated clay and shale to their full depth. A well 600 feet deep about 20 miles southeast of Balmorhea, in the valley of Limpia Creek at the east end of the Barrilla Mountains, is reported to have gone through blue clay, probably all of Upper Cretaceous age, all the way. The east end of these mountains, however, has a synclinal structure, and the Upper Cretaceous beds

BALMOKHEA AREA, TEXAS 93
may be uncommonly thick in the area. The evidence suggests a thickness of at least 500 or 600 feet in most places, but it may be considerably more than 600 feet in other places.
TERTIARY VOLCANIC ROCKS
After the deposition of the Cretaceous rocks in this region there was a withdrawal of the seas and slight folding of the previously deposited strata, then the rocks were subjected to considerable erosion.
Volcanic rocks having a total thickness of 1,500 to 2,000 feet were laid down on the eroded surface of the Upper Cretaceous rocks during early Tertiary time. These rocks form the capping of the Davis iaiid Barrilla Mountains and of many ridges and hills on their flanks. They were probably originally spread far beyond their present area of outcrop but have been removed from many parts of the area by erosion. The lowest bed of the volcanic succession is generally white tuff or ash, indicating that the first volcanic eruptions were of the explosive type. Above the basal tuffs is a widespread bed of volcanic breccia, composed of angular fragments of the volcanic rock in a matrix of lava. The breccia is overlain by lava flows of rhyolitic composition. Above these are beds of tuff and at least two flows of lava, which are of trachytic composition. The different parts of the series are so closely related that they are probably the product of a single cycle of volcanic activity.
As the volcanic rocks form the summits of the Davis and Barrilla Mountains, they occupy a belt that receives rainfall greater than that of the adjoining lowlands. Much of the lava is exceedingly porous, because it is fractured and jointed, and some of it is slaggy and naturally full of cavities. It tjhus absorbs much of the water that falls on it. Some of the layers of tuff are claylike and impermeable, so that water descending through the overlying permeable lavas does not pass through them but flows along their surfaces to emerge in springs along their outcrops. In general, the volcanic rock rests on the impervious clays of the Upper Cretaceous, and where this contact lies above the gradient of the main drainage channels, as it does in many places, most of the water absorbed by the volcanic rocks is again fed into the surface drainage or stream and terrace gravels within the mountain area. The volcanic series dips below stream gradients in certain structurally depressed areas, and it is likely that where this occurs the porous lava forms large reservoirs for the accumulation and storage of ground water below the level of the streams. The water thus stored is probably prevented from penetrating directly to the Lower Cretaceous limestone by the relatively impermeable basal volcanic tuff and Upper Cretaceous clay. In some localities, however, it may eventually reach the lime-
94 CONTRIBUTIONS TO HYDROLOGY OF UNITED STATES, 1940
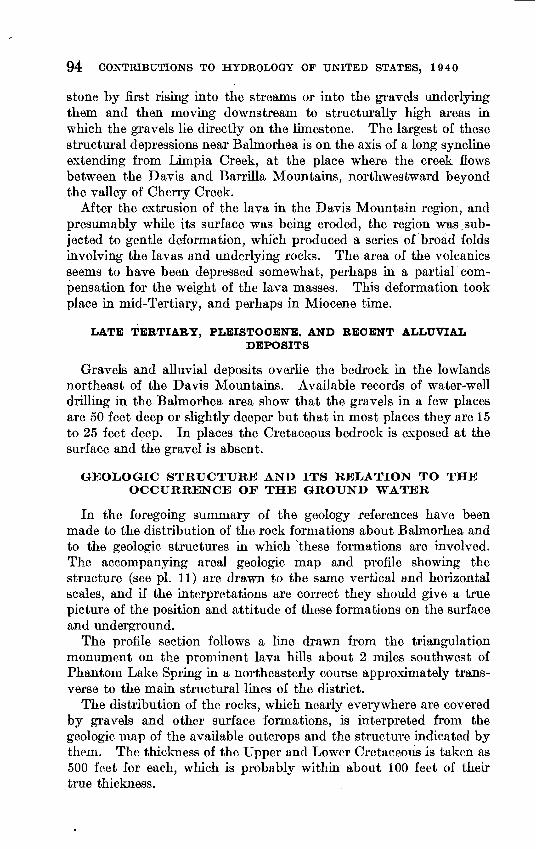
stone by first rising into the streams or into the gravels underlying them and then moving downstream to structurally high areas hi which the gravels lie directly on the limestone. The largest of these structural depressions near Balmorhea is on the axis of a long syncline extending from Limpia Creek, at the place where the creek flows between the Davis and Barrilla Mountains, northwestward beyond the valley of Cherry Creek.
After fche extrusion of the lava in the Davis Mountain region, and presumably while its surface was being eroded, the region was.sub jected to gentle deformation, which produced a series of broad folds involving the lavas and underlying rocks. The area of the volcanics seems to have been depressed somewhat, perhaps hi a partial com pensation for the weight of the lava masses. This deformation took place in mid-Tertiary, and perhaps in Miocene time.
LATE TERTIARY, PLEISTOCENE, AND RECENT ALLUVIALDEPOSITS
Gravels and alluvial deposits overlie the bedrock hi the lowlands northeast of the Davis Mountains. Available records of water-well drilling in the Balmorhea area show that the gravels in a few places are 50 feet deep or slightly deeper but that in most places they are 15 to 25 feet deep. In places the Cretaceous bedrock is exposed at the surface and the gravel is absent.
GEOLOGIC STRUCTURE AND ITS RELATION TO THE OCCURRENCE OP THE GROUND WATER
In the foregoing summary of the geology references have been made to the distribution of the rock formations about Balmorhea and to the geologic structures in which 'these formations are involved. The accompanying areal geologic map and profile showing the structure (see pi. 11) are drawn to the same vertical and horizontal scales, and if the interpretations are correct they should give a true picture of the position and attitude of these formations on the surface and underground.
The profile section follows a line drawn from the triangulation monument on the prominent lava hills about 2 miles southwest of Phantom Lake Spring in a northeasterly course approximately trans verse to the main structural lines of the district.
The distribution of the rocks, which nearly eveiywhere are covered by gravels and other surface formations, is interpreted from the geologic map of the available outcrops and the structure indicated by them. The thickness of the Upper and Lower Cretaceous is taken as 500 feet for each, which is probably within about 100 feet of their true thickness.
GEOLOGICAL SURVEY WATER-SUPPLY PAPER 849 PLATE 11
EXPLANATION
Fault u upthrow D downthrow
Anticline and pitch of axis
Syncline Strike and dip
tyi 'Tertiary volcanics <B'c cci
s A' **
^ Lower Cretaceous Ji A Hi 11
1 1 Lower Cretaceous/
I votcanics\_ -J __I;35Eb=
-3,000'
- 2,OOO' - I,OOO'
Section along Ii
GEOLOGIC MAP AND SECTION OF BALMORHEA AREA, TEXAS, SHOWING THE RELATIONS BETWEEN THE LARGE SPRINGS AND THEGEOLOGIC STRUCTURE.

BALMOHHEA AREA, TEXAS' 95
There is an unconformity between the Upper Cretaceous series and the overlying lavas, the Cretaceous rocks having been folded into gentle anticlines and synclines and extensively eroded in the epoch between the withdrawal of the Upper Cretaceous sea and the deposi tion of the Tertiary lavas. Therefore it cannot be predicted which part of the Cretaceous series will be found immediately beneath the base of the lavas in any particular locality.
Both lava flows and Cretaceous strata were involved in folding subsequent to the distribution of the lava, but this is relatively insignificant in the small section of these beds included in the diagram. The faulting to which the whole section has been subjected and which is an important feature in the section is believed to have taken place in early Pleistocene time and to have affected all the rocks in the area except such Pleistocene gravels or alluvium as have accumulated since that deformation. Aside from the permeability of the strata themselves, the geologic structure is undoubtedly the controlling fac tor that determines the movement of the water underground and the existence and location of the big springs.
The principal area of intake of the water discharged by the springs is apparently in the anticlinal valley adjacent to the steep front of the Davis Mountains (see p. 91 and fig. 4), where a large part of the flow of the mountain streams disappears into Lower Cretaceous lime stone or into stream gravels that overlie the limestone. The limestone dips to the northeast from the axis of the anticlinal valley to the axis of a major northwest-southeast trending syncline and then rises to the surface in the vicinity of Phantom Lake Spring. The axis of the syncline is marked by a range of volcanic hills, a part of which is shown in the lower left corner of plate 11. In this syncline the base of the Lower Cretaceous probably sinks to a depth of 1,000 to 1,200 feet or more below the major stream grades. The water probably fills the limestone in this syncline to the height of its confin ing rim on the northeast and is brought to or near the surface at the outcrop of the reservoir beds in the vicinity of Phantom Lake. About 1,000 feet northeast of Phantom Lake there is a clearly defined fault, on the south side of which the Lower Cretaceous strata have been tilted up steeply and on the north side of which the whole section has been dropped down, bringing relatively impermeable Upper Cre taceous strata against the Lower Cretaceous limestone. The Upper Cretaceous rocks on the north side of this fault may thus constitute an underground barrier to the passage of ground water at this place and cause the water to rise to the surface in Phantom Lake Spring. The spring emerges in a channel developed by solution along a fissure in the massive limestone that extends underground below the present water surface. Phantom Lake stands over a sink hole where the
250849 41 3
96 CONTRIBUTIONS TO HYDROLOGY OF UNITED STATES, 1940
limestone has fallen in, but there is no evidence of faulting at the lake. The course of surface drainage below Phantom Lake is in approximately the same direction as the line of the structure section.
Immediately northeast of the Phantom Lake fault the strata rise gently toward the surface in the same manner as near Phantom Lake. This rise might have a general tendency to bring the water up again, or such part of it as sinks in this fault block, but it is again interrupted by a fault, the surface trace of which is obscured but is believed to lie almost a mile northeast of Phantom Lake (see pi. 11).
The structure is shown in conspicuous outcrops in the channel of the stream from Phantom Lake about 1% miles northeast of the spring and about 1,000 feet north of the Old Spanish Trail Highway. At this place the upper part of the Upper Cretaceous lies at the sur face and is capped by a remnant of Tertiary lava. Therefore the area is structurally low.
No evidence of irregularities is known between this outcrop and the vicinity of Toyahvale and San Solomon and Giffiii Springs. The broad, relatively level alluvium-covered area that extends many miles both northwest and southeast from Toyah Creek in this part of the district is evidently eroded on the little-resistant clays of the upper part of the Upper Cretaceous section.
The valley within a radius of a mile of San Solomon and Giffm Springs is covered everywhere with a mantle of gravel or other detritus, but a clue as to the probable character of the structure in their vicinity is afforded by the evidence on the south slope of the lava hills that project into the valley about a mile east of the springs. It is believed that the straight line that bounds the southwestern side of the mass of volcanic rocks that extends northwestward from the Barrilla Hills marks the trace of a fault. On the southwest side of this fault the Lower Cretaceous limestone is believed to be near the surface, and on the northeast side the Upper Cretaceous clays are again faulted down against the water-bearing limestone. The springs themselves are fair evidence of this. The inferred relations are shown by the structure section.
The basin between the fault near San Solomon Spring and the Brogada Hills, which is the part of the valley in which Balmorhea is situated, is mostly if not entirely underlain at shallow depth by the clay of the Upper Cretaceous section. There is evidence of this fact in a number of outcrops, and this general structure is also indi cated in the regional relations. In this part of the valley the top of the Lower Cretaceous rocks probably is about 500 feet below the surface. At the western foot of the Brogada Hills there is considerable disturbance of the beds, and the fact that they are composed of Tertiary lava indicates that these hills are a down-faulted block along the southwest side of which impermeable Upper Cretaceous

BALMOKHEA AREA, TEKAS1 97
rocks are faulted against the Lower Cretaceous limestone. If this assumption is correct the fault has produced a more or less effective barrier to the northeastward movement of underground water in the limestone in this area.
The extensive plains that-lie east of the Brogada Hills are developed, so far as present evidence shows, on a broad structurally depressed area that begins at tfte west with the syncline in the lava shown in the Brogada Hills. There is a reasonable probability that the fault line bounding these hills on the southwest separates the Balmorhea Basin from the ground-water basin east of the Brogada Hills. Evidence of this is seen in the fact that so much of the ground water of the upper basin has been brought to the surface above this line of displacement. The ground water in the lower or Saragosa Basin is probably derived in part from the overflow from the Toyah Creek drainage system, in part from the northern flanks of the Barrilla Mountains, and possibly in large part from the Lower Cretaceous limestone near the center of the Barrilla Mountains, where it may be close enough to the surface to receive water through the gravels from surface streams.
The blanket of gravel that underlies the Saragosa plains is thicker than the gravel in the Balmorhea Basin. According to general reports of water wells that have been drilled, it seems that this thickening takes place abruptly near the settlement of Brogada and increases eastward. The Saragosa Basin is filled with a coarse impermeable boulder conglomerate. Water wells sunk through this upper gravel find water in a loose and clean sand below it. Tests of this sand indicate that, in general, it does not yield enough water to warrant considering it as a possible source of adequate new irrigation supplies.
According to the foregoing interpretations of the structure, the Lower Cretaceous limestones in the Saragosa area should yield artesian water if they are as porous or as much channeled there as they are in many other places. These beds are structurally lower in the Saragosa Basin than they are either to the east or west of it, as they lie in the southern extension of the Toyah trough. There is little to indicate the depth at which the limestones would be en countered in this area, but it seems unlikely that they would be at a depth greater than 1,000 or 1,200 feet. It is probable that the ground water in this trough is derived largely from areas other than those that supply the springs near Balmorhea, and the Lower Cretaceous limestone in the Saragosa Basin east of Brogada may be, therefore, a promising source of additional water supply.
SPRINGS
The springs near Balmorhea are of two kinds artesian springs,, whose waters issue under artesian pressure, and gravity springs, whose waters flow because the water table is above the land surface at the
"98 CONTRIBUTIONS TO HYDROLOGY OF UNITED STATES, 1940
site of the spring, so that water tends to drain from the water-bearing beds. The large San Solomon, Phantom Lake, and Giffin Springs belong to the first class, and the Saragosa, West Sandia, East Sandia, and Toyah Creek Springs to the second. The locations of these springs are shown on plate 11 and figures 3 and 4.
ARTESIAN SPRINGS '
The artesian character of Phantom Lake, San Solomon, and Giffin Springs is proved by the fact that they appear at the surface of the ground and would flow at the surface if they were permitted to do so. Phantom Lake Spring issues from an A-shaped opening in Lower Cretaceous limestone at the base of a ridge about 8 miles southwest of Balmorhea. It is located at the northwestern edge of a large depression apparently formed as the result of the collapse of the roof of a cavern in the limestone. The water flows into a small pond, ^called Phantom Lake, and thence is carried through a canal to irri gated lands in the valley below.
San Solomon and Giflin Springs rise from gravel deposits in the floor of the valley near Toyahvale, about 4 miles southwest of Bal morhea. The water originally came to the surface, forming a swamp of considerable size, which drained into Toyah Creek. San Solomon Spring now issues from gravel in the bottom of a large well-built bathing pool. The water is beautifully clear, and the discharge at all times is that of a good-sized creek. It is not surprising, therefore, that this spring is one of the leading scenic attractions of the region. The Giffin Springs rise from gravel at or near the head of four short pits or trenches that finger out from a central outlet trench. When first used for {irrigation, the flow of the springs was diverted into canals that were cut only a few feet below the surface. Eighteen or twenty years ago in the hope of obtaining a large increase in flow, the points of discharge of San Solomon and Giffin Springs were lowered by trenches and pits of considerable depth excavated at both sites. Then new deeper outlet canals were constructed, the one at San Solomon Spring having a depth of about 20 feet and the one At Giffin Springs a somewhat lesser depth.
The high- and low-level canals at both springs are available for diversion, but the low-level canal from San Solomon Spring is used infrequently because its use does not increase the flow sufficiently to justify the inconvenience of distributing water from the lower level.
In the course of the investigation, efforts were made to determine the flow of San Solomon Spring both when discharging into the high- level canal and when discharging into the low-level canal, but the demands for water for irrigation would not permit an accurate deter-
BALMORHEA ABBA, TEXAS' 99
mination of the flow at the respective levels. However, a few meas urements were made. On November 10, 1931, the discharge through the high-level canal was 30.9 second-feet, and three measurements made 10 and 11 days later, on November 20 and 21, showed that the discharge through the low-level canal was 37.7, 37.6, and 38.0 second- feet. These measurements indicate a difference in flow between the two levels of 6 to 7 second-feet. The spring had been discharging through the high-level canal for about a month prior to the measure ment on November 10, and during that time the flow had not varied more than 1 or 2 second-feet. It had been discharging through the low-level canal for 8 or 9 days before the measurements at that canal were made. The computed difference in flow at the two levels, therefore, may have approximated closely the correct difference for the period. Whether or not the flow would gradually decrease if the outlet should be maintained at the lower level for a long time is not known. It appears probable that it might.
The discharge of all three springs was well sustained even during several successive dry years. Phantom Lake Spring has a somewhat wider variation in flow than the other two. The lowest discharge of San Solomon Spring recorded by the Geological Survey was 26.5 second-feet on April 26, 1923 (p. 121), and the highest was about 71 second-feet on October 7, 1932 (p. 131). The lowest recorded flow of Phantom Lake Spring was 10 second-feet on October 16,1931 (p. 142), and the highest 114 second-feet October 2 and 3,1932 (p. 127). The discharge of the Giffin Springs is relatively small, the smallest re corded daily flow being 2.9 second-feet March 4, 1925, and the largest between 6 and 7 second-feet in October 1932. Daily records of the discharge of the springs during a period of about 2 years, 1931-33, are given on the following pages: Phantom Lake Spring (pp. 127-128),. San Solomon Spring (pp. 130-131), Giflin Springs (pp. 129-130).
The flow of Phantom Lake Spring and San Solomon Spring increases very soon after heavy rains, the rise occurring more quickly and the rate of increase being greater in Phantom Lake Spring than in San Solomon Spring. For example: The discharge of Phantom Lake Spring had remained relatively constant at about 13 second-feet from December 21, 1931, to February 22, 1932. During the period February 20 to 22, 1932, 2.41 inches of rain was recorded at Balmorhea,. the heaviest fall occurring February 21, and as a result all the can yons had a substantial flow of storm water. The discharge of Phan tom Lake Spring began to increase February 22 and reached 20 sec ond-feet February 23 and 25 second-feet February 27. The flow of San Solomon Spring, which had remained constant at about 30 second-feet for several weeks, began to increase on the afternoon of February 23, about 24 hours after the rise started at Phantom Lake.
100 CONTRIBUTIONS TO HYDROLOGY OF UNITED STATES, 1940
The flow continued to increase gradually and reached a maximum of 36 second-feet February 27, after which it gradually decreased.
The rainfall in this district from August 30 to September 30, 1932, amounted to 14.36 inches and was the heaviest on record. The first heavy fall, 2.72 inches, occurred August 30 and was quickly followed by large runs of storm water from the mountain canyons. The flow of Phantom Lake Spring, which had been relatively constant at 12 to 13 second-feet for several months, began to increase on the evening of August 29 and reached about 46 second-feet September 11. It then gradually decreased to about 25 second-feet September 26, at which tune it again began to increase and continued until it reached a maximum of 114 second-feet October 3. The flow of San Solomon Spring, which had remained at 32 to 33 second-feet for several months, began to increase August 29 and continued until September 14, when it was about 65 second-feet. It then slowly decreased, reaching a minimum of about 54 second-feet September 27, when it again began to increase and continued until it reached a maximum of about 71 second-feet October 7.
The temperature of Phantom Lake, San Solomon, and Giffin Springs is normally high. It was the same, 78° F., for all three in October 1931. After the increase in flow in September 1932 the tempera ture was 71° in Phantom Lake Spring and 74° in San Solomon Spring. On March 11, 1933, it was 77}£° in Phantom Lake Spring and 73J£° in San Solomon Spring.
Ordinarily the water discharged from the springs is perfectly clear, but soon after the start of the abrupt increases in flow in August and September 1932 the water from Phantom Lake and San Solomon Springs became cloudy owing to the suspension in it of a very fine light-colored sediment.
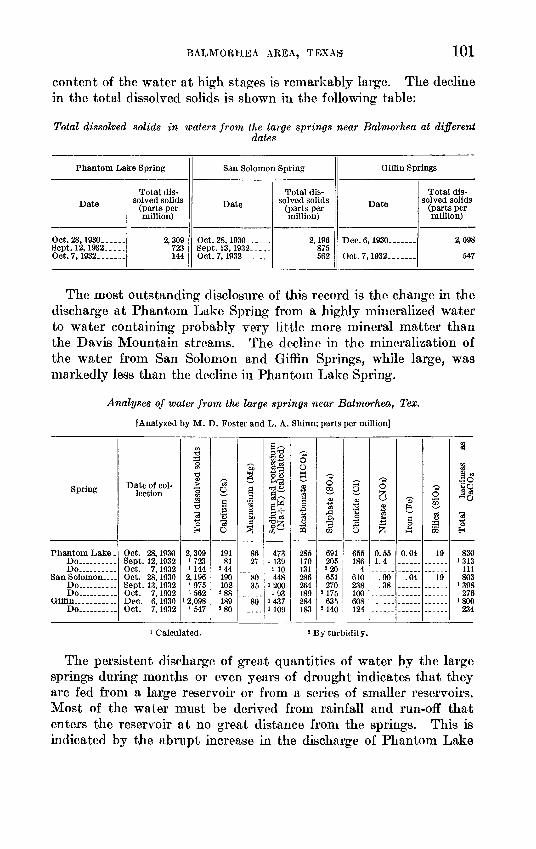
Normally the water of the springs has rather a high mineral con tent, but it becomes quite fresh during periods of peak discharge. This is well illustrated by the table on page 101 which gives the com parative results of analyses of samples obtained during periods of moderate flow in the fall of 1930 and of high flow in the fall of 1932. When the samples were taken in 1930 the discharge was not measured, but it was known to be at a moderate or rather low stage. In the fall of 1932 the discharge of all the springs was abnormally high. When their waters were sampled on September 12 and 13, 1932, Phantom Lake Spring had a discharge of 45 second-feet and San Solomon Spring 64 second-feet. On October 7, 1932 when the waters were again sampled, Phantom Lake Spring had a discharge of about 82 second-feet, San Solomon Spring 71 second-feet, and Giffin Springs 6 second-feet. These samples show that the decline in the mineral
BALMORHEA AREA, TEXAS 101
content of the water at high stages is remarkably large. The decline in the total dissolved solids is shown in the following table:
Total dissolved solids in waters from the large springs near Balmorhea at different
Phantom Lake Spring
Date
Oct. 28, 1930---...Sept. 12, 1932.....Oct. 7, 1932.......
Total dis solved solids
(parts per million)
2,309 723 144
San Solomon Spring
Date
Oct. 28, 1930.--.-Sept. 13, 1932.....Oct. 7, 1932.......
Total dis solved solids
(parts per million)
2,196 875 562
Giffln Springs
Date
Dec. 6, 1930 .
Oct. 7,1932...
Total dis solved solids
(parts per million)
2,098
547
The most outstanding disclosure of this record is the change in the discharge at Phantom Lake Spring from a highly mineralized water to water containing probably very little more mineral matter than the Davis Mountain streams. The decline in the mineralization of the water from San Solomon and Giffin Springs, while large, was markedly less than the decline in Phantom Lake Spring.
Analyses of water from the large springs near Balmorhea, Tex.
[Analyzed by M. D. Foster and L. A. Shinn; parts per million]
Spring
Phantom Lake .Do
San Solomon ....Do.._._ ..Do ......
Giffln... ...... ..Do_ _...
Date of col lection
Oct. 28,1930Sept. 12, 1832Oct. 7, 1932Oct. 28,1930Sept. 13, 1932Oct. 7, 1932Dec. 6, 1930Oct. 7, 1932
13"o
13
"o
5"ol
0EH
2,309i 7231144
2,19619751562
i 2,0981547
'o?
0
~ 8 30
19181
244190102288189
2 gO
"So
"a'ia to^
8627
80or
80
rrl
M 03-2-3
-g!
gW
3"o3 O ^-»-'
473
i 10448
1200
1437U09
~0 0WO)
O o
S«
285170131286264189284
OOQ
<Oaa
act
691205220651270
2175635
2140
O<o
13
OaO
655186
4610238100608124
O
<o03b4
fc
0.551.4
.90
.38
f=H
OA
0.04
.04
0OQ
fi
W
19
19
a
P»!§° 3Q
EH
8301313
111803
1398276
1800234
1 Calculated. 1 By turbidity.
The persistent discharge of great quantities of water by the large springs during months or even years of drought indicates that they are fed from a large reservoir or from a series of smaller reservoirs. Most of the water must be derived from rainfall and run-off that enters the reservoir at no great distance from the springs. This is indicated by the abrupt increase hi the discharge of Phantom Lake
102 CONTRIBUTIONS TO HYDROLOGY OF UNITED STATES, 1940
and San Solomon Springs following heavy rains and large runs of muddy water from the mountain canyons, by the decrease in the dissolved minerals in the spring water, and by the lowering of the temperature of the water and its cloudy character at such times. The data all tend to substantiate the conclusions stated in the section on the geology of the area and the relation of the springs to the geologic structure.
GRAVITY SPRINGS
Saragosa, West Sandia, and East Sandia Springs rise from gravels in the bottom of shallow drainage channels near Balmorhea. The Toyah Creek Springs issue from gravel at many points in the bed of Toyah Creek in a stretch of 3 or 4 miles southwest and northeast of Balmorhea. The uppermost point of emergence of the Saragosa and Toyah Creek Springs shifts considerably up and down stream from year to year and from season to season. The position of the prin cipal West Sandia Spring now appears to be fixed at a point in a shallow drainage channel on the southeastern border of Balmorhea, but it is reported that about 30 years ago this spring emerged more than half a mile southwest of Balmorhea, or about a mile up the valley from its present location. For a time after the heavy rains of August and September 1932, small seeps hi the channel above and below the spring were discharging more ground water than the spring itself. The East Sandia Spring appears at the base of the western slope of the Brogada Hills, and so far as could be learned it has always been where it is today.
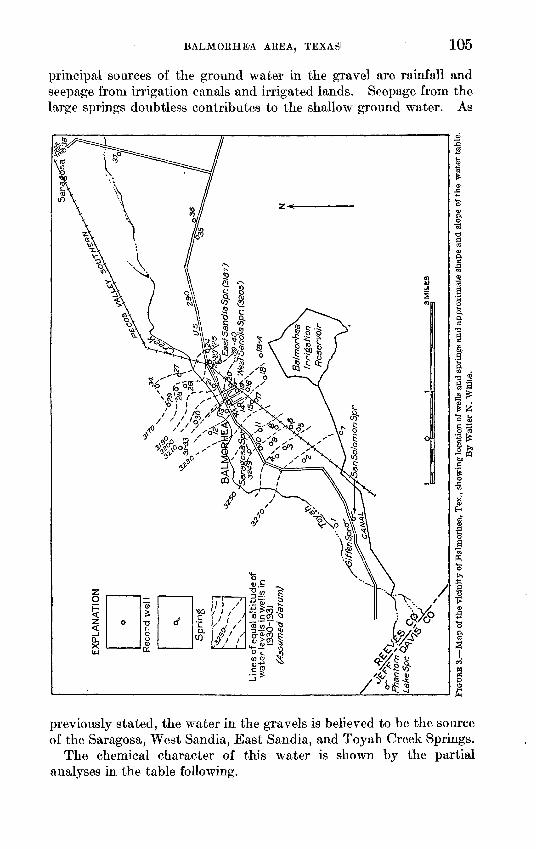
As determined by instrumental leveling, the heads of the Saragosa and Toyah Creek Springs in November 1931 were a few feet below the water levels in nearby shallow wells that draw from the gravel; likewise, the outlet of the main West Sandia Spring was 1 to 2 feet lower than the water level in well 20, one of the shallow observation wells that are discussed later in this report. The outlets of the East Sandia Spring apparently are about at the level of the shallow water table immediately above the spring, but this was not exactly deter mined.
Saragosa Spring enters Toyah Creek and joins the ground-water discharge of that stream a few hundred feet above the Balmorhea bridge. The measured discharge of the spring in second-feet was as follows: November 6, 1932, 9.9; January 23, 1933, 8.2; March 14, 1933, 6.7; May 16, 1933, 6.4; July 11, 1933, 5.6.
The inflow, in second-feet, of ground water into Toyah Creek from its head down to a point about 500 feet below the Balmorhea bridge, consisting of the combined flow of the Saragosa and Toyah Creek
BALMORHE'A AREA, TEXAS 103
Springs, was as follows: November 6, 1932, 30.7; January 23, 1933, 12.8; March 14,1933, 9.4; May 16, 1933, 9.2; July 11, 1933, 8.3. According to records of the Reeves County Water Improvement District the combined discharge of the springs down to the same point ranged from 4.8 to 6 second-feet during December 1931 and January 1932 and from 5.8 to 8.3 second-feet in June, July, and August 1932. The rates of flow shown by the measurements made prior to the floods in August and September 1932 probably are much nearer the average long-time flow than the rates as shown by meas urements made during the months succeeding the floods.
The daily discharge of West Sandia Spring from November 17,1931, to August 28, 1933, is given in the tables on pp. 136 and 137. Accord ing to one set of measurements made on October 17,1932, shortly after the heavy rains, the discharge of the principal spring amounted to 0.6 second-foot, and the seepage inflow above it to 0.2 second-foot, while the inflow between the spring and the gaging station 4,000 feet below it amounted to 1.4 second-feet. A part of this was diverted above the gage and was not taken into account in the gaging records. The mean monthly discharge of East Sandia Spring, in second-feet, and the monthly run-off, in acre-feet, from November 23, 1931, to September 23, 1933, are given in the table on page 138.
The temperature of the water from Saragosa and East and West Sandia Springs is materially lower than the temperature of the water of any of the large springs. On March 14, 1933, the following temperatures (Fahrenheit) were recorded: Saragosa Spring, 67K°; West Sandia Spring, 63^°; East Sandia Spring 3 outlets 55°, 58°, and 64°.
The Saragosa, West Sandia, East Sandia, and Toyah Creek Springs clearly are gravity springs and have their source in the gravel. They appear at levels slightly below the water table hi the gravel. Their temperature is much lower than that of the large springs and is not materially different from the temperature of the water from shallow wells in the vicinity. The discharge of the Saragosa and Toyah Creek Springs' apparently increases and decreases and the position of their uppermost outlets shifts up and down the streams with the rise and fall of the water table. The position of East Sandia Spring is sta tionary and that of the main West Sandia Spring is nearly stationary. This may be due to the fact that these two springs are fed from solution channels in the cemented gravels and that these channels are not directly connected with the shallow water table. The basal conglomerate is encountered in nearly all the shallow wells hi the Balmorhea district and is known to be cavernous hi places. Irrigation streams amounting to a second-foot or more have been known to
250849 41 4
104 CONTRIBUTIONS TO HYDROLOGY OF UNITED STATES, 1940
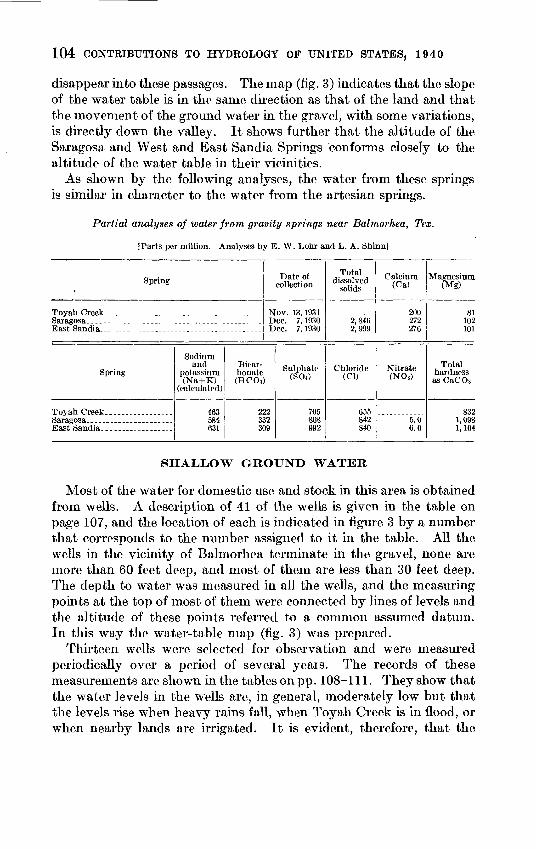
disappear into these passages. The map (fig. 3) indicates that the slope of the water table is in the same direction as that of the land and that the movement of the ground water in the gravel, with some variations, is directly down the valley. It shows further that the altitude of the Saragosa and West and East Sandia Springs conforms closely to the altitude of the water table in their vicinities.
As shown by the following analyses, the water from these springs is similar in character to the water from the artesian springs.
Partial analyses of water from gravity springs near Balmorhea, Tex.
[Parts per million. Analyses by E. W. Lohr and L. A. Shinn]
Spring
Spring
Sodium and
potassium (Na+K)
(calculated)
584631
Bicar bonate (HCOj
2a3
Nnn
fflra19
Date of collection
ov. 13,1931ec. 7, 1930ec. 7, 1930
Sulphate (804)
705868992
Total dissolved
solids
2,8462,999
Chloride (Cl)
655842840
Calcium (Ca)
200272276
Nitrate (N0 3)
5.06.0
Magnesium (Mg)
81102101
Total hardness as CaCOs
8321,0981,104
SHALLOW GROUND WATER
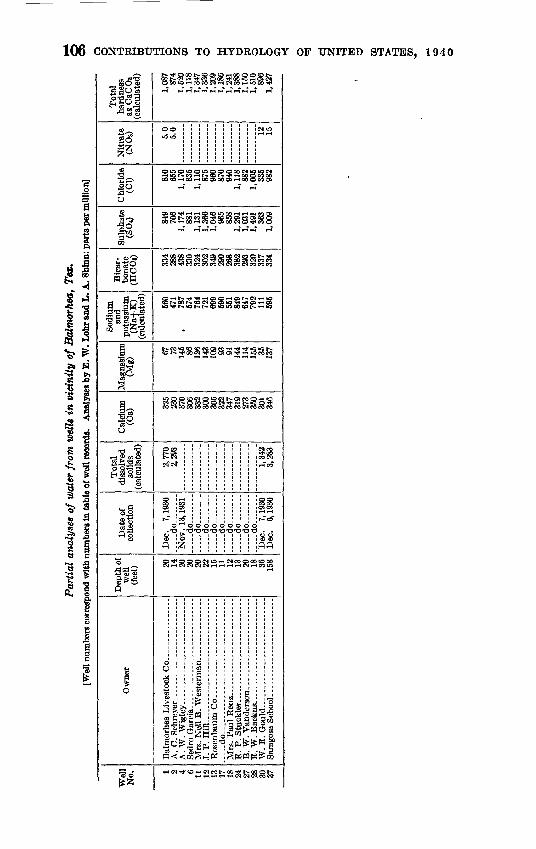
Most of the water for domestic use and stock in this area is obtained from wells. A description of 41 of the wells is given in the table on page 107, and the location of each is indicated in figure 3 by a number that corresponds to the number assigned to it in the table. All the wells in the vicinity of Balmorhea terminate in the gravel, none are more than 60 feet deep, and most of them are less than 30 feet deep. The depth to water was measured in all the wells, and the measuring points at the top of most of them were connected by lines of levels and the altitude of these points referred to a common assumed datum. In this way the water-table map (fig. 3) was prepared.
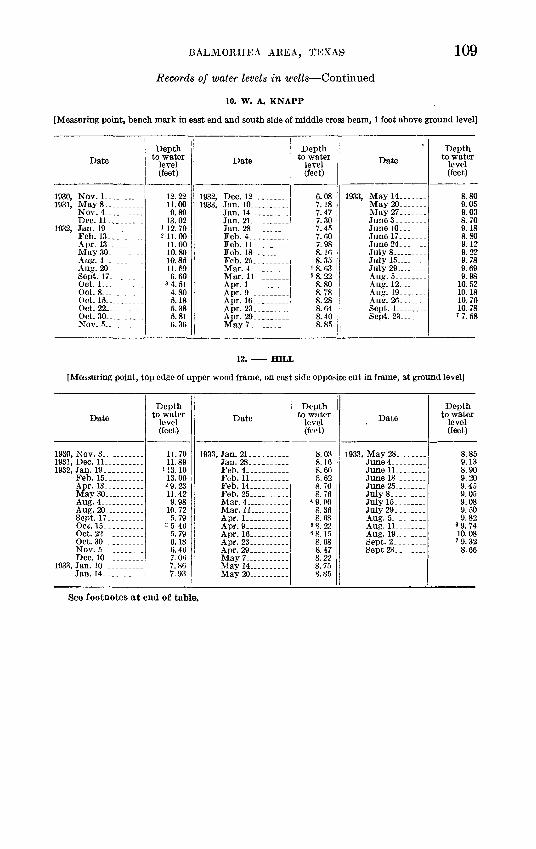
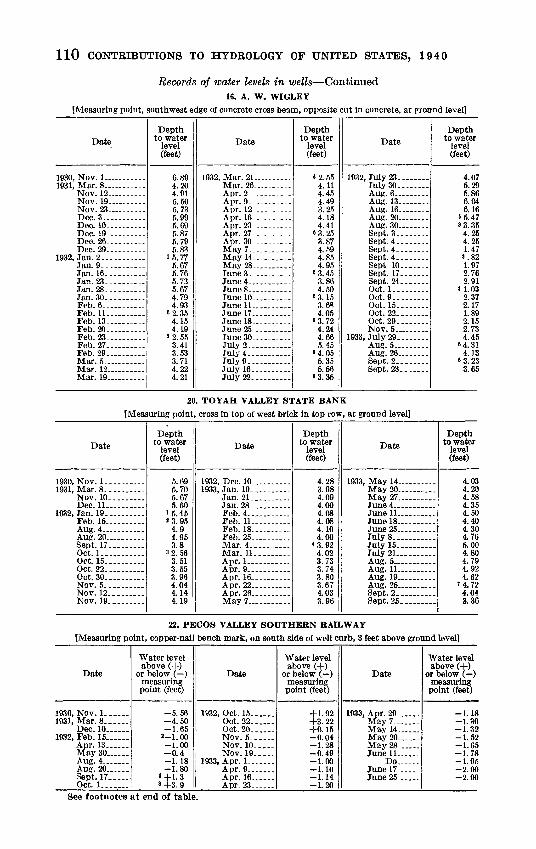
Thirteen wells were selected for observation and were measured periodically over a period of several years. The records of these measurements are shown in the tables on pp. 108-111. They show that the water levels in the wells are, in general, moderately low but that the levels rise when heavy rams fall, when Toyah Creek is in flood, or when nearby lands are irrigated. It is evident, therefore; that the
Oq
coO
e+
' co
E°
,*
£-S
jP"
1 <s>
&
CT
- M
*"
CD
^
crt-
i-S
PJ
CD
s.-r.p*
^
SS
p
p
ft>
fcl'
u
uD^
^^
h->.
P
co
pco
^
P
so
EX
PLA
NA
TIO
N
*C,3
9-4O
Wes
fSan
dia
Sp
r. (
32O
5r)
o«
\7?
v .y
^/s
->?
Lin
es o
f equ
al a
ltit
ude
of
wat
er le
vels
in w
ells
in19
30-1
931
(Ass
umed
datu
m)
co
CTQ
o i P-
O
C/2
P
S
g.|
S»
!1
FIG
URE
3. M
ap o
f the
vic
inity
of B
alm
orhe
a, T
ex.,
show
ing
loca
tion
of w
ells
and
spr
ings
and
app
roxi
mat
e sh
ape
and
slop
e of
the
wat
er ta
ble.
By
Wal
ter
N.
Whi
te.
106 CONTRIBUTIONS TO HYDROLOGY OF UNITED STATES, 1940
S» "I
St^CTrH^COOOO^OoSr-IOSM 500'Oi-ICOCOC5i-l(NCOi-HI5QO'*
1 «.3.*x-\ OO
Ho
iQtOQlBC
J
_u_ sJS^
'?^ S'^S9S S'?SS^ 'SoocoooSNoociooooc
o H b" *a"sM^ *""
0.0
II
fcSNOf
' a'sW
r-l CO
^^cJcS a> 9}QO

BALMORHEA AKEA, TEXAS-
RECORDS OF WELLS
Records of wells in vicinity of Balmorhea, Tex.
107
No.
1
2 3 4 5
6 7 8 9
10 11
12 13 14 15 16 17 18
18 A 19 20
21 22 23 24 25 26 27 28 29 30 31 32 33 34 35 36 37 38 39 40 41
Distance from Balmorhea
(miles)
3MSW _
2SW__ __ ....1MSW.. ..do. ..... .1MSSW...
IJ^SSW ...234 saw....... ikssw... 1MSW- .
1SW. .........
MNW MW.. . ........HSW. .. HS._ __ do. ....._.. do .....1SE...... ..1M 8E.. .......In Balmorhea. do -_.-
J^NE...... ...1 NE.... ... ...
.-..do.. .......IJiNE.... .
_..do__ ........1NNE.- 1MNE. . ......IMNNE. IJ^N.. ........1NW.. ........1J-SNW. ...
_ _ _do . .... ..do. ........1*4NNE 3JiENE__..- 4ENE.. 6NE. .........6MNE . ME............
In Balmorhea..
Owner
Balmorhea Livestock Co.
Charles Welnacht....- A. W. Wigley ...Humble Oil & Refin-
ingCo. S. Garcia _- ._. S. A. Sharpe.-.. __ ..
-do ..... .........
Mrs. Nell B. Wester- man.
Hffl.. ............
T. A. Odell..
A. W. Wigley.. ...... -
... ..do........ ...... Toyah Valley State
Bank.
P. V. S. Ry .......
E.P. Stuckler.. .......
J.P. Cole.-- ..... .
W. E. Gould.. ....... _.. do ....... ...... ..do ..............-....do .. .... ...Mrs. W. E. Oould..--
A. H. Mills.. .........
G. F. Renz .... -. do Reeves County Water
Improvement Dis trict.
Water level
Depth (feet)
175
14 15 20 14
20 20± 20± 19 17 20
22 15 10 9
17 11 12 20±
Unknown 7
24 10
Unknown 13 21.5 17 20 18 50 36 68 63 60 19
220 117 158 158
26 18
202
Below bench mark (feet)
16.29
13.99 13.73 14.39 14.47
13.91 12.86 14.98 11.65 12.22 11.61
11.70 13.45 7.95 9.35 6.89 9.88 4.20 4.71 5.53 5.69
23.27 5.56 2.16
11.68 19.63 14.65 20.66 16.60 34.35 26.88 30 41.51 46.82 16.52
180± 112.9 139.2 137.6
9.80 9.21 5.56
Date
Nov. 10, 1931
Oct. 31,1930 do __ do Nov. 13, 1931
Oct. 31,1930 do do. Nov. 13, 1931 Nov. 1, 1930 -do...... ..
Nov. 3,1930 Nov. 1,1930 -do........ -do.... . ..do ... do........Nov. 13, 1931 -do Nov. 6,1931 Nov. I,'l930
... -do
. do Oct. 31,1931 Nob. 6,1930 Nov. 1, 1930 Nov. 3, 1930 ..do ....Nov. 1,1930 Nov. 3,1930 Nov. 1, 1930 Nov. 3,1930 Nov. 1,1930. do Nov. 3,1930 Nov. 5,1930 ... do_ __._Nov. 3,1930 .... .do ...Nov. 2, 1931
Nov. 1,1930
Alti tude of bench mark i (feet)
3,349
3,286 3,2753,278 3,272
3,266 3,286 3,2633,265 3,264 3,251
3,234 3,231 3,228 3,234 3, 225 3,233 3,221 3,211 3,221 3,214
3,208 3,198 3,194 3,186 3,188 3,198 3,190 3,197 3,204
3,188
3,210 3,209
Use of water *
D,S-
D,S..8 D,S._D,S..
D,S- D.S.. D.S..S N S.....
D.S.. D,S._
D.S..N .D,S._S/>::N .
D.S..N N D.S.. D.S.. D,S.. D,S_. D,S._ D.S.. D,S__ P....N P....N D,S..N .D D.S..D,S.. D.S.-
Method oflift'
W.
W. W. W. H.
H. H. W. H. E. W.
H.W. H. H. None. H. W.
(4) None. None.
W. None. None. W. H. H. H. W. W. W. E. None. Q. W. W. W. W.w. o.8. None.
1 Assumed datum.2 D, Domestic; S, stock; P, public supply; N, not used.3 W, Windmill; H. hand; E, electric motor; G. gas engine; S, siphon. < Test hole.
108 CONTRIBUTIONS TO HYDROLOGY OF UNITED STATES, 1940
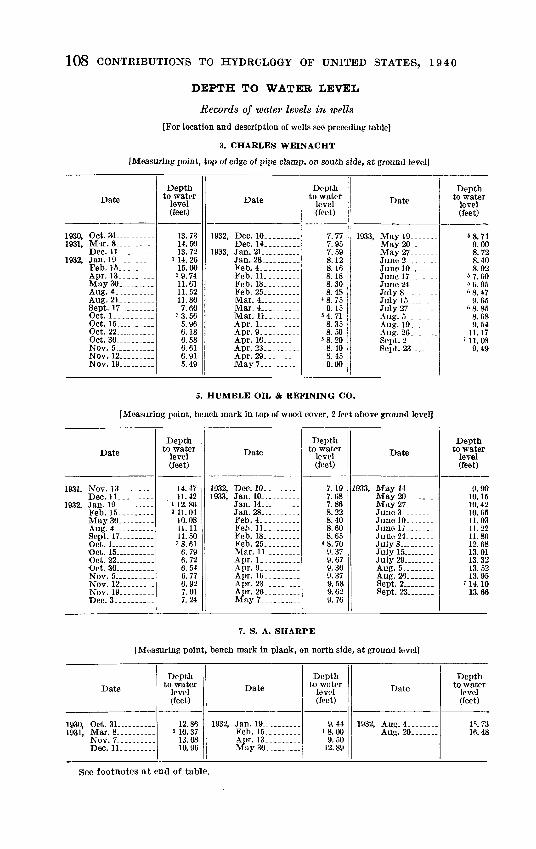
DEPTH TO WATER LEVEL
Records of water levels in wells
[For location and description of wells see preceding table]
3. CHARLES WEINACHT
[Measuring point, top of edge of pipe clamp, on south side, at ground level]
Date
1930, Oct. 31 -----1931, Mar. 8 . ._
Dec. 11 1932, Jan. 19
Feb. 15.. ._.._-.Apr. 13... ------May 30 Aug. 4..-....--.Aug. 21 Sept. 17 -Oct. 1__... . _Oct. 15 Oct. 22 ------Oct. 30 _ Nov. 5-.. ------Nov. 12 Nov. 19
Depth to water
level (feet)
13.7314.5013.72
i 14. 2615.00^9.7411.6111.5211.80
3 3. 565.966.186.586.616.915.49
Date
1932, Dec. 10_--__ ____
1933, Jan. 21__. .Jan. 28-- .__. -Feb. 4- _Feb. ll__ Feb. 18. .- --Feb. 25--.__
Mar. 11__ .-.Apr. 1.... _.__Apr. 9- _Apr. 16. -Apr. 23_ - .. .Apr. 29.-. _.
Depth to water
level (feet)
7.777.95
8.128.168.188.308.48
4 8. 759.15
54.718.358.50
«8.208.408.459.00
Date
1933, May 19. _._.-_^M.BV *^0May 27
July 8
July27___-__._
A 110- 1 Q
Sept. 2_
Depth to water
level (feet)
58.749 008.72
57.6056.95
6 8. 858.68
11.17'11.08
5. HUMBLE OIL & REFINING CO.
[Measuring point, bench mark in top of wood cover, 2 feet above ground level]
Date
1931, Nov. 13 ---
Feb. 15-. -_.
Sept. 17 Oct. 1 Oct. 15- Oct. 22
Nov. 12
Depth to water
level (feet)
14.4711.42
' i 12. 862 11. 04
10.0811.1111.5038.61
6.796.726.546.776.927.017.24
Date
1932, Dec. 10 1933, Jan. 10... ____
Jan. 14 Jan. 28 Feb. 4.. ._____..Feb. 11__ ____..Feb. 18-. Feb. 25__-______Mar. 11 Apr. 1 Apr. 9__-_ .... ..Apr. IB-Apr. 23...- _-.-Apr. 26... _ .__May 7.
Depth to water
level (feet)
7.197.687.868.228.408.608.65
*8. 709.379.679.309.379.589.629.76
Date
1933, May 14 .._._.May 20-- .May 27
June 10.
June 24.. JulyS July 15 July 29 .
Aug. 26 Sept. 2 .Sept. 23 -
Depthto water
level (feet)
9.9010.1510.4210.6511.03
11.8012.6813.0113.3213.5213.95
' 14. 10
7. S. A. SHARPE
[Measuring point, bench mark in plank, on north side, at ground level]
Date
Dec. 11-
Depth to water
level (feet)
12.86a 10. 37
13.0810.96
Date
1932, Jan. 19 ______Feb. 15. .._--.__Apr. 13 May 30_ _ _ _ _
Depth to water
level (feet)
9.4418.00
9.5012.89
Date
1932, Aug. 4 Aug. 20 ___ .,
Depth to water
level (feet)
I 1). 7316.48
See footnotes at end of table.
BALMORHEA AREA, TEXAS1 109
Records of water levels in wells Continued
10. W. A. KNAPP
[Measuring point, bench mark in east end and south side of middle cross beam, 1 foot above ground level]
Date
1930, Nov. 1.. ........1931, May8..........
Nov. 4.... ....Dec. 11-,.....-.
1932, Jan. 19 .. . .Feb. 13. ........Apr. 13_... ....May 30.. .......
Aug. 20_ . -_
Oct. I..- .... .Oct. 8_. _________Oct. 15... .......Oct. 22... ...... _Oct. SO..........
Depthto water
level (feet)
12.2211.009.89
13.021 12. 792 11. 00
11.0010.8010.8511.59
3 4. 514.805.185.385.816.36
Date
1932, Dec. 12.. .......1933, Jan. 10.. ....__..
Jan. 14-.-...-...Jan. 21 Jan. 28...... ....Feb. 4..........Feb. 11. .._.__..Feb. 18... ......Feb. 25.. .......Mar. 4__ ........TV/Tor 1 1
Apr. 1. .........Apr. 9_..__ .....Apr. 16. ..______Apr. 23... ....Apr. 29.. ...__._
Depth to water
level (feet)
6.087.187.477.307.457.607.988.168.35
* 8. 6368.22
8.808.788.288.648.408.85
Date
1933, May 14.......May20 May 27 ...
JunelO.. _____June 17. _ ...June24..-__ __July 8__. ______July 15... July 29 _____
Aug. 12_._____Aug. 19 Aug. 26... ....Sept. !-___ .Sept. 23 .___
Depth to water
level (feet)
8.809.059.038.709.188.809.129.229.789.699.98
10.5210.1810.7010.78'7.58
12. HILL
[Measuring point, top edge of upper wood frame, on east side opposite cut in frame, at ground level]
Date
1930, Nov. 3____. ______1931, Dec. 11 . ..1932, Jan. 19...._ .....
Feb. 15 Apr. 13- -
Aug. 20 -----Sept. 17. ________Oct. 15 - Oct. 22- Oct. 30-.. . ______Nov. 5 Dec. 10- -
1933, Jan. 10 - Jan. 14.... ______
Depth to water
level (feet)
11.7011.89
i 13. 1013.00
2 9. 2311.429.98
10.725.79
= 5 465.796.186.467.0ti7.867.93
Date
1933, Jan. 21---.
Feb. 4__. ________Feb. !!____ _-___Feb. 14___-______Feb. 25- ________
Mar. 11__________
Apr. 16
Apr. 29__________
Depth to water
level (feet)
8.03
8.608.628.708.76
<9. 008.368. 68
6S.22B 8. IS
8.688.478.228.758.S5
Date
1933, May 28
June 18
JulyS July 15- _______July 29_. -_.___
Aug. 11________Aug. 19 _____
Sept 23
Depth to water
level (feet)
8.859.138.909.209.459.059.089.509.82
«9.7410.08'9.32
8.66
See footnotes at end of table.
110 CONTRIBUTIONS TO HYDROLOGY OF UNITED STATES, 1940
Records of water levels in wells Continued16. A. W. WIGLEY
[Measuring point, southwest edge of concrete cross beam, opposite cut in concrete, at ground level]
Date
1930, Nov. 1 -
Nov. 12.... ......Nov. 19 Nov. 23_ . _ ..
Jan. 9-.- .. Jan. 16. ....... ..Jan. 23.........Jan. 28. .----.-..
Feb. 6. .Feb. 11.--. - _ .Feb. 13_. ...... _.Feb. 20_._ ....Feb. 23... .......Feb. 27.. ........Feb. 29 ....
Mar. 12_ _ . _ -Mar. 19-
Depth to water
level (feet)
6.894.204.915.505.73f. QQ
5.695.875.795.83
15.775.675.765.735.67<l 7Q4.93
*2.354.154.19
22.553.413.533.714.224.21
Date
1932, Mar. 21
Apr. 2
Apr. 12 Apr. 16 ...... .Apr. 23
May 28...- _ ...
June30_- ___ ..July 2-. ....July 4...... ..July9. .... ...July 16.. ... ..July 22. .........
Depthto water
level (feet)
s 2. 554.114.45
3.254.184.41
« 3. 253.874.P94.854.95
«3.453.864.50
« 3. 153.684.05
«3.724.244.665.45
«4.055.355.56
«3.35
Date
1932, July 23. ... .
Aug. 6 ... ..Aug. 13- __ .Aug. 16- _ .-.-
Sept. 3_. -----
Sept. 4-- -Sept 10-...._-Sept. 17..- Sept. 24---.--.Oct. 1...... ...Oct. 9__ .Oct. 15-.-- .Oct. 22--. Oct. 29. Nov. 5 -----
1933, July 29
Aug. 26 .Sept. 2 Sept. 23.......
Depth to water
level (feet)
4.075.295.866.046.16
55.4733.35
4.254.251.47«.821.972.762.91
«1.032.372.171.892.152.734.45
«4-314.13
«3.233.65
20. TOYAH VALLEY STATE BANK[Measuring point, cross in top of west brick in top row, at ground level]
Date
1930, Nov. 1- _ ......1931, Mar. 8. .........
Nov. 10. _ .....Dec. 11 .
1932, Jan. 19. .Feb. 15
Aug. 20 ___ ...Sept. 17. .....Oct. 1... __ ...Oft. 15. .........Oct. 22..... .....Oct. 30. .........Nov. 5.. Nov. 12.- .Nov. 19...
Depth to water
level (feet)
5.695.705.675.60
15.4523.95
4.94.953.8
22.563.513.553.964.044.144.19
Date
1932, Dec. 10. __ ....1933, Jan. 10 __ .....
Jan. 21.... .Jan. 28_ _ .. _ .Feb. 4- Feb. 11 Feb. 18 ......Feb. 25 ......
Mar. 11.. __ ,.Apr. 1-.. ...
Apr. 16_, __ ...Apr. 22.. ...... ..
Depth to water
level (feet)
4.283.984.094.004.084.084.104.00
<3.924.023.733.743.803.674.033.96
Date
1933, May 14 . May 20 ..........May 27. ... ...
JulyS. _ ....July 16..........July 21... ... .
Aug. 11. Aug. 19 .
Sept. 2....... ...Sept. 25. ____
Depth to water
level (feet)
4.034.204.584.354.504.404.304.765.004.804.794.924.62
"4.724.043.36
22. PECOS VALLEY SOUTHERN RAILWAY[Measuring point, copper-nail bench mark, on south side of well curb, 3 feet above ground level]
Date
1930, Nov. 1. ___1931, Mar. 8. .....
Dec. 10 ......1932, Feb. 15 __ ..
Apr. 13 May 30. .....
Aug. 20 ......Sept. 17. Oct. 1. ......
Water level above (+)
or below ( ) measuring point (feet)
-5.56-4.50-1.65
2 1 00-1.00 -0.4 -1.18-1.80
«+1.3 8+3.9
Date
1932, Oct. 15 ......Oct. 22. .....Oct. 20 ......Nov. 5__ Nov. 10.. _ Nov. 19.....
1933, Apr. 1 _
Apr. 16-. .... Apr. 23
Water level above (+)
or below ( ) measuring point (feet)
+1.92+3.22+0.15
-1.28 0.49 -1.00-1.10-1.14 -1.20
Date
1933, Apr. 29
May 14
May 28 June 11 ....
T)n
June 25 ...
Water level above (+)
or below ( ) measuring point (feet)
-1.18-1.30-1.32-1.52-1.65 -1.78
-2.00-2.00
See footnotes at end of table.
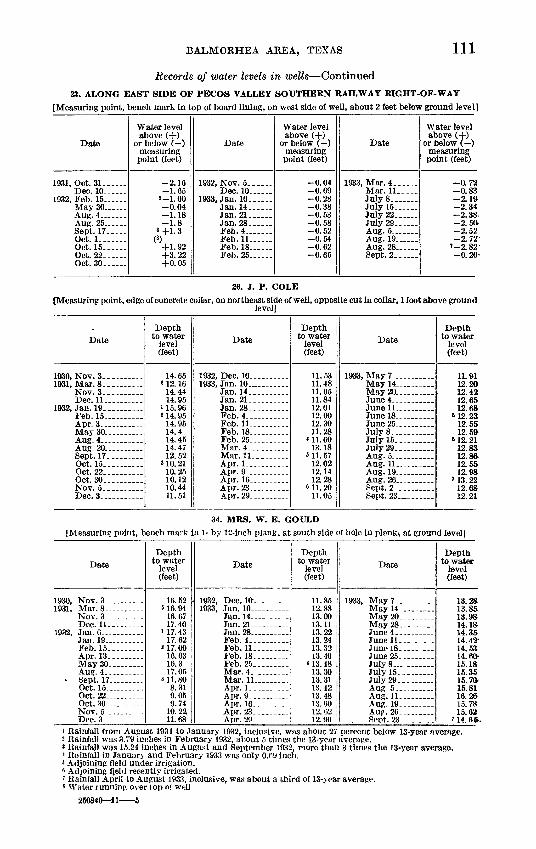
BALMORHEA AREA, TEXAS 111
Records of water levels in wells Continued
23. ALONG EAST SIDE OF PECOS VALLEY SOUTHERN RAILWAY RIGHT-OF-WAY[Measuring point, bench mark in top of board lining, on west side of well, about 2 feet below ground level]
Date
1931, Oct. 31 Dec. 10 _
1932, Feb. 15......
Sept. 17. Oct. 1 ._Oct. 15......
Oct. 30.. .
Water level above (+)
or below ( ) measuring point (feet)
-2.16-1.65
2-1.00
-0.04-1.18-1.8
8+1.3(s)
+1.92+3.22+0.05
Date
1932, Nov. 5.- Dec. 10. ._
1933, Jan. 10 Jan. 14......Jan. 21. ..
Feb. 4.......Feb. 11... ...Feb. 18 -Feb. 25... ...
Water level above (+)
or below ( ) measuring point (feet)
-0.04-0.69-0.28-0.38-0.53-0.58-0.52-0.54-0.62-0.65
Date
1933, Mar. 4.. .Mar. 11.....JulyS.......July 15......July 22......July 29.. .
Aug. 19_. ...Aug. 28 ......Sept. 2......
Water level above (+)
or below ( ) measuring point (feet)
-0.72-0.83-2.19-2.34-2.38--2. 5ft*-2.52-2.72
'-2.82-0. 20-
26. J. P. COLE[Measuring point, edge of concrete collar, on northeast side of well, opposite cut in collar, 1 foot above ground
level]
Date
1930, Nov. 3. - 1931, Mar. 8..-
Nov. 3.-- Dec. 11_. ........
Feb. 15 .
May 30 .
Aug. 20_. .Sept. 17. Oct. 15.... ...Oct. 22...... ....Oct. 30... _ .Nov. 5..
Depth to water
level (feet)
14.65* 12. 16
14.4414.95
i 15. 962 14. 95
14.9514.414.4514.4712.52
3 10. 2110.2510.1210.4411.51
Date
1932, Dec. 10 1933, Jan. 10. ........
Jan. 14_. ........Jan. 21. _..____..
Feb.4 __ Feb. 11 .... ...Feb. 18... .......Feb. 25. .....
Mar. 11........ .Apr. 1.. .........
Apr. 16_. ...._...Apr. 23 ...
Depth to water
level (feet)
11.5311.4811.6511.8412.0112.0012.3011.28
Ml. 6013.18
«11.5712.0212.1412.28
« 11. 2011.05
Date
1933, May 7 .......May 14__. . ......May 20 .......
June 18 ....June25_. __ ....July 8... ........July 15.. ........July 29.... ......
Aug. 11-.....-..
Aug. 26... .......
Sept. 23. .......
Depthto water
level (feet)
11.9112.2012. 4212.6512.68
'12.23,12.5512.59
0 19 91
12.8312.8ft12.5512.98
' 13. 2212 6819 91
34. MRS. W. E. GOULD[Measuring point, bench mark in 1- by 12-inch plank, at south side of hole in plankv at ground level]
Date
1930, Nov. 3- ...
Nov. 3 Dec. 11.. __ ...
Feb. 15.. Apr. 13 May 30 ......
Sept. 17 Oct. 15 ......Oct. 22 - Oct. 30.
Dec. 3__. _______
Depth to water
level (feet)
16.52»16.94
16.6717.40
i 17. 4317.62
217.0016.6316.317.05
311.808.319.059.74
10.22,11.68
Date
1932, Dec. 10.. .-..-__
Jan. 14 ' Jan. 21
Jan. 28... _._
Feb. 11.........Feb. 18... Feb. 25.........Mar. 4. ....___.Mar. ll_ _ Apr. !_-.___ __.
Apr. 16 Apr. 23-. ... .Apr. 29_________
Depth to water
level (feet)
11.8512.8813.0013.1113.2213.2413. 3213.40
*13.4813.3013.3113.4213.4813.6012.6212.90
Date
1933, May 7 ... ...
May 28. ...
June 25_. _ -._.
July 15.-. July 29. ... ...
Aug. 11
Sept. 23__ ......
Depthto water
level (feet)
13.2813.85.13. 9»14.18-14. 3&14.42-
14.60-15.1815.3515. 7015.8116. 2615.78
' 14. 65..
1 Rainfall from August 1931 to January 1932, inclusive, was about 27 percent below 13-year average.2 Rainfall was 3.79 inches in February 1932, about 5 times the 13-year average.» Rainfall was 15.24 inches in August and September 1932, more than 3 times the 13-year average.1 Rainfall in January and February 3933 was only O.fi9 inch.5 Adjoining field under irrigation.« Adjoining Qeld recently irrigated. " Rainfall April to August 1933, ii s Water running over top of well
250849 41 5
nclusive, was about a third of 13-year average.
112 CONTRIBUTIONS TO HYDROLOGY OF UNITED STATES, 1940
INTAKE OF GROUND WATER
AREAS OF INTAKE
As has been pointed out in the section on the geology of this district (pp. 90-97), the principal area of intake or replenishment for the large springs at Balmorhea is within a long narrow anticlinal valley that parallels the eastern escarpment of the Davis Mountains west, northwest, and southwest of the springs. In this valley the beveled edges of the Lower Cretaceous limestones appear at the surface or lie beneath a mantle of stream and terrace gravel not far below the sur face, and their honeycombed and cavernous members absorb and store a large part of the local rainfall and mountain run-off. The length of this intake area is not exactly known. It is believed, however, that the limestones may take hi water along the anticline «,!! the way from Big Aguja Canyon northwestward to the vicinity of San Martine, in Pecos County, a distance of about 35 miles. (See fig. 4.)
The creeks from Big Aguja, Little Aguja, Madera, and Cherry Canyons lose heavily between the mouths of their canyons and the downstream boundary of the anticline. The Lower Cretaceous rocks take in considerable water, also, in an area of outcrop along Limpia Creek about 20 miles southeast of Balmorhea. Practically all the discharge of Limpia Creek disappears during moderate and low stages in that locality.
The lavas of the Davis Mountains have an important part in the intake system. They absorb much of the mountain rainfall and run-off. The water moves downward through joints and crevices in the rocks until it reaches relatively impermeable layers of volcanic rock or tuff or underlying Upper Cretaceous clays. It then moves laterally and appears as springs or seeps in the mountain canyons and on the slopes of the eastern escarpment, where it is largely -dissipated by evaporation and transpiration. A part, however, reaches the canyon streams, in places maintaining a small perennial flow, or is absorbed by the gravels of the streams and adjacent tterraces. In at least one locality considerable stream water ap parently is absorbed by the volcanic rocks in places where synclinal structure has brought them below stream level. This is on Limpia Creek near old Limpia post office, about 15 miles south of Balmorhea. The water that enters there may rise into the stream gravels below the lower limb of the syncline and through them eventually reach the .intake area of the Lower Cretaceous rocks, 15 to 20 miles below.
The gravels, also,'have an important part in the intake system. Much of the district between Balmorhea and the mountains is under lain by stream and terrace gravels, and in places tongues of these gravels extend a considerable distance into the mountains. The
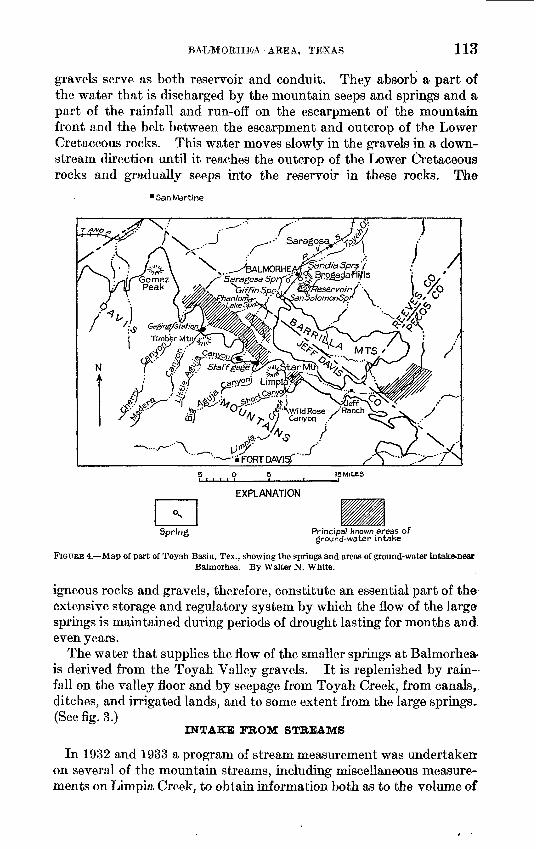
BALMORHEA AREA, TEXAS'
gravels serve as both reservoir and conduit. They absorb a part of the water that is discharged by the mountain seeps and springs and a part of the rainfall and run-off on the escarpment of the mountain front and the belt between the escarpment and outcrop of the Lower Cretaceous rocks. This water moves slowly in the gravels in a down stream direction until it reaches the outcrop of the Lower Cretaceous rocks and gradually seeps into the reservoir in these rocks. The
SanMartine
EXPLANATION
Spring Principal known areas of ground-water intake
FIGUEE 4. Map of part of Toyah Basin, Tex., showing the springs and areas of ground-water intake-near Balmorhea. By Walter N. White.
igneous rocks and gravels, therefore, constitute an essential part of the extensive storage and regulatory system by which the flow of the large springs is maintained during periods of drought lasting for months and even years.
The water that supplies the flow of the smaller springs at Balmorhea' is derived from the Toyah Valley gravels. It is replenished by rain fall on the valley floor and by seepage from Toyah Creek, from canals,, ditches, and irrigated lands, and to some extent from the large springs..(See fig. 3.)
INTAKE FROM STREAMS
In 1932 and 1933 a program of stream measurement was undertaken- on several of the mountain streams, including miscellaneous measure ments on Limpia Creek, to obtain information both as to the volume of
114 CONTRIBUTIONS TO HYDROLOGY OF UNITED STATES, 1940
run-off from the mountains and the extent of losses by seepage from the mountain streams in crossing the intake area of the Lower Cretace ous limestones. A permanent gaging station was established in Ma- dera Canyon and equipped with a continuous water-stage recorder. Temporary staff gages were installed on the streams that issue from Cherry, Big Aguja, and Little Aguja Canyons and read daily or weekly for several months. Many miscellaneous measurements of the dis charge of these streams and of Limpia Creek were made with a current meter, and several series of such measurements were made on each stream to determine seepage losses on the intake area of the Lower Oetaceous limestones and gains and losses in several other sections, mostly below the mouths of the canyons. Most of the "seepage measurements" were made on a declining stage and therefore tend to show losses in each section smaller than the true losses, or even a gain -when actually there may have been a substantial loss. However, in making the measurements, the stream gager moved in a downstream direction at a rate not much faster than the movement of the stream; in this way a large part of the error, due to changes in stage while the seepage measurements were in progress, can be eliminated, and reasonably accurate estimates can be made of the losses and gams in the sections during periods when the rates of stream discharge were 'Comparable.
The records obtained at the gaging stations on Limpia and Barilla 'Creeks and in Madera Canyon have been published in several reports of the Geological Survey on stream measurement. Most of the results of the measurements in 1932 and 1933 were published hi Water-Supply Paper 748 1 and are republished in this report (see pp. 121-144). These results are discussed below by streams,
LIMPIA CREEK
Two gaging stations have been maintained on Limpia Creek. The upper one, known as Limpia Creek, near Fort Davis, was near the site of the old Limpia post office, in the canyon about 16 miles south of Balmorhea. The lower one, known as Barrilla Creek, near Sara- gosa, was about 30 miles downstream, on the bridge at the crossing of State Highway 190 (Old Spanish Trail), where the stream is com monly known as Barrilla Creek or Draw. The site of the upper station is above any known outcrop of the Lower Cretaceous lime stones, whereas the lower site is below a section in which the streams vcross several miles of outcrop of these limestones.
The upper station was established February 27, 1925, and main tained until August 30, 1932, when it was destroyed by flood. The lower station was installed December 6, 1924, and discontinued July
i Surface-water supply of the United States, 1933, parts, Western Gulf of Mexico basins: U. S. Qeol. Survey Water-Supply Paper 748, pp. 140-160,171-174,1935,
BALMORHEA AREA, TEXAS 115
15, 1926. It was reestablished September 20, 1932, and a few days later, on September 29, was destroyed when the highway bridge was carried away by one of the largest floods that has occurred on this creek in tk& memory of residents in this part of Texas. Neither station was rebuilt. Funds were not available to meet the high cost of construction of the type of gaging station necessary to withstand large floods. Moreover, in the stretch of the creek in which the lower station is located, the shifting of the channel with each flood prevents the compilation of a satisfactory rating curve.
The flood of August 30, 1932, which destroyed the upper station, is estimated to have reached a peak discharge of about 14,000 second- feet. During most of the period from December 6, 1924, to July 15, 1926, there was no discharge at either station, but from March to September 1925 several runs of storm, water occurred, in which the discharge amounted to a total of about 4,800 acre-feet at the upper station and about 11,000 acre-feet at the lower station. The sites of the two stations are about 40 miles apart, and the drainage from about 100 square miles of mountains, mostly less than 5,000 feet in altitude, enters the stream between them.
The yearly discharge of Limpia Creek at the upper station in Limpia Canyon is given below:
Discharge of Limpia Creek in Limpia Canyon 16 miles southwest of Balmorhea
{Drainage area, 272 square miles. Water year October 1 to September 30]Acre-feet
1925, Feb. 27 to Sept. 30__.____. _..__.___.___... 4,0801925-26__________-____.__.____._______--__--__-__---- 5, 7701926-27----_____--_-_-_-_______-______---___--------- 6611927-28__--___--_-_-_--__-____-___-__--_-_---_--_---- 7, 1601928-29__._...__..__...._..__.....-_.___._._.---_._-- 8391929-30___.___..._...__..__..._.__..__.-__.._-_______ 8941930-31_-_-___-___---__-_-_-.-_--___-_--_____-.------ 1, 6101931-32 (Oct. 1 to Aug. 27)...__.._.------------------- 2, 590
Five series of current-meter measurements were made on Limpia Creek to determine seepage losses and gains in several stretches above and below the site of the gaging station in Limpia Canyon. These measurements indicate that the volume of the stream is increased by the inflow of seepage from the vicinity of Fort Davis down to a point about 2 miles above the site of the gage. Below that point, the stream loses water in several stretches and disappears entirely during low and moderate stages before reaching observation points 19 to 22 miles below the station, that is, 9 to 12 miles below the Jeff ranch. (See fig. 3.) The loss in the vicinity of the gaging station was as follows: October 8, 4.2 second-feet; November 1, 8.6 second-feet; November 21, 4.1 second-feet; August 3, 1933, 12.6 second-feet. The loss between
116 CONTRIBUTIONS TO HYDROLOGY OF UNITED STATES, 1940
the Jeff ranch and points of measurement half a mile to a mile downstream was 6.2 feet on November 1, 1932, and 2.4 second-feet on November 21, 1932. On October 8, 1932, a flow of 65.1 second- feet disappeared between the Jeff ranch and the observation point 12 miles downstream.
MADERA CANYON
The gaging station in Madera Canyon is located about three- quarters of a mile above the mouth of the canyon. It was installed July 28, 1932, and has been in continuous operation ever since. As estimated from the topographic maps of the Fort Davis and Valentine quadrangles, the canyon drains about 54 square miles above the gage, the area consisting of the slopes of mountains most of whose summits are more than 5,500 feet above sea level. The daily records at the station have been published each year by the Geological Survey. 2 These records are fairly accurate for low and moderate stages of stream discharge but much less accurate for high stages. The estimated total annual discharge for each of the years in the period 1932-36 is given in the following table:
Discharge of Madera Canyon, 1982-86
[Water year, Oct. 1 to Sept. 30]Acre-feet
1932, Aug. 1 to Sept. 30......__.._.__.___.____.___.... 14, 8001932-33_. ____ ___________________________________ 6,0001933-34_._............ _......__ . ___........_.. 2441934-35._______ ................................... 6371935-36.-__...._.._.__.__._.___.__________.__.___.__ 4, 200
According to the daily record, the discharge from August to October 1932 amounted to about 17,000 acre-feet (see table, p. 122), or approxi mately two-thirds of the total recorded discharge in the period 1932- 36. Altogether, in this period of 4 years and 2 months there were 64 days on which the average discharge during the 24 hours was more than 25 second-feet. Of these days, 25 were in August, September, and October 1932, 18 in August and September 1933, 1 in July 1935, and 20 in May and September 1936. During most of the period the stream was dry or the daily discharge was less than 3 second-feet. The maximum discharge, somewhat more than 2,000 second-feet, oc curred on September 29 and 30, 1932.
Nine series of discharge measurements were made to determine seepage losses from Madera Canyon between the gaging station and points 2 to 10 miles below it. The maximum flow at the gaging sta tion during these studies was 67.5 second-feet, the minimum 5.2 second- feet, and the average about 27 second-feet (see table, p. 123). None of the water reached Toyah Creek, about 12 miles below the station, and
2 See records for Madera Canyon near Toyah vale, Tex., in Water-Supply Papers 748, 763, 788, 808, 828, and 868.
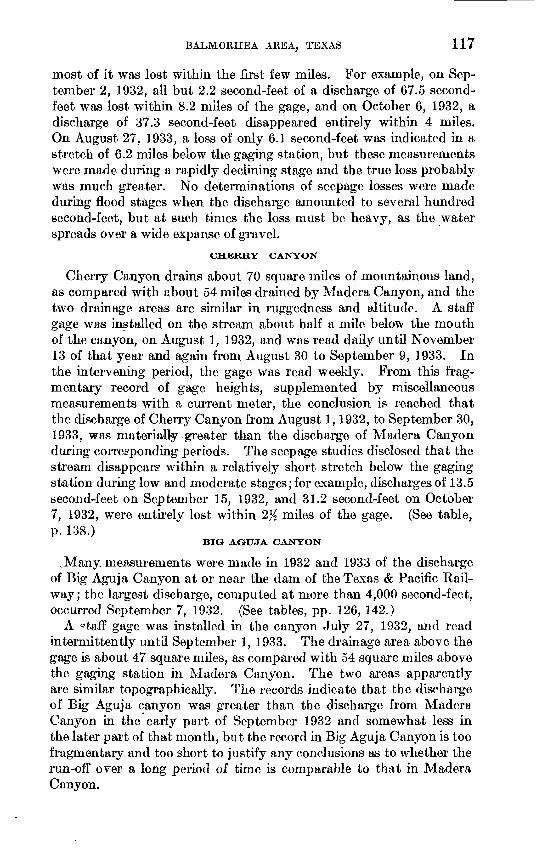
BALMORHEA AREA, TEXAS 117
most of it was lost within the first few miles. For example, on Sep tember 2, 1932, all but 2.2 second-feet of a discharge of 67.5 second- feet was lost within 8.2 miles of the gage, and on October 6, 1932, a discharge of 37.3 second-feet disappeared entirely within 4 miles. On August 27, 1933, a loss of only 6.1 second-feet was indicated in a stretch of 6.2 miles below the gaging station, but these measurements were made during a rapidly declining stage and the true loss probably was much greater. No determinations of seepage losses were made during flood stages when the discharge amounted to several hundred second-feet, but at such times the loss must be heavy, as the water spreads over a wide expanse of gravel.
CHERRY CANYON
Cherry Canyon drains about 70 square miles of mountainous land, as compared with about 54 miles drained by Madera Canyon, and the two drainage areas are similar in ruggedness and altitude. A staff gage was installed on the stream about half a mile below the mouth of the canyon, on August 1, 1932, and was read daily until November 13 of that year and again from August 30 to September 9, 1933. In the intervening period, the gage was read weekly. From this frag mentary record of gage heights, supplemented by miscellaneous measurements with a current meter, the conclusion is reached that the discharge of Cherry Canyon from August 1,1932, to September 30, 1933, was materially greater than the discharge of Madera Canyon during corresponding periods. The seepage studies disclosed that the stream disappears within a relatively short stretch below the gaging station during low and moderate stages; for example, discharges of 13.5 second-feet on September 15, 1932, and 31.2 second-feet on October 7, 1932, were entirely lost within 2% miles of the gage. (See table, p. 138.)
BIG AGUJA CANYON
.Many measurements were made in 1932 and 1933 of the discharge of Big Aguja Canyon at or near the dam of the Texas & Pacific Rail way; the largest discharge, computed at more than 4,000 second-feet, occurred September 7, 1932. (See tables, pp. 126, 142.)
A ftaff gage was installed in the canyon July 27, 1932, and read intermittently until September 1, 1933. The drainage area above the gage is about 47 square miles, as compared with 54 square miles above the gaging station in Madera Canyon. The two areas apparently are similar topographically. The records indicate that the discharge of Big Aguja canyon was greater than the discharge from Madera Canyon in the early part of September 1932 and somewhat less in the later part of that month, but the record in Big Aguja Canyon is too fragmentary and too short to justify any conclusions as to whether the run-off over a long period of time is comparable to that in Madera Canyon.

118 CONTRIBUTIONS TO HYDROLOGY OF UNITED STATES, 1940
Seepage surveys were made on September 1, 3, and 13 and October 6, 1932 (see table, p. 142) to determine losses between the gaging sta tion and Toyah Creek, 9.6 miles below the gage. On September 1 the entire flow, amounting to 18.7 second-feet, was lost before Toyah Creek was reached. Similarly, on September 13, the entire flow of 8.6 second-feet was lost. On October 6, the loss was 18.4 second-feet, including the discharge at the station and the inflow from tributaries below. On September 3, only 26.6 second-feet was lost from a dis charge of 45.4 second-feet, but the measurements 011 that date were taken on a rapidly declining stage and the actual loss probably was greater.
LITTLE AQUJA CANYON
Many measurements of the discharge of Little Aguja Canyon and of its South Fork were made in 1932 and 1933 (see table, p. 125), and the maximum discharge from the main canyon was estimated as 2,640 second-feet on August 29, 1932. The stage of the stream was recorded daily for a few weeks in the later part of the summer of 1932 at a temporary staff gage, set at a point in the canyon above which approximately 31 square miles is drained. From the gage-height record and a few current-meter measurments, it is estimated that the discharge of the canyon during July and August was about 8,000 acre-feet, or a little more than half the discharge of Madera Canyon.
Seepage surveys were made on this stream August 17, September 1,13, 14, and 20, and October 6, 1932. In these surveys, it was found that the entire discharge of the stream, ranging from 1.3 to 26.8 second-feet, was lost before Toyah Creek was reached (see table, p. 125).
DISCHARGE OF GROUND WATER
The table below, compiled from the gaging records, gives the approxi mate mean discharge of Phantom Lake, San Solomon, Giffin, West Sandia, and East Sandia Springs for the period of record, October 1931 to September 1933.
Mean discharge of Phantom Lake, San Solomon, Giffin, West Sandia, and East Sandia Springs, in second-feet
[For records of daily discharge see pp. 127-138]
Phantom Lake... ________ . ______ . ________ ______ . ...
GiffinWest Sandia-----..... __ ...-.-...........................-.....-. .- .
Total . - _ _-. .._... .
1
13334.71.1
1 1.1
63
2
35605.61.71.3
104
3
18405.01.31.2
65
1. October 1931; December 1931 to August 1932.2. September to December 1932.3. January 1933.
BALMORHE'A AREA, TEXAS . 119
The total discharge of the five springs amounted to 53 second-feet, or about 23,800 gallons a minute, in the first period; 104 second-feet, or about 46,700 gallons a minute, in the second period; and 65 second- feet, or about 29,300 gallons a minute in the third. In the first period the rainfall at Balmorhea was materially above the average, due to a fall of 2.25 inches in December 1931 and 3.79 inches in February 1932. In the second period the rainfall was abnormally high, amounting in the month of September alone to 11.64 inches, or about 85 percent of the average annual rainfall. In the third period, the rainfall was about 40 percent below the average. The total discharge during the three periods, aggregating almost 2 years, was at the average rate of about 48,000 acre-feet a year.
The records of the combined discharge of the Saragosa and Toyah Creek Springs are too few to warrant making an estimate of their mean discharge during the same periods, but the available measure ments indicate that it may have been about 9 to 10 second-feet, or at the rate of 6,500 to 7,000 acre-feet a year. Thus the flow of all the springs from the fall of 1931 to the fall of 1933 probably averaged about 54,000 to 55,000 acre-feet a year.
As approximately 25,000 acre-feet of the discharge occurred in the 4 months September to December 1932, following abnormally heavy rains, the mean discharge of the springs during the period of record, must have been materially greater than their long-time average discharge.
CONCLUSIONS
Phantom Lake, San Solomon, and Giffin Springs are fed from an extensive system of solution channels in Lower Cretaceous limestone, that constitute in the aggregate a very large reservoir. The Lower Cretaceous rocks are underlain by rocks of Permian age, which in other parts of the basin of Toyah Creek yield water that is rather highly mineralized. Water enters the Lower Cretaceous limestone along the front of the Davis Mountains, and probably all or nearly all of that water is discharged by the springs. The limestone is close to the surface along the northeast edge of a syncline at Phantom Lake Spring. A few hundred feet east of the spring relatively im permeable strata of Upper Cretaceous age are dropped down against the limestone on the northeast side of a fault, thereby creating a barrier which causes the water to rise to the surface in the spring. The throw of this fault is not great, and a large part of the underground water escapes over the crest of the barrier and continues underground toward San Solomon and Giffin Springs. In the vicinity of San Solomon Spring the limestone again comes nearly to the surface, and a short distance east of the spring the Upper Cretaceous strata crop out
120 CONTRIBUTIONS TO HYDROLOGY OF UNITED STATES, 1940
in such a way that it seems necessary to assume that here, also, they are dropped down against the limestone on the northeast side of a fault. This fault presumably is of considerably greater throw than the one immediately below Phantom Lake Spring. It may create a practi cally complete barrier to the movement of the water in the limestone and bring all or nearly all of the flow to the surface in San Solomon and Giffin Springs.
Saragosa, West Sandia, East Sandia, and Toyah Creek Springs have their source in the relatively thin surficial gravel. In the valley be tween Toyah vale and the Brogada Hills the maximum depth of the gravel is not more than 60 feet, and in most places it is less than 40 feet. Between the Brogada Hills and Saragosa the gravel and asso ciated sand, silt, and clay are several hundred feet thick; there the deposits are not very permeable and the water table is low.
A well put down in the vicinity of Phantom Lake or San Solomon Springs above the faults might tap the limestone reservoir at shallow depth, but it would be practically certain to decrease the flow of the springs. Between the San Solomon Spring-Gifnn Springs fault and the Brogada Hills the water-bearing horizon in the Lower Cretaceous limestone is probably from 500 to 1,000 feet beneath the surface, perhaps between 700 and 800 feet. If the fault barrier just below the springs is very tight, the withdrawal of water from the limestone in this stretch by means of a well would not affect the flow of the springs. If the barrier is not complete, a well in that area would tend to decrease the flow of the springs. In this connection, the following possibility should be kept in mind: If the fault below the springs offers an effective barrier to the down-valley movement of the water underground, solu tion channeling may not have developed extensively in the limestone below the barrier because of lack of circulation. If the limestone be tween San Solomon Spring and the Brogada Hills is relatively tight the water in it may be comparatively highly mineralized.
Before a well is put down in this part of the valley the San Solomon and Gifnn Springs should be equipped with automatic measuring devices and an accurate continuous record kept of their flow. A simi lar record should be kept while the well is being operated to determine whether its operation affects the springs.
Shallow wells in the gravel in parts of the Balmorhea district may yield a few second-feet of water, but such wells, if improperly located or pumped too heavily, may deplete the flow of Toyah Creek, Saragosa, or Sandia Springs. The flow of these springs is effectively utilized only during the growing season, and in view of this and of the urgent need for an additional supply of water during the relatively short critical period of the growing season, an attempt to develop shallow
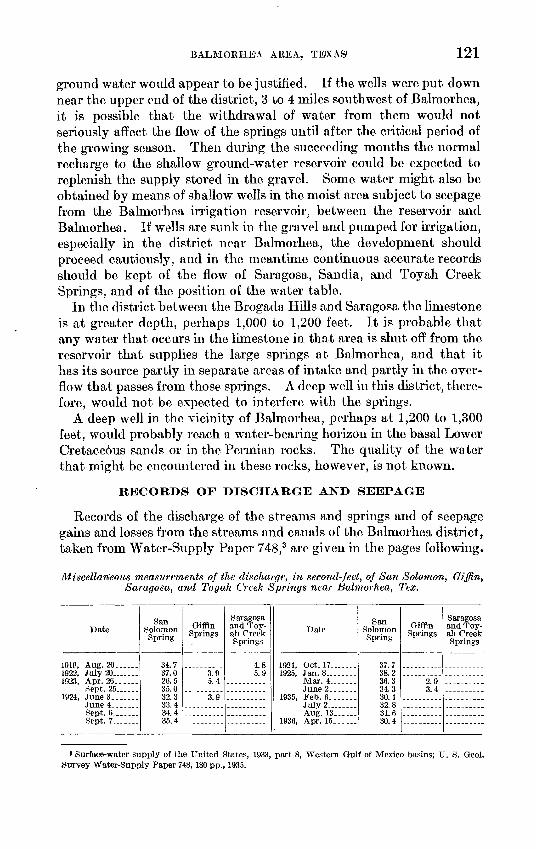
BALMOEHE'A AREA, TEXAS' 121
ground water would appear to be justified. If the wells were put down near the upper end of the district, 3 to 4 miles southwest of Balmorhea, it is possible that the withdrawal of water from them would not seriously affect the flow of the springs until after the critical period of the growing season. Then during the succeeding months the normal recharge to the shallow ground-water reservoir could be expected to replenish the supply stored in the gravel. Some water might also be obtained by means of shallow wells in the moist area subject to seepage from the Balmorhea irrigation reservoir, between the reservoir and Balmorhea. If wells are sunk in the gravel and pumped for irrigation, especially in the district near Balmorhea, the development should proceed cautiously, and in the meantime continuous accurate records should be kept of the flow of Saragosa, Sandia, and Toyah Creek Springs, and of the position of the water table.
In the district between the Brogada Hills and Saragosa the limestone is at greater depth, perhaps 1,000 to 1,200 feet. It is probable that any water that occurs in the limestone in that area is shut off from the reservoir that supplies the large springs at Balmorhea, and that it has its source partly in separate areas of intake and partly in the over flow that passes from those springs. A deep well in this district, there fore, would not be expected to interfere with the springs.
A deep well in the vicinity of Balmorhea, perhaps at 1,200 to 1,300 feet, would probably reach a water-bearing horizon in the basal Lower Cretace6us sands or in the Permian rocks. The quality of the water that might be encountered in these rocks, however, is not known.
RECORDS OF DISCHARGE AND SEEPAGE
Records of the discharge of the streams and springs and of seepage gains and losses from the streams and canals of the Balmorhea district, taken from Water-Supply Paper 748,3 are given in the pages following.
Miscellaneous measurements of the discharge, in second-feet, of San Solomon, Giffin, Saragosa, and Toyah Creek Springs near Balmorhea, Tex.
Date
1923, Apr. 26.__.__
1924, June3-______
Sept. 6_______Sept. 7-______
San Solomon Spring
34.737.026.535.032.333.434.435.4
Qiffin Springs
5.4
3.9
Saragosa and Toy- all Creek
_ Springs
4.85.9
Date
1935, Feb. 6_ ______July 2 ____
1936, Apr. 15_ _ _ _ _
San Solomon Spring
38.236.334.330.432.8
30.4
Giffin Springs
2.90 A
Saragosa and Toy- all Creek Springs
3 Surface-water supply of the United States, 1933, part 8, Western Gulf of Mexico basins; U. S. Geol. Survey Water-Supply Paper 748, 180 pp., 1935.
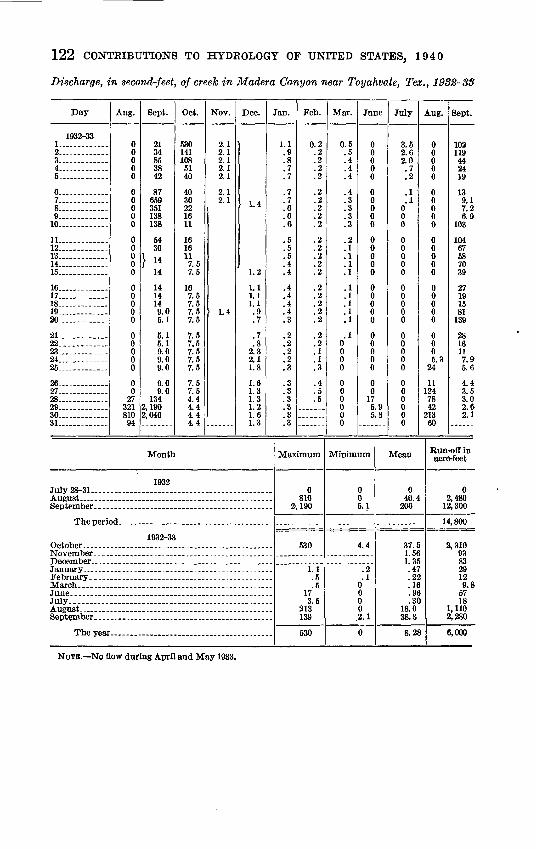
122 CONTRIBUTIONS TO HYDROLOGY OF UNITED STATES, 1940
Discharge, in second-feet, of creek in Madera Canyon near Toyahvale, Tex., 19S%-S$
Day Aug. Sept. Oct. Nov. Dec. Jan. Feb. Mar. June July Aug. Sept.
1932-33
16.17.18.19. 20-
21.22.23.24.25.
26-27-. 28_. 29_ 30- 31.
00000
00000
00000
00000
00000
00
27321810
94
2134853842
87659351138138
5430
14
1414149.05.1
6.1 5.1 9.0 9.0 9.0
9.09.0
1342,1902,040
530141108
5140
4030221611
1616117.5 7.5
167.5 7.5 7.5 7.5
7.5 7.5 7.5 7.5 7.5
7.5 7.5 4.4 4.4 4.4 4.4
2.1 2.1 2.1 2.1 2.1
2.1 2.1
1.4
1.4
1.2
1.1 1.1 1.1 .9 .7
.7
.82.32.11.8
1.6 1.3 1.3 1.2 1.6 1.3
1.1 0.2 .2 .2 .2 .2
.2
.2
.2
.2
.2
.2
.2
.2
.2
.2
.2
.2
.2
.2
.2
.2
.2
.1
.1
.3
.4
.5
.5
0.5.5 .4 .4 .4
.4
.3
.3
.3
.3
.2
.1
.1
.1
.1
.1
.1
.1
.1
.1
00000
00000
00000
00000
00000
00
175.95.8
3.5 2.6 2.0 .7 .2
.1
.1000
00000
00000
00000
000000
00000
00000
00000
00000
0005.3
24
111247842
21360
102119442419
13 9.1 7.2 6.»
103
10467587039
27191581
139
2818117.95.6
4.4 3.5 3.0 2.6 2.1
Month Maximum Minimum Mean Run-off in acre-feet
July 28-31-. August . September.
19320
810 2', 190
005.1
040.4
206
02,480
12,300
The period. 14,800
October....November. December.. January. . February.. March.....June..__. July.......August. . September.
1932-33530 4.4
1.1.5.5
173.5
213139
.2
.100002.1
37.61.S61.35.47.22.16.96.30
18.038.3
2,310938329129.8
6718
1,1102,280
The year. 630 6,000
NOTE. No flow during April and May 1933.

Dis
char
ge m
easu
rem
ents
in M
ader
a C
anyo
n to
det
erm
ine
loss
es b
y se
epag
e be
twee
n a
poin
t 13
.S m
iles
abo
ve a
nd a
poi
nt 3
.5 m
iles
abov
e T
oyah
- >
vale
, T
ex.,
19S2
-8S
Dat
e
1988
Se
pt.
1 1 2 2 2 2 3 3 3 3 12
12
12
12
15
15
15
21
21
21
21
21
24
24
24
24
24
Oct
. 6 6 6 6 6
193S
A
ug.
27
27
27
Stre
am
Mad
era
Can
yon _
__
__
__
__
__
__
__
__
___
do.
_ _
________ . ..
....
....
....
....
.. - d
o........ ..
................. .
............... .
.. d
o..
....
....
..... .
....
....
....
....
....
....
....
.....d
o............................................
..d
o............................................
.....d
o............................................
....
.do..
....
....
.........
. ......................
..d
o..
...
....
....
....
....
....
.............
- .d
o...........................................
....
.do
-..
......................................
....
.do
_
_._
._..
.... _
.. ._.
....
.do
... _
_
.....d
o ..........-.
.,.........................
....
.do..
....
....
.........
. ..
....
....
...
........
.....d
o....... .
....
....
...
....
....
....
....
....
....
d
o..
....
... ..
....
....
....
....
....
....
....
....
. .d
o............................................
do..... .
......................................
.....d
o .
..._
_._
_ ...._
......
..d
o............................................
. .d
o..
....
....
....
....
....
....
....
....
....
....
..Si
de c
anyo
n, _
___________________
Mad
era
Can
yon.
__
__
__
. . ..... . ..
....
do. .d
o ..
....
....
....
....
....
....
....
....
....
. -
do
..
..
.... .
_ _
__
. _
__
. .d
o ____ . _
__
__
__
__
__
__
__
...-
.-.
d
o..
... .......................................
..d
o..
....
....
....
. ...
....
... .
..................
....
.do
. .
d
o
. . ..
.....
...
.
Loc
atio
n
Gag
e
Mou
th _
. _
_ . _
_ _
__
. _______ ..
__ .T
._..
1.5
mile
s be
low
gag
e ...
....
....
....
....
....
....
....
....
....
....
Dis
tanc
e fr
om
initi
al
poin
t (m
iles) 13
.3'
7.1
5.1
13.3
7.
1 5.
1 3.
5 13
.3
7.1
5.1
3.5
13.3
11
.3
7.1
5.1
13.3
7.
1 5.
1 13
.3
7.5
7.1
6.9
5.1
13.3
13
.2
11.8
10
.8
9.8
13.3
11
.3
10.7
9.
6 9.
3
13.3
7.
1 3.
5
Dis
char
ge (
seco
nd-fe
et)
Mai
n st
ream 23
.2
3.9
0 67.5
41
.8
2.2 .5
41.8
16
.1
8.3
4.5
28.7 7.2
2.5
14.5
.3
.2
5.
2 0 .3
0 .6
6.
7
6.7
1.0 .2
37.3
22.6
4.
5 0 17
.5
11.4
0
Tri
bu
tary 0.
5 .3 1.5
Gai
n or
lo
ss i
n se
ctio
n
-19.
3 -3
.9
-25.7
-3
9.6
-1
.7
-25.7
-7
.8
-3.8
-22.0
-4
.7
-14.2
-.
1
-5.2
+
.3
3
+
.'6
-5!
7 -.
8
-16.2
-1
8.1
-4
.5
-6.1
-1
1.4
Tot
al
gain
or
loss -1
9.3
-2
3.2
-25.7
-6
5.3
-6
7.0
-25.7
-3
3.5
-3
7.3
-22.0
-2
6.7
-14.2
-1
4.3
-5.2
-4
.9
-5.2
-4
.6
-.3
-6.0
-6
.8
-16.2
-3
4.3
-3
8.8
-6.1
-1
7.5
fcO
00

Dis
char
ge m
easu
rem
ents
of
Toy
ah C
reek
to
dete
rmin
e lo
sses
by
seep
age
betw
een
a po
int
1.2
mil
es
abov
e an
d a
poin
t 8.
8 m
iles
bel
ow T
oyah
vale
,T
ex.,
1932
-33
to
Dat
e
19St
N
ov.
6 6 6 fi 6 6
1933
Ja
n.
23
23
23
23
23
Mar
. 14
14
14
14
14
14
14
14
M
ay 1
6 ,1
6 Ifi
16
16
16
16
July
11
11
11
11
11
11
11
Stre
am o
r di
vers
ion
'Pm
-ah
r^rf
tpb
"
_
_do_
. ... .
..
d
o
.
d
o.
do do. . .. ..
.. d
o
do
... .
.do.
do
Loc
atio
n
do
Dis
tanc
e fr
om in
itial
po
int
(mile
s) 1.0
3.9
4.7
4.8
5.8
8.8
3.0
4.7
4.8
5.8
8.8
1.2
3.
0 4.
7 4.
8 5.
8 5.
8 8.
8 8.
8 3.
0 4.
7 1.
8 5.
8C
Q
8'.8
8.
8 3.
0 4.
7 4.
8 5.
8 5.
8 S.
8 8.
8
Dis
char
ge (
seco
nd-f
eet)
Mai
n st
ream 13
.6
29.1
30
.7
29.0 0 12.5
12
.8
10.5
2.
5 0 9.
4
4.8 .2 0 9.2
1.6
0 0 8.3
1.6
0
Tri
bu
tary 0.
39.
9
8.2
6.7
6.4
5.6
Div
er
sion 5.
3
6.0
7.3
4.0
7.0
3.5
Gai
n or
lo
ss i
n se
ctio
n
+5.3
+
1.6
-1
.7
+4.3
+
.3
-2.3
2.
6
+2.7
+.7
+1.4
+2
.8
-.3
+2.4
+2
.7
+.3
+1.9
Tot
al
cain
or
loss +
5.3
+
6.9
+5
.2
+4.3
+
4.6
+
2.3
-2.5
+.2
+.9
+2
.3
+2
.8
+2
.5
+4.9
+2
.7
+3
.0
+4
.9

Dis
char
ge m
easu
rem
ents
in
Lit
tle
Agu
ja C
anyo
n to
det
erm
ine
loss
es b
y se
epag
e be
twee
n a
poin
t 15
.5 m
iles
abov
e an
d a
poin
t 2.
2 m
iles
abov
eTo
yahv
ale,
Tex
., 19
32
Dat
e
Aug
. 17
17
17
17
17
17
17
17
17
17
17
S
ept.
1 1 1 13
13
13
13
14
14
20
20
20
20
20
20
Oct
. 6 6 6 6 6
Str
eam
do
.-do........- . ..
. .
do do ..
do- . .
. do . . _
do do
do . _.
do- do
...
do
.... ..
. .-
d
o
. ..
.I
-.-d
o .
....
....
..-
....
....
...... ..... ..
... -
do
..
.
. do
d
o . ..
d
o ..
.
do _
. .
do. -d
o.. __
-..-do. . .
"^^c
t*W
6ith
er S
Drin
crs
-.-d
o-_
-._,-
-- ...
....
. . -.. .............
Loc
atio
n
fiOfe
et b
elow
mou
th o
f S
outh
Fork
. __ __
_ _ _ _
__
_ . __ -
600
feet
bel
ow w
hite
blu
ff--
.-.. _
_ ._
__ _
__ .... _
__ .
200
feet
bel
ow m
outh
of
Sou
th F
ork
.- _
_
.__ _ _
_____ ..
4,00
0 fe
et a
bove
mouth
..-.
- __ ..
. __ . _ . _ _ . ........
Dis
tanc
e fr
om
init
ial
poin
t (m
iles) 15
.5
12.7
11
. £
10.0
8.
5 7.
0 5.
9 4.
3 4.
3 4.
0 2.
2 12
.5
11.5
2.
2 11
.3
4.3
4.3
3.9
11.3
8.
2 11
.3
9.5
8.7
8.6
7.8
7.7
11.2
6.
0 4.
33.
9 3.
0
Dis
char
ge (
seco
nd-f
eet)
Mai
n st
ream 1.
3 1.
0 .4
.6
.4
.2
.1
0 .2
0 12.1
0 22.8
0 .1
0 11
.2
0 4.1
0 .6
0 .6
0 26.8
26
.5
2.2
0
Tri
bu
tary 0.
4
6.4 .2
Gai
n or
lo
ss i
n se
ctio
n
-0.3
-1.0
+
.2
-.2
-.
2
-.1
-.1
+.2
-.
2
-18.5
-22.8
+
.1
-.1
-11.2
-4.1
+
.6
-.6
+
.6
-.6
-.3
-24.5
-2
.2
Tot
al
gain
or
loss -0
.3
-1.3
-1
.1
-1.3
-l
.fi
-1.6
-1
.7
-1.5
-1
.7
-18.5
-22
. S
-22.7
2
2.8
11.2
-4.1
-3
.5
-4.1
-3
.5
-4.1
-.3
-24.8
-2
7.0
to
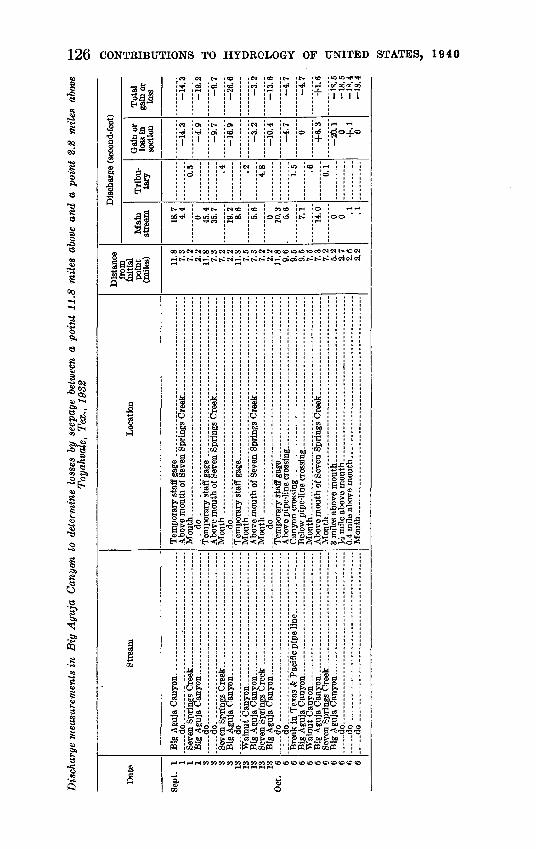
Dis
char
ge m
easu
rem
ents
in
Big
Agu
ja C
anyo
n to
det
erm
ine
loss
es b
y se
epag
e be
twee
n a
poin
t 11
.8 m
iles
abo
ve a
nd a
poi
nt 2
.2 m
iles
abo
veTo
yahv
ale,
Tex
., 19
32
Dat
e
Sep
t. 1 1 1 1 3 3 3 3 13
13
13
13
13
Oct
. 6 6 6 6 6 6 6 6 6 6 6
Stre
am
.-..
.do
. - _
_
----
-- _
______
.
do
d
o
..
do
.. d
o ..
Loca
tion
-d
o.- _
_ _
Tem
pora
ry s
taff
gag
e ..... _
..-.
__ ..
. .. _
________ .
-...
do
. ...
... -
do_.
. _
_
Mou
th _
....
... _
__
__
__
_ . _
_ _
___________
3 m
iles
abov
e m
outh
_______________________
Mou
th. _
__
__
__
_ . _
_________________ . _
.
Dis
tanc
e fr
om
initi
al
poin
t (m
iles) 11
.8
7.3
7.2
2.2
11.8
7.
3 7.
2 2.
2 11
.8
7.5
7.3
7.2
2.2
11.8
9.
6 9.
5 9.
5 7.
5 7.
3 7.
2 5.
2 2.
7 2.
6 2.
2
Dis
char
ge (
seco
nd-f
eet)
Mai
n st
ream 18
.7
4.4
0 45.4
35
.7
19.2
8.
6
5.6
0 10.3
5.
6
7.1
14.0 0 0 .1
.1
Tri
bu
tary 0.
5 .4 .2 4 8
1.5 .6 6.1
Gal
a or
lo
ss in
se
ctio
n
-14.
3-4
.9
-9.7
-16.9
-3.2
-10.4
-4.7 0
+6
.3
-20.1
0 +.1
0
Tot
al
gain
or
loss -1
4.3
-19.
2-9
.7
-26.
6
-3.2
-13.
6-4
.7
-4.7
+1
.6
-IS
. 5
-18.5
-R
4
-18.4
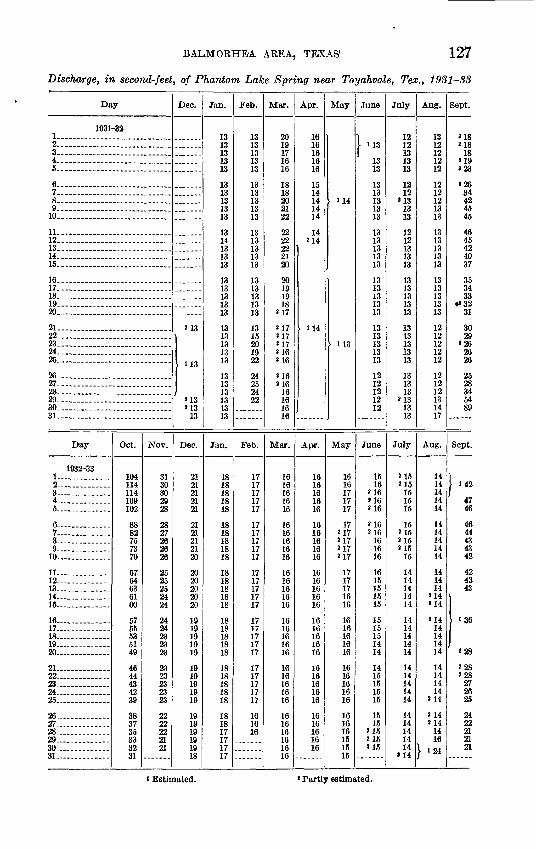
BALMOEHEA AREA, TEXAS' 127
Discharge, in second-feet, of Phantom Lake Spring near Toyahvale, Tex., 1931-33
Day
1931-321.. .............. .... .. ..2............................3- .. ...................
6....... ...................
6.............................7.............................S... ..........................9.............................W-... ............... ... .....
11.. ...........................12............................13- .........................14..................16. ... ..............
16. ....... ..... ..........17. 18. ... . ...............19. .... .............20 ......... _ .............
21............................22. ________ .....23 ........ ...........24....... _ .................26. . ..
26--................ .-......27.- __28-. . _ __29...... ....................30. 31- .
Day
1932-33 1 23 - . ..4 ...........5 ...........
6 ........ . ..7 ... ...... ..8 .....9 ..... -10
11 12 . 13 . 14 ....... ....16
16 ...........17 18 19 20
21 ..........22 ...... .23 24 . .........25 .
26 27 ..........28 ...... 29 30 31 .
Oct.
104 114 114 109 102
88 82 75 73 70
67 64 63 61 60
57 55 53 51 49
46 44 43 42 39
38 37 35 33 32 31
Nov.
31 30 30 2928
28 27 26 26 26
25 25 25 24 24
24 24 23 23 23
23 23 23 23 23
22 22 22 21 21
Dec.
213
»13
a 13 »13 13
Dec.
21 21 21 2121
21 21 21 21 20
20 20 20 20 20
19 19 19 19 19
19 19 19 19 19
19 19 19 19 19 18
Jan.
13 13 13 13 13
13 13 13 13 13
13 14 13 13 13
13 13 13 13 13
13 13 13 13 13
13 13 13 13 13 13
Jan.
18 18 18 18 18
18 18 18 18 18
18 18 18 18 18
18 18 18 18 18
18 18 18 18 18
18 18 17 17 17 17
Feb.
13 13 13 13 13
13 13 13 13 13
13 13 13 13 13
13 13 13 13 13
13 15 20 19 22
24 25 24 22
Feb.
17 17 17 17 17
17 17 17 17 17
17 17 17 17 17
17 17 17 17 17
17 17 17 17 17
16 16 16
Mar.
20 19 17 16 16
18 18 20 21 22
22 22 22 21 20
20 19 19 18
217
217 217 217 216 216
«16 «16 16 16 16 16
Mar.
16 16 16 16 16
16 16 16 16 16
16 16 16 16 16
16 16 16 16 16
16 16 16 16 16
16 16 16 16 16 16
Apr.
16 16 16 16 16
15 14 14 14 14
14214
. U4
Apr.
16 16 16 16 16
16 16 16 16 16
16 16 16 16 16
16 16 16 16 16
16 16 16 16 16
16 16 16 16 16
May
114
US
May
16 16 17 17 17
17217217 817217
17 17 17 16 16
16 16 16 16 16
16 16 16 16 16
16 16 16 15 15 15
June
I U3
13 13
13 13 13 13 13
13 13 13 13 13
13 13 13 13 13
13 13 13 13 13
12 12 12 12 12
June
15 16
216»16216
216 21616 16 16
16 15 15 15 15
15 15 15 14 14
14 15 15 15 15
15 15
215 215a 15
July
12 12 13 13 13
12 12
»13 13 13
12 12 13 13 13
13 13 13 13 13
13 13 13 13 13
13 13 13
»13 13 13
July
*1521515 15 15
15215 215 21515
14 14 14 14 14
14 14 14 14 14
14 14 14 14 14
14 14 14 14 14
»14
Aug.
13 12 12 12 12
12 12 12 13 13
13 13 13 13 13
13 13 13 13 13
12 12 12 12 12
12 12 12 13 14 17
Aug.
14 14 14 14 14
14 14 14 14 14
14 14 14
214»14
214 14 14 14 14
14 14 14 14
314
214a 14 14 16
[ «24
Sept.
a 18 a 18 18
a 19 123
»26 34 42 45 45
46 45 42 40 37
35 34 33
»*32 31
30 29
»26 26 26
25 28 34 54 89
Sept.
I 142
47 46
46 44 43 43 42
42 43 43
136
»28
2 28 228 27 26 26
24 22 21 21 21
i Estimated. Partly estimated.
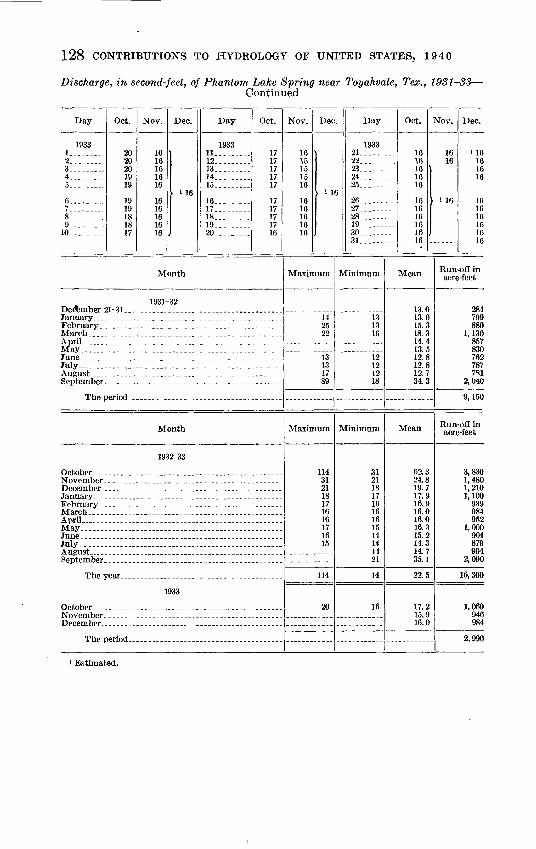
128 CONTRIBUTIONS TO HYDROLOGY OF UNITED STATES, 1940
Discharge, in second-feet, of Phantom Lake Spring near Toyahvale, Tex., 1931-33 Continued
Day Oct. Nov. Dec. Day Oct.
1933 1933 1... 20 16 ) 11-. . 172-..---.-- 20 16 12... ______ 17
4_. _______ 19 16 14__. ______ 175-_-_-._-_ 19 16 15_________ 17
i 16 6... --- 19 16 16-. 177. .. 19 16 17..-- - 17
9-- 18 16 19____ _ 1710.-. 17 16 , 20___ ______ 16
Month
1931-32 De<-kmber 21-31... _ _____ ._ ___ _____ .. _
April .
July .... ._.
Month
1932-33
July.. . -. . .
1933
Nov. Dec
16 115151516
i 1 1616161616 ,
Maximum
142522
13131789
Maximum
114312118171616171615
114
20
Day
1933 21... 22... 23... 24.- 25___
5 26-. 27... 28. 19___.__30... 31...
Minimum
131316
12121218
Minimum
312118171616161514141421
14
16
Oct.
161616 \1616
1616161616 ,16 .
Mean
13.013.015.318.314.413.512.812.812.734.3
Mean
62.324.819.717.916.916.016.016.315.214.314.735.1
22.5
17.215.916.0
Nov. Dec.
16 i 1616 16
1616
1 16 1616161616
--_.. 16
Run-off in acre-feet
284799880
1,1308578307627877S1
2,040
9,150
Run-off in acre-feet
3,8301,4801,2101,100
939984952
1,000904879904
2,090
16,300
1,060946984
2,990
Estimated.

BALMOBHEA AREA, TEXAS 129
Discharge, in second-feet, of Giffin Springs at Toyahvale, Tex., 1931-88
Day
1931-32 1 . 2.... .... . .3 . ......... .4 5 ...........
6......... .7 ...........8 .... .......9-. ---
10... ...........
11.. __ -., ....12 ...........13 ...........14- .. ...15 __ .- _ -----
16-.. -- . ..17- __ - _ .....18 . .19... ......20 ...........
21 ... . ..-22 ...........23 ...........24 ...........25. ..........
26 ...........27 .28_ - -29 30 ...........31 . ..
Day
1932-33 I-.........*..2 ..........3_ ______4... ........ __5_ .....-
6_ ______7 ...... __8 . .....9 .... . -
10... ...........
11 12...... 13...... 14 15 .....
16 17...... ..18 .._._19 ..........20__._ . _
21 ..22........ ..23......... ..24 _ .25.............
26- . ........ .27... ...2829- ... ..30- . .31- ----- ....
Oct.
4.7
4.74.74.74.64.64.5
Oct.
> 6. 1
Nov.
4.34.24.34.14.1
14.14.1
'4.114.114.1
13.913.9
3.93.83.8
3.83.83.83.83.8
3.83.83.73.73.7
3.73.73.73.73.7
Nov.
5.9
Dec.
13.713.73.7
3.6
3.63.6
3.63.6
3.63.63.63.63.6
3.63.6
13.6i 3.63.6
3.63.63.63.63.6
3.63.63.63.63.63.6
Dec.
> 5.6
Jan.
3.63.63.63.63.6
3.63.63.63.63.6
3.63.63.63.63.6
3.63.63.63.63.6
4 14.24.34.34.3
4.54.54.54.54.54.5
Jan.
5.3
4.9
Feb.
4.54.54.54.54.5
4.54.54.54.54.5
4.54.54.54.54.5
4.64.64.64.64.6
4.64.64.64.64.6
4.64.64.64.6
Feb.
4.94.94.94.94.9
4.94.94.94.94.9
4.9d Q
4.94 94.9
4 9
\ 5.0
Mar.
4.64.64.64.64.6
4.64.64.64.64.6
4.64.6
14.614.6
4.6
4.64.64.64.64.6
4.64.64.64.64.6
4.64.64.64.64.74.7
Mar.
\ 5.0
5.15.1
5.15.15.1
5.15.15.1
5.1
5.15.1
5.15.1
5.15.15.15.15.15.1
Apr.
4.74.74.74.74.7
4.74.74.74.74.7
4.74.74.74.74.7
4.74.74.74.74.7
4.74.74.74.74.7
4.74.74.74.74.7
Apr.
5.15.1
5.05.0
5.05.05.05.05.0
5.05.05.05.05.0
5.05.05.05.05.0
5.05.05.05.05.0
5.05.04 94.94 9
May
4.74.74.64.64.6
4.64.64.64.64.6
4.64.64.64.64.6
4.64.64.64.64.6
4.64.64.64.64. .6
4.64.64.64.64.64.6
May
4.94.94.94.94.9
4.94.94.94.94.9
4.94.94.94.94.9
4.94.94.95.0
5.05.05.05.05.0
5.05.05.05.05.05.0
June
4.64.74.74.74.7
4.74.74.64.64.6
4.64.64.64.64.6
4.64.64.6
}. 4.7
4.74.74.74.74.7
June
i5.0i 5.015.0
5.05.0
5.05.05.05.05.0
5.05.05.0
4.9
4.9
4.9
4.94.94.94 94.9
4 94.94 9A. Q
4.9
July
4.74.74.74.74.7
4.74.74.74.74.7
4.74.74.64.64.6
4.64.64.64.64.6
4.64.64.64.64.6
4.64.64.6
Ii4.6
July
4.94.94.94.94.9
4.94.9
i 4.94.94.9
4.94.94.94.94.9
4.94.94.94.94.9
4.94.94.6
4.3
4.34.34.64.94.94.9
Aug.
14.74.74.74.74.7
4.74.74.74.74.7
4.64.64.64.64.6
4.64,64.64.64.6
4.64.64.64.64.6
4.64.64.6
14.714.7
4.7
Aug.
4.94.74.74.74.7
4.74.74.74 74.7
4.74.74.74.74.7
4.64.64.64.64.6
4.64.64.64.64.6
4.9
Sept.
14.74.74.7
'4.8
14.9
|i5.2
15.4
>15.3
Sept.
15.315.4
i Estimated, partly estimated, or interpolated.
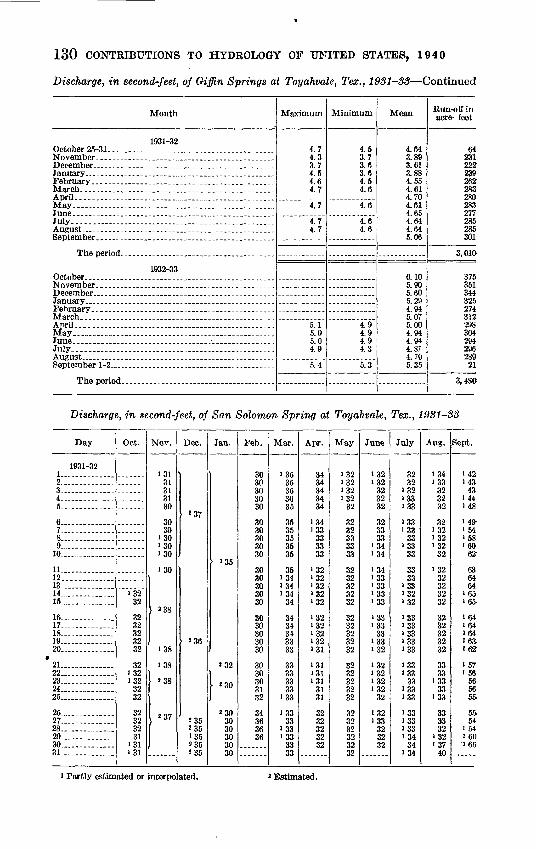
130 CONTRIBUTIONS TO HYDROLOGY OF UFITED STATES, 1940
Discharge, in second-feet, of Giffin Springs at Toyahvale, Tex., 1981-83 Continued
Month
1931-32 October 25-31-. - . .November...- _ _ __ __ _ - __ _ .. _ ...
February _ _____________________ ...
April----..----------.-.--......-.....................May. ___________ . ______ . ______ ...JUQ6- __________________________ . _________ ...July... .......
September. __ _____ . ______ . ______ ...
The period. _. ___ . ______ . ______ ...
1932-33 October. ______ ____ . ______ . ............
January ______________________ __ ________
April.--.. ____________________ ___ ...
July.... ........ .......................................
September 1-2 . ________ . __________ .
The period-. _ . __ _ __ ___ - __ ....
Maximum
4.74.33.74.54.64.7
4.7
4.74.7
S.I5.05.04.9
5.4
Minimum
4.53.73.63.64.54.6
4.6
4.64.6
4.94.94.94.3
5.3
Mean
4.643.893.613.884.554.614.704.614.654.644.645.06
6.105.905.605.294.945.075.004.944.944.814.705.35
Run-on' in acre- feet
6423122?239262283280283277285285.301
3,010
375351344325274312298304294296289
21
3,480
Discharge, in second-feet, of San Solomon Spring at Toyahvale, Tex., 1931-38
Day
1931-32 1 ._2. ... ... ... .3.............4..... ......5_-.. .--.
6 ..... ......7 ... .......8-.. .......9 .. ... ...
10.... ..........
11 . ....... ..12.......... 13.... .......14.............15... ...........
16.... .....17..............18 . .....19 20 .........
21.. -22 23 .... ......24 25.
26 ........27 28.... ......29 .......30 31 .......
Oct.
>3232
3232323232
32132>32
3232
32323231
131>31
Nov.
>3131313130
3030
'30'30'30
'30
*38
138
138
1 J38
J37
Dec.
J37
1 *36
«35J35135«35J35
Jan.
135
J32
I s 30
*303030303030
Feb.
3030on
3030
30303030on
3030°j)on
30
3030on°.n30
30on
3031 39
11363636
Mar.
13636363635
3535353535
35134134134
34
3434OA
33OO
33113333
133
1 OO
331 O.9
1333333
Apr.
OA
34«M
3434
134133
333333
1321 19132132132
1 19i 321 °.9132131131131131
3111
3232193232
May
1321321 OO
i 3232
3232333333
323232oo
32
3232323200
32193232v>
QO
32QO
^93232
June
132132
19
3232
323333
134134
'34133133133133
133133
OQ
1331 00
132
1 19132
^9
1 9.9133
oo
99
32
July
3232
132133'33
133133
33133
33
3333
133132132
133133133133133
133133
33"33133
133133133134
34134
Aug.
134J33
323232
32132i 32i 32
32
13232323232
193200
32OO
3311
'3333
133
333332
132"37
40
Sept.
142143
45'44148
i 49-154158'60
62
636464
165165
'64164164'65'62
'57'56
56565&
55>54
i 54i 60
i 68
' Partly estimated or interpolated. * Estimated.
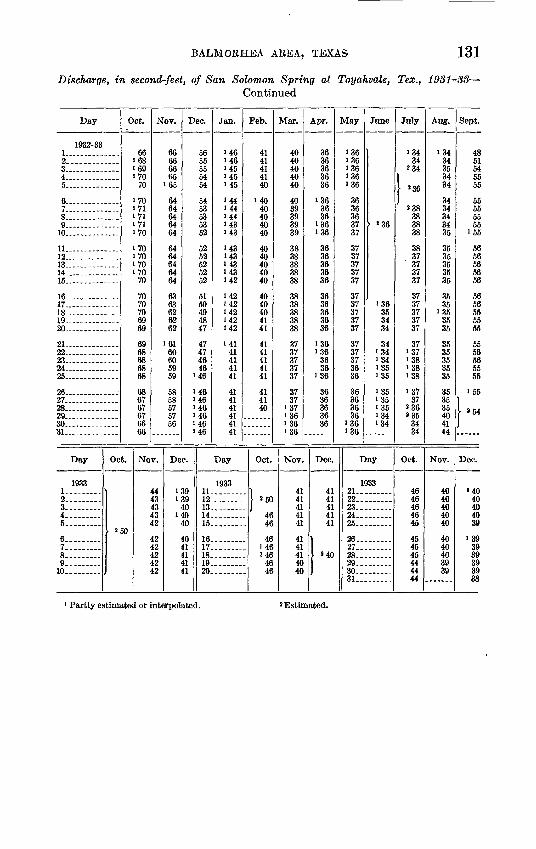
BALMORHEA AREA, TEXAS 131
Discharge, in second-feet, of San Solomon Spring at Toyahvale, Tex., 1931-38 Continued
Day
1932-33 1 2. -3 4 -..
6 7 .... 8 ... . 9 10
11 12 13 -14 15
16. 17 18 19 20.
21 .22 23 24 -25.
26 . 27 28 29 -30 31
Day
1933 1.. 2... 3-. 4.- 5..
6- 7.. . ......8.. .9.. ...... .10...
Oc
2
Oct.
66168169170
70
170171171171170
170170170170
70
7070706969
6968686868
686767676666
t. No
50
Nov.
66666665
165
6464646464
6464646464
6363626262
16160605959
5858575756
v. De
14 i13 i1313 i12
1212121212
Dec.
5655555454
5453535352
5252525252
5150494847
47474646
146
146146146146146146
c.
39 1139 1240 1340 1440 15
10 1611 1711 1841 1911 20
Jan.
146146145145145
U4144144143143
U3143143143142
142142U2142142
14141414141
414141414141
Day
1933
Feb.
414141414fl
1404040404ft
404ft404040
4040404141
4141414141
414140
Oct.
. t »50
4646
46- 146. 146
4646
Mar.
4040404040
4039393939
3838383838
3838383838
3737373737
3737
'37136136136
Nov.
4141414141
4141414040
Apr.
3636363636
1363636
136136
3636363636
3636363636
136136
3636
136
3636363636
Dec.
4141414141
»40
May
136i 36136136«36
3636363737
3737373737
3737373737
3737373636
36363636
136136
E
1 21..22..2324..25-
2627..28..29..30..31..
June
> *36
136353434
34134134135135
135135135134134
>ay
933
July
13434
»34
*3o
»38383838
3837' 37
3737
3737373737
37137138138138
13737
*36»35
3434
Oct.
4646464645
454545444444
Aug.
13434353434
3434343435
3535353535
3535
1353535
3535353535
353535404144
Nov.
4040404040
4040403939
Sept.
4851545555
55555555
155
5656565656
5656555555
5556565555
155
I »54
Dec.
»4040404039
1393939393938
1 Partly estimated or interpolated. 2 Estimated.
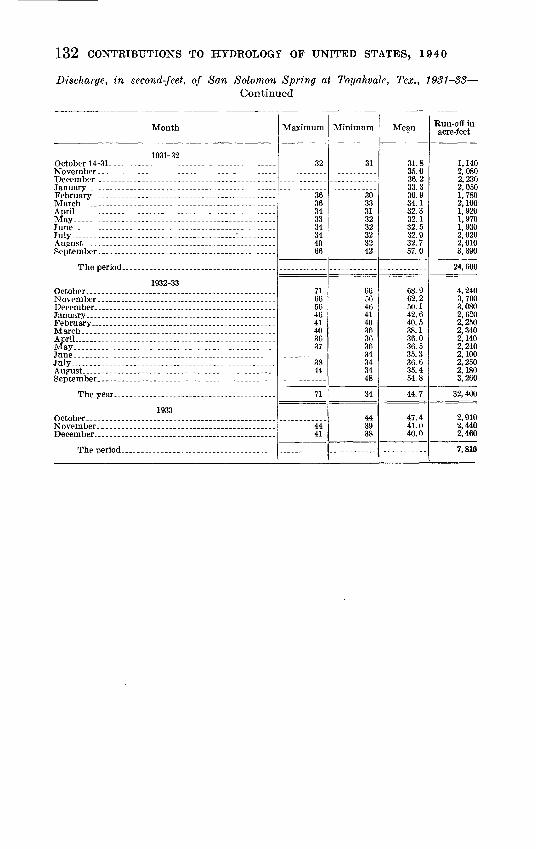
132 CONTRIBUTIONS TO HYDROLOGY OF UNITED STATES, 1940
Discharge, in second-feet, of San Solomon Spring at Toyahvale, Tex., 1981 88 Continued
Month
1931-32
July_____-. ................ ..............^... .......
1932-33
December
July . - --- -- - - - -
The year-- _ ___ -.. _ . __ _ __ ------ _ .--
1933
Maximum
32
3636343334344066
7166564641403637
3844
71
4441
Minimum
31
3033313232323242
665646414036363634343448
34
443938
Mean
31.835.036.233.330.934.132.332.132.532.932.757.0
68.962.250.142.640.538.136.036.535.336.635.454.8
44.7
47.441.040.0
Run-off in acre-feet
1,1402,0802,2302,0501,7802,1001,9201,9701,9302,0202,0103,390
24, 600
4,2403,7003,0802,6202,2502,3402,1402,2402,1002,2502,1803,260
32,400
2,9102,4402,460
7,810
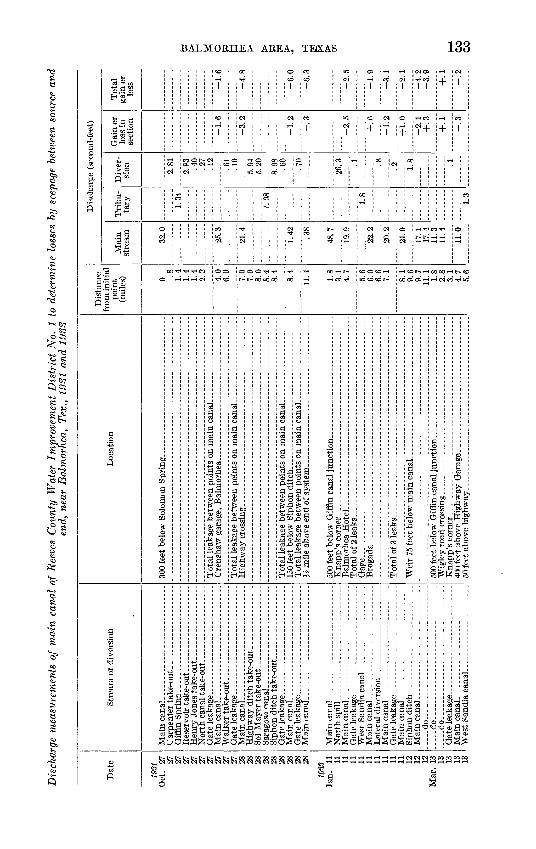
Dis
char
ge m
easu
rem
ents
of
mai
n ca
nal
of R
eeve
s C
ount
y W
ater
Im
prov
emen
t D
istr
ict
No.
1 t
o de
term
ine
loss
es b
y se
epag
e be
twee
n so
urce
and
end,
nea
r B
alm
,orh
ea,
Tex.
, 19
31 a
nd 1
933
Dat
e
1931
O
ct.
27
27
27
27
27
27
27
27
27
27
28
28
28
28
28
28
28
28
28
1933
Ja
n.
11
11
11
11
11
11
11
11
11
11
12
12
12
Mar
. 13
13
13
13
13
Stre
am o
r di
vers
ion
Wal
ker t
ake-
out.
....
....
. __
.
----
--
Hig
hway
dit
ch t
ake-
out_
----
.---
___-
.--
Siph
on d
itch
tak
e-ou
t _
_ -
Gat
e le
akag
e^.
_--_
__ .
..
....
.M
ain
cana
l...
_-.
____
_ .
......
Mai
n ca
nal
.. .... .
.....
.... ..
...
Nor
th s
pill
Mai
n ca
nal. ......
....
. _
......
Gat
e le
akag
e.
_ .. _
.................
Wes
t Sa
ndia
can
al.... _
_ _
.. _
__ _
.M
ain
cana
l. ......
....
..
. .
Lat
eral
div
ersi
on ..
.. _
........ _
.....
Mai
n ca
nal.
. ..
...
. . _
..G
ate
leak
age.
..... _
. .
...
Mai
n ca
nal.
. _
. ..
...
. ..
....
....
....
Siph
on d
itch
. .
.....
------
Mai
n ca
nal.
-- -
------- -
----
- _ .
do--
- do
...
.. d
o.
_ _-
_-.-
.-_.
_.__
____
__
.......
Gat
e le
akag
e. -
-
....
....
. _ ..
. _ ..
..M
ain
cana
lW
est
Sand
ia c
anal
..-.
__._
.__
.
Loc
atio
n
150
feet
bel
ow S
ipho
n di
tch.
___-
..
....
_ .
. __ .
500
feet
bel
ow G
iffi
n ca
nal j
unct
ion.
_____ ..
. __ ..
... _
__
_ .
Tot
alof
2 lea
ks-
... -
-.--
____
__-_
_---
--_-
..._-
...--
...._
...._
____
Gag
e
Tot
alof
Sle
aks
- _
-._
_-
- .........
50 fe
et a
bove
hig
hway
_ _
...
....
....
....
. _ _
- .
...
..
Dis
tanc
e fr
om in
itia
l po
int
(mile
s) 0 .8
1.4
1.4
1.4
2.2
4.0
6.0 7.0
7.0
8.0
8.
4 8.
4
8.4
11.4
1.8
3.1
4.7
5.6
6.0
6.6
7.1
8.1
9.6
9.7
11.1
1.
8 2.
8 3.
1 4.
7 5.
6
Dis
char
ge (
seco
nd-f
eet)
Mai
n st
ream 32
.0
25.3
21.4
1.42 .38
48.7
19.9
22.2
20.2
21.0
17.1
17
.4
11.3
11
.4
11.0
Tri
bu
tary 1.34
1.98 1.8
1.3
Div
er
sion 2.81
2.83 .40
.27
.12
.61
5.94
c on
8.98 60 .7
0
Oft
Q .1 .8
1 Q .1
Gai
n or
lo
ss in
se
ctio
n
-1.6
-3.2
-1.2
-.3
-2.5
+.6
-1.2
+1.
0
-2.1
+
.3
+.1
-.3
Tot
al
gain
or
loss -1
.6
-4.8
-6.0
-6.3
-2.5
-1.9
-3.1
-2.1
-4.2
-3
.9
+.1
2C
O
CO
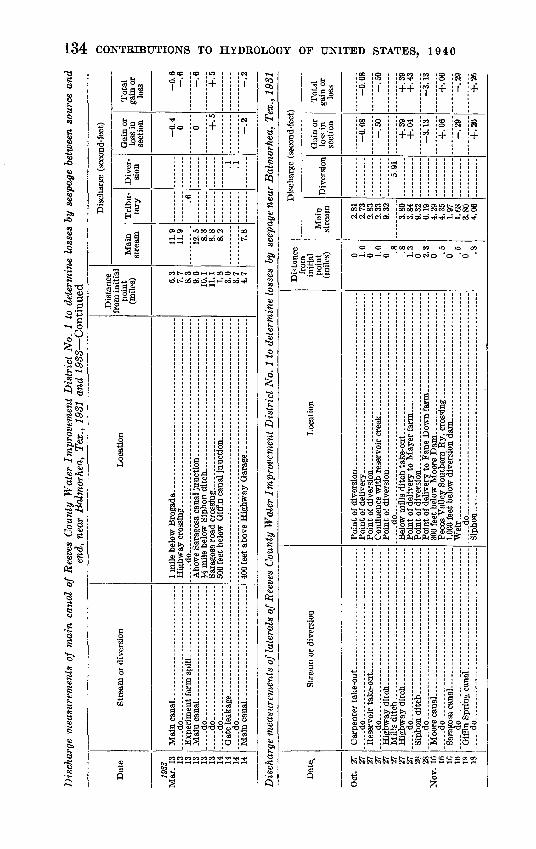
Dis
char
ge m
easu
rem
ents
of
mai
n ca
nal
of R
eeve
s C
ount
y W
ater
Im
prov
emen
t D
istr
ict
No.
1 t
o de
term
ine
loss
es b
y se
epag
e be
twee
n so
urce
and
end,
nea
r B
alm
orhe
a, T
ex.,
1931
and
19
33
Con
tinu
ed
Dat
e
1933
M
ar.
13
13
13
13
13
13
14
14
14
14
Stre
am o
r di
vers
ion
d
o . .
do.- ..
. ............ .
.....
- d
o
_
..
.....d
o........-.
......... ..
....
....
.
-d
o...
_____
__
__
_ _
.--.
Loca
tion
.d
o - . .-
400
feet
abo
ve H
ighw
ay G
arag
e ______________ .
....
...
Dis
tanc
e fr
om in
itia
l po
int
(mile
s) 6.3
7.7
8.3
9.6
10.1
11
.1
1.8
3.0
3.7
4.7
Dis
char
ge (
seco
nd-f
eet)
Mai
n st
ream 11
.9
11.9
12.5
8.
3 8.
8 8.
2
7.8
Tri
bu
tary .6
Div
er
sion .1 .1
Gai
n or
lo
ss in
se
ctio
n
-0.4
0 0 +
.5
-.2
Tot
al
gain
or
loss -0
.6
-.6
-.6
+.5
-.2
CO ^
o td d H
h- 1 o « CO f-3
O o f
O
OD
isch
arge
mea
sure
men
ts o
f lat
eral
s of
Ree
ves
Cou
nty
Wat
er I
mpr
ovem
ent
Dis
tric
t N
o. 1
to
dete
rmin
e lo
sses
by
seep
age
near
Bal
mor
hea,
Tex
., 19
31
Dat
e.
Oct
. 27
27
27
27
27
27
27
27
28
28
N
ov.
16
16
16
16
IS
18
Stre
am o
r di
vers
ion
d
o
.. .. ...
....
.. ..
....
....
....
...
...
....
.do
. .
.d
o.
- - . ..
Loc
atio
n
do .
Weir
..
. ...
....
....
....
... .
... .
.. ..
.. ..
. ...
....
... .
..
do....
_ _..
Dis
tanc
e fr
om
initi
al
poin
t (m
iles) 0 1.
0 0 1.
0 0 .8
.8
1.
3 0 2.
3 0 .5
0 .5
0 .3
Dis
char
ge (
seco
nd -f
eet)
Mai
n st
ream 2.
81
2.73
2.
83
2.33
9.
32
3.80
3.
84
9.32
6.
19
4.29
4.
35
1.97
1.
68
3.80
4.
06
Div
ersi
on
5.91
Gai
n or
lo
ss i
n se
ctio
n
-0.0
8
-.50
+.3
9 +
.04
-3.1
3
+.0
6
-T.2
9
+.2
6
Tot
al
gain
or
loss -0
.08
-.50
+.3
9 +
.43
-3.1
3
+.0
6-.
29
+.2
6
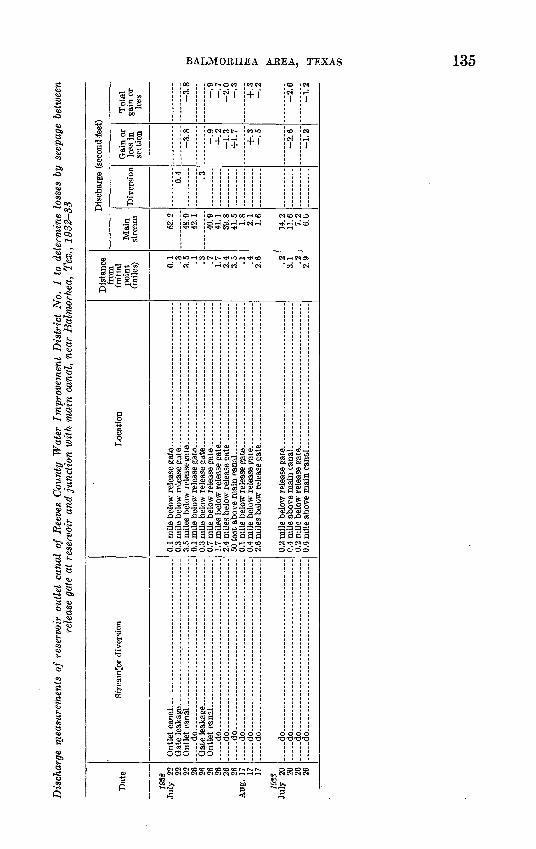
Dis
char
ge m
easu
rem
ents
of
rese
rvoi
r ou
tlet
cana
l of
Ree
ves
Cou
nty
Wat
er I
mpr
ovem
ent
Dis
tric
t N
o. 1
to
dete
rmin
e lo
sses
by
seep
age
betw
een
rele
ase
gate
at
rese
rvoi
r an
d ju
ncti
on w
ith
mai
n ca
nal,
near
Bal
mor
hea,
Tex
,, 19
32-3
3
Dat
e
19SH
Ju
ly
22
22
22
26
26
26
26
26
2fi
Aug
. 17
17
17
198S
Ju
ly
20
20
26
26
Stre
amer
div
ersi
on
do do
do __ -___ _ ._
.. do
. ...... .
.. _
.
.-.
...-
.
..
do..
...
. _ .._
.._ _
._._
._.
. .do .-
. _
_ _ _ .
....
.do
. -_ _
.-__
_do-
__ .. .. ._
_ ..
. ._
.do
-.
do..
do
.... .
.
..
...
. ..
.
Loc
atio
n
Dis
tanc
e fr
om
initi
al
poin
t (m
iles) 0.
1 .3
3.5 .1
.3
.7
1.7
2.4
3.5 .1
.4
2.6 .2 3.1 .2
2.9
Dis
char
ge (
seco
nd-f
eet)
Mai
n st
ream 52
.2
48.0
42
.1
40.9
41
.1
39.8
41
.5
1.8
2.1
1.6
14.2
11
.6
7.2
6.0
Div
ersi
on
0.4 .3
Gai
n or
lo
ss in
se
ctio
n
-3.8
-.9
+.2
-1
.3
+1.
7
+.3
.5
-2.6
-1.2
Tot
al
gain
or
loss -3
.8
-.9
-.
7
-2.0
-.
3
+.3
-.
2
-2.6
-1.2
CO
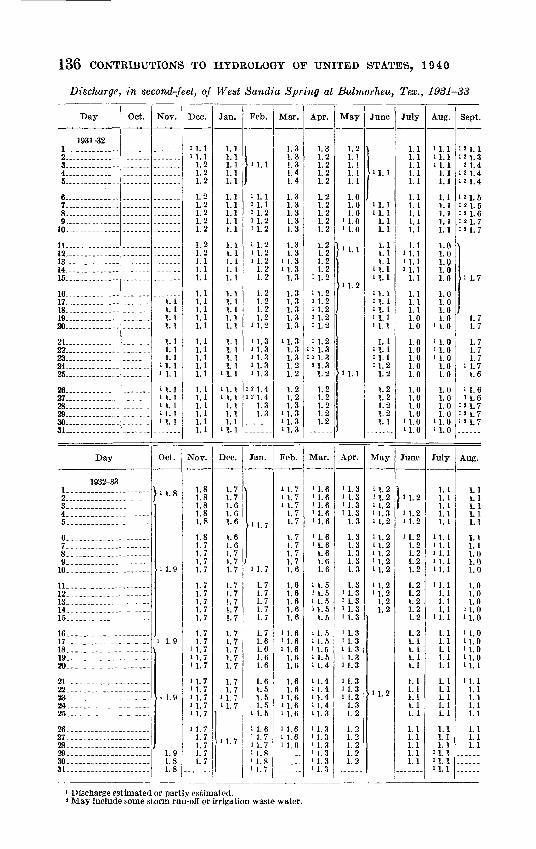
136 CONTRIBUTIONS TO HYDROLOGY OF UNITED STATES, 1940
Discharge, in second-feet, of West Sandia Spring at Balmorhea, Tex., 1931-SS
Day
1931-32 1... ....... -2 3 4 5
6 7 -- -8 9..... ........ -10-
11 12 13 14 - 15 ------
16 17 18 . 19 20 -
21 -
23 24 ------91
26 ------97
28 29 30 31
Day
1932-33 1.. --------
3. 4... 5. .--. -------
6.-- 7- 8-.. ----9-.
10--
11.- . -------12 13- 14 15--
16.. 17 18.. .19. - 20-
21-
23 24 25..
26. . 27 - .28..- 29--- -3031--.-
Oct. Nov.
1.11.11.11.1
1.11.11.11.11.1
1.11.11.11.11.1
Oct.
1 1. 0
[1 1.9
i 1.9
i 1.9
1.91.81.8
Dec.
'1.1U.l
1.21.21.2
1.21.21.21.21.2
1.21.21.11.11.1
1.11.11.11.11.1
1.11.11.11.11.1
1.11.11.11.11.11.1
Nov.
1.81.81.81.81.8
1.81.71.71.71.7
1.71.71.71.71.7
1.71.71.71.71.7
1.71.71.71.71.7
i 1.71.71.71.71.7
Jan.
1.11.11.11.11.1
1.11.11.11.11.1
1.11.11.11.11.1
1.11.11.11.11.1
1.11.1.1.1
i .1
i .1i .1
.11.11.1
i 1.1
Dec.
1.71.71.61.61.6
1.61.61.71.71.7
1.71.71.71.71.7
1.71.71.71.71.7
1.71.7
'1.7'1.7
i 1.7
Feb.
h.1.11.11.21.21.2
1.21.21.21.21.2
1.21.21.21.2
i 1.2
U.3U.3'1.311.3U.3
i 2 1.4121.4
1.31.3
Jan.
11.7
11.7
1.71.71.71.71.7
1.71.61.61.61.6
1.61.51.51.5
i 1.5
1.61.71.71.81.81.7
Mar.
1.31.31.31.41.4
1.31.31.31.31.3
1.31.3
11.3U.3
1.3
1.31.31.31.31.3
U.31.31.31.21.2
1.21.21.3
11.3'1.311.3
Feb.
11.71 1.7'1.7
1.71.7
1.71.71.71.71.6
1.61.61.61.61.6
i 1.6i 1.611.6
1.61.6
1.61.61.61.61.6
1.61.61.6
Apr.
1.31.21.21.21.2
1.21.21.21.21.2
1.21.21.21.2
11.2
' 1.2'1.2i 1.2'1.2'1.2
i 1.2' U.3' 2 1.3
21.3
1.2
1.21.21.21.21.2
Mar.
1.61.61.61.61.6
1.61.61.61.61.6
1.51.51.51.51.5
1.51.51.51.51.4
1.41.41.41.41.3
1.31.31.31.31.31.3
May
1.21.11.11. 11.1
1.01.01.0
1.0il.O
}" >
11.2
>1.1
Apr.
U.3il.3U.3i 1.3
1.3
1.31.31.31.31.3
1.31.31.31.31.3
.3
.3
.3
.3
.3
1.31.3
i 1.31.31.2
1.21.21.21.21.2
June
il.l
U.lU.I
1.11.1
1.11.11.11.11.1
1.11.11.11.11.1
1.11.11.11.21.2
1.21.21.21.21.1
May
1.21.21.21.31.2
1.21.21.21.21.2
1.21.21.21.2
U.2
July
1.11.11.11.11.1
1.11.11.11.11.1
1.1U.lU.lU.l
1.1
1.11.11.11.01.0
1.01.01.01.01.0
1.01.01.01.0
il.OU.O
June
I U.2
U.2U.2
U.21.21.21.21.2
1.21.21.21.21.2
1.21.11.11.11.1
1.11.11.11.11.1
1.11.11.11.11.1
Aug.
U.l
U.l1.11.1
1.11.11.11.1
1.01.01.01.01.0
1.01.01.01.0
U.O
U.OU.OU.O
1.01.0
1.01.01.01.0
U.OU.O
July
1.11.11.11.11.1
1.11.11.11.11.1
i 1.11.11.11. 1
U.l
1.11.11.11.11.1
1.11.11.11.11.1
1.11.11.1
U.lU.lU.l
Sept.
M.I21.321.421.4
21.4
21.59 1 K
21.6
21.7
U.7
;1.71.7
1.71.71.7
i 1.71.6
i 1.6U.6
121.7121.7121.7
Aug.
1.11.11.11.11.1
1.11.11.01.01.0
1.01.01.01.01.0
1.01.01.0
U.OU.l
U.l1.11.11.11.11.11.11.1
i Discharge estimated or partly estimated.* May include some storm run-off or irrigation waste water.

BALMORHEA AKEA, TEXAS 137
Discharge, in second-feet, of West Sandia Spring at Balmorhea, Tex., 1931-33 Con.
Month
1931-32 November 17-30 _ _ . ____ .... _________
July ... ... .. -.-.- .... .-_._ -.-.-.._-_-.-...
The period.. __ ___ . ______ . _____
1932-33 October ___ .. ____________________ ..
December __ . ______ . ______ . ______ ..January. ___ . ______ . ______ ... ...........
June.... ..... _____ . ______ _ ______ _ .July . - -. .- ..-. ....._ _
Theoeriod ____ ______ . ____ . .....
Maximum
1.11.21.11.41.41.3
1.11.11.7
1.8
1.71.61.3
1. 11.1
Minimum
1.11.11.11.11.21.2
1.01.01.1
1.7
1.61.31.2
1.11.0
Mean
1.101.131.101.211.291.211.111.121.061.031.61
1.891.721.681.661.631.471.281.201.151.101.06
Run-off in acre-feet
3169687079726867656396
748
11610210310291907674686859
949
Discharge measurements of West Sandia Creek to determine losses by seepage between a point 4>000 feet above gage and gage 0.8 mile east of Balmorhea, Tex., Oct. 17, 1932
Stream
West Sandia Creek....Do . .....
Canal waste way _...... West Sandia Creek ....
Location
300 feet above West Sandia Spring. . . . 80 feet below West Sandia Spring-. ... 500 feet below West Sandia Spring....
Dis tance above gage (feet)
4,000 3,620 3 200
0
Discharge (second-feet)
Main stream
0.2 .6
2.2
Tribu tary
0.1
Gain or loss in section
+0.4
+1.5
Total gain or
loss
+0.4
+1.9
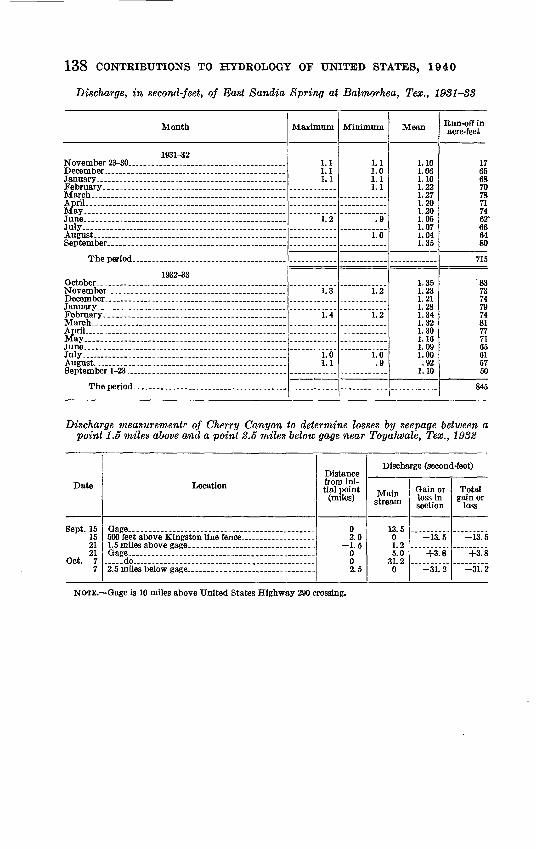
138 CONTRIBUTIONS TO HYDROLOGY OF UNITED STATES, 1940
Discharge, in second-feet, of East Sandia Spring at Balmorhea, Tex., 1981-88
Month
1931-32 November 23-30 ______ . ______________ ...
April. ____________ . ______ . ............
July... .. ....... .....................................August ___ . _____________ . ...............
The period _____________________
1932-33 October __________________________
December ___ _____________________January ____________________ . .........
April ____________________ . _ . .........May _ . ___ .. __ . _____ . ______ . .........June _______________ _ . ___ . .........July....................................................August __________________________September 1-23 __ .... ____ . __ ... __ ..... .....
Maximum
1.11.11.1
1.2
1.3
1.4
1.01.1
Minimum
1.11.01.11.1
.9
1.0
1.2
1.2
1.0.9
Mean
1.101.061.101.221.271.201.201.051.071.041.35
1.351.231.211.281.341.321.301.161.091.00.92
1.10
Run-off in acre-feet
1765687078717462V666480
715
'837374797481777165615750
845
Discharge measurement? of Cherry Canyon to determine losses by seepage between a point 1.5 miles above and a point 2.6 miles below gage near Toyahvale, Tex., 1932
Date
Sept. 15 15 21 21
Oct. 7 7
Location
500 feet above Kingston line fence. _____ . .......
..-.-do...... _ _. _ . __________ . ..........2.5 miles below gage ___ ..... ______ . .......
Distance from ini tial point
(miles)
0 2.0
-1.5 0 0 2.5
Discharge (second-feet)
Main stream
13.5 0 1.2 5.0
31.2 0
Gain or loss in section
-13.5
+3.8
-31.2
Total gain or
loss
-13.5
+3.8
31.2
NOTE. Gage is JO miles above United States Highway 290 crossing.
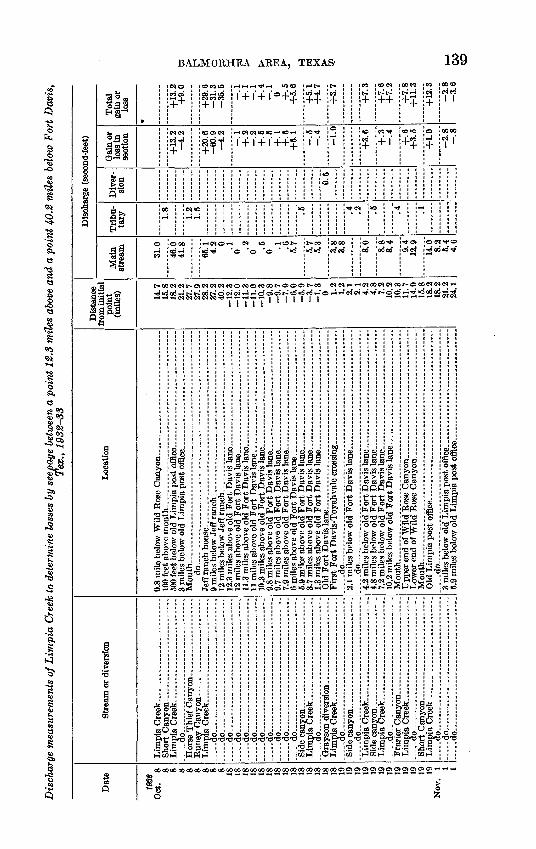
Dis
char
ge m
easu
rem
ents
of L
impi
a C
reek
to d
eter
min
e lo
sses
by
seep
age
betw
een
o po
int
12.3
mile
s ab
ove
and
a po
int
40-2
mile
s be
low
For
t D
avis
,Te
x.,
1982
-88
Dat
e
198%
O
ct.
8 8 8 8 8 8 8 8 8 18
18
18
18
18
18
18
18
18
18
18
18
18
18
19
19
19
19
19
19
19
19
19
19
19
19
Nov
. 1 1 1
Stre
am o
r div
ersi
on
do
Lim
pia
Cre
ek
_ ._
. .d
o. -..
. .
.--..
....
..
do..
...
....
.. d
o .. . ..
..... d
o....
_..
__
..._
..
. - d
o .
....
... ... ..
....
. ..
do .
...... . .__ -
..
do..
. .. ..
..... d
o .... .._..
d
o . ._
.__ . .....
do
.
do do do
d
o....
......... _
.. _
__ _
..d
o . __ __ .
Loca
tion
. .d
o -
. -. . _.. . _ ..-
3.7
mile
s ab
ove
old
Fort
Dav
is la
ne _
__
__
__
__
__
__
_
do
.... .
...-
do
...-
.--.
............................. ..
................
4.2
mile
s be
low
old
For
t Dav
is la
ne _
. __
__
__
__
__
__
__
10.2
mile
s be
low
old
For
t Dav
is la
ne _
__
__
__
__
__
__
__
_M
outh
_
Low
er e
nd o
f Wild
Ros
e C
anyo
n _________________
5.9
mile
s be
low
old
Lim
pia
nost
offi
ce _
__________ ..
....
.
Dis
tanc
e fr
om in
itial
po
int
(mile
s) 14.7
15
.8
18.2
21
.2
27.7
27
.9
28.2
37
.2
40.2
-1
2.3
-1
2.0
-1
1.3
-1
1.0
-1
0.3
-9
.8
-9.7
-7
.9
-6.0
-5
.9
-3.7
-1
.3
0 1.2
1.2
2.1
2.1
4.2
4.8
7.2
10.2
10
.3
11.7
14
.0
15.8
18
.2
18.2
21
.2
24.1
Dis
char
ge (
seco
nd-f
eet)
Mai
n st
ream 31
.0
46.0
41
.8
65.1
4.
2 0 .1
0 .2
0 .5
0 .1
.6
5.7
5.7
5.3
3.8
3.8
8.6
8.8
8.4
9.4
12.9
14.0
8.
2 5.
4 4.
6
Tri
bu
tary 1.
8
1.2
1.5 .5 .4 .2 .5 .4 .1
Div
er
sion 0.
5
Gai
n or
lo
ss in
se
ctio
n
+13.
2 -4
.2
+20.
6 -6
0.9
-4.2
1
+.2
-.
2
+.5
-.
5
+.1
+
.5
+5
.1
-.5
-.4
-1.0
+3
.6
+.3
+.6
+
3.5
+1
.0
-2.8
-.
8
Tot
al
gain
or
loss
+13
.2
+9
.0
+29
.6
-31.3
-3
5.5
1+
'l
£4 o' +.5
+
5.6
+5.1
+
4.7
+3
.7
+7
.3
+7.6
+
7.2
+7
.8
+11
.3
+12
.3
-2.8
-3
.6
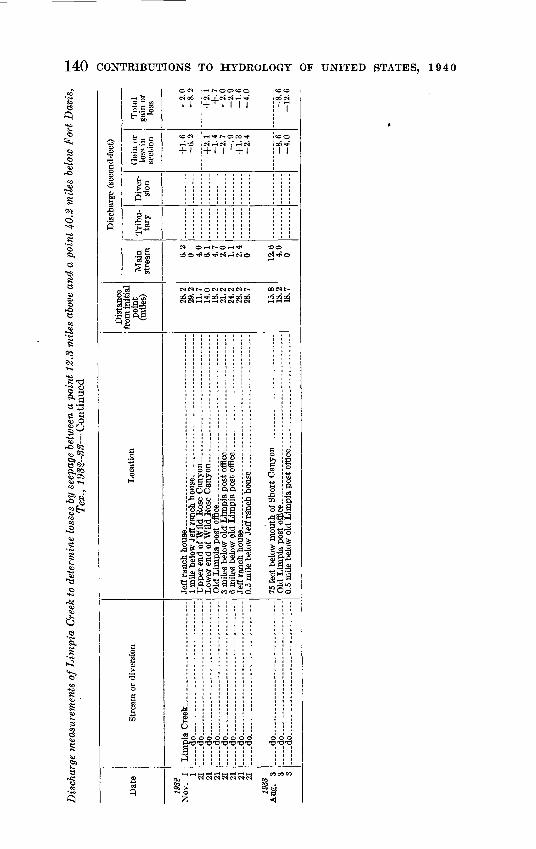
140 CONTRIBUTIONS TO HYDROLOGY OF UNITED STATES, 1940
Oo
IS
fis
CON
rtcd + 1
!- ++ l 1 1 1
i-H * t~ OS CO -
t- I t- +1 1 '+1
CO O 00-*
1 1
S2S
QrO -O -O -O -O -O 73 -O
g to"
I l£la .a>._, s
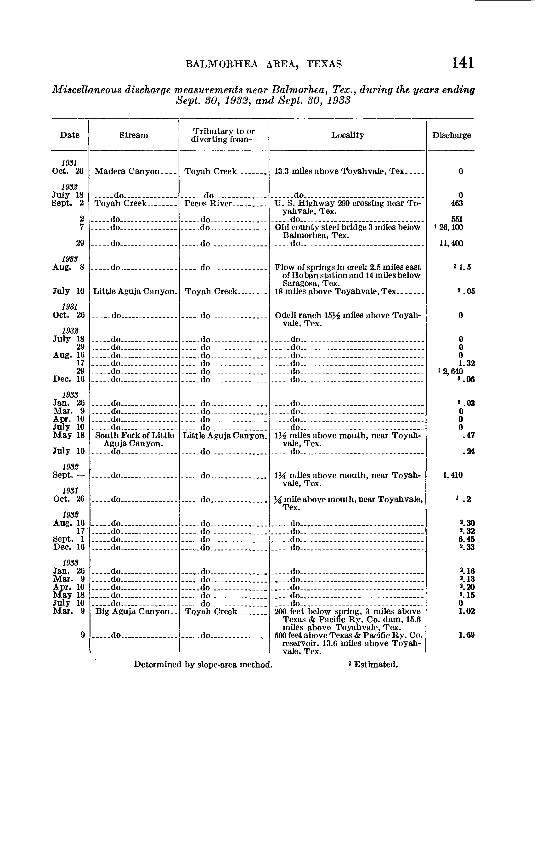
BALMORHEA AREA, TEXAS 141
Miscellaneous discharge measurements near Balmorhea, Tex., during the years ending Sept. 30, 1932, and Sept. 30, 1933
Date
1931 Oct. 26
1932 July 18Sept. 2
27
29
1938 Aug. 8
July 10
1981 Oct. 26
1932July 18
29Aug. 16
1729
Dec. 16
1933 Jan. 26Mar. 9Apr. 10July 10May 18
July 10IQtt®liJOZ
Sept.
miOct. 26
1932 Aug. 16
17Sept. 1Dec. 16
1933 Jan. 26Mar. 9Apr. 10May ISJuly 10Mar. 9
9
Stream
do -Toyah Creek _ ._--
. -do..... ........ ..- . do... ... .... .....
-....do........ .
..do .
- do. . -
do do do .. do-. ..... ... . do . ... -do... ... ..... .
-do ..do ..... ... .... -do ...... ... - do South Pork of Little
Aguja Canyon. ... -do .... ...
. .do .... ... ...
..do ..... .... ..
..do ... ... .... ..do ............ do... ..... ....... ..do . ... ....
... -do ... ..... ..do. ........ do... do - do Big Aguja Canyon. -
.. do.. ..........
Tributary to or diverting from
do. .
. do ... . ..... - do ............
-do .
-do ... ....
do ....
do do . -- do . do do - -do _ -
.. do ... -do - ..... .do . .... -- do.. - .Little Aguja Canyon.
do .....
-do . .... ....
.do. ..........
---do ....... ...- do -- do -do -- ... ...
.. do .... ... ... . -do ... ..... ... . .do . ...... -do - do . .Toyah Creek- _ - ...
. do
Locality
do . ..
yah vale, Tex. __ do ________ . .
Balmorhea, Tex. .do
of Hoban station and 14 miles below Saragosa, Tex.
vale, Tex.
do ... .do ..do do.. . -do .... ... -do .
do -do . ..do _ ... do
\y-L miles above mouth, near Toyah- vale, Tex.
. -do . .......
vale, Tex.
Tex.
... -do - do -do -do
do __ do . -do . .. ............ do do 200 feet below spring, 3 mites above
Texas & Pacific Ry. Co. dam, 15.6 miles above Toyahvale, Tex.
500 feet above Texas & Pacific Ry. Co.reservoir, 13.6 miles above Toyah vale. Tex.
Discharge
0
0463
551126,100
11,400
21.5
».05
0
0001.32
12,640».oe
».03000.47
.24
1,410
2 .2
2.30>.326.45».33
».16».13».20».1501.02
1.69
Determined by slope-area method. 2 Estimated.
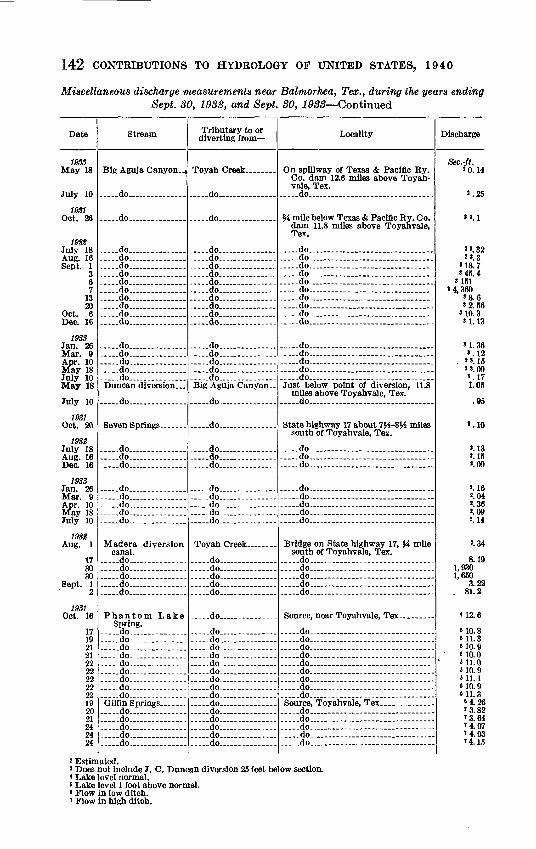
142 CONTRIBUTIONS TO HYDROLOGY OF UNITED STATES, 1940
Miscellaneous discharge measurements near Balmorhea, Tex., during the years ending Sept. SO, 1982, and Sept. 80, 1988 Continued
Date
193S May 18
July 10
19S1 Oct. 26
1938 July 18Aug. 16
67
1320
Oct. 6
193S
Mar. 9Apr. 10May 18July 10May 18
July 10
1931 Oct. 20
1938 July 18Aug. 16T)a/» 1ft
1933 Jan. 26Mar. 9Apr. 10May 18July 10
1938 Aug. 1
17<tn30
2
1931 Oct. 16
1719212122222299
22192021242494
Stream
do
..do........ .......
.....do............... .do... .. ..... do........ ............do....................do............... do .....do............... -do .... .do .do...............
..do....................do... .... .... . do ...... do .... .do........ .......Dancan diversion ...
-do. .......
do. - ...-...do............... ..do...............
.....do..............- .do..... .......- .do .............-..do............... ..do...............
canal. .. do...... ......... do....... ... ..do... .................do ................do...............
Spring.
-.._do ............ .do .......... ..do .................do ........... .do......... ...... .do ..............do... . .-...do-. .........
.do......... ......-...do ....... .... do... .do ...........
Tributary to or diverting from
Toyah Creek
..... do...... ... ..
.... .do.... ......... ..
.do .... ..... ........do ............ do .... .... .do..... .......... do ... .... . . .do.... ..... .... -... ..do.... ..... ... ........ do......... .......... .do. ... ....... .do.
... ..do
..... do. . - do.. ..... do... ..... ... ..... do.. ... Big Aguja Canyon..
.do -
- do ..... .. ...
do.. .... - do.... ..... ..... ..... .do ... ...... .
- .do ..... -do..... .... ...... - do ..... .do . ...... . .... -do
.do.. ..... .do ..... . .do... ... do.. - - do......... ...
..... do.....-
.do ... . do.... ..... do do - do..... ... ....-..-do ... ... .... . do do......... ..... . do..... do. .... ...... do .. do.. - do do. ...... ... do..
Locality
On spillway of Texas & Pacific Ry.Co. dam 12.6 miles above Toyah- vale, Tex.
__ do __ . _____________ .
H mile below Texas & Pacific Ry. Co.dam 11.8 miles above Toyahvale, Tex.
..... do . do .. ..... do.... . . -.....do.. .... .......... . .do ..... do... . ................. do ... .... .... ..... .... ... . do . do .... . do .... ........... ...
do. .......... ....... ............do ... ............ do .......... .......... .... do ... ..... ......... ...... - do.... .. ........Just below point of diversion, 11.8
miles above Toyahvale, Tex. _ ..do. ______ . _ .... __ .....
south of Toyahvale, Tex.
do .do . ..... ...... do ....
... -do ..... ..... ........ ... .....
.....do ...... ..... . ........ ..
.... .do ....... do..... ........ ........ .... do.... . ....... .........
Bridge on State highway 17, H milesouth of Toyahvale, Tex.
.....do . .... _ .. -do .... ....... ... ............. .do ..... .......... .............. do. .... ... . do ... .... ..... ..
.... .do do do do -- do - do . . do . . do do .
do. ....... .... .do do .....do.. .......... ... .....
Discharge
Sec.-ft. JO. 14
J.25
«». 1
«3.32J».3
818.7»45.4
»151M.360
»8.6»2.56
M0.3M.13
»1.36».12
, ".15J».09'.171.05
.95
».10
».13*. 15J.09
J.16s.04J.36».09J.14
'.34
8.191,9301,650
3.22. 81.2
U2.6
MO. 8sil.3«10.9' 10. 0 11.0«10.9 11.1MO. 9 11. 3 4.26'3.82'3.64M.07M.03M.15
J Estimated.> Does not include J. C. Duncan diversion 25 feet below section.* Lake level normal.5 Lake level 1 foot above normal.6 Flow in low ditch. ' Flow in high ditch.
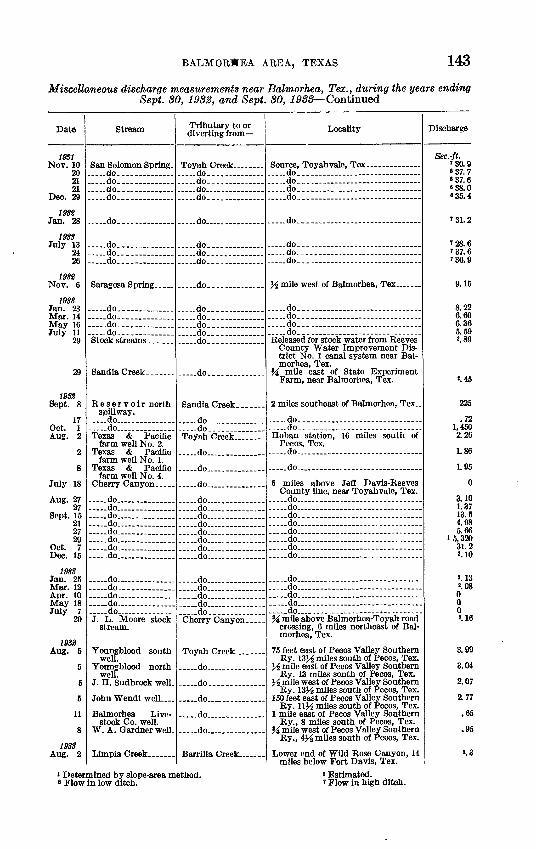
BALMORKEA AREA, TE'XAS 143
Miscellaneous discharge measurements near Balmorhea, Tex., during the years ending Sept. SO, 1982, and Sept. 80, 1988 Continued
Date
19S1 Nov. 10
202121
Dec. 29
19S2 Jan. 28
19S3 July 13
2426
1932 Nov. 6
1933 Jan. 23Mar. 14
July 1129
29
1932 Sept. 8
17Oct. 1Aug. 2
2
8
July 18
Aug. 2727
Sept. 15212729
Oct. 7Dec. 15
1933 Jan. 25Mar. 12Apr. 10May 18July 7
29
19S2 Aug. 5
5
6
6
11
8
19SS
Stream
... ..do -do. .. do
... ..do.... .... ...
.... .do. ............. ..do. ...... . do..
. .do.............. .do...................do.. ............- do..... ......Stock streams ._-_._
Sandia Creek.. .....
Reservoir northspillway.
. .do .. ___ ... do......... ......Texas & Pacific
farm well No. 2.
farm well No. 1.
farm well No. 4. Cherry Canyon.....
do do.. . .. do.... ........... ..do.. .......... .do ........... do.... ........ .......do ...........- do... .........
.do ........ ....... .do .... .. ..... do .... ...... -do .do..... ... .... ...J. L. Moore stock
stream.
Youngblood southwell.
Youngblood northwell.
J. H. Sudbrock well.
John Wendt well ....
Balmorhea Livestock Co. well.
W. A. Gardner well.
Tributary to or diverting from
do....... ... .... .do....... ... .... . ..do.
. do.... . ...
... ..do.... .... ...... .do...... _... ..do....... ..... ..
.do.... .......
do -do......... .....
do do....... ....... do....... .......
do... ...........
Sandia Creek. ... ...
do....... .... ... do......... .....Toyah Creek........
..... do...... ... .
. .do ....... ...
do
.... .do..... ... .do .do........ .... ... .do...... ........ . do. ... ..do ....... ...... ..do... ..do......... ... ...
..do..... .dodo
.do .... ....... .do....... .... ...Cherry Canyon. ....
... ..do ... ......
..... do.......... ....
_ do
do
do..... ... ... ....
Locality
do . . . _ __ .-
__ do... __ . ___ ... . do...
..do...
_do._. -do-.... ... ... __ do-__. _____ ---. ..
J^ mile west of Balmorhea, Tex _ ....
do... ... ..do..... .... ... -do do... Released for stock water from Reeves
County Water Improvement Dis trict No. 1 canal system near Bal morhea, Tex.
H mile east of State ExperimentFarm, near Balmorhea, Tex.
2 miles southeast of Balmorhea, Tex..
do... do Hoban station, 16 miles south of
Pecos, Tex. .... .do.... ...
. do....
5 miles above Jeff Davis-ReevesCounty line, near Toyahvale, Tex.
.. _ do ... _ ....... _ .. ... do do..... ... . do ... ..... ... .... ..... do . do do .do....
_do_ ... -do do........ .... do.... ... .... _do ~~ % mile above Balmorbea-Toyah road
crossing, 6 miles northeast of Bal morhea, Tex.
75 feet east of Pecos Valley SouthernRy. 13H miles south of Pecos, Tex.
H mile east of Pecos Valley SouthernRy. 13 miles sonth of Pecos, Tex.
H mile west of Pecos Valley Southern Ry. 13H miles south of Pecos, Tex.
150 feet east of Pecos Valley SouthernRy. llH miles south of Pecos, Tex.
1 mile east of Pecos Valley SouthernRy., 8 miles south of Pecos, Tex.
% mile west of Pecos Valley SouthernRy., 4J^ miles south of Pecos, Tex.
Lower end of Wild Rose Canyon, 14miles below Fort Davis, Tex.
Discharge
Sec.-ft. ?30.9 37.7«37.6«38.0 35.4
'31.2
'28.6'37.6'36.9
9.15
8.226.696.365.59a. 89
'.45
225
.721,4502.26
1.86
1.95
0
3.101.3713.54.985.66
15,32031.2>.10
«. 13».08000a. 16
3.99
3.04
2.07
2.77
.65
.95
*.3
i Determined by slope-area method. Flow in low ditch.
2 Estimated.' Flow in high ditch.
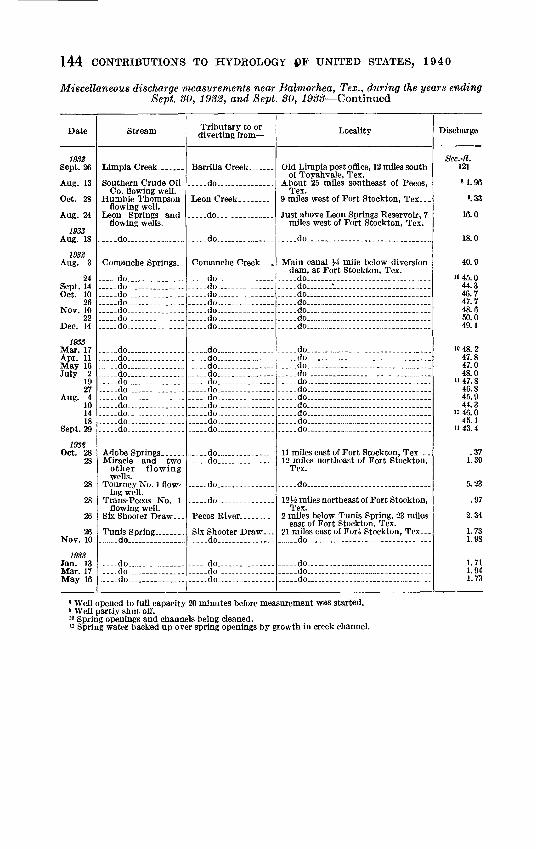
144 CONTRIBUTIONS TO HYDROLOGY (pF UNITED STATES, 1940
Miscellaneous discharge measurements near Balmorhea, Tex., during the years ending Sept. 30, 1932, and Sept. SO, 1933 Continued
Date
1932
Aug. 13
Oct. 28
Aug. 24
1933 Aug. 18
1938 Aug. 3
24Sept. 14Oct. 10
26Nov. 10
22
1933 Mar. 17Apr. 11
July 21927
101418
193$ Oct. 28
28
28
28
26Nov. 10
1933 Jan. 13Mar. 17May 16
Stream
Co. flowing well. Humble Thompson
flowing well.
flowing wells,
do... ............
Comanche Springs..
do_ ............do__....... ...........do ...... .. .........do .................do.................. __do_. ........... .... do
.....do.... .. ....... ..do.. . ............do...... . ...... -- do... ...__- .....do..... ... ... ....... . .do_. ........... _..-..do ......... ..... .do..... ..... .......... do ....... . . do ... ..do ... .
other flowing wells.
Tourney No. 1 flowing well.
flowing well.
.... . do ....... .... - do ... ....... ....--do ...... ... ...
Tributary to or diverting from
Barrilla Creek.... ...
do..... .......
Leon Creek, .. .....
do... ...........
do..... ..........
Comanche Creek....
... ..do... ........ .... do... - do........ ...... ...... do.... ...... do......... ........ do......... .....--do.... ...... .....
.do ... ... do... ...... .do .- ...... do .... -do... ... . ._ -do .... .... ....--.do ..- . -do ...... . .do .... ... do..... ....... ... do
... ..do.... ...... ... .. do ...... ...
.... .do ...
do ...
Six Shooter Draw... do
do....... ... ....._. do ....... . do .....
Locality
Old Limpia post office, 12 miles southof Toyahvale, Tex.
Tex. 9 miles west of Fort Stockton, Tex_ . .
Just above Leon Springs Reservoir, 7miles west of Fort Stockton, Tex.
_. do.. ...... ...................
Main canal }4 mile below diversion dam, at Fort Stockton, Tex.
..do.... . ...... .do... . _. _ do... ... ... .do .do . .... ...... .... ...... .do . .. . .......... ..do - -
.do. .. . . . ...... .do.... . ... ...- do --- . ...... do..... ... .. .do-, .... . ........... do _. do .. _ -..... do... ...... . . . do .. ..... ... . ... ... . do... .... _... . .do.... - ... .... ...... .... ...
11 miles east of Fort Stockton, Tex_ . .12 miles northeast of Fort Stockton,
Tex.
-do... .- -
12J-2 miles northeast of Fort Stockton,Tex.
2 miles below Tunis Spring, 23 mileseast of Fort Stockton, Tex.
21 miles east of Fort Stockton, Tex ... do ......
... ..do...... . ....
do
Discharge
Sec.-ft. 121
U.96
».33
16.0
18.0
40.9
" 45. 044.346.747.748.650.049.1
1° 48. 247.847.048.0
» 47. 846.845.941.3
" 46. 045.1
11 43. 4
.371.39
5.23
.97
2.34
1.731.98
1.711.941.73
8 Well opened to full capacity 20 minutes before measurement was started.»Well partly shut off.10 Spring openings and channels being cleaned." Spring water backed up over spring openings by growth in creek channel.

INDEX
PageAbstract. ___....__________.. 83-84 Acknowledgments for aid___...._._..._. 85
Backus, E. W., well of..._________... 107 Balmorhea, precipitation at..._--.-.._.__ 87,89
springs near.. ._-____.____ 86,pl.ll Balmorhea Livestock Co., well of..._____ 107 Barilla M ountains, features of__... _____ 86 Big Aguja Canyon, discharge of and seepage
losses from....______ 117-118,126,141-142
Cherry Canyon, discharge of and seepage lossesfrom.. -.-..__._.___..._._. 117,138,143
Climate of the .am..._.____________..__ 87-89Cole, J. P., wellof 107,111Comanche series, character of__________ 90 Cretaceous rocks, character and distribution
of.....___.__.._.__.......__._.____ 90-93water-bearing properties of..__._. 112-113,119
Davis Mountains, features of.__.._______... 86Discharge measurements..._____........ 87,
98-100,102-103,114-119,121-144 Downs, J. H., well of.___.._________ 107 Drainage of the area_________.__.__ 86
East Sandia Spring, analyses of water from_ 104 discharge of _..-_.----_______-__.. 118-119,138effect of wells on flow of.____.____. 120-121relation of, to ground-water level... 102,103,104 source of_______________.__ 86-87,102,120temperature of __--.._ ____________ 103
Field work____________._____.____. 85Fort Davis, precipitation at_._--_._.----_____ 87,88Fort Stockton, precipitation at__------_._ 87,88Foster, M. D., analyses by___.________ 101
Garcia, S., well of......._.-___.._________.__. 107Geology of the area...______________..____ 90-94G iffln Springs, analyses of water from. _ _ _ _ _ 100
discharge of .... 99,118-119,121,129-130,142effect of wells onflow of....___._...____ 120relation of structure to...._____._... 119-120source of_.________.....____ 86,98,119temperature of.__ ..__...__._____ 100
Gould, Mrs. W. E., well of.___ ............ 107,111Gould, W. E., wells of. ..__________________ 107Ground water, discharge of__. _.87,98-100,102-103,
118-119, 121.127-132,136-137,138,142-143,144 intake of.... 112-118,123-126,133-135,137,138-140level of................................. 108-111
relation of springs to......_____. 102,103,104relation of structure to occurrence of..__. 94-97,
119-120, pi. 11
PageHill, , well of. - 107,109 Humble Oil & Refining Co., well of. ... 107,108
Irrigation in the area..-_- --.- .. . . 84
Jones, H. A., wells of._. 107
Knapp, W. A., well of.-.. 107,109
Limpia Creek, discharge of and seepage lossesfrom.... ..... 114-116,139-140,143-144
Little Aguja Canyon, discharge of and seepagelosses from. . 118,125,141
Location of the area...__--_-. -... .. 86Lohr, E. W., analyses by.._ 104,106
Madera Canyon, discharge of and seepagelosses from.. 116-117,122-123,141
Meier, J. F., well of.. . ...... 107Mills, A. H., wellof 107
Odell.T. A., well of ----- - 107
Pecos Valley Sou them Railway, well of_..._ 107,110Permian rocks, water-bearing properties of 119Phantom Lake Spring, analyses of water from. 100
discharge of - 99-100,118-119,127-128,142effect of wells on flow of.----------------- 120relation of structure to.----------- -_. 95,119sourceof- -- 86,98,119temperature of_. --------- - 100
Pleistocene deposits, occurrence of. -.. 94 Precipitation in the area ..-. - -- 87-89 Purpose of the investigation... ----- - 84-85
Recent deposits, occurrence of .... _-_- 94Reeves County Water Improvement District
No. 1, canals of, discharge of and seepage losses from......-- - 133-135
reservoir of__-.-- -------- ------.- 84well of -- -- 1°7
Renz, G. F., wells of.-. --------------------- 107Renz, Mrs. Paul, well of...---------- ---- 107Rosenbaum Co., wells ot.-------- - 107
San Solomon Spring, analyses of water from... 101 discharge of.. 98-100,118-119,121,130-132,143 effect of wells on flow of. _._- . 120 relation of structure to _.---.. __ 119-120 source of .-_--------- ---------- 86,98,119temperature of--_-__ - 100
Saragosa School, well of ------------ -- 107Saragosa Spring, analyses of water from.... _. 104
discharge of. -- --- 102-103,119,121,143 effect of wells on flow of. - - 120-121
145
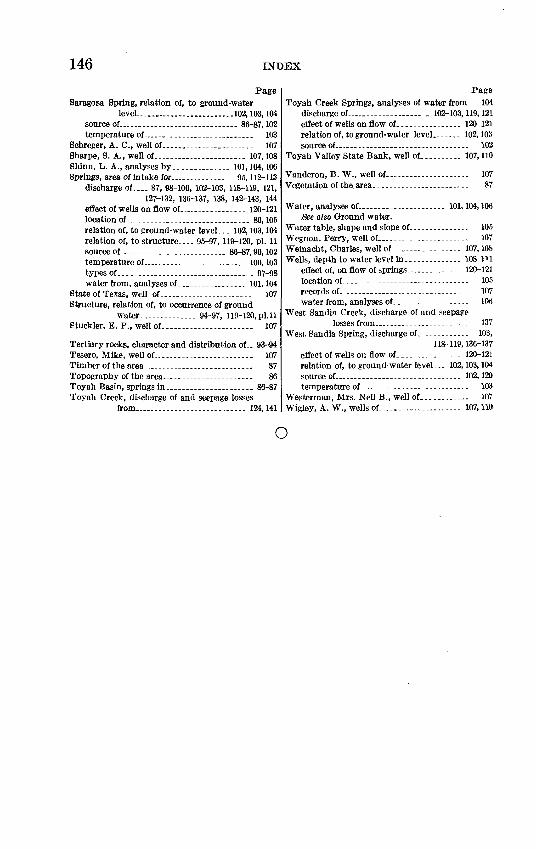
146 INDEX
Page Saragosa Spring, relation of, to ground-water
level-._.__..______102,103,104source of_______ _____.__ 86-87,102temperature of-___.__-_-_.___. 103
Schreger, A. C., well of..._..____.... 107Sharpe, S. A., well of......__............. 107,108Shinn, L. A., analyses by....__.__. 101, J04,106Springs, area of intake for..___..__ ._ 95,112-113
discharge of.... 87, 98-100, 102-103, 118-119, 121,127-132, 136-137, 138, 142-143, 144
effect of wells on flow of................. 120-121locationof_.___.......___.__.... 86,105relation of, to ground-water level... 102,103,104 relation of, to structure.... 95-97, 119-120, pi. 11source of_.....---_._.-.._.___._____ 86-87,90,102temperature of._.._.........___ 100,103types of...._.......____..._____ 97-98water from, analyses of.___.......... 101,104
State of Texas, well of...................__.. 107Structure, relation of, to occurrence of ground
water-.--...-..... 94-97, 119-120,pl.llStuckler, E. P., well of....................... 107
Tertiary rocks, character and distribution of.. 93-94 Tesero, Mike, well of................._-...... 107Timber of the area__._.__.-..._____ 87 Topography of the area.____. _.____ 86 Toyah Basin, springs in._.__...____ 86-87 Toyah Creek, discharge of and seepage losses
from...._._._--.__......-....... 124,141
PageToyah Creek Springs, analyses of water from 104
discharge of_........ ......... 102-103,119,121effect of wells on flow of................ 120-121relation of, to ground-water level...._ 102,103source of.__._.__.--..._...._ 102
Toyah Valley State Bank, well of.......... 107,110
Vanderon, B. W., well of-.....-....... .. 107Vegetation of the.area.. __._._. _.. .. 87
Water, analyses of_.____..-...---_.-... 101,104,106See also Ground water.
Water table, shape and slope of..,.......-.--. 105Wegnon, Perry, well of_._-- . ._-..-..... 107Weinacht, Charles, well of___.---._..._... 107,108 WeUs, depth to water level in._...._.__.... 108-111
effect of, on flow of springs-.....-.-..-. 120-121location of____... ----- ---------- 105records of. . .___.---___--.-.__----.-.-- 107water from, analyses of...___.__ __.. -. lOfi
West Sandia Creek, discharge of and seepagelosses from --------------------- 137
West Sandia Spring, discharge of___.-.--.. 103,118-119,136-137
effect of wells on flow of_.............. 120-121relation of, to ground-water level... 102,103,104 source of.... .... 102,120temperature of. _.._.----,._-----.....- 10&
Westerman, Mrs. Nell B., well of...._...-- 107Wigley, A. W., wells of_-._ _. .---- 107,110
o
The use of the subjoined mailing label to return
this report will be official business, and no
postage stamps will be required
I UNITED STATES PENALTY FOR PRIVATE use TO AVOID
DEPARTMENT OF THE INTERIOR PAYMENT OF POSTAGE, woo
GEOLOGICAL. SURVEY
OFFICIAL BUSINESS
This label can be used only for returning official publications. The address must not be changed.
GEOLOGICAL SURVEY,